")
Back to Journals » Clinical Ophthalmology » Volume 12
Impact of the anterior-posterior corneal radius ratio on intraocular lens power calculation errors
Authors Hasegawa A, Kojima T , Yamamoto M, Kato Y, Tamaoki A , Ichikawa K
Received 4 January 2018
Accepted for publication 31 May 2018
Published 27 August 2018 Volume 2018:12 Pages 1549—1558
DOI https://doi.org/10.2147/OPTH.S161464
Checked for plagiarism Yes
Review by Single anonymous peer review
Peer reviewer comments 3
Editor who approved publication: Dr Scott Fraser
Asato Hasegawa,1 Takashi Kojima,2 Mana Yamamoto,1 Yukihito Kato,3 Akeno Tamaoki,1,4 Kazuo Ichikawa3
1Department of Ophthalmology, Japan Community Healthcare Organization Chukyo Hospital, Nagoya, Japan; 2Department of Ophthalmology, Keio University School of Medicine, Tokyo, Japan; 3Department of Ophthalmology, Chukyo Eye Clinic, Nagoya, Japan; 4Department of Mathematics and System Development, Shinshu University Interdisciplinary Graduate School of Science and Technology, Nagano, Japan
Purpose: To evaluate the distribution of the anterior–posterior corneal radius ratio (AP ratio; anterior corneal radius/posterior corneal radius) in patients before cataract surgery, and investigate which parameters can affect this ratio. We also investigated the impact of the AP ratio on the intraocular lens (IOL) power calculation error in cataract surgery.
Method: A total of 501 eyes of 501 consecutive patients who had no history of corneal diseases and had undergone cataract surgery were enrolled in this study. The patients’ AP ratio was measured before surgery using anterior segment optical coherence tomography; using these data, we evaluated the correlation between the AP ratio and various parameters that can affect the corneal radius. For subgroup analyses, we investigated the correlation between the AP ratio and IOL power calculation error in 181 eyes of 181 patients. Stepwise multiple regression analysis was performed with the IOL power calculation errors of the SRK/T, Haigis, Holladay 1, and Hoffer Q formulas as the dependent variables and various parameters that can affect the postoperative IOL power calculation error as the independent variables.
Results: The mean AP ratio was 1.19±0.02, and it weakly correlated with corneal thickness, horizontal corneal diameter, and posterior corneal radius. The correlations between the AP ratio and IOL power calculation errors in the 4 calculation formulas were not statistically significant. Stepwise multiple regression analysis could not detect any significant parameters affecting this ratio.
Conclusion: The AP ratio has no major influence on IOL power calculation error in patients with any history of corneal disease.
Keywords: cataract surgery, anterior-posterior corneal radius ratio, intraocular lens power calculation
Introduction
Since the advent of premium intraocular lenses (IOLs) – such as the toric and multifocal IOLs – and femtosecond laser-assisted cataract surgery, accurate biometry has become increasingly important. Measurements of the posterior corneal radius were not considered essential previously, because none of the available examinations could measure the posterior corneal shape and radius and because the refractive power in the posterior cornea is smaller than that in the anterior cornea. Therefore, the total corneal refractive power was estimated on the basis of the anterior corneal radius only, and was generally calculated using a conversion refractive index of 1.3375.
Norrby et al reported that the IOL power calculation error in cataract surgery is caused by measurement errors in axial length, as well as by inaccuracies in the predicted postoperative IOL position and corneal refractive power calculations.1 Specifically, ~8% of the IOL power calculation error is due to inaccuracies in corneal power calculation, and 3.69% is caused by miscalculations of the anterior–posterior corneal radius ratio (AP ratio).
According to the Gullstrand schematic eye model, the anterior corneal radius, posterior corneal radius, and AP ratio (anterior corneal radius/posterior corneal radius) are 7.7, 6.8, and 1.13 mm, respectively. However, previous investigations have found that the AP ratio in the normal population ranges from 1.19 to 1.23 (Table 1),2–7 which implies that the Gullstrand schematic eye model is not accurate in this regard. It follows that the keratometric corneal refractive power differs from the true value, since the conversion refractive index of the cornea is calculated on the basis of the Gullstrand schematic eye model.
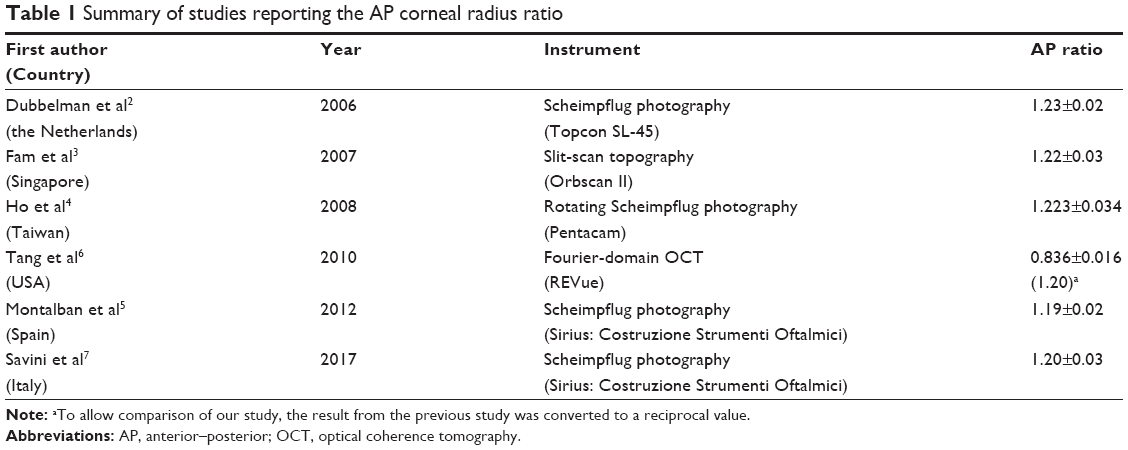 | Table 1 Summary of studies reporting the AP corneal radius ratio |
Recently, several techniques, such as anterior optical coherence tomography (OCT) and Scheimpflug-based tomography, have made it possible to measure the posterior corneal radius. Previous reports have shown that these techniques are highly accurate and repeatable in measuring anterior and posterior corneal radii.8–10 Using these instruments, investigators can measure the total corneal refractive power, which is known as “Real power” in the Casia™ (Tomey, Nagoya, Japan), and “True net power” in the Pentacam™ (Oculus Optikgeräte GmbH, Wetzlar, Germany). These calculations are also performed by means of ray-tracing in some instruments, such as the “Total corneal power” in the Galilei (Ziemer, Allmendstrasse, Switzerland) and “Total corneal power” in the Pentacam™. These values are calculated on the basis of both the anterior and posterior radii of the cornea.
In the current study, we measured the anterior and posterior corneal radii using anterior OCT in patients before cataract surgery; in doing so, we demonstrated the distribution of the AP ratio in the Japanese population with normal cornea. We also evaluated the correlation between the AP ratio and various parameters that can affect the corneal radius.
We hypothesized that, in cases where the keratometric power differs greatly from the total corneal refractive power, the posterior cornea has a greater effect on the total corneal refractive power. The difference between the keratometric and total corneal refractive power may cause errors in corneal refractive power calculation. With these hypotheses in mind, we evaluated the correlation between the AP ratio and the difference between the keratometric and total corneal refractive power. Furthermore, we investigated how the AP ratio was correlated with IOL power calculation errors after cataract surgery in patients without any corneal abnormalities.
Materials and methods
Correlation analyses between the AP ratio and various parameters
We retrospectively reviewed consecutive patients who underwent cataract surgery between January and December 2012 at Japan Community Healthcare Organization Chukyo Hospital. We then selected patients with no history of corneal diseases and ocular surgery other than cataract surgery. Ultimately, 501 eyes of 501 patients were enrolled in this study. Before surgery, the anterior corneal radius, posterior corneal radius, average keratometric power, total corneal refractive power, anterior corneal astigmatism, posterior corneal astigmatism, the total corneal astigmatism calculated from both anterior and posterior corneal radii, and central corneal thickness were measured using anterior OCT (SS-1000 Casia™; Tomey). The parameter “Real corneal power” in the anterior OCT software, which was the sum of the anterior and posterior corneal keratometric powers adjusted for the central corneal thickness, was considered the total corneal refractive power. The corneal horizontal diameter was measured using the Lens Star™ LS900 (HAAG-STREIT, Koeniz, Switzerland). The anterior chamber depth was measured using IOL Master™ (version 5.4, Carl Zeiss Meditec, Jena, Germany). The axial length was measured using IOL Master™ (Carl Zeiss Meditec, Jena, Germany). If the measurement failed, ultrasound A-mode was used. The AP ratio was calculated from the anterior and posterior corneal radii, and the distribution of the AP ratio was investigated in patients before cataract surgery.
We also evaluated the correlation between the AP ratio and age, horizontal corneal diameter, central corneal thickness, anterior corneal radius, posterior corneal radius, anterior corneal astigmatism, posterior corneal astigmatism, total corneal astigmatism, anterior chamber depth, axial length, and the difference between the keratometric and total corneal refractive powers.
Correlation analyses between the AP ratio and IOL power calculation errors in subgroups
To investigate the influence of the AP ratio on IOL power calculation error, subgroup analyses were performed on 181 patients (181 eyes) who met the following conditions: 1) They underwent only cataract surgery; 2) their axial length was measurable with IOL Master™ before cataract surgery; 3) cataract surgery was performed using a 3.0-mm temporal clear corneal incision; 4) IOL implantation in the capsule was completed, and no complications occurred either during or after the surgery; 5) one of the following IOLs was implanted: AN6K, AU6K, or PN6 (KOWA, Nagoya, Japan), which are basically the same model, but differ with respect to the presence of coloration and a preset-type; 6) they finished the examination 3 months after the surgery; 7) their postoperative best spectacle-corrected visual acuity was over 20/28.
IOL power calculation error was defined as the difference between the manifest spherical equivalent 3 months after surgery and the predicted refractive power. The SRK/T, Haigis, Holladay 1, and Hoffer Q formulas were used to calculate the IOL power. The constants of the SRK/T and Haigis formulas were optimized to yield a zero mean prediction error in refraction prediction. In the SRK/T formula, we optimized the A-constant with 3 AL-based groups: AL <22 mm (N=79), 22 mm ≦ AL <26 mm (N=531), and 26 mm ≦ AL (N=73). The final optimized A-constant was 118.9 for AL <22 mm, 119.1 for 22 mm ≦ AL <26 mm, and 119.3 for 26 mm ≦ AL. In the Haigis formula, we optimized the constants from patients with AL <22 mm (N=33), 22 mm ≦ AL <26 mm (N=486), and 26 mm ≦ AL (N=120), and the final optimized constants were a0=−0.275, a1=0.243, and a2=0.200. We used the constants of the User Group for Laser Interference Biometry in the Holladay 1 and Hoffer Q formula.
Statistical analyses
Correlation was analyzed using the Spearman’s rank correlation coefficient (rs). A P-value of <0.05 was considered statistically significant. Stepwise multiple regression analysis was also performed with the IOL power calculation error as the dependent variable, and age, gender, AP ratio, horizontal corneal diameter, anterior chamber depth, axial length, central corneal thickness, corneal astigmatism, and anterior/posterior corneal diameter as the independent variables.
The protocol of this study was approved by the Institutional Review Broad of Japan Community Health Care Organization Chukyo Hospital, and the study procedures conformed to the ethical principles for research involving human subjects as outlined in the Declaration of Helsinki. Requirement of individual informed consent was waived by the ethics committee because this study was retrospectively conducted and only used anonymous clinical data.
Results
Correlations between the AP ratio and various parameters
The study included 215 eyes of 215 men, and 286 eyes of 286 women. The mean age of the patients was 72.0±11.5 years (range: 17–98 years). The mean AP ratio was 1.19±0.02 (range: 1.11–1.26) (Table 2). Figure 1 shows the distribution of the AP ratio.
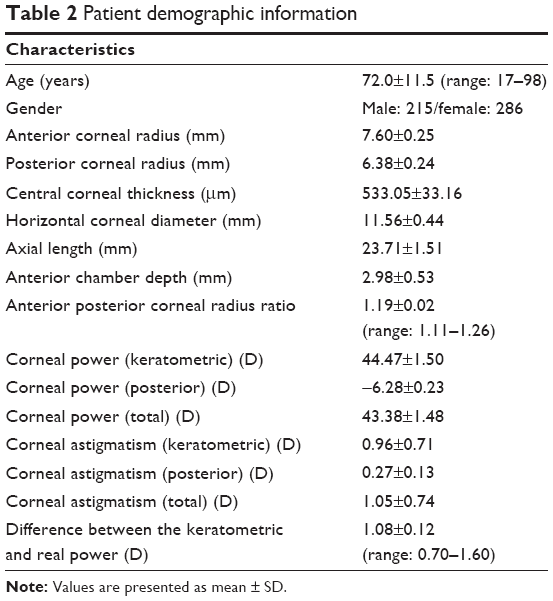 | Table 2 Patient demographic information |
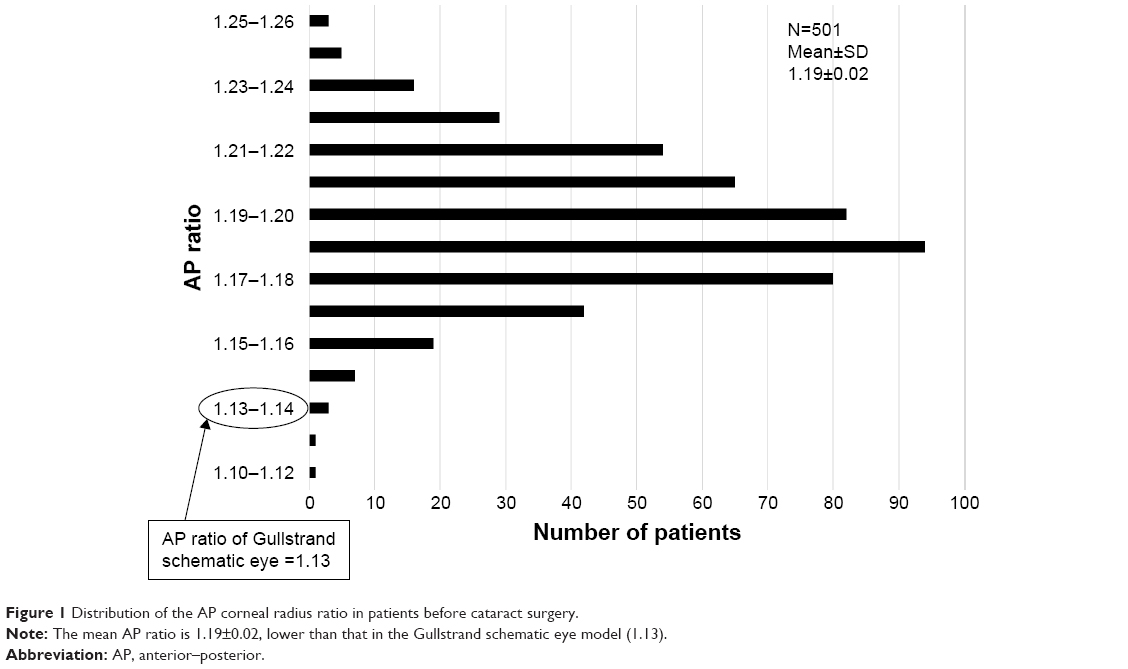 | Figure 1 Distribution of the AP corneal radius ratio in patients before cataract surgery. |
Figure 2 shows the correlation between the AP ratio and corneal thickness (2A), anterior corneal radius (2B), posterior corneal radius (2C), age (2D), horizontal corneal diameter (2E), axial length (2F), anterior chamber depth (2G), anterior corneal astigmatism (2H), posterior corneal astigmatism (2I), and real corneal astigmatism (2J). The AP ratio was significantly correlated with corneal thickness (P<0.0001; rs =0.2233), horizontal corneal diameter (P=0.0094; rs =−0.1161), posterior corneal radius (P<0.0001; rs =−0.465), age (P=0.008; rs =−0.118), and posterior corneal astigmatism (P<0.0001; rs =0.2923), but not with the anterior corneal radius (P=0.1235), axial length (P=0.5615), anterior chamber depth (P=0.7161), anterior corneal astigmatism (P=0.6294), and total corneal astigmatism (P=0.7156).
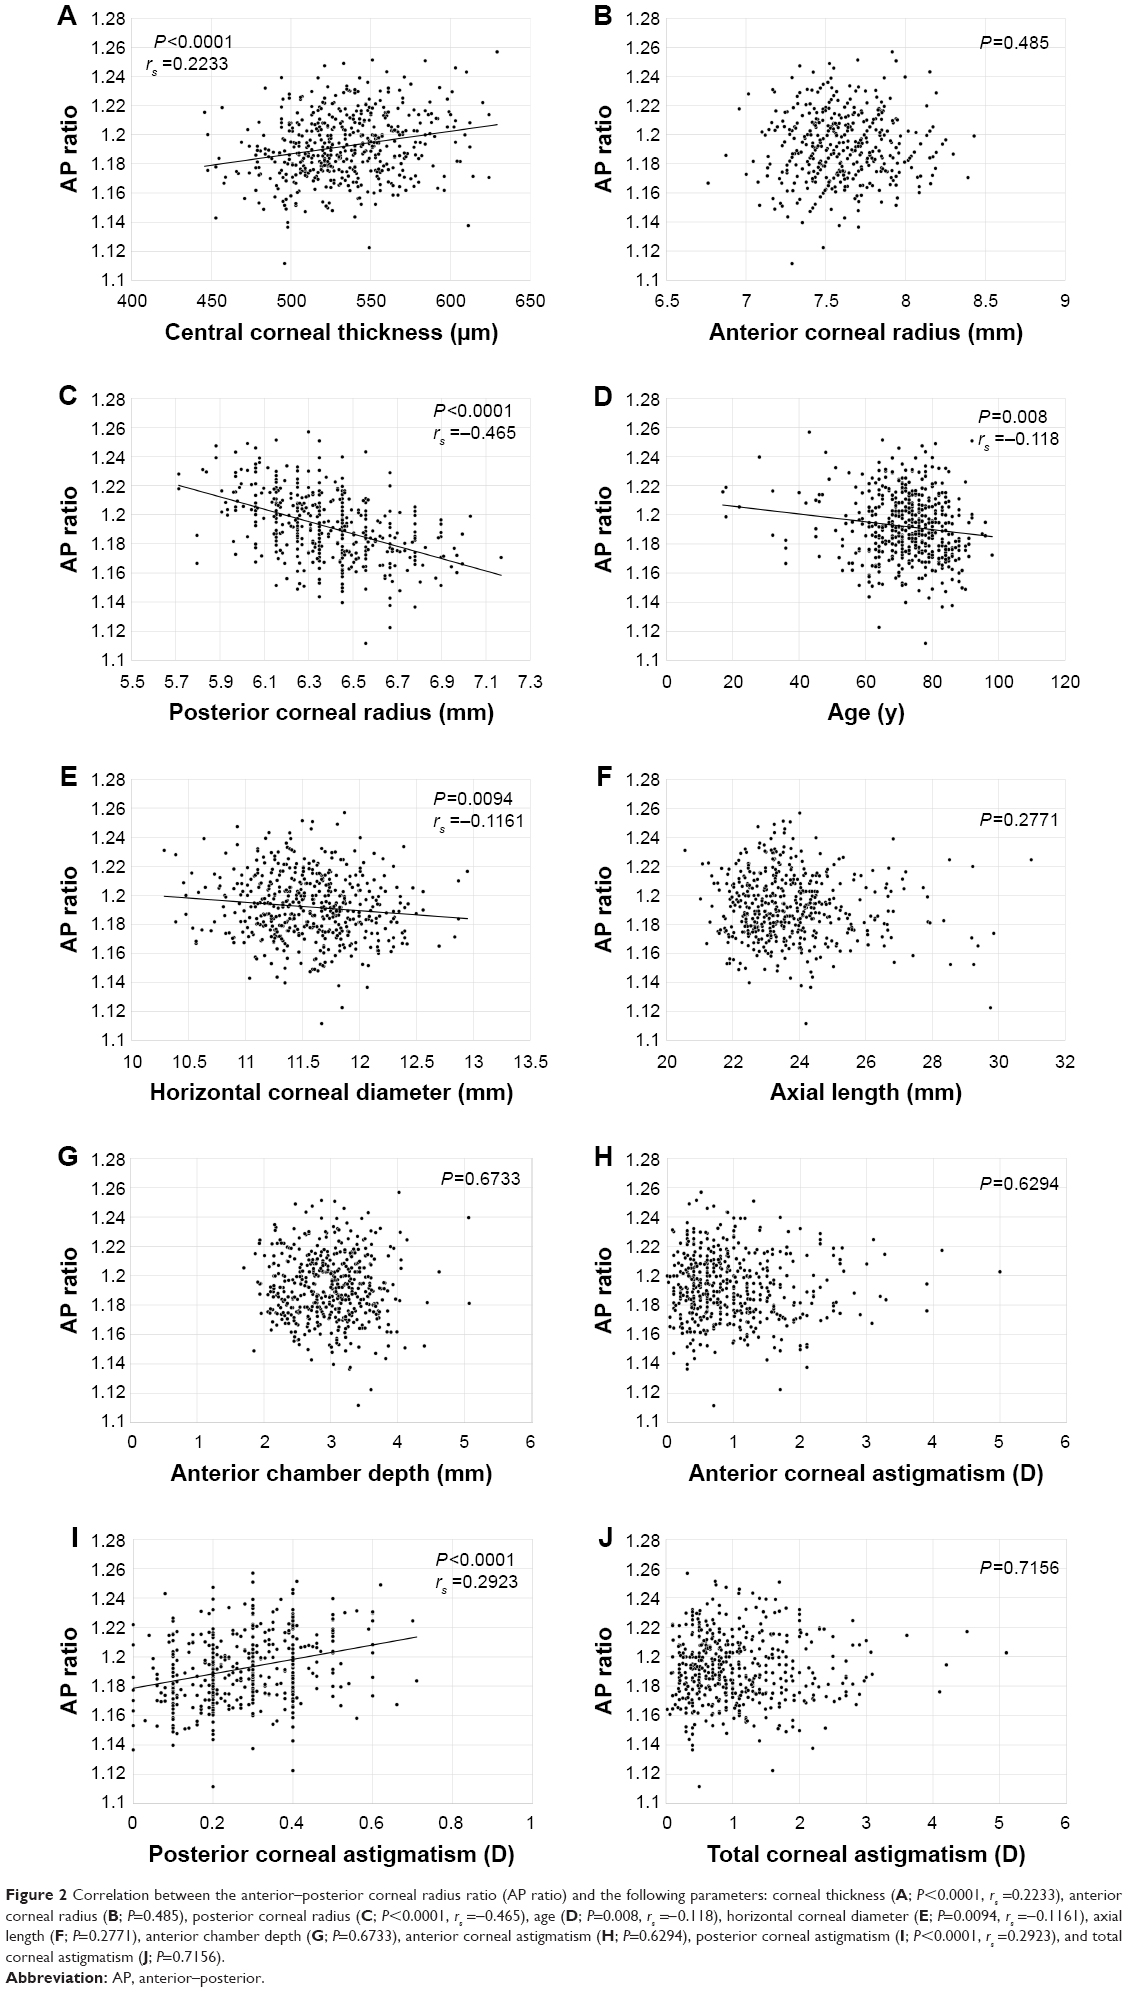 | Figure 2 Correlation between the anterior–posterior corneal radius ratio (AP ratio) and the following parameters: corneal thickness (A; P<0.0001, rs =0.2233), anterior corneal radius (B; P=0.485), posterior corneal radius (C; P<0.0001, rs =−0.465), age (D; P=0.008, rs =−0.118), horizontal corneal diameter (E; P=0.0094, rs =−0.1161), axial length (F; P=0.2771), anterior chamber depth (G; P=0.6733), anterior corneal astigmatism (H; P=0.6294), posterior corneal astigmatism (I; P<0.0001, rs =0.2923), and total corneal astigmatism (J; P=0.7156). |
Figure 3 shows a strong positive correlation between the AP ratio and the difference between the keratometric and total corneal refractive powers (P<0.0001, rs =0.8809).
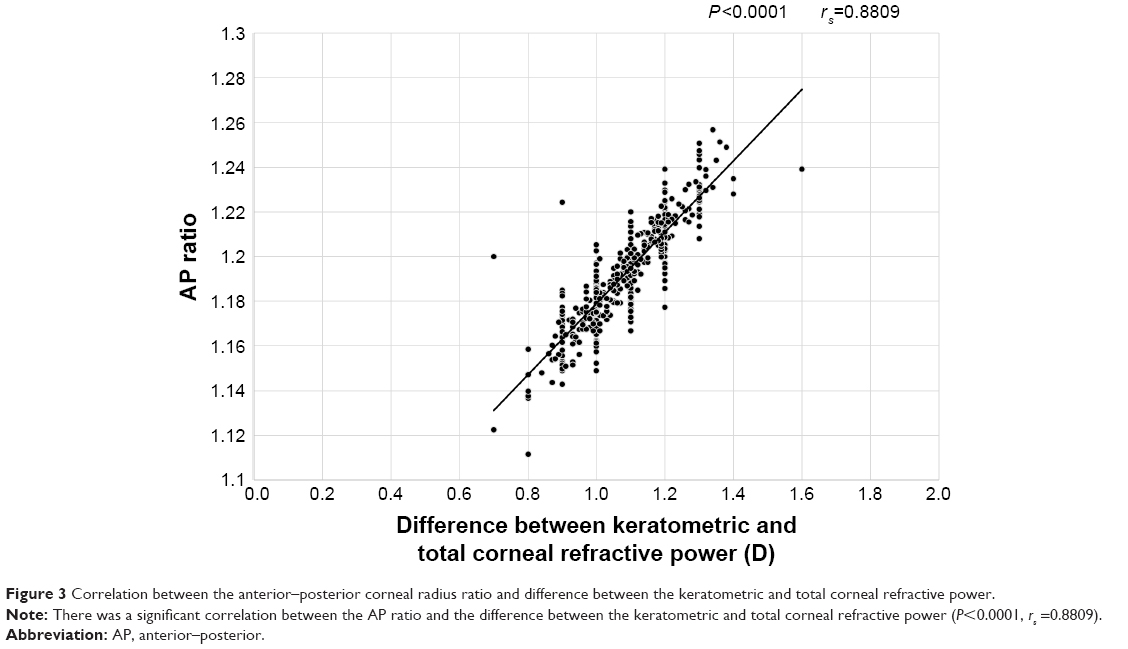 | Figure 3 Correlation between the anterior–posterior corneal radius ratio and difference between the keratometric and total corneal refractive power. |
Correlations between the AP ratio and IOL power calculation error
Sixty-nine eyes of 69 men and 112 eyes of 112 women were enrolled in the subgroup analyses. The mean age was 74.6±8.8 years (range: 43–98 years), and the mean AP ratio was 1.19±0.02 (range: 1.12–1.26) (Table 3). Table 4 shows the results of the IOL power calculations and the correlations between the prediction errors and AP ratios in the 4 formulas. The AP ratio was not significantly correlated with the IOL power calculation error (Figure 4A–D).
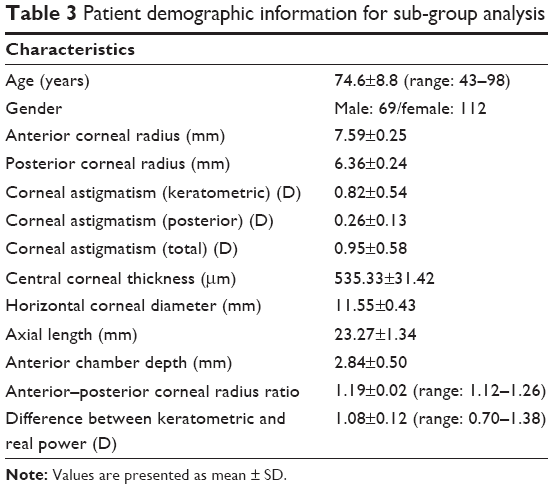 | Table 3 Patient demographic information for sub-group analysis |
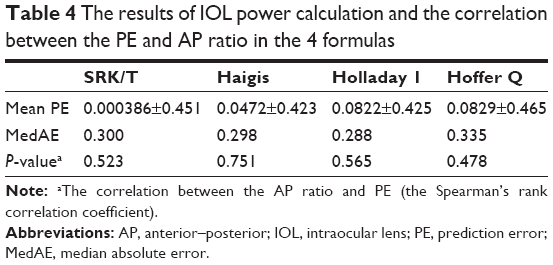 | Table 4 The results of IOL power calculation and the correlation between the PE and AP ratio in the 4 formulas |
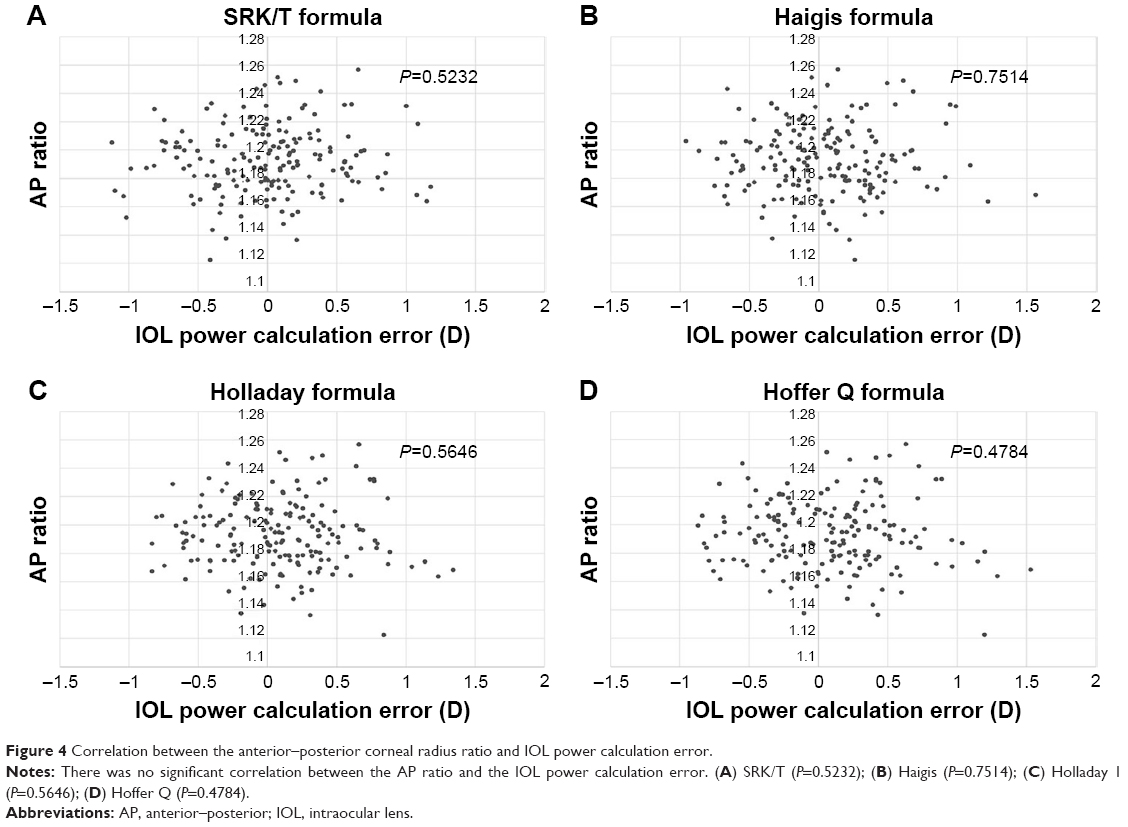 | Figure 4 Correlation between the anterior–posterior corneal radius ratio and IOL power calculation error. |
Stepwise multiple regression analysis was also performed, with IOL power calculation error as the dependent variable, and age, gender, AP ratio, horizontal corneal diameter, central corneal thickness, anterior chamber depth, axial length, corneal astigmatism, and anterior/posterior corneal radius as the independent variables. The AP ratio was not identified as influencing the IOL power calculation error in any of the IOL calculation formulas (Table 5).
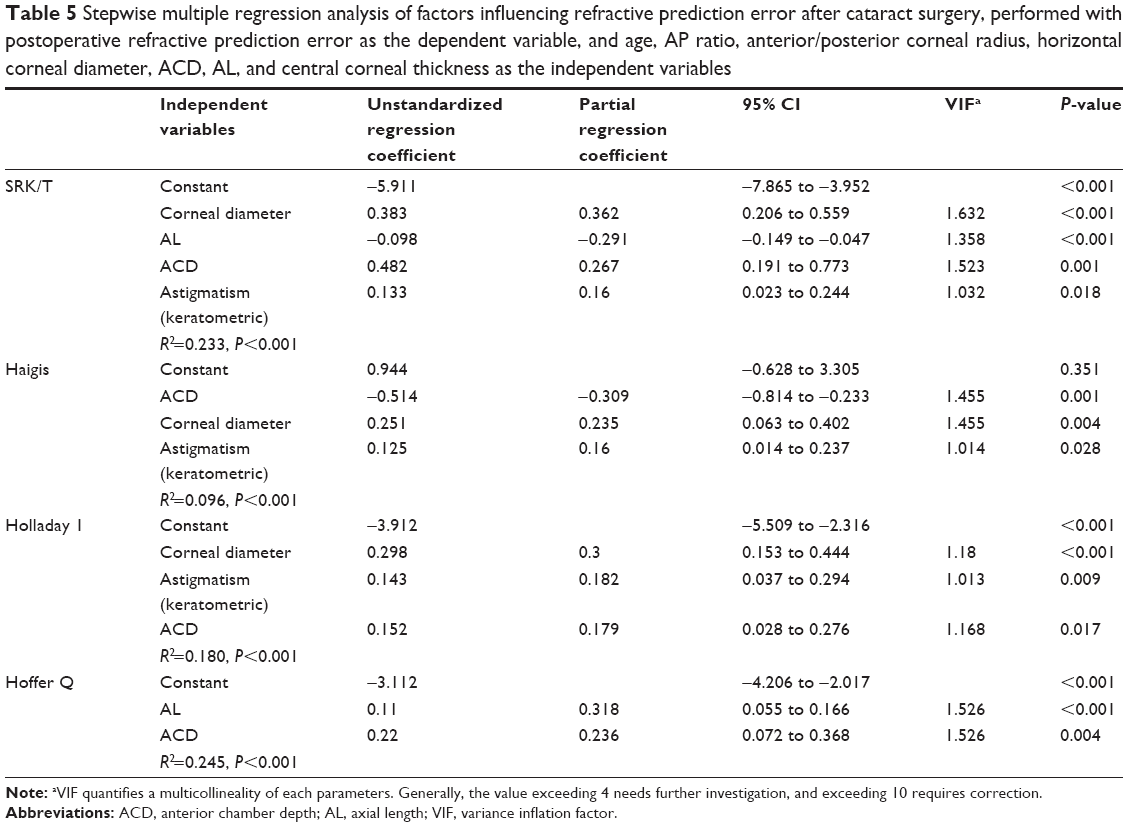 | Table 5 Stepwise multiple regression analysis of factors influencing refractive prediction error after cataract surgery, performed with postoperative refractive prediction error as the dependent variable, and age, AP ratio, anterior/posterior corneal radius, horizontal corneal diameter, ACD, AL, and central corneal thickness as the independent variables |
Discussion
We found that the mean AP ratio in patients before cataract surgery was 1.19±0.02. As shown in Table 1, the AP ratio in previous literature ranged from 1.19 to 1.23,1–7 which shows that the AP ratio in our study was slightly lower than, but similar to these values. Such a small discrepancy may be due to differences in the principles of the devices used for measuring corneal curvatures. We also found that both the current study and previous investigations have reported that the measured AP ratio differs greatly from that of the Gullstrand schematic eye model – 1.13.
On evaluating the correlation between the AP ratio and the anterior corneal radius, posterior corneal radius, corneal astigmatism, central corneal thickness, horizontal corneal diameter, anterior chamber depth, axial length, and age, we found a weak correlation with posterior corneal radius, horizontal corneal diameter, central corneal thickness, age, and posterior corneal astigmatism. Conversely, we found no correlation with anterior corneal radius, anterior chamber depth, axial length, anterior corneal astigmatism, and total corneal astigmatism. Significant correlations with posterior corneal radius, horizontal corneal diameter, and central corneal thickness were consistent with the findings of previous reports.5 Regarding the corneal thickness, we estimated that a 100 μm increase in central corneal thickness or a 2.0-mm decrease in horizontal corneal diameter caused an increase of <0.02 in the AP ratio. Therefore, we posit that the clinical impact of corneal thickness and horizontal corneal diameter on the AP ratio is minimal. To our knowledge, there are no studies reporting a correlation with age and posterior corneal astigmatism. On the basis of the correlation coefficients, these correlations were considered weak and not clinically significant.
We hypothesized that the cases showing a major difference between the keratometric power and the total corneal refractive power showed greater IOL power calculation errors, and in cases with an AP ratio close to the average, the keratometric refractive power differed slightly from the total corneal refractive power. To confirm these hypotheses, we investigated the correlation between the AP ratio and the difference between the keratometric power and total corneal refractive power, and found a strong correlation between the 2 values. However, contrary to our expectations, the difference between the keratometric power and total corneal refractive power did not reach its minimum value when the AP ratio was around the average value. In other words, for a given posterior corneal curvature, a flatter anterior corneal curvature (higher AP ratio) results in a larger difference between the keratometric refractive power and total corneal refractive power, and a steeper anterior corneal curvature (lower AP ratio) results in a smaller difference between the keratometric refractive power and total corneal refractive power. According to the correlation analysis, the minimum AP ratio was 1.11, which is close to the AP ratio in the Gullstrand schematic eye model. Such results may have been caused by a discrepancy between the average AP ratio in our study and the AP ratio in the Gullstrand schematic eye model. The difference between the keratometric power and total corneal refractive power may reach a minimum value when the AP ratio is closest to that of the Gullstrand schematic eye model, because the keratometric value was designed on the basis of the Gullstrand schematic eye model. Furthermore, the AP ratio may greatly affect postoperative error when it has deviated widely from the value in the Gullstrand schematic eye model.
The difference between the keratometric refractive power and total corneal refractive power showed large variation (range: 0.7–1.6 D). Since a high AP ratio showed a larger difference between the keratometric refractive power and total corneal refractive power, we hypothesized that the AP ratio is possibly correlated with IOL power calculation errors, especially in the high AP ratio group. To investigate this hypothesis, we performed a subgroup analysis to assess the relationship between the IOL power calculation error and the AP ratio. However, the AP ratio was not significantly correlated with the IOL power calculation error in any of calculation formulas. Even multiple regression analysis did not reveal any correlation between the IOL power calculation error and various possible influencing parameters, including the AP ratio.
Savini et al reported a statistically significant correlation between the AP ratio and IOL power calculation error with the SRK/T and Holladay 1 formulas.7 This discrepancy from our result may have occurred because of differences in measurement devices, since they used Scheimpflug photography (Sirius; CSO). They reported that the mean difference between the keratometric refractive power and total corneal refractive power was 0.56±0.23 (range: 0.07–1.95), which showed a large discrepancy from our result (1.08±0.12 [range: 0.70–1.6]). Moreover, we optimized the IOL constant in the SRK/T and Haigis formulas into 3 groups according to the axial length. This difference in the IOL constants may have caused the discrepancies.
Previous reports have shown that ~8% of the IOL power calculation error is caused by errors in predicting corneal power, while 3.69% is caused by errors in predicting the AP ratio.1 The discrepancies between this assertion and the findings of the current study may have occurred because we excluded patients with abnormal cornea, including corneal opacity and keratoconus, and enrolled only those who had a normal cornea; in doing so, our objective was to observe the effects of the AP ratio in the normal population.
One limitation of this study is that it included few young subjects, as we limited the subjects to patients with cataract. Further studies are needed to ascertain the AP ratio in young subjects. Another weakness is that several confounding factors may have affected the IOL power calculation error: the pre- and postoperative examinations were performed with several different examiners, and cataract surgery was performed by several surgeons. In addition, the increments of the IOL power (0.5 D) may be a factor affecting the IOL power calculation error.
When the cornea is abnormally shaped, it can affect both the AP ratio and the postoperative error. For example, Tamaoki et al reported cases of posterior keratoconus in which the AP ratio was very high.11 In one case with an AP ratio of 1.45, the same investigators found the IOL power calculation error to be 1.51 D when using the keratometric value to calculate the IOL power. However, when they used total corneal refractive power in a similar manner, the mean IOL power calculation error was 0.1 D. Therefore, in cases of posterior keratoconus, the authors recommended using the total corneal refractive power in IOL power calculations. Another study showed that the mean AP ratio in probable keratoconus, which could not be diagnosed using corneal topography, was 1.3.12 This value deviates widely from that in the normal population. In such cases of an abnormal corneal shape, the AP ratio certainly affects IOL power calculation error.
In conclusion, when we used the optimized IOL constant, the AP ratio did not affect the IOL power calculation error after cataract surgery in patients without any history of corneal diseases. Nonetheless, clinicians should assess the corneal shape carefully before cataract surgery to detect cases with an abnormal AP ratio.
Acknowledgment
The current study was presented as a scientific poster at the Japan Cornea Conference in Okinawa, Japan on January 30, 2014, and Japan Cornea Conference in Wakayama, Japan on February 15, 2013.
Disclosure
The authors report no conflicts of interest in this work.
References
Norrby S. Sources of error in intraocular lens power calculation. J Cataract Refract Surg. 2008;34(3):368–376. | ||
Dubbelman M, Sicam VA, van der Heijde GL. The shape of the anterior and posterior surface of the aging human cornea. Vision Res. 2006;46(6–7):993–1001. | ||
Fam HB, Lim KL. Validity of the keratometric index: large population-based study. J Cataract Refract Surg. 2007;33(4):686–691. | ||
Ho JD, Tsai CY, Tsai RJ, Kuo LL, Tsai IL, Liou SW. Validity of the keratometric index: evaluation by the Pentacam rotating Scheimpflug camera. J Cataract Refract Surg. 2008;34(1):137–145. | ||
Montalbán R, Piñero DP, Javaloy J, Alió JL. Scheimpflug photography-based clinical characterization of the correlation of the corneal shape between the anterior and posterior corneal surfaces in the normal human eye. J Cataract Refract Surg. 2012;38(11):1925–1933. | ||
Tang M, Chen A, Li Y, Huang D. Corneal power measurement with Fourier-domain optical coherence tomography. J Cataract Refract Surg. 2010;36(12):2115–2122. | ||
Savini G, Hoffer KJ, Lomoriello DS, Ducoli P. Simulated Keratometry Versus Total Corneal Power by Ray Tracing: A Comparison in Prediction Accuracy of Intraocular Lens Power. Cornea. 2017;36(11):1368–1372. | ||
Lee YW, Choi CY, Yoon GY. Comparison of dual rotating Scheimpflug-Placido, swept-source optical coherence tomography, and Placido-scanning-slit systems. J Cataract Refract Surg. 2015;41(5):1018–1029. | ||
Szalai E, Berta A, Hassan Z, Módis L. Reliability and repeatability of swept-source Fourier-domain optical coherence tomography and Scheimpflug imaging in keratoconus. J Cataract Refract Surg. 2012;38(3):485–494. | ||
Prospero Ponce CM, Rocha KM, Smith SD, Krueger RR. Central and peripheral corneal thickness measured with optical coherence tomography, Scheimpflug imaging, and ultrasound pachymetry in normal, keratoconus-suspect, and post-laser in situ keratomileusis eyes. J Cataract Refract Surg. 2009;35(6):1055–1062. | ||
Tamaoki A, Kojima T, Hasegawa A, Nakamura H, Tanaka K, Ichikawa K. Intraocular lens power calculation in cases with posterior keratoconus. J Cataract Refract Surg. 2015;41(10):2190–2195. | ||
Tomidokoro A, Oshika T, Amano S, Higaki S, Maeda N, Miyata K. Changes in anterior and posterior corneal curvatures in keratoconus. Ophthalmology. 2000;107(7):1328–1332. |
 © 2018 The Author(s). This work is published and licensed by Dove Medical Press Limited. The full terms of this license are available at https://www.dovepress.com/terms.php and incorporate the Creative Commons Attribution - Non Commercial (unported, v3.0) License.
By accessing the work you hereby accept the Terms. Non-commercial uses of the work are permitted without any further permission from Dove Medical Press Limited, provided the work is properly attributed. For permission for commercial use of this work, please see paragraphs 4.2 and 5 of our Terms.
© 2018 The Author(s). This work is published and licensed by Dove Medical Press Limited. The full terms of this license are available at https://www.dovepress.com/terms.php and incorporate the Creative Commons Attribution - Non Commercial (unported, v3.0) License.
By accessing the work you hereby accept the Terms. Non-commercial uses of the work are permitted without any further permission from Dove Medical Press Limited, provided the work is properly attributed. For permission for commercial use of this work, please see paragraphs 4.2 and 5 of our Terms.