")
Back to Journals » OncoTargets and Therapy » Volume 11
Impact of RNA integrity and blood sample storage conditions on the gene expression analysis
Authors Shen YT, Li R, Tian F, Chen ZZ, Lu N, Bai YF , Ge QY , Lu ZH
Received 4 December 2017
Accepted for publication 16 April 2018
Published 20 June 2018 Volume 2018:11 Pages 3573—3581
DOI https://doi.org/10.2147/OTT.S158868
Checked for plagiarism Yes
Review by Single anonymous peer review
Peer reviewer comments 3
Editor who approved publication: Dr Jianmin Xu
Yanting Shen,1,2 Rui Li,1 Fei Tian,1 Zhenzhu Chen,1 Na Lu,2 Yunfei Bai,2 Qinyu Ge,2 Zuhong Lu1,2
1School of Biomedical Engineering, Southeast University, Nanjing 210096, Jiangsu Province, People’s Republic of China; 2State Key Laboratory of Bioelectronics, Southeast University, Nanjing 210096, Jiangsu Province, People’s Republic of China
Background: The reliability of RNA sequencing (RNA-seq) output is affected by the quality of RNAs, which is in turn dependent on the quality of samples. Therefore, the purposes of this study were to reconsider the threshold of the RNA integrity number (RIN) and propose a simple and efficient storage scheme of blood samples for RNA-seq.
Patients and methods: The RNAs were extracted from blood samples that were stored at different conditions and used for sequencing. The bioinformatic analyses were performed to evaluate the impact of RNA integrity and blood sample storage conditions on the gene expression analysis.
Results: Our outcomes showed that the samples with RIN values more than 5.3 scarcely affected the quantitative results of RNA-seq, and the influence of inherent cellular physiological processes on RNA-seq output could be negligible.
Conclusion: The blood samples stored at 4°C within 7 days with RIN values more than 5.3 were available for RNA-seq.
Keywords: RNA, NGS, blood, integrity, RIN, sequencing
Introduction
Nowadays, cancer is a hot topic in the field of medicine, and is essentially a disease characterized by the abnormal proliferation of cells that is caused by the disorder of genetic or epigenetic functions. In the past, the limitations of genetic detection technologies have prevented our understanding of cancer and the development of targeted therapies. In recent years, with the development of the next-generation sequencing (NGS) technologies, our cognition of cancer has reached a new height. Among these technologies, the analysis of gene expression profiles based on RNA sequencing (RNA-seq) is the most widely used in cancer research.1,2 However, the reliability of its results is affected by the quality of RNAs, which is commonly evaluated by the RNA integrity number (RIN). Focusing on this point, many related studies have been reported to be devoted to setting a threshold of RIN value for RNA-seq.3–7 Yet, the results were not as consistent as expected. The exiting commercial NGS platforms still regard 8 as the threshold, by experience, to determine whether a sample was available, which makes some gene information of the samples with RIN values lower than 8 missing. Based on this, in the present study, we firstly reconsidered the threshold of RIN values for RNA-seq through comparing the RNA-seq output of the samples with RIN values lower than 8 with the samples with RIN values more than 8.
The integrity of the RNA is in turn dependent on the quality of samples from which it is extracted. The whole blood, a conventional minimally invasive sample, is becoming highly valued, because it is relatively easily obtained and small volumes can be collected with little harm to people when compared to tissue samples.8,9 In order to make the blood sample available for RNA-seq, how to preserve it effectively before any treatments, should be considered first. Solutions to this dilemma have been proposed previously. Blood samples could be directly stored at −80°C or frozen in liquid nitrogen for a long time,10 but these methods caused blood cell freezing damage, thus affecting the follow-up RNA detection of the blood cells. In recent years, some researchers believed that adding appropriate protective agents to the blood sample before cooling it down could effectively protect the cells in the blood from damage. For example, Ohmomo et al found that after storage at −80°C for a period of time, the quality of the RNA extracted from the peripheral blood mononuclear cells (PBMCs) with RNA protective agent was significantly higher than from the PBMCs without RNA protective agent.11 However, these methods of blood storage are limited by some objective conditions such as storage equipment, reagents, sample collection and the professionalism of interim management personnel. They may be difficult for onerous clinical procedures of for some more remote transporting after sampling. Therefore, a more convenient and effective short-term storage scheme for blood samples needs to be put forward to meet the dual needs of the clinic and research. Commonly, 4°C is used to preserve samples temporarily in a conventional routine. It is not only easier and cheaper for implementation than snap freezing or storage in special additives, but also more beneficial for postponing RNA degradation than at room temperature (25°C). It presents a potential for blood preservation. But, the exact time that the blood samples can be preserved efficiently at 4°C before subsequent manipulations is not clear and the related exploration for the preserved time at 4°C is still scarce. Thus, secondly we have tried to propose a simple and efficient storage scheme for blood samples for RNA-seq through analyzing the impact of storage time at 4°C on the gene expression analysis. Considering that the blood cells are still alive at 4°C, therefore, besides the RNA integrity, the effect of inherent cellular biological processes was also considered in this study.
Patients and methods
Sample preparation and ethics statement
The blood sample was obtained from a healthy donor who provided written informed consent. The study was approved by the Ethics Committee of Zhongda Hospital Affiliated Southeast University (Nanjing, People’s Republic of China) (Approval No: 2012ZDKYSB15.0). All experiments were performed in accordance with relevant guidelines and regulations set out by the ethical committee. The blood sample was divided into 15 parts, equally. Ten samples were used to extract RNA immediately, and then the RNAs were stored at room temperature (25°C) for different times (30 min–24 h). The remaining 5 blood samples were stored at 4°C for 4 hours, 1 day, 3 days, 5 days and 7 days prior to RNA extraction, respectively.
RNA extraction and degradation assessment
The RNA was extracted using TRIZOL reagent (Thermo Fisher Scientific, Waltham, MA, USA) following standard procedures as previously described.12 In all, 200 μL of each blood sample was incubated with 800 μL TRIZOL reagent for 5 min at room temperature, followed by supplementation with 200 μL chloroform. After vigorous mixing and centrifugation at 12,000× g for 15 min at 4°C, the upper layer was transferred to a new tube. An aliquot of 500 μL isopropanol was added and the resulting mixture was incubated for 10 min at room temperature, followed by centrifugation at 12,000× g for 15 min at 4°C to pellet RNA. The pellet was washed with 1 mL 75% ethanol and air-dried for 5 min. RNA was dissolved in 20 μL RNase-free water. Then, the RNA degradation was assessed using the Agilent 2100 Bioanalyzer and accompanying software, and the RIN values were provided to evaluate the integrity of RNA.
Poly-A-enriched RNA sequencing library preparation and sequencing
Five RNA samples extracted from the blood samples stored at 4°C from 4 hours to 7 days prior to RNA extraction, and 4 of 10 RNA samples extracted immediately, with the RIN values spanning the entire scale of RNA quality of the samples stored at 4°C, were selected for sequencing. The poly-A enriched RNA-seq libraries were prepared according to a previously published protocol, using 0.5 μg of total RNA per library in all instances.13 Each sample constructed two libraries. All of the libraries were multiplexed and sequenced on 1 lane of an Illumina X10 using standard protocols and reagents.
Bioinformatic analysis
The raw reads were filtered by SOAPnuke (version 1.0.1), and then were mapped to the human (hg19) genomes provided by Illumina iGenomes (downloaded from cufflinks.cbcb.umd.edu/igenomes.html) with Tophat2 (version 2.0.7) calling Bowtie2 (version 2.1.0), using the default settings. The alignment and differentially expression gene (DEG) analysis were performed with Cufflinks (version 2.0.2).14 The DEGs with q-value less than 0.05 and a fold change greater than 2-fold were regarded as significantly altered. Gene body coverage was calculated by RSeQC (version 2.6.1).
For functional analyses, Gene Ontology (GO) analysis was carried out with the protein annotation through evolutionary relationship (PANTHER) classification system (http://www.pantherdb.org/).15 The statistical overrepresentation test and enrichment test were performed. The former was based conceptually on the simple binomial test and used to determine whether a particular class (eg, a GO biological process or the PANTHER pathway) of genes was overrepresented or underrepresented. The latter was based on the Mann–Whitney test and used to determine whether any ontology class or pathway had numeric values that were non-randomly distributed with respect to the entire list of values.
Data analysis
All of data were analysed with MATLAB® (version 2010b). The fragments per kilo base transcript per million (FPKM) values were logarithmically transformed (to base 10). The mean of FPKM was compared with Student’s t-test or 1-way ANOVA. The distribution plot was provided to visualize the differences between samples. Principal components analysis (PCA), cluster analysis and correlation analysis were performed to analyze the similarity of the samples.
For PCA, the princomp function was used. The number of principal components was determined according to the cumulative contribution (85%), and the loading coefficients were used to evaluate the ability of each sample’s contribution to affect the overall variance of the data. For cluster analysis, we used a hierarchical approach with the average linkage method. Distances between samples were measured as Euclidean distance. Cophenetic coefficient was calculated to evaluate the effect of clustering, and the inconsistent function was performed to determine the optimal number of categories. For the correlation analysis, Pearson’s correlation coefficient was used to assess the similarity of samples. P-value <0.05 was considered significant.
Results
General information of sequencing data
Fifteen aliquots of blood samples were obtained from 1 health donor and divided into 2 parts. Five samples were stored at 4°C for 4 hours, 1 day, 3 days, 5 days and 7 days prior to RNA extraction. Surprisingly, time to RNA extraction seemed to contribute little to the RNA quality, with RIN=7.0 at 4 hours and 5.5 at 7 days. The remaining 10 samples were used to extract RNAs immediately after blood collection and then the RNAs were stored at room temperature (25°C) for different time periods to obtain the different degree, degraded RNAs. Four of them whose RIN values could be matched to the samples stored at 4°C were chosen for subsequent steps. We used these 9 samples to generate 18 poly-A-enriched RNA-seq libraries using a standard protocol (each sample constructed 2 libraries). Following sequencing and alignment, the samples that had fewer than 400,000 reads were excluded. Eventually, 13 sequencing data were involved in this study and we were able to get an average of 56,059,135 raw reads per sample, with 23,264,042 averaged mapped reads. The general sequencing information is given in Table S1. In the meantime, the library replicates to test for reproducibility yielded comparable results (r=0.815–0.869, P<0.001, Figure 1), indicating that there was no obvious data distortion caused by differences inherent to cDNA construction protocols.
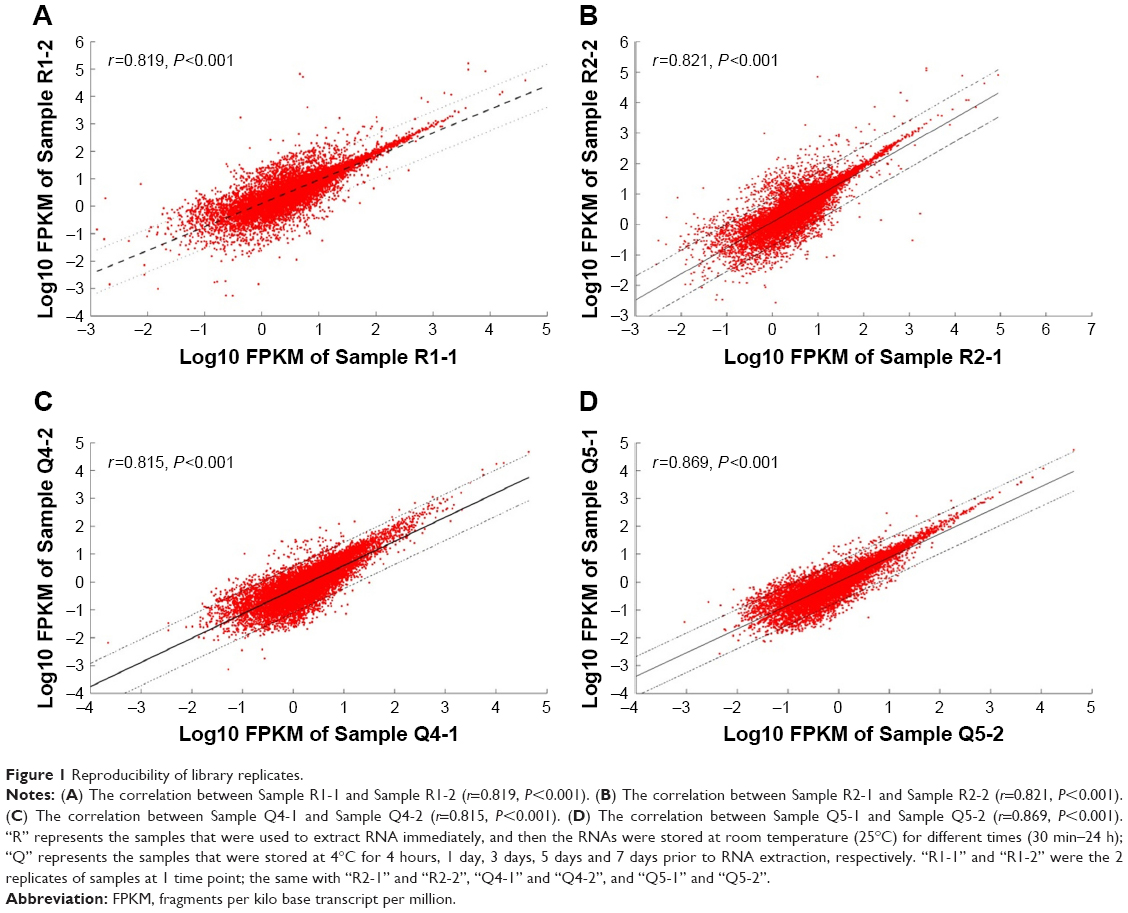 | Figure 1 Reproducibility of library replicates. |
The impact of RNA integrity on RNA-seq output
Four of 10 RNAs that were extracted immediately after blood collection and then stored at room temperature (25°C) for different time periods were selected to analyze the influence of RNA integrity on RNA-seq output. Their RIN values were 9.0, 7.0, 6.3 and 5.3, respectively, which spanned the entire scale of RIN values of the RNAs extracted from the samples stored at 4°C, for 4 hours to 7 days, prior to RNA extraction. Our outcomes showed that the RIN values affected gene body coverage, the number of clean reads and GC percentage, slightly (Figure 2).
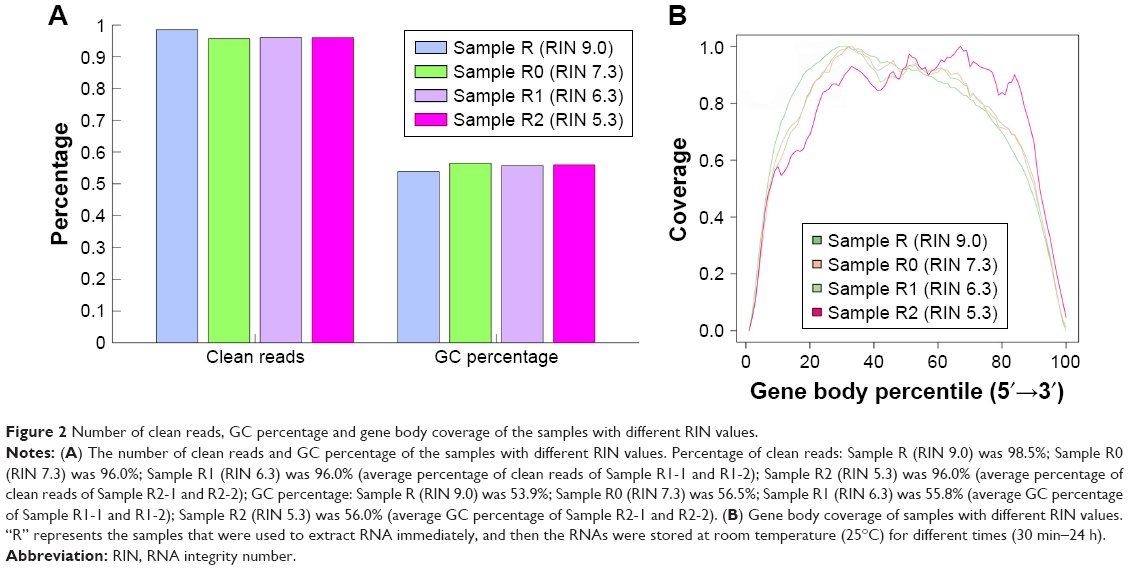 | Figure 2 Number of clean reads, GC percentage and gene body coverage of the samples with different RIN values. |
Moreover, we also plotted the distribution of FPKM values to analyze the effect of RNA degradation on the library complexity. The results showed that relative to RIN=9.0, the samples whose RIN values were 7.3, 6.3 and 5.3 have lower mean FPKM, respectively [Sample R (RIN 9.0) vs Sample R0 (RIN 7.3): 0.98±0.60 vs 0.57±0.58, t=42.90, P<0.001; Sample R (RIN 9.0) vs Sample R1 (RIN 6.3): 0.98±0.60 vs 0.46±0.60, t=53.06, P<0.001; Sample R (RIN 9.0) vs Sample R2 (RIN 5.3): 0.98±0.60 vs 0.33±0.67, t=62.26, P<0.001; Sample R (RIN 9.0) vs Sample R0 (RIN 7.3) vs Sample R1 (RIN 6.3) vs Sample R2 (RIN 5.3): 0.98±0.60 vs 0.57±0.58 vs 0.46±0.60 vs 0.33±0.67, F=1,564.16, P<0.001, Figure 3], and there was a significant negative association between the RIN values with the mean FPKM values (r=0.98, P=0.019). As previous studies reported, these results indicated that the library complexity could reflect the quality of RNA samples. Yet, it is still unclear to what extent this property could affect the gene expression levels. Therefore, we subsequently performed the correlation analysis based on the gene expression data (Figure 4A, Table S2). It showed that all of the correlation coefficients between these samples were more than 0.8, presenting strong correlations and indicating that the samples with RIN values more than 5.3 had little effect on the quantitative results of the RNA-seq.
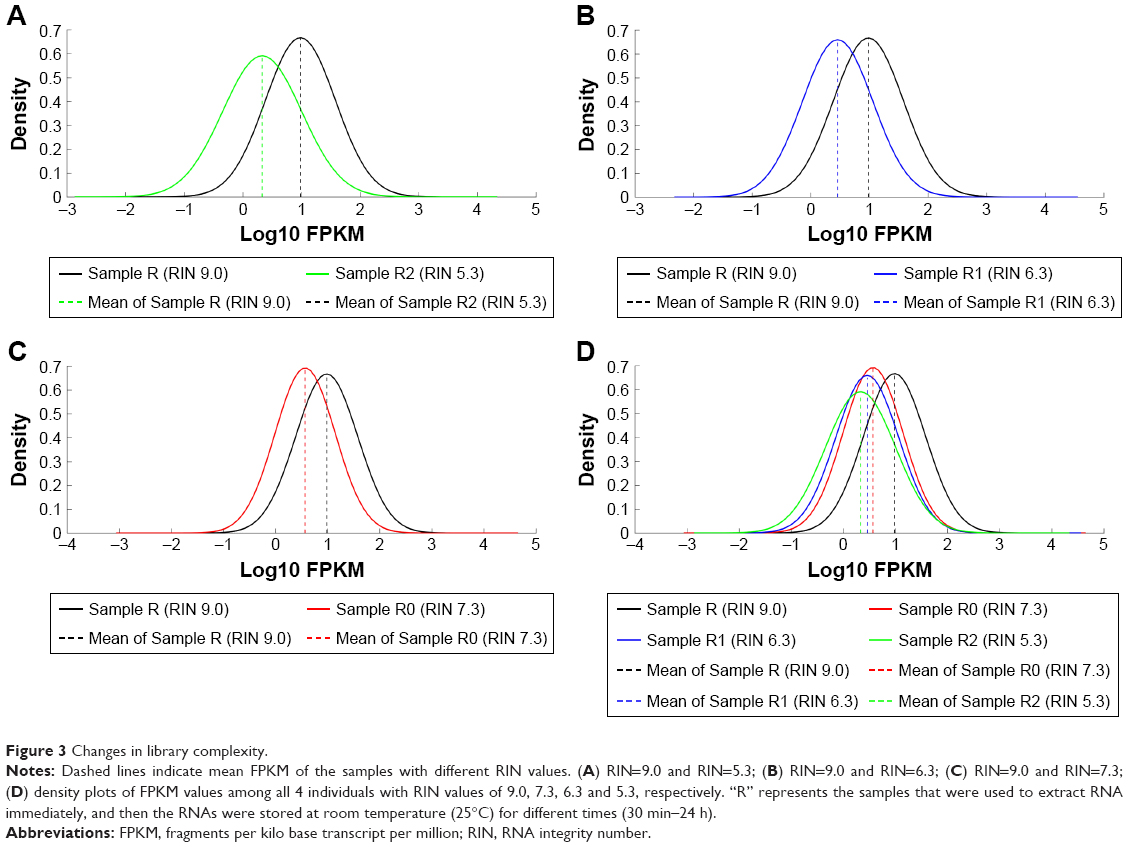 | Figure 3 Changes in library complexity. |
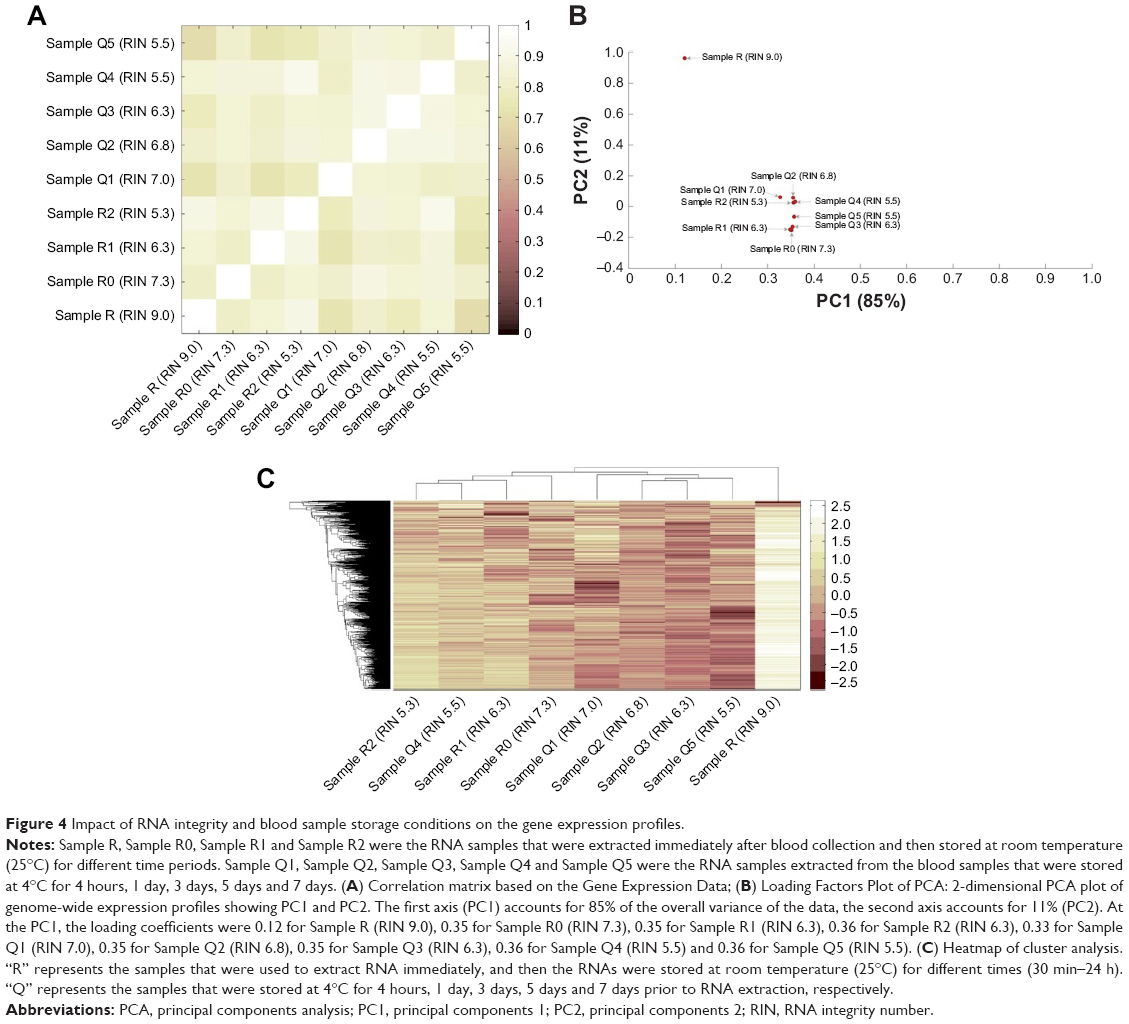 | Figure 4 Impact of RNA integrity and blood sample storage conditions on the gene expression profiles. |
The impact of blood sample storage conditions on RNA-seq output
When the blood samples were stored at 4°C, the cells were still alive and underwent various physiological processes, such as apoptosis and internal RNA degradation, which might affect the gene expression profiles. Especially for disease-related studies, these changed genes could make the output distorted and confused. Therefore, besides RNA degradation, the inherent cellular physiological processes should also be considered when evaluating how long the blood samples can be preserved efficiently at 4°C for RNA-seq. We analyzed the RNA-seq data of the RNAs extracted from the blood samples placed at 4°C for 4 hours to 7 days, and the RIN-matched RNAs extracted immediately after blood collection, together, to address the question of how significant the influence of blood sample storage conditions are on the gene expression analysis. To gain insights into the RNA-seq output, different bioinformatic methods were applied. The multivariate data analysis method, PCA, was used to visualize similarities or dissimilarities between gene expression profiles of cellular physiological biological processes and degradation stages in a 2-dimensional plot. PCA is a linear projection method that allows visualization of high-dimensional data in a lower dimensional space. The results of the PCA analysis for the normalized RNA-seq dataset are shown in Figure 4B. The first principal component (PC1) accounted for 85% of the overall variance of the data. It could be used to represent substantially all of the initial information, and at this principal component, each sample had parallel contribution, clearly presenting similarity to each other.
Furthermore, we applied a clustering approach using an agglomerative hierarchical clustering algorithm (Figure 4C). The data showed that the Cophenetic correlation coefficient was 0.74, and according to inconsistent analysis, all of the samples finally clustered together as one category. To demonstrate this, the pairwise similarity metrics between samples was calculated using Pearson’s correlation coefficient. As shown in Figure 4A, we observe that all of the correlation coefficients between these samples were more than 0.7, presenting strong correlations (Table S2). Moreover, what is noteworthy is that the sequencing output of samples with the same RIN values, but stored for different time periods before RNA extraction, was very similar [Pearson’s correlation coefficient of Sample Q4 (RIN 5.5) and Sample Q5 (RIN 5.5) was 0.820 (P<0.001); Pearson’s correlation coefficient of Sample R0 (RIN 7.3) and Sample Q1 (RIN 7.0) was 0.819 (P<0.001); Pearson’s correlation coefficient of Sample Q3 (RIN 6.3) and Sample R1 (RIN 6.3) was 0.806 (P<0.001); Pearson’s correlation coefficient of Sample R2 (RIN 5.3) and Sample Q4 (RIN 5.5) was 0.910 (P<0.001)], demonstrating that the influence of inherent cellular physiological processes on RNA-seq output could be negligible.
Analysis of differentially expressed genes
While there was no obvious differences observed between the samples stored at 4°C within 7 days, we still wanted to analyze the statistical DEGs that would have to be carefully considered in future studies, especially for the disease-related studies, because they would be influenced by the RNA integrity or inherent cellular physiological biological processes rather than reflecting pathological biological differences. As shown in Table 1, compared to the samples stored at 4°C for 4 hours before RNA extraction, we observed only 27 upregulated DEGs in the samples stored for 5 days, while no DEG was found in the samples stored at 4°C for 1 day, 3 days or 7 days. To functionally characterize these DEGs, we carried out GO analysis to identify groups of genes with similar functions. The results of the overrepresentation test showed that 5 DEGs, NAP1L1, S100A12, ATM, ATRX and AKAP9, were enriched in the DNA metabolic process (GO: 0006259, fold enrichment was 10.98, P-value was 0.0173), which played a role in the process of DNA replication or RNA transcription.
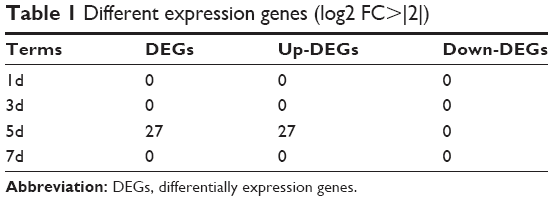 | Table 1 Different expression genes (log2 FC>|2|) |
Discussion
In order to determine the time that the blood samples could be stored at 4°C for RNA-seq, 2 factors should be considered carefully. The first one is the integrity of RNA. RNA is an extremely labile molecule that is prone to damage from either intrinsic or external factors.16 A previous study showed that it degraded fast when the blood cells were stored at room temperature (25°C). Over 84 hours, RIN value decreased from 9 to 3.8.3 Based on this, we changed to 4°C, a lower temperature, to preserve the blood samples, to prolong the degradation of RNA. Expectedly, the results showed the RIN value was still 5.5 at the seventh day, suggesting that 4°C was more appropriate to store blood samples than room temperature (25°C). Subsequently, we selected 4 of 10 RNAs that were extracted from blood samples immediately after collection, and stored at room temperature (25°C) for different time periods, to analyze the influence of the RNA integrity on RNA-seq output. The results demonstrated that although it seemed that the higher quality RNA had higher sequencing library complexity, the quality of sequencing and gene expression profiling might not be affected, indicating that blood samples with RIN values ranging from 5.3 to 9.0 were available for RNA-seq (Figures 2–4A). This was similar to the results of a previous study,17 which indicated that degraded RNA from tumor samples (RIN >5) could still be used to perform RNA-seq. The second factor was the inherent cellular physiological process. Different bioinformatic methods including PCA, cluster analysis and correlation analysis were applied to address this point. All of their results were closely consistent, suggesting that neither RNA integrity nor inherent cellular biological processes could affect the output of RNA-seq (Figure 4A–C).
Moreover, we analyzed the statistical DEGs that would have to be carefully considered in future studies, especially for some disease-related studies, because they might be influenced by the RNA quality or inherent cellular physiological biological processes rather than reflect pathological biological differences. Only 27 upregulated DEGs were found in the samples stored at 4°C for 5 days, demonstrating that preservation of blood samples at 4°C seemed to have a significant influence only on a fairly small number of genes (27/37,000 genes) but not a global effect of RNA degradation on gene expression. Five DEGs were identified to be enriched in the DNA metabolic process (GO: 0006259, fold enrichment was 10.98, P-value was 0.0173), but no relation to known RNA degradation processes or pathways that were involved in some diseases could be found. The absence of these findings clearly showed that changes in the expression profiles were generated at the RNA level and not by de novo transcription or some inherent cellular physiological processes, as expected from the experimental design. In addition, these DEGs were not found in the noteworthy pathways that were initiated during apoptosis or other pathological processes, indicating that in future studies, especially for disease-related studies, these DEGs should not confuse and distort the results.
In conclusion, all of the results were closely consistent, pointing out that neither RNA integrity nor inherent cellular biological processes could affect the output of RNA-seq, and the blood samples stored at 4°C, within 7 days, with RIN values ranging from 5.3 to 9.0, were safe and available for RNA-seq. In addition, the analysis of DEGs demonstrated that changes in the expression profiles were generated at the RNA level and not by de novo transcription or some inherent cellular physiological processes, as expected from the experimental design. Meanwhile, RNA degradation and cellular biological processes seemed to have a significant influence only on a fairly small number of genes (27/37,000 genes) but not on the global gene expression profiles, indicating that in future studies, the effect of these DEGs on the RNA-seq output could be negligible.
Data sharing statement
Raw RNA-seq reads have been submitted to the NCBI Short Read Archive under accession number SRP091823. Data generated or analyzed during this study are included in this published article and its supplementary information files.
Acknowledgment
This study was supported by the National Natural Science Foundation of China [grant numbers 61271055]; the Fundamental Research Funds for the Central Universities and the Regular University Graduate Student Scientific Research Innovation Projects of Jiangsu Province (KYLX15_0171).
Disclosure
The authors report no conflicts of interest in this work.
References
Sewall C, Bell DA, Clark GC, et al. Induced gene transcription: implications for biomarkers. Clin Chem. 1995;41(12 Pt 2):1829–1834. | ||
Pfaffl MW. Guest editor’s introduction for BDQ special issue: ‘Advanced Molecular Diagnostics for Biomarker Discovery’. Biomol Detect Quantif. 2015;5:1–2. | ||
Romero IG, Pai AA, Tung J, Gilad Y. RNA-seq: impact of RNA degradation on transcript quantification. BMC Biol. 2014;12:42. | ||
Copois V, Bibeau F, Bascoul-Mollevi C, et al. Impact of RNA degradation on gene expression profiles: assessment of different methods to reliably determine RNA quality. J Biotechnol. 2007;127(4):549–559. | ||
Fleige S, Pfaffl MW. RNA integrity and the effect on the real-time qRT-PCR performance. Mol Aspects Med. 2006;27(2–3):126–139. | ||
Fleige S, Walf V, Huch S, Prgomet C, Sehm J, Pfaffl MW. Comparison of relative mRNA quantification models and the impact of RNA integrity in quantitative real-time RT-PCR. Biotechnol Lett. 2006;28(19):1601–1613. | ||
González-Herrera L, Valenzuela A, Marchal JA, Lorente JA, Villanueva E. Studies on RNA integrity and gene expression in human myocardial tissue, pericardial fluid and blood, and its postmortem stability. Forensic Sci Int. 2013;232(1–3):218–228. | ||
Buder A, Tomuta C, Filipits M. The potential of liquid biopsies. Curr Opin Oncol. 2016;28(2):130–134. | ||
Properzi F, Logozzi M, Fais S. Exosomes: the future of biomarkers in medicine. Biomark Med. 2013;7(5):769–778. | ||
Botling J, Edlund K, Segersten U, et al. Impact of thawing on RNA integrity and gene expression analysis in fresh frozen tissue. Diagn Mol Pathol. 2009;18(1):44–52. | ||
Ohmomo H, Hachiya T, Shiwa Y, et al. Reduction of systematic bias in transcriptome data from human peripheral blood mononuclear cells for transportation and biobanking. PLoS One. 2014;9(8):e104283. | ||
Grade M, Ghadimi BM, Varma S, et al. Aneuploidy-dependent massive deregulation of the cellular transcriptome and apparent divergence of the Wnt/beta-catenin signaling pathway in human rectal carcinomas. Cancer Res. 2006;66(1):267–282. | ||
Marioni JC, Mason CE, Mane SM, Stephens M, Gilad Y. RNA-seq: an assessment of technical reproducibility and comparison with gene expression arrays. Genome Res. 2008;18(9):1509–1517. | ||
Trapnell C, Roberts A, Goff L, et al. Differential gene and transcript expression analysis of RNA-seq experiments with TopHat and Cufflinks. Nat Protoc. 2012;7(3):562–578. | ||
Mi H, Muruganujan A, Casagrande JT, Thomas PD. Large-scale gene function analysis with the PANTHER classification system. Nat Protoc. 2013;8(8):1551–1566. | ||
Vennemann M, Koppelkamm A. mRNA profiling in forensic genetics. I: possibilities and limitations. Forensic Sci Int. 2010;203(1–3):71–75. | ||
Opitz L, Salinas-Riester G, Grade M, et al. Impact of RNA degradation on gene expression profiling. BMC Med Genomics. 2010;3:36. |
Supplementary materials
 | Table S1 General sequencing information |
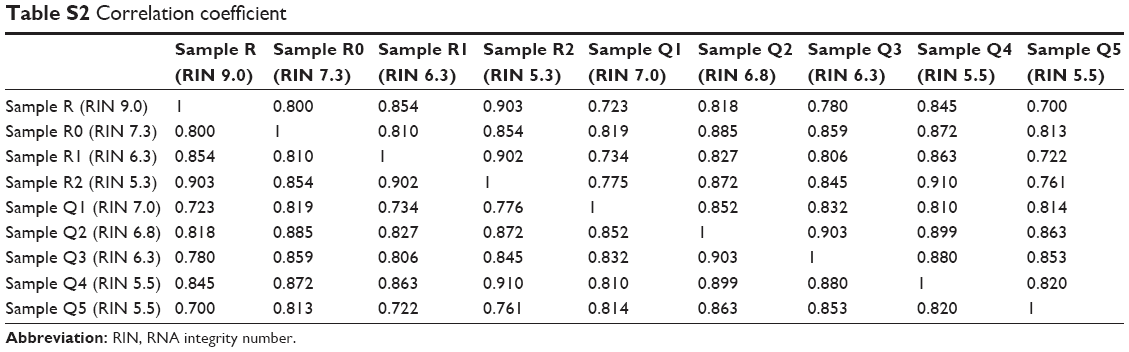 | Table S2 Correlation coefficient |
 © 2018 The Author(s). This work is published and licensed by Dove Medical Press Limited. The full terms of this license are available at https://www.dovepress.com/terms.php and incorporate the Creative Commons Attribution - Non Commercial (unported, v3.0) License.
By accessing the work you hereby accept the Terms. Non-commercial uses of the work are permitted without any further permission from Dove Medical Press Limited, provided the work is properly attributed. For permission for commercial use of this work, please see paragraphs 4.2 and 5 of our Terms.
© 2018 The Author(s). This work is published and licensed by Dove Medical Press Limited. The full terms of this license are available at https://www.dovepress.com/terms.php and incorporate the Creative Commons Attribution - Non Commercial (unported, v3.0) License.
By accessing the work you hereby accept the Terms. Non-commercial uses of the work are permitted without any further permission from Dove Medical Press Limited, provided the work is properly attributed. For permission for commercial use of this work, please see paragraphs 4.2 and 5 of our Terms.