")
Back to Journals » Patient Preference and Adherence » Volume 10
Impact of "Conversation Maps" on diabetes distress and self-efficacy of Chinese adult patients with type 2 diabetes: a pilot study
Authors Li F, Yao P, Hsue C, Xu J, Lou Q
Received 31 August 2015
Accepted for publication 21 January 2016
Published 24 May 2016 Volume 2016:10 Pages 901—908
DOI https://doi.org/10.2147/PPA.S95449
Checked for plagiarism Yes
Review by Single anonymous peer review
Peer reviewer comments 3
Editor who approved publication: Dr Naifeng Liu
Fan Li,1,* Ping Yao,2,* Cunyi Hsue,3 Jin Xu,4 Qingqing Lou1
1Department of Health Education, Jiangsu Province Hospital on Integration of Chinese and Western Medicine, Nanjing, Jiangsu, People’s Republic of China; 2Department of Endocrinology, Jiangsu Province Hospital on Integration of Chinese and Western Medicine, Nanjing, Jiangsu, People’s Republic of China; 3Hangzhou 9th Middle School, Hangzhou, Zhejiang, People’s Republic of China; 4Department of Bioengineering, University of Washington, Seattle, WA, USA
*These authors contributed equally to this work
Abstract: The objective was to compare Diabetes Conversation Maps-based education and traditional education in Chinese patients with type 2 diabetes. A total of 53 outpatients were randomized to the intervention group (Diabetes Conversation Maps-based education) and control group (traditional education). In the intervention group, six 1-hour sessions covering diabetes overview, living with diabetes, risk factors and complications of diabetes, starting insulin treatment, foot care, and healthy eating and exercise were provided during 4 weeks. The participants had to attend at least four sessions, followed by a monthly follow-up telephone call in the subsequent 3 months. In the control group, six 1-hour diabetes classes covering similar topics as those in the intervention group were provided over 4 weeks. Each participant needed to attend at least four sessions. A1C was assessed at baseline, 3 months and 6 months after the last educational session/class. Psychosocial metrics and self-care activities were evaluated at baseline and 6 months after the last educational session/class. Forty-six participants finished the study. After 6 months, the total score of diabetes distress scale was significantly lower and total score of diabetes empowerment scale-short form was significantly higher in the intervention group than the control group. The 3 months A1C was significantly lower in the intervention group than the control group. However, the 6 months A1C did not reach a statistically significant difference between groups. Compared to traditional education, Diabetes Conversation Maps were more effective in improving psychosocial metrics and 3-month A1C.
Keywords: type 2 diabetes, education, conversation map, psychosocial metrics
Introduction
From a national survey carried out in 2010, the prevalence of diabetes in Chinese adults was estimated to be 11.6%, which represents 113.9 million adults with diabetes.1 It has resulted in a huge economic burden. In order to take care of themselves, patients need to have knowledge and skills regarding diabetes management. The American Diabetes Association advocated that diabetes self-management education is a critical element of care for all people with diabetes.2 It has been demonstrated that approaches of education that are interactive and patient-centered were effective in improving metabolic control, self-care behavior, self-efficacy, and quality of life.3–8
Ongoing support to sustain the level of self-management is also emphasized by the American Diabetes Association.2 However, in the People’s Republic of China, diabetes educators put too much effort into didactic teaching, applying classroom instruction which ignores interactive discussion among the patients, and usually there is no follow-up after the class.9
On the contrary, Diabetes Conversation Maps is a patient-centered conversation-based tool. It encourages interactive dialogue among the participants, and inspires the participants to make their own discoveries.10 They are widely used in different countries.11–14
However, compared to A1C change and behavior change, psychosocial metrics, such as diabetes distress, self-efficacy, and quality of life, which play important roles in diabetes self-management are less emphasized in these studies. In People’s Republic of China, 79.8% of patients with type 2 diabetes received diabetes education from different resources,15 including Diabetes Conversation Maps. Studies were also carried out to explore effects of this educational tool,16–18 whereas psychosocial metrics were not measured, and follow-up was not highlighted in these studies. The aim of our study was to compare the effects of improving psychosocial metrics, such as relieving diabetes distress, improving self-efficacy, and increasing quality of life, between Diabetes Conversation Maps and didactic teaching. Blood glucose control (A1C) was also compared between the two groups.
Methods
Trial procedures
This was a 28-week randomized controlled pilot study. Outpatients with type 2 diabetes were enrolled according to the following inclusion criteria: course of diabetes ≥1 year; age >18 years old; normal cognitive function; have not previously attended other education programs. Patients were excluded if they had a serious condition that would prevent them from completing the study or if they have language disorders. Fifty-three outpatients were enrolled in the study. Randomization was performed by computer-generated random numbers. Group assignments were delivered in sealed, opaque envelopes generated by off-site study staff. Participants were not blinded to their group assignment. Twenty-seven were randomized to the intervention group and 26 to the control group.
In the intervention group, a trained diabetes educator took on the role as the facilitator of Diabetes Conversation Map. Seven participants were assigned to each 1-hour session. The topics covered: diabetes overview, living with diabetes, risk factors and complications of diabetes, starting insulin treatment, foot care, and healthy eating and exercise. During each session, a Diabetes Conversation Map (laminated 3×5-foot with colorful drawings as metaphors of situations familiar to people with diabetes) was placed on a table with subjects gathered around it (Figure 1). Conversation questions and discussion cards were used to encourage group interaction. For example, the first question patients were asked when using the diabetes overview map was to explain what diabetes is. In the living with diabetes session, patients described the frequency of measuring blood glucose at home. Patients participating in the risk factors and complications of diabetes session were questioned regarding what kind of complication screenings they had before. Patients on insulin were requested to list the snacks they carried to treat hypoglycemia when they made use of the starting insulin treatment map. During the foot care session, participants depicted the characteristics of ideal shoes. In addition, those using the healthy eating and exercise map discussed how to cook more healthily and how to break through the barriers of exercise. After each session, patients set one or two behavior goals. Participants in the intervention group who finished four sessions were considered to have completed the learning period of the intervention group. After the learning period, a monthly telephone call by the diabetes educator was made to the participants in the subsequent 3-month follow-up period. During each phone call, the facilitator enquired about the achievement of the goals. If the goals were achieved, new goals would be set by the participants after a discussion with the facilitator. If not, the facilitator and the participants would work together to revise the goals to be more achievable. If their blood glucose was too high or too low, the facilitator would urge them to pay a visit to a clinic.
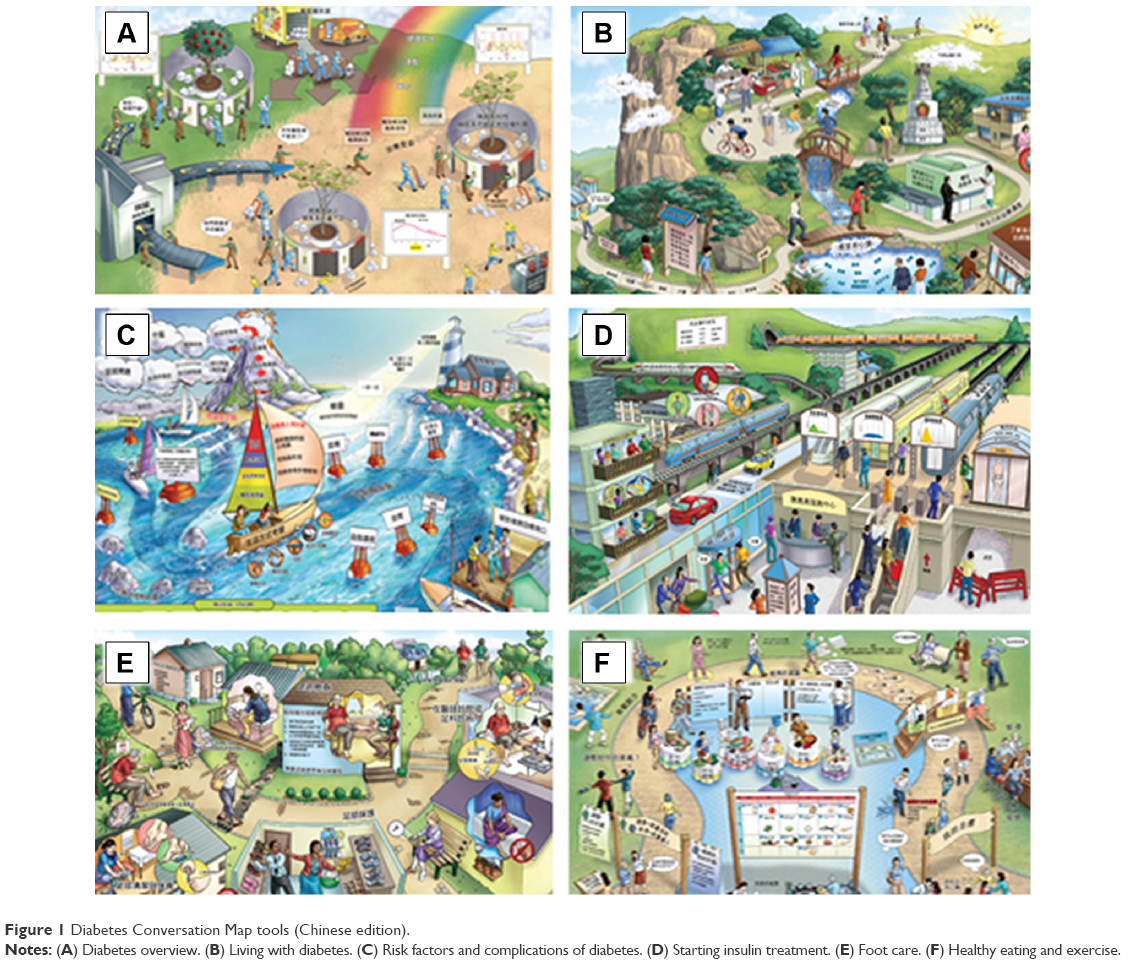 | Figure 1 Diabetes Conversation Map tools (Chinese edition). |
Participants in the control group received traditional education. Six 1-hour diabetes classes were provided to them over 4 weeks by the same educator as in the intervention group. There were two classes each week, subjects who attended four classes were considered as having finishing the learning period of the control group. The topics of the courses were the same as those in the intervention group.
Psychosocial metrics were assessed by Chinese versions of the diabetes distress scale (DDS) (Cronbach alpha =0.951),19 general self-efficacy scale (GSES) (Cronbach alpha =0.87),20 diabetes empowerment scale-short form (DES-SF) (Cronbach alpha =0.848),21 and the World Health Organization’s quality of life instrument (WHOQOL-BREF) (Cronbach alpha =0.89).22 DDS is an instrument to assess diabetes-related emotional distress containing 17 items,23 where higher scores indicate more severe diabetes-related distress.19 GSES, which includes ten items, was used to measure self-efficacy of the participants, and higher total score indicates greater self-efficacy.20 DES-SF, a tool to evaluate diabetes-related psychosocial self-efficacy,24 covers eight items with higher total score indicating greater psychosocial efficacy.25 Quality of life was measured by WHOQOL-BREF, which consists of 28 items including four dimensions: physical, psychological, social relationships, and environment; where higher scores suggest greater quality of life.22 Blood glucose control was evaluated by the A1C level.
Data were collected before the learning period and 6 months after the learning period. A1C was measured at 3 months after the learning period and it was recorded from patients’ laboratory reports.
Ethics statement
Each of the subjects provided written informed consent before participating in the study. This research was approved by the ethics committee of Jiangsu Province Hospital on Integration of Chinese and Western Medicine (Clinical Trials) TNF001.
Statistical analysis
All statistical analyses were conducted with SPSS version 16.0 software (SPSS Inc., Chicago, IL, USA). All statistical tests were two-sided with a 5% significance level. Baseline characteristics were expressed as means and their standard deviations or frequencies. Between-group comparisons were based on nonparametric test with Mann–Whitney U-test for continuous variables and Pearson’s chi-square for categorical variables. Scales which assessed patient-reported outcomes were scored according to scoring algorithms. Between-group comparisons of scores and A1C values were based on nonparametric test with Mann–Whitney U-test, and within-group comparisons were based on nonparametric test with Wilcoxon signed-rank test. All analyses were performed on participants who completed the study.
Findings
The study was carried out from November 2012 to May 2013. Forty-six participants, 24 in the intervention group and 22 in the control group, finished the study (Figure 2). The baseline characteristics of the participants were summarized in Table 1. There was no statistically significant difference between the two groups in any of the demographic and clinical characteristics.
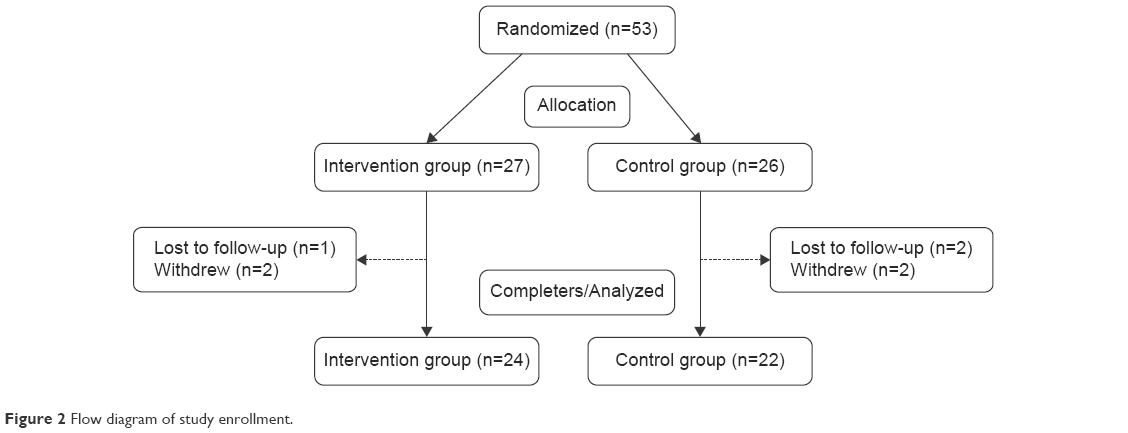 | Figure 2 Flow diagram of study enrollment. |
 | Table 1 Baseline characteristics of participants |
Psychosocial metrics
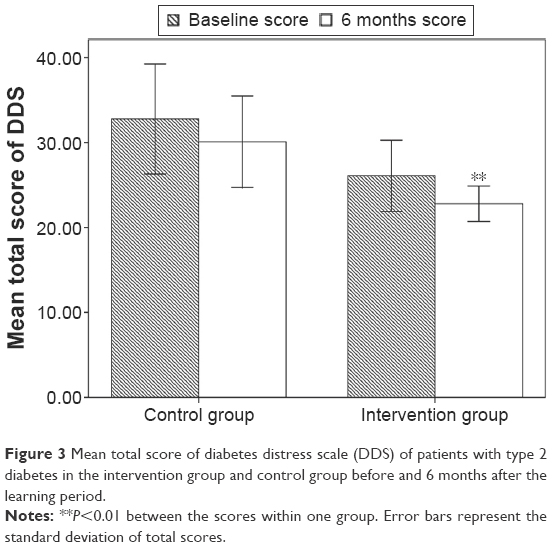
There was no statistically significant difference in baseline total scores of DDS (26.08±9.92 vs 32.77±14.57, P=0.073) between the intervention group and control group. From Figure 3, it can be identified that 6 months after the learning period the total score of DDS was significantly lower in the intervention group compared to that in the control group (22.79±4.95 vs 30.09±12.14, P=0.014). In the intervention group, total score of DDS (26.08±9.92 vs 22.79±4.95, P=0.003) was significantly decreased after 6 months (Figure 3). However, in the control group, when the study was over, no statistically significant difference was found in total score of DDS (32.77±14.57 vs 30.09±12.14, P=0.312) (Figure 3).
 | Figure 3 Mean total score of diabetes distress scale (DDS) of patients with type 2 diabetes in the intervention group and control group before and 6 months after the learning period. |
The baseline total score of GSES did not reach statistically significant difference between the two groups (34.92±10.76 vs 30.05±7.46, P=0.084). Although statistically significant difference was not reached, total score of GSES in the intervention group was higher than that in the control group (33.50±4.75 vs 30.91±7.40, P=0.161) after 6 months. In the intervention group, total score of GSES was lower after 6 months (34.92±10.76 vs 33.50±4.75, P=0.402). However, in the control group, no statistically significant difference was found after 6 months (30.05±7.46 vs 30.91±7.40, P=0.590).
There was no statistically significant difference in total score of DES-SF between groups (35.04±3.83 vs 32.50±6.43, P=0.117 Figure 4) at baseline. Six months after the learning period, total score of DES-SF was significantly greater in the intervention group compared to that in the control group (37.04±2.66 vs 34.18±5.67, P=0.039 Figure 4). In the intervention group, total score of DES-SF was significantly improved after 6 months (35.04±3.83 vs 37.04±2.66, P=0.001 Figure 4) whereas in the control group, no statistical significant difference was found (32.50±6.43 vs 34.18±5.67, P=0.179 Figure 4) after 6 months.
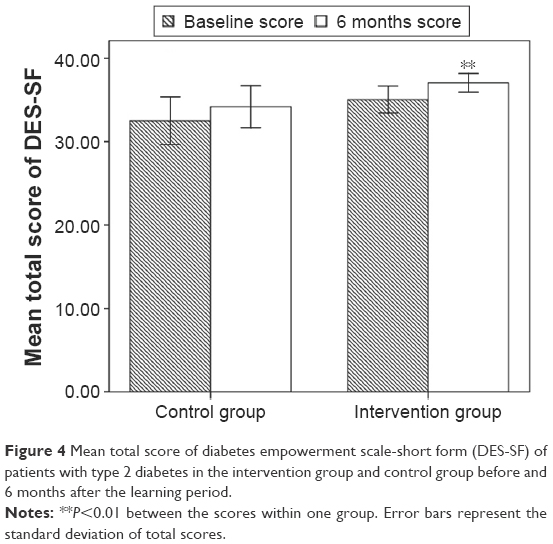 | Figure 4 Mean total score of diabetes empowerment scale-short form (DES-SF) of patients with type 2 diabetes in the intervention group and control group before and 6 months after the learning period. |
To compare quality of life, scores of WHOQOL-BREF were analyzed. From Table 2, no statistically significant difference was found in between-group comparisons at baseline or after 6 months. But in the intervention group, scores of psychological (15.15±2.44 vs 15.42±2.25, P=0.036) and environment (13.80±3.09 vs 14.30±2.67, P=0.003) dimensions were significantly increased. However, in the control group, there was no significant change in dimension scores.
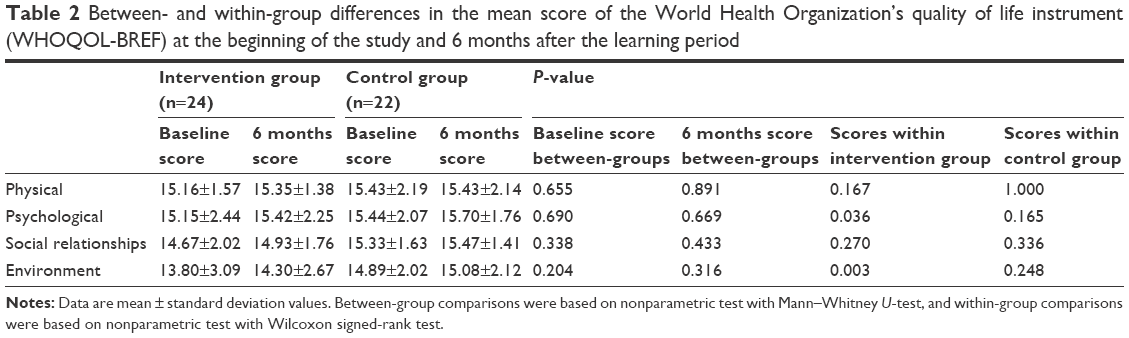 | Table 2 Between- and within-group differences in the mean score of the World Health Organization’s quality of life instrument (WHOQOL-BREF) at the beginning of the study and 6 months after the learning period |
A1C
The A1C (%) was not significantly different between groups at baseline (7.76±2.47 vs 7.69±1.58, P=0.904 Figure 5). After 3 months, A1C was significantly lower in the intervention group than in the control group (6.55±0.62 vs 7.13±0.75, P=0.007 Figure 5). After 6 months, when comparing A1C values of the two groups, no statistically significant difference was found (6.84±1.26 vs 7.19±1.19, P=0.408 Figure 5). In the intervention group, after both 3 months and 6 months, A1C was significantly decreased compared to the baseline value (6.55±0.62 vs 7.76±2.47, P=0.000; 6.84±1.26 vs 7.76±2.47, P=0.003 Figure 5). But there was an upward trend in A1C when the 3-month follow-up period was over. In the control group, A1C was significantly improved after 3 months compared to the baseline value (7.13±0.75 vs 7.69±1.58, P=0.002 Figure 5). However, the improvement did not last long, no statistical significant difference was found between the 6 months A1C and the baseline value (7.19±1.19 vs 7.69±1.58, P=0.128 Figure 5).
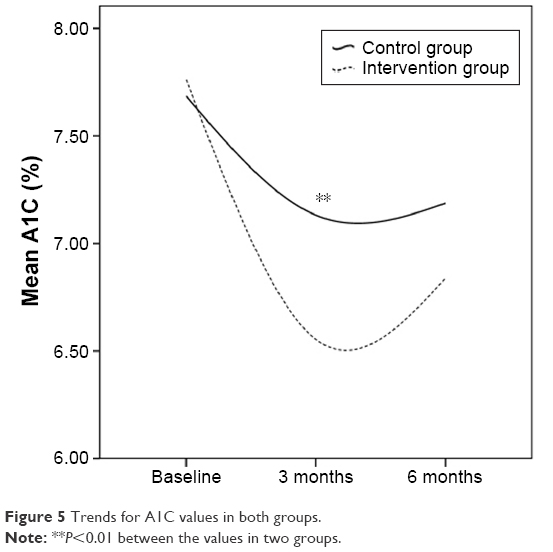 | Figure 5 Trends for A1C values in both groups. |
Discussion and recommendations
Our study provided comprehensive findings including psychosocial metrics and blood glucose control over time.
In our study, after 6 months, total score of DDS was significantly improved in the intervention group compared to that in the control group. We also found that the total score of DDS was significantly decreased in the intervention group after 6 months. It may be due to Conversation Maps which were used to facilitate interactive dialogue among the participants through rapport building and sharing personal experience of living with diabetes.26 During the discussion, participants talked about the barriers and challenges they faced related to diabetes self-care and found that they shared some common experiences and feelings. Furthermore, it was also reported that when the same participants attended four sessions, the strongest group bonding would occur.27 Peer support can relieve the negative emotions of the participants.
Self-efficacy was defined as “people’s judgments of their capabilities to organize and execute course of action required to attain designated types of performance”.28 In our study, GSES and DES-SF were used to measure self-efficacy and psychosocial self-efficacy respectively. After 6 months, we found that although total score of GSES in the intervention group was higher than that in the control group, it did not reach statistically significant difference. This may be due to the relatively small sample size of our study.
Six months after the learning period, we found that the total score of DES-SF was significantly greater in the intervention group compared to that in the control group. Our finding confirmed the result of a multicenter study carried out in Spain and Germany which compared group education with Conversation Maps and regular care in 310 Spanish patients with type 2 diabetes. They also found that total score of DES was significantly higher in the Conversation Map group than in the regular care group at 6 months after the last educational session.11 It can be attributed to self-efficacy theory is the foundation for much of the curriculum of Conversation Maps, and this theory is also reflected in the active group dialogue,10 during which the facilitator asked open-ended questions which encouraged participants to reflect on their past experience in self-care, attitude changes, and overcoming psychosocial and environmental barriers to induce the participants to find the answer by themselves. By exploring instead of being taught, participants had more confidence in changing their behavior.
Six months later, scores of psychological and environment dimensions of WHOQOL-BREF were significantly improved in the intervention group. This may be due to the fact that in this group, patients got more emotional support from other participants who had similar experiences through the group discussion. In the intervention group, participants received a telephone call from the educator monthly. They can solve problems via the phone call instead of coming to the clinic to see the educator. In other words, these patients obtained health care services more conveniently.
After 3 months follow-up, A1C level was significantly lower in the intervention group than in the control group, because better self-care behavior leads to better blood glucose control. Also, patients receiving Diabetes Conversation Maps-based education were more likely to change their behavior due to the following reasons: patients support each other in the education session, and they receive a monthly follow-up phone call. In each phone call, the facilitator checked whether the goals with regard to diabetes self-management were achieved. If the goals were achieved, new ones would be set by the participants. If not, the facilitator and the participants would work together to revise them. In the intervention group, if the facilitator found the glucose level of the participants was too high or too low, she would urge them to pay a visit to a clinic to adjust their treatment. However, the advantage in blood glucose control did not last long, after 6 months, no statistically significant difference was found between the two groups. Our results confirmed the finding of the research in Spanish patients,11 which also reported that 6 months after the end of the educational sessions, there was no statistically significant difference between Conversation Map group and traditional education group in A1C level. This can be explained by the fact that diabetes education is effective for improving clinical outcomes at least in the short term.29 However, initial improvements in participants’ metabolic control have been found to diminish after approximately 6 months.30,31 To encourage behavior change and the maintenance of healthy diabetes-related behaviors, ongoing support for people with diabetes is particularly important.2 In our study, the 3 months follow-up which focused on behavior change explained why A1C level was significantly lower in the intervention group than in the control group after the first 3 months. However, during the second 3 months after Conversation Maps sessions, there was no follow-up. The interaction time between the participants and the facilitator decreased and no consecutive self-management support was provided during this period. These may be the reasons why the advantage in blood glucose control in the intervention group did not last long. To sustain the blood glucose control, long-term diabetes self-management support is needed.
There were also some limitations in this study. Apart from using Diabetes Conversation Map, patients in the intervention group were also followed-up for 3 months and had behavior change planning. Therefore, some of the positive findings may be influenced by these extra features beyond the Conversation Map itself. The sample size was relatively small, participants were only followed-up for 3 months after the last educational session, and we did not evaluate behavior change of both groups. In the future, strict head-to-head comparison of two educational methods are warranted. More studies with a large sample size need to be carried out to explore long-term effects of using Diabetes Conversation Maps on psychosocial metrics, blood glucose control, and behavior change.
Conclusion
Using Diabetes Conversation Maps has the advantages of relieving distress, increasing self-efficacy, and improving 3-month A1C compared to traditional education in Chinese patients with type 2 diabetes.
Acknowledgments
The authors appreciate Ms Xiaodan Yuan and Ms Lin Liu for proofreading the article.
Disclosure
The authors have no conflicts of interest to disclose.
References
Xu Y, Wang L, He J, et al. Prevalence and control of diabetes in Chinese adults. JAMA. 2013;310(9):948–959. | ||
Haas L, Maryniuk M, Beck J, et al. National standards for diabetes self-management education and support. Diabetes Care. 2013;36 Suppl 1:S100–S108. | ||
Tang TS, Gillard ML, Funnell MM, et al. Developing a new generation of ongoing: Diabetes self-management support interventions: a preliminary report. Diabetes Educ. 2005;31(1):91–97. | ||
Funnell MM, Nwankwo R, Gillard ML, Anderson RM, Tang TS. Implementing an empowerment-based diabetes self-management education program. Diabetes Educ. 2005;31(1):53, 55–61. | ||
Rubin RR, Peyrot M, Saudek CD. The effect of a diabetes education program incorporating coping skills training on emotional well-being and diabetes self-efficacy. Diabetes Educ. 1993;19(3):210–214. | ||
Trento M, Passera P, Borgo E, et al. A 5-year randomized controlled study of learning, problem solving ability, and quality of life modifications in people with type 2 diabetes managed by group care. Diabetes Care. 2004;27(3):670–675. | ||
Izquierdo RE, Knudson PE, Meyer S, Kearns J, Ploutz-Snyder R, Weinstock RS. A comparison of diabetes education administered through telemedicine versus in person. Diabetes Care. 2003;26(4):1002–1007. | ||
Garrett N, Hageman CM, Sibley SD, et al. The effectiveness of an interactive small group diabetes intervention in improving knowledge, feeling of control, and behavior. Health Promot Pract. 2005;6(3):320–328. | ||
Lou QQ, Zhu WY. [Reflecting China’s diabetes education by learning US’s experience]. Nursing and Rehabilitation. 2008;7(9):647–649. Chinese. | ||
Reaney M, Eichorst B, Gorman P. From acorns to oak trees: the development and theoretical underpinnings of diabetes conversation map education tools. Diabetes Spectrum. 2012;25(2):111–116. | ||
Penalba M, Moreno L, Cobo A, et al. Impact of the «Conversation Map™» tools on understanding of diabetes by Spanish patients with type 2 diabetes mellitus: a randomized, comparative study. Endocrinol Nutr. 2014;61(10):505–515. | ||
Chinenye S, Young EE. Diabetes conversation map in Nigeria: A new socioeducational tool in diabetes care. Indian J Endocrinol Metab. 2013;17(6):1009–1011. | ||
Sperl-Hillen J, Beaton S, Fernandes O, et al. Comparative effectiveness of patient education methods for type 2 diabetes: a randomized controlled trial. Arch Intern Med. 2011;171(22):2001–2010. | ||
Ciardullo AV, Daghio MM, Fattori G, Giudici G, Rossii L, Vagnini C. Un efficace strumento per l’autoeducazione terapeutica del paziente diabetico: la Conversation MAP©. L’esperienza del Centro di Diabetologia di Carpi. [Effectiveness of the kit Conversation Map in the therapeutic education of diabetic people attending the Diabetes Unit in Carpi, Italy]. Recenti Prog Med. 2010;101(12):471–474. Italian. | ||
Guo XH, Yuan L, Lou QQ, et al. A nationwide survey of diabetes education, self-management and glycemic control in patients with type 2 diabetes in China. Chin Med J (Engl). 2012;125(23):4175–4180. | ||
Li BH, Zhang C, Zhu WD. [Impact of the Conversation Map tools on glycemic control in patients with type 2 diabetes]. Chinese Journal of Nursing. 2011;46(1):48–50. Chinese. | ||
Hu P, Li M, Xu R. [Impact of the Conversation Map tools on healthy diet and exercise in patients with diabetes]. Journal of Nursing Science. 2011;26(7):75–77. Chinese. | ||
Yan YF, Hou HR, Yang L. [Impact of the Conversation Map tools on self-management in elder patients with diabetes]. Journal of Nursing Science. 2010;25(15):42–44. Chinese. | ||
Yang Q, Liu XQ. [Development and validation of the Chinese version of diabetes distress scale]. Journal of Nursing (China). 2010;17(9A):8–10. Chinese. | ||
Wang CK, Hu ZF, Liu Y. [Development and validation of the Chinese version of general self-efficacy scale]. Chinese Journal of Applied Psychology. 2001;7(1):37–40. Chinese. | ||
Hu BB, Lou QQ, Tian Y, Zhang QW, Zhu JY. [Empowerment and its influencing factors among diabetes inpatients]. Chinese Journal of Nursing. 2011;46(3):225–228. Chinese. | ||
Xia P, Li N, Hau KT, Liu C, Lu Y. Quality of life of Chinese urban community residents: a psychometric study of the mainland Chinese version of the WHOQOL-BREF. BMC Med Res Methodol. 2012;12:37. | ||
Polonsky WH, Fisher L, Earles J, et al. Assessing psychosocial distress in diabetes: development of diabetes distress scale. Diabetes Care. 2005;28(3):626–631. | ||
Anderson RM, Fitzgerald JT, Gruppen LD, Funnell MM, Oh MS. The Diabetes Empowerment Scale-Short Form (DES-SF). Diabetes Care. 2003;26(5):1641–1642. | ||
Anderson RM, Funnell MM, Fitzgerald JT, Marrero DG. The diabetes empowerment scale a measure of psychosocial efficacy. Diabetes Care. 2000;23(6):739–743. | ||
Belton AB. Conversation maps in Canada: the first 2 years. Diabetes Spectrum. 2008;21(2):139–142. | ||
Fernandes OD, Worley AV, Sperl-Hillen J, Beaton SJ, Lavin-Tompkins J, Glasrud P. Educator experience with the U.S. diabetes conversation map® education program in the journey for control of diabetes: the IDEA study. Diabetes Spectrum. 2010;23(3):194–198. | ||
Bandura A. Social Foundations of Thought and Action: A Cognitive Social Theory. Englewood Cliffs: Prentice-Hall; 1986. | ||
Funnell MM, Brown TL, Childs BP, et al. National standards for diabetes self-management education. Diabetes Care. 2009;32 Suppl 1:S87–S94. | ||
Norris SL, Lau J, Smith SJ, Schmid CH, Engelgau MM. Self-management education for adults with type 2 diabetes: a meta-analysis of the effect on glycemic control. Diabetes Care. 2002;25(7):1159–1171. | ||
Norris SL, Engelgau MM, Narayan KM. Effectiveness of self-management training in type 2 diabetes: a systematic review of randomized controlled trials. Diabetes Care. 2001;24(3):561–587. |
 © 2016 The Author(s). This work is published and licensed by Dove Medical Press Limited. The full terms of this license are available at https://www.dovepress.com/terms.php and incorporate the Creative Commons Attribution - Non Commercial (unported, v3.0) License.
By accessing the work you hereby accept the Terms. Non-commercial uses of the work are permitted without any further permission from Dove Medical Press Limited, provided the work is properly attributed. For permission for commercial use of this work, please see paragraphs 4.2 and 5 of our Terms.
© 2016 The Author(s). This work is published and licensed by Dove Medical Press Limited. The full terms of this license are available at https://www.dovepress.com/terms.php and incorporate the Creative Commons Attribution - Non Commercial (unported, v3.0) License.
By accessing the work you hereby accept the Terms. Non-commercial uses of the work are permitted without any further permission from Dove Medical Press Limited, provided the work is properly attributed. For permission for commercial use of this work, please see paragraphs 4.2 and 5 of our Terms.