")
Back to Journals » Pragmatic and Observational Research » Volume 8
Impact of primary care exercise referral schemes on the health of patients with obesity
Authors Parretti HM , Bartington SE , Badcock T, Hughes L, Duda JL , Jolly K
Received 6 March 2017
Accepted for publication 23 May 2017
Published 21 September 2017 Volume 2017:8 Pages 189—201
DOI https://doi.org/10.2147/POR.S118648
Checked for plagiarism Yes
Review by Single anonymous peer review
Peer reviewer comments 2
Editor who approved publication: Professor David Price
Helen M Parretti,1 Suzanne E Bartington,1 Tim Badcock,1 Lucy Hughes,1 Joan L Duda,2 Kate Jolly1
1Institute of Applied Health Research, 2School of Sport, Exercise and Rehabilitation Sciences, University of Birmingham, Birmingham, West Midlands, UK
Abstract: Primary care exercise referral schemes (ERSs) are a potentially useful setting to promote physical activity (PA). It is not established, however, whether interventions to increase PA, such as ERSs, have differing health outcomes according to the participants’ body mass index (BMI). This paper summarizes evidence for the impact of primary care ERSs on the health of people with obesity and reports findings of a reanalysis of the EMPOWER study, providing the first data to report differential outcomes of ERSs by BMI category. Our literature review revealed a paucity of published data. A 2011 Health Technology Assessment review and 2015 update were identified, but normal-weight participants were neither excluded nor were results stratified by weight in the included studies. A study of the effect of exercise referral in overweight women reported a significantly greater increase in PA levels in the ERS group than the control group at 3 months. Reanalysis of the EMPOWER study data showed a significant improvement in PA at 3 months in both obese and overweight/normal BMI groups, with the effect size attenuated to 6 months. There was no significant difference from baseline to 6 months in blood pressure for either BMI category. At 6 months, there was a significant decrease in weight from baseline for the obese category. Comparison of crude mean differences between BMI groups revealed a significant mean difference in PA at 3 months favoring the overweight/normal BMI group, but not at 6 months. There were no further significant differences in unadjusted or adjusted mean differences for other outcomes at follow-up. We report some evidence of a differential impact of ERS on PA by BMI category. However, the effect of ERSs in primary care for patients with obesity remains unclear due to the small number of published studies that have reported outcomes by BMI category. Further research is needed.
Keywords: primary care, exercise referral scheme, overweight, obesity
Background
The 2011 guidelines issued by the chief medical officers of the four UK countries encourage adults to undertake at least 150 minutes of moderate physical activity (PA) or 75 minutes of vigorous activity in bouts of 10 minutes or longer, or a combination of the two.1 It is preferred that the activity is spread over the week, such as 30 minutes of moderate activity five times a week. The UK guidance is in keeping with other national guidance.2–4 These updated guidelines recognize that the overall volume of PA is more important than the type or frequency and also include recommendations on muscle-strengthening activities as well as those that may improve balance and coordination.
However, the most recent data (2012) from the Health Survey for England show that although there has been an increase in those meeting the recommended activity levels since 2008, still only 43% of men and 32% of women self-report PA that meets government recommendations (these figures were 32% and 21% in 2008, respectively).5 Low level of PA is the fourth most important risk factor for noncommunicable diseases (after smoking, hypertension and hyperglycemia). It accounts for 6% of the burden of disease from ischemic heart disease, 7% of type 2 diabetes and 10% of breast and colon cancers worldwide.6 In 2008, it was estimated to have caused 9% of premature mortality worldwide (>5.3 million deaths).6 Direct costs to the UK National Health Service due to physical inactivity have been estimated to be £1.1 billion, with indirect costs to society increasing this to £8.2 billion.7 Overweight and obesity are also known to be associated with higher all-cause mortality in a linear relationship, with a recent large meta-analysis of 239 prospective studies reporting hazard ratios for all-cause mortality of 1.45 (95% confidence interval [CI] 1.41, 1.48), 1.94 (95% CI 1.87, 2.01) and 2.76 (95% CI 2.60, 2.92), for obesity grades 1, 2 and 3, respectively.8 Indeed, both physical inactivity and excess weight are independently associated with the risk of cardiovascular disease.9,10
There is good evidence for the benefits of PA in preventing diseases such as coronary heart disease, type 2 diabetes, depression, cancers, stroke and dementia.11,12 A recent meta-analysis for the Global Burden of Disease Study 2013 has explored the dose–response relationship and has shown that those who achieve PA levels several times higher than recommendations have a significant reduction in the risk of breast cancer, colon cancer, diabetes, ischemic heart disease and ischemic stroke. However, most health gain occurs at relatively lower levels of activity (up to 3000-4000 metabolic equivalent of task [MET] minutes/week).13 In addition, a large meta-analysis of cohort studies has reported that achievement of 30 minutes of moderate-intensity PA five times a week (self-reported) is associated with a 19% reduction in all-cause mortality (95% CI 15, 24).14 The effects of PA specifically in overweight or obese populations have also been investigated.15 Interventional studies have shown relatively modest reduction in weight with structured PA programs,15 although a trial of cardiac rehabilitation patients recently reported twice the weight loss in the group randomized to intensive counseling and exercise program compared with standard cardiac rehabilitation (8.2±4 vs 3.7±5 kg).16 Prospective studies have consistently found that fitness attenuates mortality risk, regardless of body weight.17–20 When stratified by weight, those with higher levels of PA or fitness have a lower risk for adverse outcomes compared to those who are inactive or unfit.17–19 It has also been reported that although the mortality risk associated with obesity is attenuated by higher levels of PA, it is not totally eliminated.18,19 Similarly, being lean does not counteract the increased risks associated with being physically inactive.18,19 Recently, studies have also started to challenge the assumption that PA is a determinant of adiposity,21 suggesting instead that adiposity could be a determinant of PA. In several longitudinal studies, baseline PA did not predict follow-up adiposity, although baseline adiposity did predict follow-up PA level.22,23
Multiple studies have investigated potential interventions to increase the PA levels in adults. These include self-monitoring interventions, home based interventions, supervised PA, one-to-one counseling, written information and telephone counseling interventions.24 A Cochrane review by Foster et al24 concluded that there is some evidence that interventions designed to increase PA can lead to moderate short- and mid-term increases in PA. However, due to the heterogeneity of the studies, only limited conclusions could be drawn about the effectiveness of individual components of the interventions. The authors did report that interventions which provide people with professional guidance about starting an exercise program together with ongoing support may be more effective in encouraging the uptake of PA.24
Primary care has been identified as a potentially useful setting to promote PA.25 One commonly used method is exercise referral schemes (ERSs) set in primary care. An exercise referral scheme is the practice of referring a person from primary care to a qualified exercise professional who uses relevant medical information about the person to develop a tailored program of PA usually lasting 10–12 weeks.26 The intention is that opportunities for exercise are provided and levels of PA will increase with resulting associated health benefits for the individual. Since the early 1990s, there has been growth in the number of ERSs in the UK.25 By 2005, 89% of primary care organizations in England ran an ERS, making it one of the most common primary care interventions for PA.27
The UK National Institute for Health and Care Excellence (NICE) updated its guidance on ERSs in 2014.28 This guidance includes separate recommendations for those who are physically inactive, but healthy and for those physically inactive, but with a health condition or risk factors. At present, NICE recommends that commissioners should not fund ERSs for those who are inactive, but healthy and also that primary care practitioners should not refer these people to an ERS.28 For those who are physically inactive, but also have an existing health condition or factors that put them at risk of ill health, NICE recommends that ERS can be funded and primary care professionals can refer these people to such schemes, provided the scheme incorporates the core techniques outlined in recommendations 7–10 of NICE public health guidance 49 (Behavior change: individual approaches), such as agreeing goals, monitoring progress and providing feedback, and developing coping strategies to prevent relapse.28,29 However, there remain some unanswered questions, such as whether interventions to increase PA have differing health and behavioral outcomes according to the participant’s body mass index (BMI) and whether adherence varies.
This paper presents a review of the best current evidence from randomized controlled trials (RCTs) for the health benefits of primary care ERSs in adults who are overweight or obese, followed by a reanalysis of the EMPOWER study30 to investigate the effect of exercise referral on health and behavioral outcomes by BMI.
The EMPOWER study
The EMPOWER study was a cluster RCT comparing two models of exercise referral: standard provision and an autonomy supportive approach. The interventions and study design have been described in detail previously.30 In brief, 347 participants referred from primary care were recruited. Participants had two or more risk factors for ischemic heart disease, a long-term medical condition, were at risk of osteoporosis, had borderline hypertension or were perceived by the referring general practitioner or practice nurse to be motivated to increase their PA. Participants in all BMI categories were included. A number of medical exclusions applied.30 The exercise referral was delivered in 13 leisure centers by 14 individual health and fitness advisors (HFAs).
Primary and secondary outcomes including BMI were measured at baseline. Participants were followed up at 3 and 6 months from baseline. The primary outcome was the self-reported 7-day PA recall (7-day PAR).31 Time spent in moderate or vigorous PA and time spent in moderate or vigorous activity excluding walking were calculated, since examination of the follow-up data suggested that walking had been over-reported. Secondary outcomes included self-reported PA,31 quality of life32 (QoL), anxiety,33 depression,33 vitality,34 systolic blood pressure (SBP), diastolic blood pressure (DBP) and weight.
Interventions
The standard provision consisted of an hour consultation at a leisure center with the HFA, which included assessment of recent PA. Participants were then offered a range of physical opportunities within either the leisure center or community and agreed an individual program of activity. The HFA offered support as required over 10–12 weeks. The autonomy supportive ERS was based on self-determination theory and aimed to integrate PA with life values (full details in Duda et al30). Participants were offered an initial consultation and a self-management exercise promotion booklet. Interactions in person or by phone were planned after 1 and 2 months with an exit consultation at 3 months to plan for maintenance of activity.
Findings from the RCT
While PA significantly increased in both study groups, there was no significant difference between the groups using an analysis that adjusted for the clustered nature of the study, however, the trial was underpowered. Full results have been reported previously.30
Methods
Literature review
An initial scoping search of literature databases was conducted to identify studies and reviews investigating the health benefits of ERSs in primary care for adults who are overweight or obese using keywords such as “exercise referral”, “exercise on prescription”, “obesity”, “overweight”, and “primary care”. This identified a health technology assessment (HTA) review carried out by Pavey et al35 and published in 2011. An update to this review was published in 2015.26 The published search strategies from this HTA review were then used to search Medline, Psychinfo, EMBASE and Sportsdiscus from June 2013 to October 2016 in order to identify any new RCTs that may have been published since the 2015 HTA review was conducted. We also handsearched the list of excluded studies from the HTA review to ensure that there were no relevant studies that either included only overweight or obese adult participants or stratified results by BMI, but were excluded from the HTA review (including non-RCTs).
Our inclusion criteria for this review were any RCT, where the intervention was a referral to an ERS in primary care compared with any control, or non-RCTs. We did not exclude studies where the scheme was for rehabilitation purposes or studies in which participants had a specific medical condition. However, the included studies were required to report outcomes stratified by BMI category or only include participants with a BMI ≥25 kg/m2. Participants in the studies were also required to be adults ≥18 years. We were primarily interested in studies that reported health-related outcomes such as weight, BMI, % body fat, SBP, DBP, glucose, lipids, glycated hemoglobin or PA levels. We used the definition of an ERS as given in the HTA review (as stated above). Abstracts were screened by HMP, KJ, LH and TB. Data extraction from any full paper that met the above inclusion criteria was conducted by HMP.
Observational analysis from the EMPOWER study
Given that all EMPOWER study participants received an exercise referral scheme, this provides an opportunity to explore whether the effects of ERS vary by BMI category. Therefore, the aim of this observational study was to explore whether primary (PA) and secondary (anxiety, depression, vitality, QoL, SBP, DBP, weight) outcomes of exercise referral vary by BMI category. BMI was calculated from the weight measured by calibrated Tanita scales and the height measured using a Leicester height measure.
Statistical analysis
The data were analyzed as an observational cohort in which all participants attended an initial exercise referral consultation. To categorize participants by BMI, we used the cut-offs defined by NICE for black and minority ethnic groups (PH46)36 and the standard cut-offs for white UK and Europeans. Applying this classification, participants were categorized as “overweight” if they had a baseline BMI 25–29.99 kg/m2 (23–27.49 kg/m2 if they self-reported their ethnicity as black or Asian) and “obese” if they had a BMI ≥30 kg/m2 (white British or Irish) or ≥27.5 kg/m2 (black or Asian). Missing data at 3- and 6-month follow-up were imputed using a baseline observation carried forward method. Due to only 29 participants having a BMI under 25 kg/m2, a binary variable for BMI status was created, including a category of normal and overweight and a category of obese participants.
Chi-square tests were used to test for differences in baseline characteristics (age, gender, Index of Multiple Deprivation [IMD] quintile, current smoking status) by baseline BMI category. Unadjusted analyses were conducted to calculate changes in outcomes from baseline to 3 and 6 months and mean differences in changes for each BMI category (paired t-tests). Linear multiple regression models were used to identify whether BMI category was an independent predictor of primary and secondary outcome measures at 3- and 6-month follow-up, after adjustment for confounding factors (trial arm, age group, gender, ethnic group, IMD level and smoking status). All multivariate analyses included the study arm as a covariate. Analyses were performed using Stata V14 (Texas Corp.).
Results
Literature review
The initial scoping review identified an HTA review published in 2011, with an update published in 2015. This updated systematic review and economic evaluation of ERSs in primary care included any RCT published between October 2009 and June 2013 with participants who were adults with or without a medical condition and deemed suitable for ERS. Outcomes included PA, physical fitness, health-related outcomes, adverse events, uptake and adherence. The interventions were required to be an ERS or exercise program that was more intensive than simple advice and needed to include a combination of counseling, written materials and supervised exercise; comparator was any control.26,35 The results of eight RCTs that included a total of 5190 participants were combined, with six studies comparing ERS to usual care. The authors concluded that compared with usual care, ERSs result in a small increase in the number of participants meeting PA recommendations. They did report on weight-related outcomes such as weight, % body fat and blood pressure, but found no changes in these outcomes with ERS.26,35 When compared to usual care, the number achieving 90–150 minutes/week PA in the ERS group was RR 1.08 (95% CI 1.00, 1.17, n=2607) and participants allocated to ERS achieved only 6.78 (95% CI −9.32, 22.88) more minutes of at least moderate PA per week at 6–12 months follow-up. Mean differences at 6–12 months follow-up in SBP and DBP were −0.05 (95% CI −1.84, 1.74) and 0.11 (95% CI −0.92, 1.13) mmHg, respectively. There was no difference in mean BMI 0.01 kg/m2 (95% CI −0.14, 0.16) or percentage fat (mean difference −0.08%, 95% CI −0.23, 0.07) at follow-up. Depression, measured by the Hospital Anxiety and Depression Scale (HADS), was significantly lower in the ERS group compared to usual care (standardized mean difference −0.82, 95% CI −1.28, −0.35), but there was no significant difference in anxiety scores (standardized mean difference −4.12, 95% CI −11.52, 3.28). The authors also concluded that the upfront costs of ERS outweighed the benefits, but acknowledged that there was uncertainty in their estimates of health benefit.26,35 On average, participants in the studies included in this review were overweight (Table 1). Although the study by Stevens et al37 included in this review did not report baseline mean BMI data, they did report percentage of those with BMI <20 kg/m2 (4% intervention, 5% control), BMI 20–25 kg/m2 (50% intervention, 53% control) and BMI >25 kg/m2 (40% intervention, 42% control). However, normal-weight participants were not excluded from the studies included in the review and none of the studies reported results stratified by weight category. Therefore, no definite conclusions regarding the effect of ERS on the health of participants who are overweight or obese can be made from this review. None of the trials reported adherence to the ERS by BMI category.
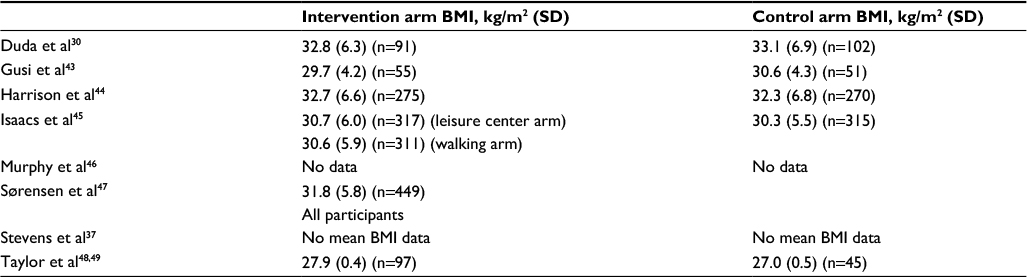 | Table 1 BMI baseline characteristics of the study participants in studies included in Campbell et al26 HTA review Abbreviations: BMI, body mass index; HTA, health technology assessment. |
The search strategies from this HTA review were then used to identify any new RCTs published since the HTA review had been conducted (Supplementary material). These literature searches (from 2013 to 2016) identified 3043 abstracts. In addition, we handsearched the excluded studies list from the HTA review for nonrandomized studies that might be potentially included in this review. Screening of these abstracts and the HTA-excluded studies list identified only two new studies not included in the HTA review. The first was a small study (n=34) conducted by Taylor et al in 2011, which recruited African American men through a prostate cancer screening program, family physicians, urologists and through media advertisements into a pilot RCT.38 Participants were eligible if male, aged 40–70 years and African American or African descent with a BMI between 25 and 35 kg/m2 and a sedentary lifestyle for the last 2 years. They excluded those with history of cardiovascular disease, metabolic disease, acute infection or chronic infectious disease, resting blood pressure ≥140/90 mmHg, uncontrolled diabetes and taking medications that affect heart response or orthopedic condition that may preclude participation. This paper described an analysis of only the intervention group and focused on adherence to the intervention. The exercise program required participants to undertake supervised exercise three times a week for 4 weeks in a medical center’s exercise laboratory. Training sessions consisted of 30 minutes of moderate-intensity aerobic exercise. Participants were defined as adherers if 75% (9 out of 12) sessions were completed. They did not report any weight or health-related outcomes. The baseline BMI of participants was 31.1 (SD 7.1) kg/m2, and 71% (12/17) completed at least 75% of sessions (adherers). Seven of these adherers had adherence rates of 100%. The study used a range of techniques to maximize adherence, such as providing a safe place to exercise, offering a variety of exercise modalities and facilitating transport or parking. The authors concluded that the adherence rates found for this supervised exercise intervention in African American men were favorable and similar to those found in similar supervised exercise interventions, but acknowledged that it would be of interest to explore longer-term adherence in a larger sample.38
The second study identified was an RCT conducted by Conroy et al in 2015 that recruited 99 inactive women aged 45–65 years to a PA intervention from primary care centers in the USA.39 They were overweight or obese (BMI ≥25 kg/m2). Exclusion criteria included unstable cardiac or pulmonary disease, poorly controlled hypertension, primary care physician unwilling to allow moderate PA and participant unable to perform moderate PA. The intervention group (n=48) had 12 weekly sessions of 30-minute discussions and 30 minutes of moderate-intensity PA. The control group (n=50) was given a manual for independent use. Outcomes were measured at 3 and 12 months with PA and weight as the primary outcomes of the trial. PA levels were measured using the 1-month version of the Modifiable Activity Questionnaire administered by a trained staff member. The baseline mean BMI (SD) was 36.1 (6.0) and 33.4 (5.4) kg/m2 in the intervention and control groups, respectively. Follow-up was 76% at 3 months and 86% at 12 months. At 3 months, the intervention group had a significantly greater increase in PA levels (7.5 compared with 1.5 MET-hours/week, P=0.02) than the control group, but there was no significant difference in change in weight between the groups. However, at 12 months, the difference between the PA levels of the groups was no longer significant (4.7 compared with 0.7 MET-hour/week, P=0.38). No significant differences between groups were found in BMI or waist circumference at any time point; however, at 12 months, there were significant differences between groups in SBP and DBP with the intervention group having a smaller increase in blood pressure.39 Overall, the authors concluded that the intervention successfully increased PA levels in obese middle-aged women in the short term, but that there was no significant change in body weight.
Reanalysis of the EMPOWER study
The study population
Of the 347 participants recruited to the EMPOWER study, 331 had a valid BMI at baseline and comprise the sample for this study. Overall, 230 (69.5%) were categorized as obese, 72 (21.8%) as overweight and 29 (8.8%) as normal weight. Definitions of BMI status are given in Table 2. Descriptive baseline statistics by BMI category are shown in Table 3.
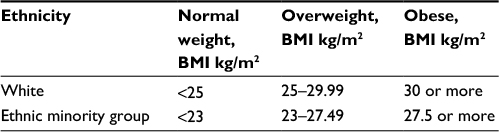 | Table 2 Definitions of BMI categories Abbreviation: BMI, body mass index. |
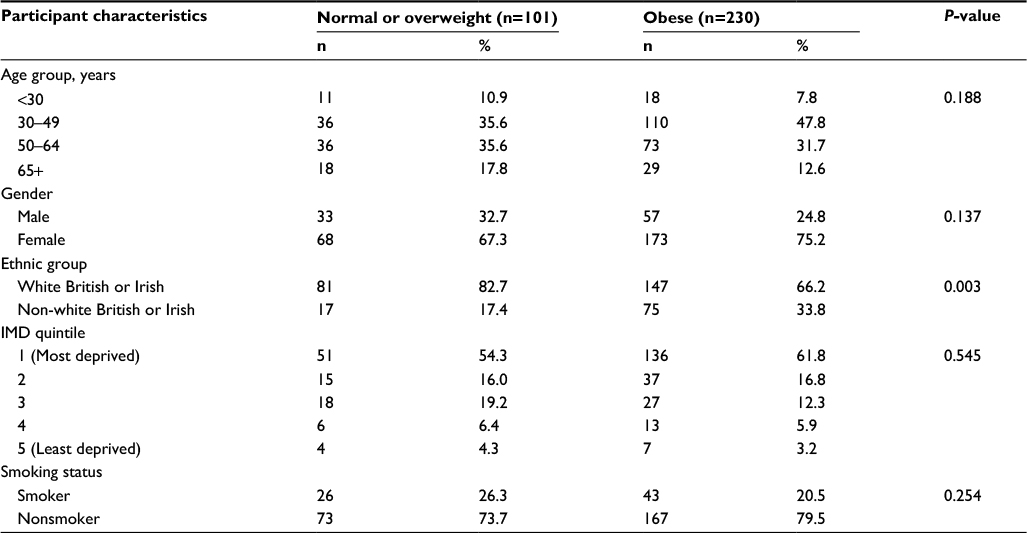 | Table 3 Baseline characteristics of EMPOWER study participants by BMI category* Notes: Missing data: ethnic group (n=11), IMD (n=17), smoking status (n=22). *PH46 classification. Abbreviations: BMI, body mass index; IMD, Index of Multiple Deprivation. |
The majority (241, 72.8%) were female, mean age (SD) 49.2 (13.7) years, 90 (27.2%) were from non-British or Irish white ethnic groups and 187 (59.6%) lived in areas within the highest deprivation quintile. We observed a significant difference in BMI status by ethnic group, with a significantly higher proportion of non-white ethnic group participants who were obese at baseline (P=0.003). At initial assessment, 69.5% (230) of the participants reported doing less than the government recommendation of 150 minutes of moderate PA, including walking, each week, with no difference in baseline activity reported by obese participants (mean 135, SD 265.7) compared to those with normal or overweight BMI (mean 124, SD 154.5). Using a cut-off of >11 on the HADS subscales,33 19% (63) of the participants were identified as having probable clinical depression and 33.8% (112) as having probable anxiety. Overall study follow-up was 75.8% (n=251) at 3 months and 56.8% (n=188) at 6 months. There were no significant differences in follow-up rates at 3 months by BMI category (P=0.201); however, participants who were obese at baseline were less likely than normal/overweight participants to complete 6-month follow-up (53.0%, n=122 vs 65.4%, n=66; P=0.037).
Behavioral, health and psychologic outcomes to 3 months: within groups
Unadjusted analyses showed that from baseline to 3 months, participants who were normal or overweight at baseline (n=101) exhibited a significant increase of 251 minutes (95% CI 186, 316) of self-reported moderate or vigorous PA and 142 minutes (95% CI 91, 192) of moderate/vigorous PA minus walking. Among participants who were obese at baseline (n=230), significant increases were observed in moderate or vigorous PA and moderate/vigorous PA minus walking of 163 minutes (95% CI 115, 211) and 97 minutes (95% CI 56, 138), respectively (Table 4).
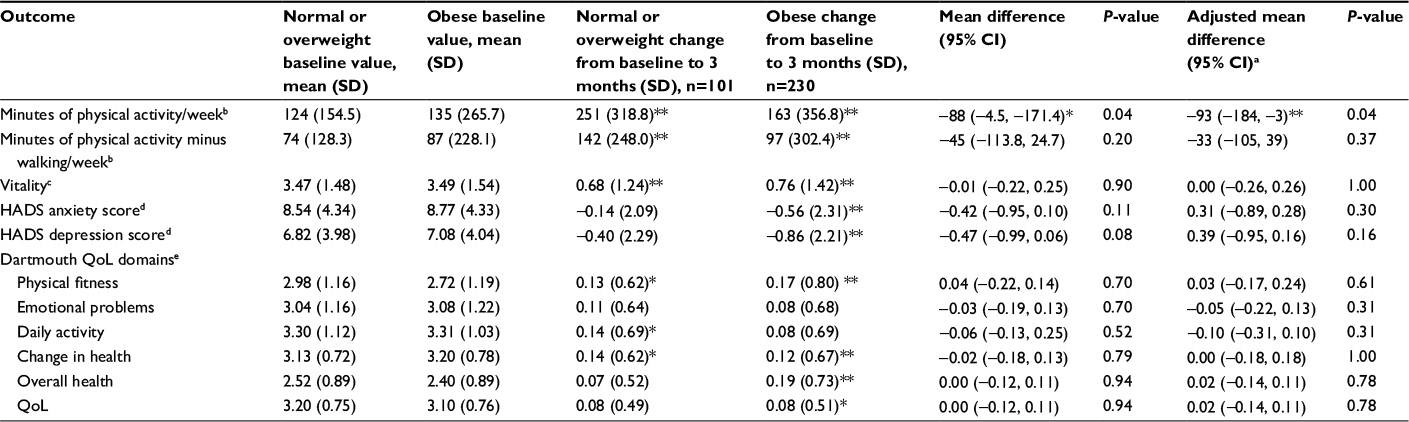 | Table 4 Within- and between-group changes in physical and psychologic outcomes between baseline and 3-month follow-up by BMI category Notes: aAdjusted for trial arm, age, gender, ethnic group, level of deprivation, smoking status. bActivity of at least moderate intensity. cPositive score associated with improved vitality. dPositive score associated with greater psychologic morbidity. ePositive score associated with improved quality of life. *P≤0.05, **P≤0.01 indicate whether change in slope from baseline to 6 months was significantly different from zero. Abbreviations: BMI, body mass index; CI, confidence interval; HADS, Hospital Anxiety and Depression Scale; QoL, quality of life. |
In addition, there were significant improvements from baseline to 3 months in vitality score as well as the physical fitness, daily activity and change in health Dartmouth QoL domains for those in the normal/overweight category. Those in the obese category also had a significant increase in vitality score, but differed from those in the normal/overweight category in which of the Dartmouth QoL domains showed a significant difference (physical fitness, change in health, overall health and QoL). Those in the obese BMI category also showed a significant decrease in HADS depression and anxiety scores, which was not seen in the normal/overweight category (Table 5).
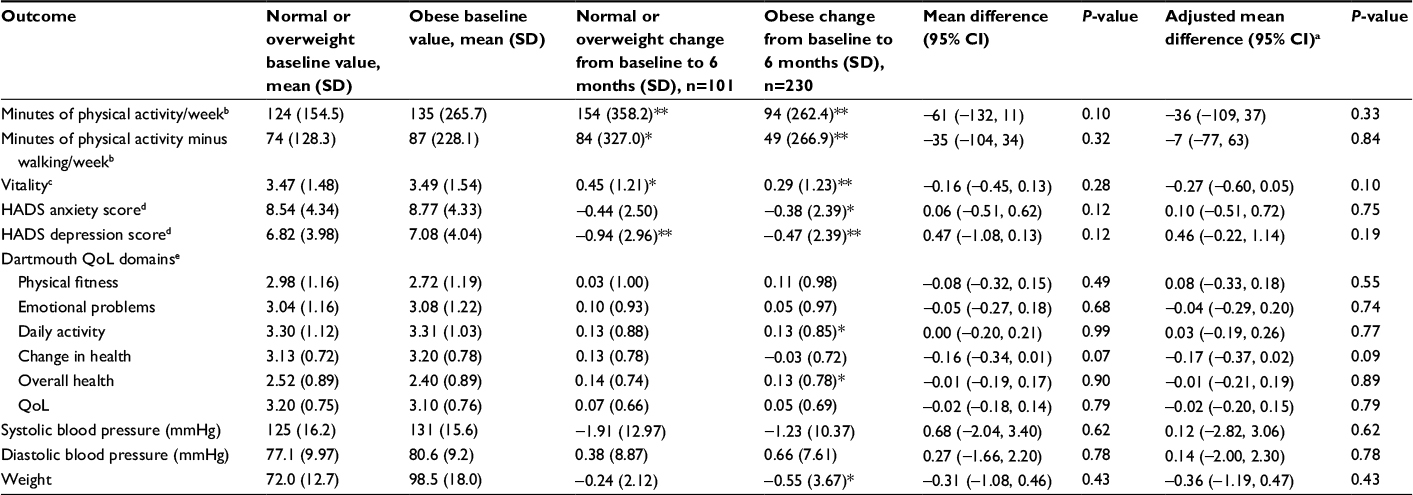 | Table 5 Within- and between-group changes in physical and psychologic outcomes between baseline and 6-month follow-up by BMI category Notes: aAdjusted for trial arm, age, gender, ethnic group, level of deprivation, smoking status. bActivity of at least moderate intensity. cPositive score associated with improved vitality. dPositive score associated with greater psychologic morbidity. ePositive score associated with improved quality of life. *P≤0.05, **P≤0.01 indicate whether change in slope from baseline to 6 months was significantly different from zero. Abbreviations: BMI, body mass index; CI, confidence interval; HADS, Hospital Anxiety and Depression Scale; QoL, quality of life. |
Behavioral, health and psychologic outcomes to 6 months: within groups
At 6-month follow-up, there were significant increases from baseline in self-reported moderate/vigorous PA among normal/overweight participants (mean change 154 minutes, 95% CI 82, 227) and PA excluding walking (mean change 84 minutes, 95% CI 18, 150). Within the obese participant group, we also observed smaller but significant increases in PA (mean 94 minutes, 95% CI 58, 129) and PA minus walking (mean 49 minutes, 95% CI 13, 85), as shown in Table 5. The increase in vitality remained significant for both BMI categories, although with an attenuated effect in the obese group than was observed at 3 months. There was a reduction in both HADS scores for the normal/overweight category (the difference from baseline in depression score was significant). Improvements in depression and anxiety scores from baseline for obese participants were smaller than at 3 months, but remained significant. Significant changes in Dartmouth daily activity and overall health scores were also observed among obese participants at 6-month follow-up. In general, there was an attenuation of effect size between 3 and 6 months for both BMI categories. Data were only available at 6 months for SBP, DBP and weight. There was no significant difference from baseline in blood pressure for either BMI category. At 6 months, there was a significant decrease in weight of −0.55 kg (95% CI −1.02, −0.07, P=0.03) from baseline for the obese category. The normal/overweight category also had a small decrease in weight (−0.24 kg [95% CI −0.67, 0.18, P=0.260]), but this was not significant (Table 5).
Comparison of outcomes between obese and normal/overweight participants
Comparison of crude mean differences in outcome measures between BMI groups revealed a significant mean difference in PA at 3 months (−88 minutes, 95% CI −171.4, −4.5, P=0.04), which remained significant after adjustment for confounding factors (−93 minutes, 95% CI −105, 39), as shown in Table 4. At 6-month follow-up, the unadjusted and adjusted mean differences in PA between the BMI groups attenuated and did not remain significant (unadjusted mean difference −61 minutes, 95% CI −132, 11, P=0.10; adjusted mean difference −36 minutes, 95% CI −109, 37, P=0.33), as shown in Table 5. There were no further significant differences in unadjusted or adjusted mean differences for other primary or secondary outcome measures at 3- or 6-month follow-up.
Discussion
Our review revealed a paucity of data for the impact of ERSs in primary care on PA and physical and psychologic health of patients with obesity. A recent HTA review was identified, which reported several health-related outcomes including weight and body fat26,35 and the participants in the studies included in this review were on average overweight or obese at baseline. However, the included studies did not exclude normal-weight patients or stratify the results by weight. Therefore, no definite conclusions regarding the impact of ERS on the health of patients with obesity could be made from the review. Two studies published after the HTA review was conducted were identified that did exclude normal-weight participants. However, the pilot study by Taylor et al38 did not report any health-related outcomes, although they did report good adherence to their PA intervention. The study by Conroy et al39 did find that those in the intervention group had a significantly greater increase in PA levels than the control group at 3 months, but this effect was not sustained at 12 months. In addition, no significant differences between groups were found in BMI or waist circumference at any time point.39 However, at 12 months, there were significant differences between groups in SBP and DBP.39 The reanalysis of data from the EMPOWER study30 is consistent with the findings of Conroy in identifying a significant improvement in PA at 3 months follow-up in both the obese and overweight/normal BMI groups, with the effect size attenuated to 6 months follow-up. The EMPOWER study also adds to the literature by reporting improvements in mental health outcomes in the obese group at 3 and 6 months follow-up, including vitality, anxiety and depression scores and several QoL domains.
This literature review reports the current evidence for the impact of ERSs in primary care on the health of people with obesity. We have also reported new data to add to the current available evidence. However, the effect of ERSs in primary care for patients with obesity still remains unclear due to the small number of published studies that have reported outcomes by BMI category and subsequent overall paucity of evidence. The limitations of our review stem from a lack of evidence reporting outcomes of ERS by BMI status. We identified an HTA systematic review and used their search strategy to identify any new relevant RCTs published since the review. We also reviewed studies excluded from that review to identify any nonrandomized trials that may have reported outcomes of ERS by the category of BMI. The reanalysis of the EMPOWER study to explore this issue is the first data to report outcomes of ERS by the category of BMI, but due to a very small number of participants of normal weight, we were unable to compare outcomes of ERS in obese compared to normal-weight participants. While the trial was of two different approaches to ERS, we adjusted for this in our analyses. The EMPOWER study had 43% loss to follow-up at 6 months and we used a single imputation method of carrying forward the baseline observation for any subject who did not have a post-baseline outcome of interest. This is a more conservative method than using the last value carried forward or the mean value for the group, as it is likely that the participants with missing follow-up data were less successful at behavior change. While the method is conservative, it provides a plausible lower boundary for the effect point estimate and is considered to have specific validity for obesity interventions.40
While there is observational evidence to suggest that PA should be effective in people of all BMI categories, it is also plausible that adherence to exercise and PA may differ by BMI category. People who are obese may report stigma in relation to their weight,41 may have greater numbers of comorbidities, particularly depression,42 which may also impact on the uptake and adherence of exercise. Unfortunately, we found no evidence from the included studies to explore the relationship between BMI and adherence to ERS.
Future research is needed, such as high-quality RCTs or an individual patient data analysis, to investigate the impact of primary care ERSs in people with obesity and whether these schemes result in physical and psychologic health benefit for this cohort of patients. The cost-effectiveness of such schemes also needs to be investigated in future studies.
Acknowledgments
KJ is part funded by the Collaboration for Leadership in Applied Health Research and Care West Midlands. HMP is an NIHR academic clinical lecturer. SB is a Clinical Research Fellow funded by Health Education West Midlands. TB is an NIHR academic clinical fellow. The views expressed are those of the authors and not necessarily those of the NHS, the NIHR, the Department of Health or the University of Birmingham. The writing of the report and the decision to submit the article for publication rested with the authors from the University of Birmingham.
Disclosure
The authors report no conflicts of interest in this work.
References
Bull FC and the Expert Working Groups. Physical Activity Guidelines in the UK: Review and Recommendations 2010. Available from: https://www.gov.uk/government/uploads/system/uploads/attachment_data/file/213743/dh_128255.pdf. Accessed January 27, 2017. | ||
US Department of Health and Human Services. Physical Activity Guidelines for Americans 2008. Available from: https://health.gov/paguidelines/. Accessed February 3, 2017. | ||
Australian Government Department of Health. Physical Activity 2014. Available from: http://www.health.gov.au/internet/main/publishing.nsf/Content/phy-activity. Accessed February 3, 2017. | ||
Canadian Society for Exercise Physiology. Canadian Physical Activity Guidelines for Adults 18–64 years 2011. Available from: http://www.csep.ca/CMFIles/Guidelines/CSEP_PAGuidelines_adults_en.pdf. Accessed February 3, 2017. | ||
NHS Digital. Health Survey for England, 2015: trend tables [NS] 2016. Available from: http://www.content.digital.nhs.uk/catalogue/PUB22616. Accessed January 27, 2017. | ||
Lee IM, Shiroma EJ, Lobelo F, Puska P, Blair SN, Katzmarzyk PT; Lancet Physical Activity Series Working Group. Impact of physical inactivity on the world’s major non-communicable diseases. Lancet. 2012;380(9838):219–229. | ||
Allender S, Foster C, Scarborough P, Rayner M. The burden of physical activity-related ill health in the UK. J Epidemiol Community Health. 2007;61(4):344–348. | ||
Di Angelantonio E, Bhupathiraju ShN, Wormser D, et al; The Global BMI Mortality Collaboration. Body-mass index and all-cause mortality: individual-participant-data meta-analysis of 239 prospective studies in four continents. Lancet. 2016;388(10046):776–786. | ||
LaMonte MJ, Blair SN. Physical activity, cardiorespiratory fitness and adiposity: contributions to disease risk. Curr Opin Clin Nutr Metab Care. 2006;9(5):540–546. | ||
Katzmarzyk PT, Craig CL, Gauvin L. Adiposity, physical fitness and incident diabetes: the physical activity longitudinal study. Diabetologia. 2007;50(3):538–544. | ||
Reiner M, Niermann C, Jekauc D, Woll A. Long-term health benefits of physical activity – a systematic review of longitudinal studies. BMC Public Health. 2013;13(1):813. | ||
Office of Disease Prevention and Health Promotion. Physical Activity Guidelines for Americans 2008. Available from: https://health.gov/paguidelines/guidelines/default.aspx. Accessed February 3, 2017. | ||
Kyu HH, Bachman VF, Alexander LT, et al. Physical activity and risk of breast cancer, colon cancer, diabetes, ischemic heart disease, and ischemic stroke events: systematic review and dose-response meta-analysis for the Global Burden of Disease Study 2013. BMJ. 2016;354:i3857. | ||
Woodcock J, Franco OH, Orsini N, Roberts I. Non-vigorous physical activity and all-cause mortality: systematic review and meta-analysis of cohort studies. Int J Epidemiol. 2011;40(1):121–138. | ||
Jakicic JM. The effect of physical activity on body weight. Obesity. 2009;17(S3):S34–S38. | ||
Ades PA, Savage PD, Toth MJ, et al. High-calorie-expenditure exercise: a new approach to cardiac rehabilitation for overweight coronary patients. Circulation. 2009;119(20):2671–2678. | ||
King GA, Fitzhugh EC, Bassett DR, et al. Relationship of leisure-time physical activity and occupational activity to the prevalence of obesity. Int J Obes. 2001;25(5):606–612. | ||
Hu FB, Willett WC, Li T, Stampfer MJ, Colditz GA, Manson JE. Adiposity as compared with physical activity in predicting mortality among women. N Engl J Med. 2004;351(26):2694–2703. | ||
Li TY, Rana JS, Manson JE, et al. Obesity as compared with physical activity in predicting risk of coronary heart disease in women. Circulation. 2006;113(4):499–506. | ||
Wei M, Kampert JB, Barlow CE, et al. Relationship between low cardiorespiratory fitness and mortality in normal-weight, overweight, and obese men. JAMA. 1999;282(16):1547–1553. | ||
Ness AR, Leary SD, Mattocks C, et al. Objectively measured physical activity and fat mass in a large cohort of children. PLoS Med. 2007;4(3):e97. | ||
Ekelund U, Brage S, Besson H, Sharp S, Wareham NJ. Time spent being sedentary and weight gain in healthy adults: reverse or bidirectional causality? Am J Clin Nutr. 2008;88(3):612–617. | ||
Metcalf BS, Hosking J, Jeffery AN, Voss LD, Henley W, Wilkin TJ. Fatness leads to inactivity, but inactivity does not lead to fatness: a longitudinal study in children (EarlyBird 45). Arch Dis Child. 2011;96(10):942–947. | ||
Foster C, Hillsdon M, Thorogood M, Kaur A, Wedatilake T. Interventions for promoting physical activity. Cochrane Database Syst Rev. 2005(1):CD003180. | ||
London Research Department. Exercise on Prescription: A Report for the Chartered Society of Physiotherapists. London, UK: Labour Research Department; 2004. | ||
Campbell F, Holmes M, Everson-Hock E, et al. A systematic review and economic evaluation of exercise referral schemes in primary care: a short report. Health Technol Assess. 2015;19(60):1–110. | ||
Sowden SL, Raine R. Running along parallel lines: how political reality impedes the evaluation of public health interventions. A case study of exercise referral schemes in England. J Epidemiol Community Health. 2008;62(9):835–841. | ||
National Institute for Health and Care Excellence. Physical activity: exercise referral schemes. NICE guidance PH54 2014. Available from: https://www.nice.org.uk/guidance/ph54. Accessed January 30, 2017. | ||
National Institute for Health and Care Excellence. Behaviour change: individual approaches [PH49] 2014. Available from: https://www.nice.org.uk/guidance/PH49/. Accessed February 2, 2017. | ||
Duda JL, Williams GC, Ntoumanis N, et al. Effects of a standard provision versus an autonomy supportive exercise referral programme on physical activity, quality of life and well-being indicators: a cluster randomised controlled trial. Int J Behav Nutr Phys Act. 2014;11:10. | ||
Sallis JF, Haskell WL, Wood PD, et al. Physical Activity Assessment Methodology In The Five-City Project. Am J Epidemiol. 1985;121(1):91–106. | ||
Nelson E, Wasson J, Kirk J, et al. Assessment of function in routine clinical practice: Description of the coop chart method and preliminary findings. J Chronic Dis. 1987;40(Suppl 1):55S–63S. | ||
Zigmond A, Snaith R. The hospital anxiety and depression scale. Acta Psych Scand. 1983;67(6):361–370. | ||
Ryan RM, Frederick C. On energy, personality, and health: subjective vitality as a dynamic reflection of well-being. J Pers. 1997;65(3):529–565. | ||
Pavey TG, Anokye N, Taylor AH, et al. The clinical effectiveness and cost-effectiveness of exercise referral schemes: a systematic review and economic evaluation. Health Technol Assess. 2011;15(44):i-xii, 1–254. | ||
National Institute for Health and Care Excellence. BMI: preventing ill health and premature death in black, Asian and other minority ethnic groups [PH46] 2013. Available from: https://www.nice.org.uk/guidance/ph46. Accessed February 3, 2017. | ||
Stevens W, Hillsdon M, Thorogood M, McArdle D. Cost-effectiveness of a primary care based physical activity intervention in 45–74 year old men and women: a randomised controlled trial. Br J Sports Med. 1998;32(3):236–241. | ||
Taylor TR, Makambi K, Sween J, Roltsch M, Adams-Campbell LL. The effect of a supervised exercise trial on exercise adherence among African American Men: a pilot study. J Natl Med Assoc. 2011;103(6):488–491. | ||
Conroy MB, Sward KL, Spadaro KC, et al. Effectiveness of a physical activity and weight loss intervention for middle-aged women: healthy bodies, healthy hearts randomized trial. J Gen Intern Med. 2015;30(2):207–213. | ||
Ware JH. Interpreting incomplete data in studies of diet and weight loss. N Engl J Med. 2003;348(21):2136–2137. | ||
Papadopoulos S, Brennan L. Correlates of weight stigma in adults with overweight and obesity: a systematic literature review. Obesity. 2015;23(9):1743–1760. | ||
Kopelman P. Health risks associated with overweight and obesity. Obes Rev. 2007;8(Suppl 1):13–17. | ||
Gusi N, Reyes MC, Gonzalez-Guerrero JL, Herrera E, Garcia JM. Cost-utility of a walking programme for moderately depressed, obese, or overweight elderly women in primary care: a randomised controlled trial. BMC Public Health. 2008;8(1):231. | ||
Harrison RA, Roberts C, Elton PJ. Does primary care referral to an exercise programme increase physical activity one year later? A randomized controlled trial. J Public Health (Oxf). 2005;27(1):25–32. | ||
Isaacs A, Critchley J, Tai S, et al. Exercise Evaluation Randomised Trial (EXERT): a randomised trial comparing GP referral for leisure centre-based exercise, community-based walking and advice only. Health Technol Assess. 2007;11(10):1–165. | ||
Murphy SM, Edwards RT, Williams N, et al. An evaluation of the effectiveness and cost effectiveness of the National Exercise Referral Scheme in Wales, UK: a randomised controlled trial of a public health policy initiative. J Epidemiol Community Health. 2012;66(8):745–753. | ||
Sørensen JB, Kragstrup J, Skovgaard T, Puggaard L. Exercise on prescription: a randomized study on the effect of counseling vs counseling and supervised exercise. Scand J Med Sci Sports. 2008;18(3):288–297. | ||
Taylor AH, Doust J, Webborn N. Randomised controlled trial to examine the effects of a GP exercise referral programme in Hailsham, East Sussex, on modifiable coronary heart disease risk factors. J Epidemiol Community Health. 1998;52(9):595–601. | ||
Taylor AH, Fox KR. Effectiveness of a primary care exercise referral intervention for changing physical self-perception over 9 months. Health Psychol. 2005;24(1):11–21. |
Supplementary material
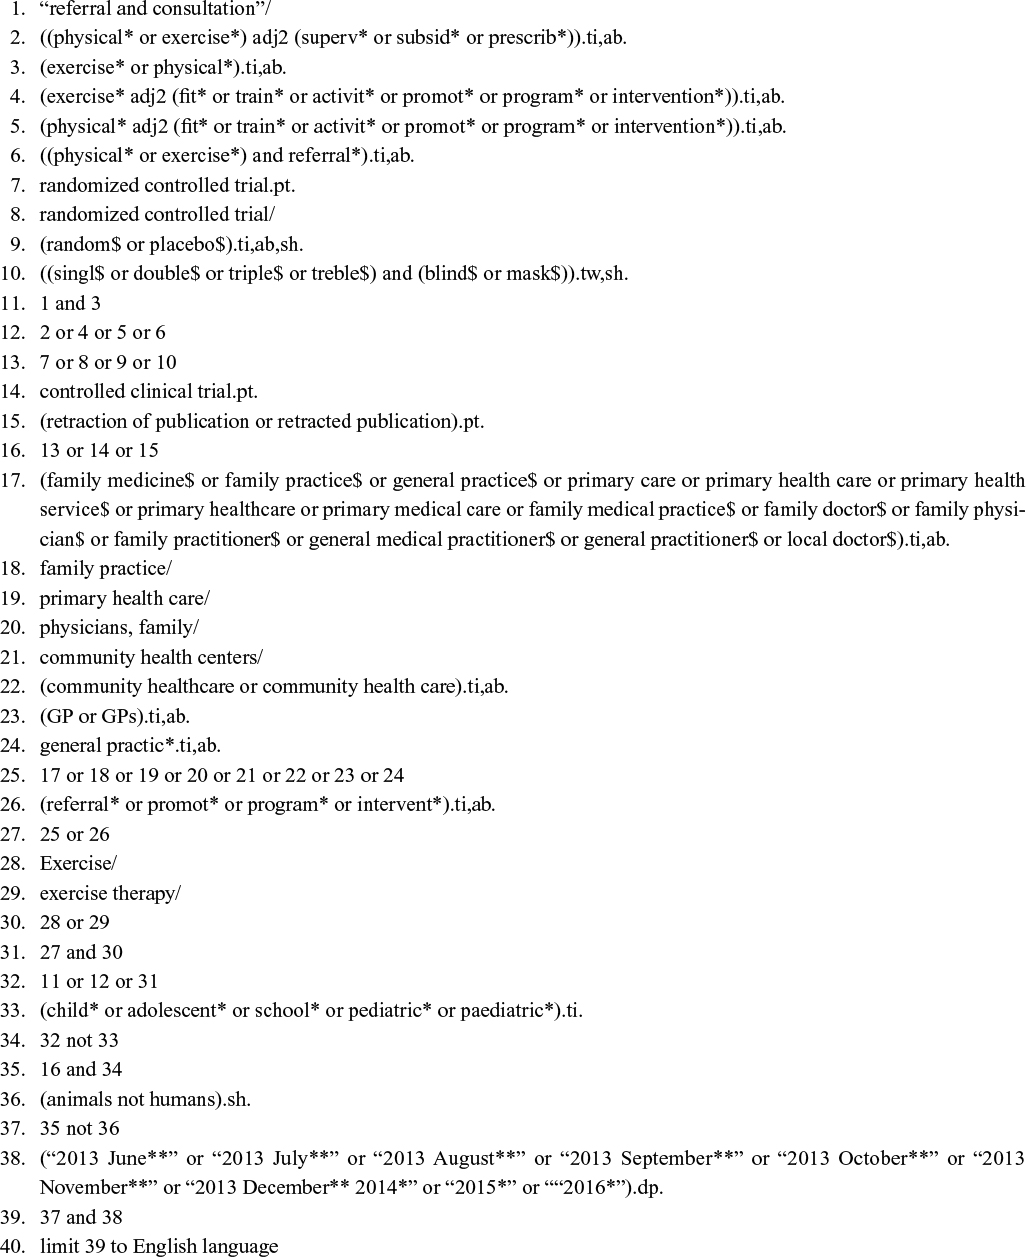 | Medline search strategy |
 © 2017 The Author(s). This work is published and licensed by Dove Medical Press Limited. The full terms of this license are available at https://www.dovepress.com/terms.php and incorporate the Creative Commons Attribution - Non Commercial (unported, v3.0) License.
By accessing the work you hereby accept the Terms. Non-commercial uses of the work are permitted without any further permission from Dove Medical Press Limited, provided the work is properly attributed. For permission for commercial use of this work, please see paragraphs 4.2 and 5 of our Terms.
© 2017 The Author(s). This work is published and licensed by Dove Medical Press Limited. The full terms of this license are available at https://www.dovepress.com/terms.php and incorporate the Creative Commons Attribution - Non Commercial (unported, v3.0) License.
By accessing the work you hereby accept the Terms. Non-commercial uses of the work are permitted without any further permission from Dove Medical Press Limited, provided the work is properly attributed. For permission for commercial use of this work, please see paragraphs 4.2 and 5 of our Terms.