")
Back to Journals » Journal of Inflammation Research » Volume 13
Impact of Low Interferon-γ and IL-10 Levels on TNF-α and IL-6 Production by PHA-Induced PBMCs in Type 2 Diabetes Mellitus
Authors Kartika R , Purnamasari D , Pradipta S , Larasati RA , Wibowo H
Received 9 January 2020
Accepted for publication 7 April 2020
Published 22 April 2020 Volume 2020:13 Pages 187—193
DOI https://doi.org/10.2147/JIR.S245064
Checked for plagiarism Yes
Review by Single anonymous peer review
Peer reviewer comments 2
Editor who approved publication: Professor Ning Quan
Rona Kartika,1 Dyah Purnamasari,2 Saraswati Pradipta,1 Rahma A Larasati,3 Heri Wibowo4
1Master Program in Biomedical Sciences, Faculty of Medicine, Universitas Indonesia, Jakarta 10430, Indonesia; 2Division of Metabolic Endocrinology and Diabetes, Department of Internal Medicine, Faculty of Medicine, Universitas Indonesia, Jakarta 10430, Indonesia; 3Department of Biomedicines, Faculty of Medicine, Universitas Muhammadiyah Jakarta, Jakarta, Indonesia; 4Department of Parasitology, Faculty of Medicine, Universitas Indonesia, Jakarta 10430, Indonesia
Correspondence: Heri Wibowo
Department of Parasitology, Faculty of Medicine, Universitas Indonesia, Jakarta 10430, Indonesia
Tel +62-812-8328-1905
Email [email protected]
Purpose: In this study, we analyzed the production of interferon γ (IFN-γ) and interleukin 10 (IL-10) by peripheral blood mononuclear cells (PBMCs) in patients with type 2 diabetes mellitus (T2DM). We aimed to investigate the capacity of monocytes to produce tumor necrosis factor-α (TNF-α) and interleukin 6 (IL-6) following IFN-γ stimulation and the associated role of IL-10 in TNF-α and IL-6 production.
Patients and Methods: In vitro experiments were conducted on PBMCs obtained from 19 patients with T2DM and 17 healthy participants. PBMCs were isolated from venous blood by density gradient centrifugation, followed by 3-day phytohemagglutinin induction. In vitro production of TNF-α, IL-6, IFN-γ, and IL-10 was measured using the multiplex immunoassay. Statistical analysis was performed using IBM SPSS 23 version.
Results: IFN-γ concentration in the T2DM group was significantly lower than that in control group (T2DM 7,700.86 ± 3,037.77 vs control 10,672.69 ± 5,625.50 pg/mL; p = 0.048). However, TNF-α, IL-6, and IL-10 levels showed no significant difference between the two groups. The TNF-α/IFN-γ and IL-6/IFN-γ ratios were significantly higher in T2DM than in the control group (p = 0.026 and p = 0.048, respectively). In T2DM, the high TNF-α/IFN-γ ratio was consistent, with the low baseline IL-10 level (p = 0.022).
Conclusion: In T2DM, T-cell response is impaired with significantly reduced IFN-γ production, and simultaneously, circulatory monocytes show enhanced cellular responsiveness to inflammatory stimuli. The low baseline IL-10 level likely contributes to such an immune response.
Keywords: type 2 diabetes mellitus, proinflammatory response, cytokines
Introduction
Type 2 diabetes mellitus (T2DM) is considered as a major health concern worldwide.1 In Indonesia, the prevalence of DM was 10.9% among the population aged >15 years.2 Currently, the pathogenesis of T2DM is associated with hyperactivity of innate immune response, which results in insulin resistance.3 Obesity is an essential factor in the development of T2DM because the adipose tissues in patients with obesity produce high levels of inflammatory cytokines such as tumor necrosis factor-α (TNF-α), interleukin-6 (IL-6), and interleukin-1β (IL-1β). Moreover, it has been established that the M1 macrophages (proinflammatory state) in the adipose tissues produce a high level of proinflammatory cytokines such as TNF-α, IL-1β, and IL-6 and chemokines such as CCL4 and CCL2. The persistent production of cytokines leads to a chronic low-grade inflammatory condition.1 This condition could disturb insulin signaling by inducing serine phosphorylation of insulin receptor substrate 1 (IRS1) and stimulating the c-Jun N-terminal kinase pathway and I-kappa B kinase β (IKKβ)/NF-κB pathway.4
The adaptive or specific immune response is mediated by CD4+ and CD8+ T cells and B cells. In T2DM, CD4+ T cells tend to polarize to T helper 1 (Th1) cells and T helper 17 (Th17) cells in either peripheral blood or adipose tissue.3 Therefore, interferon-γ (IFN-γ) production from those T cells increases.3 Normally, IFN-γ is responsible for combating viral and intracellular pathogenic infections owing to its ability to activate the cellular immune response in macrophages.5 However, several studies have revealed that IFN-γ contributes to the pathogenesis of T2DM by increasing the expression of MHC class I and II and adhesion molecules on various types of cells, including β islets of pancreas.5 In addition, Bosek et al6 reported that the IFN-γ levels between patients with T2DM and healthy subjects were not significantly different. Apart from its high inflammatory activity, cells from patients with T2DM also showed dysregulation of anti-inflammatory responses owing to Th1/Treg cells imbalance and low interleukin-10 (IL-10) production by Treg cells.7 IL-10 is a potent anti-inflammatory cytokine that inhibits the production of TNF-α, IL-6, and other cytokines. Moreover, IL-10 could dampen activated macrophages.8
Phytohemagglutinin (PHA), a lectin tetravalent, is used for stimulating T cells in vitro. The mechanism underlying the activation of T cells by PHA remains controversial; however, some studies have reported that PHA initiates cell signaling via CD2 and CD3 receptor, which leads to Ca2+ influx through calcium channels.9,10 PHA activated-Th1 cells produce IFN-γ, which subsequently induces other immune cells such as monocytes and macrophages. In monocytes, IFN-γ triggers STAT1 homodimerization and NF-κB translocation to produce TNF-α, IL-6, and IL-1β.11
Although many studies have revealed that macrophages and other immune cells from adipose tissue trigger chronic low-grade inflammation, it remains unclear whether chronic hyperglycemia affects the response of the circulatory immune cells to inflammatory stimuli. In the present study, we analyzed IFN-γ production by peripheral blood mononuclear cells (PBMCs) from patients with T2DM. Moreover, we investigated the capacity of monocyte to produce TNF-α and IL-6 following IFN-γ stimulation and the role of IL-10 in TNF-α and IL-6 production.
Patients and Methods
Subjects
In vitro experiments were conducted on PBMCs obtained from 19 patients with T2DM and 17 healthy participants. Criteria for T2DM group were patients aged 30–50 years, with fasting blood glucose (FBG) > 126 mg/dL, HbA1c > 6.5%, and who have had T2DM for >5 years. The healthy control group included participants with FBG < 100 mg/dL, HbA1c < 5.7%, and who were never diagnosed with T2DM by a physician. Exclusion criteria in both groups were pregnancy, lactation, medication use (steroids, NSAIDs, and antibiotics), and infection during the study. This study was carried out in accordance with the recommendation of Ethics Committee from Faculty of Medicine, Universitas Indonesia with written informed consent from all participants. All participants gave written informed consent in accordance with the Declaration of Helsinki. The protocol was approved by Faculty of Medicine, Universitas Indonesia with number 19-03-0221.
Fasting venous blood was taken from all participants. The level of FBG, blood glucose at 2 h after meal (BG2PP), and HbA1c were measured in the laboratory of National Institute of Research and Development, Ministry of Health in Bogor. Isolation and culture of PBMCs and cytokine analysis were conducted in Integrated Laboratory, Universitas Indonesia.
PBMC Isolation and Culture
PBMCs were isolated from RPMI 1640-diluted blood by centrifugation through Ficoll-Paque Plus (GE Healthcare Life Sciences, USA). PHA is lectin extract from red kidney beans that could stimulate T cell activation and proliferation, so we used PHA-M (mucoprotein form) for lymphocyte stimulation. After isolating, PBMCs were resuspended in cell culture medium comprising RPMI 1640 supplemented with 10% heat-inactivated fetal bovine serum and 1% streptomycin at a concentration of 106 cells/mL. Additionally, 500 µL cell suspensions and 500 µL of 10 mM Gibco phytohemagglutinin-M (Thermo Fisher Scientific, California, USA) were added to the wells of the 24-well culture plate. For determining baseline cytokines level, other PBMC suspensions were cultured without the addition of phytohemagglutinin-M. The culture plates were incubated at 37°C, 5% CO2 for 3 days.
Cytokine Assays
TNFα, IL-6, IFN-γ, and IL-10 were measured using bead-based multiplex assay (R&D Systems, Minneapolis, USA) following the manufacturer’s directions. The detection limits were 0.6 pg/mL for TNF-α, 1.11 pg/mL for IL-6, 1.27 pg/mL for IFN- γ, and 0.3 pg/mL for IL-10.
Data Analysis
Data on patient characteristics and cytokines production were compared between patients with T2DM and healthy control groups using the independent t-test or Mann–Whitney U-test, as appropriate. A p value of <0.05 was considered statistically significant. All analyses were performed using Statistical Package for the Social Sciences (IBM SPSS) version 23 for Windows 10.
Results
Baseline Characteristics of Participants
We compared some metabolic parameters between the healthy control and T2DM groups (Table 1). As expected, the T2DM group had higher BMI (p < 0.001), FBG level (p < 0.001), BG2PP level (p < 0.001), and HbA1c (p < 0.001).
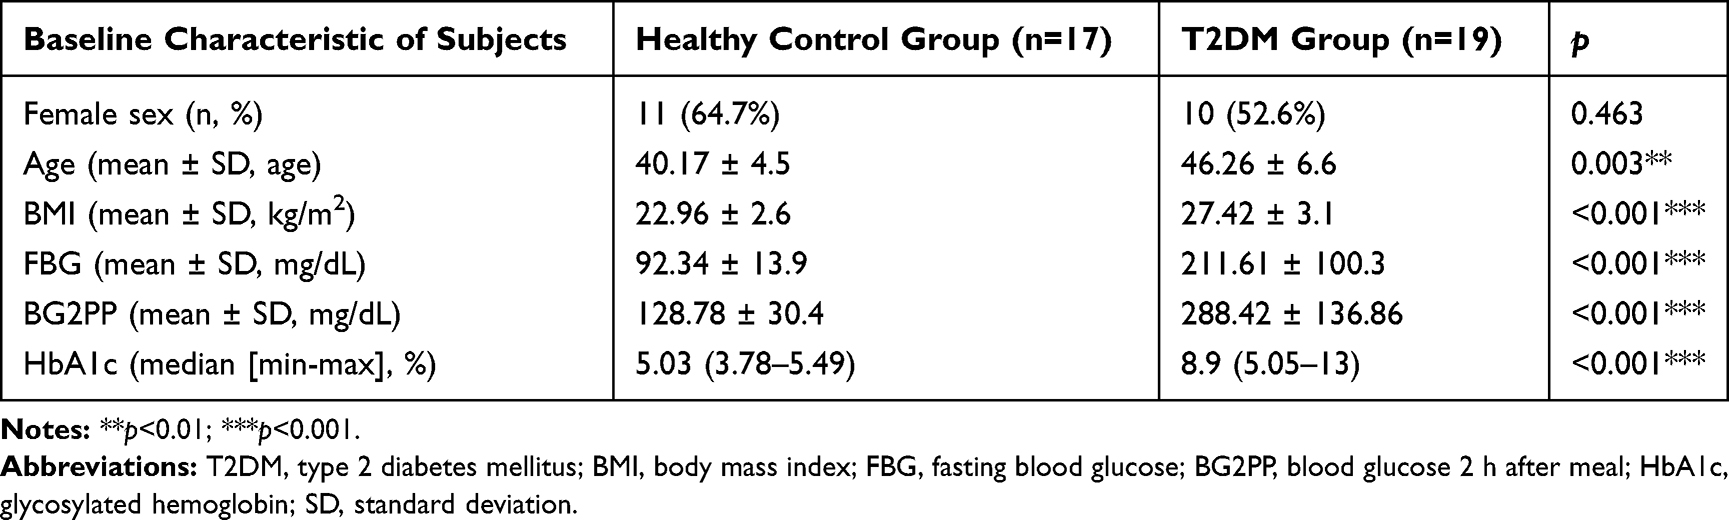 |
Table 1 Baseline Characteristic of Subjects |
Cytokine Production in PHA-Induced PBMCs
Table 2 presents cytokine concentration in PBMCs at baseline and following PHA induction. After 3 days of PHA induction, IFN-γ concentration in the T2DM group was significantly lower than that in the control group (p = 0.048). However, the two groups showed no difference in TNF-α, IL-6, and IL-10 levels. In addition, our multivariate analysis showed no significant difference between the two groups based on age and sex (Supplement 1; Supplement 2).
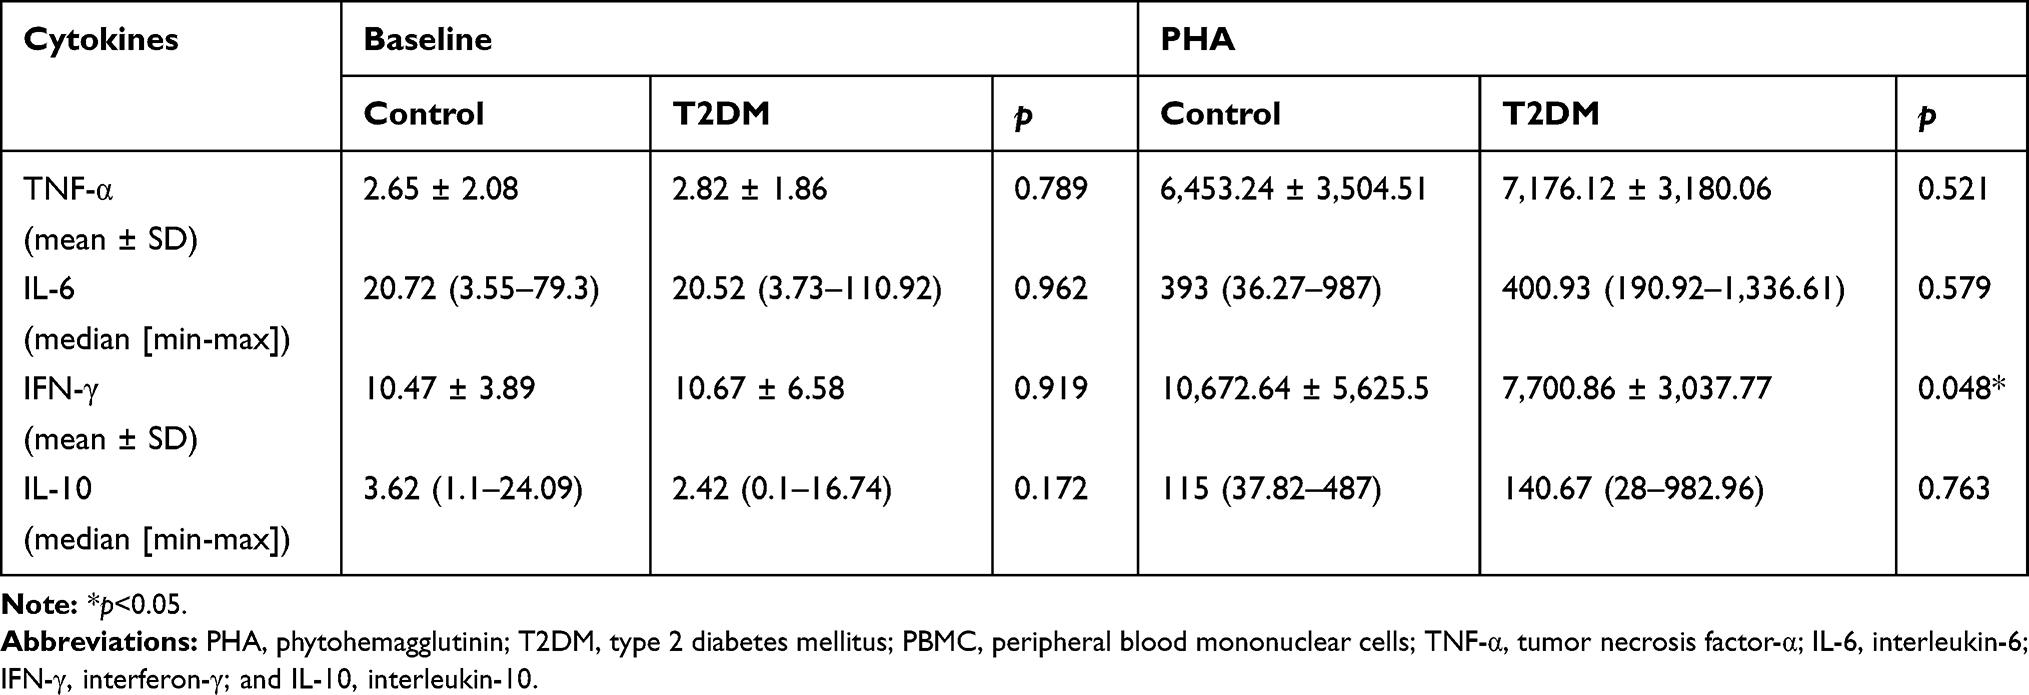 |
Table 2 Cytokines Concentration from Baseline and PHA-Induced PBMC Cultures |
In PHA-induced PBMCs, we expected that IFN-γ from activated T cells would trigger TNF-α and IL-6 production from macrophages and monocytes. To analyze the monocyte and macrophage function after IFN-γ stimulation, we calculated the ratios between TNF-α and IFN-γ and between IL-6 and IFN-γ. As shown in Figure 1, the TNF-α/IFN-γ and IL-6/IFN-γ ratios were significantly higher in the T2DM group than those in the control group (p = 0.026 and p = 0.048, respectively).
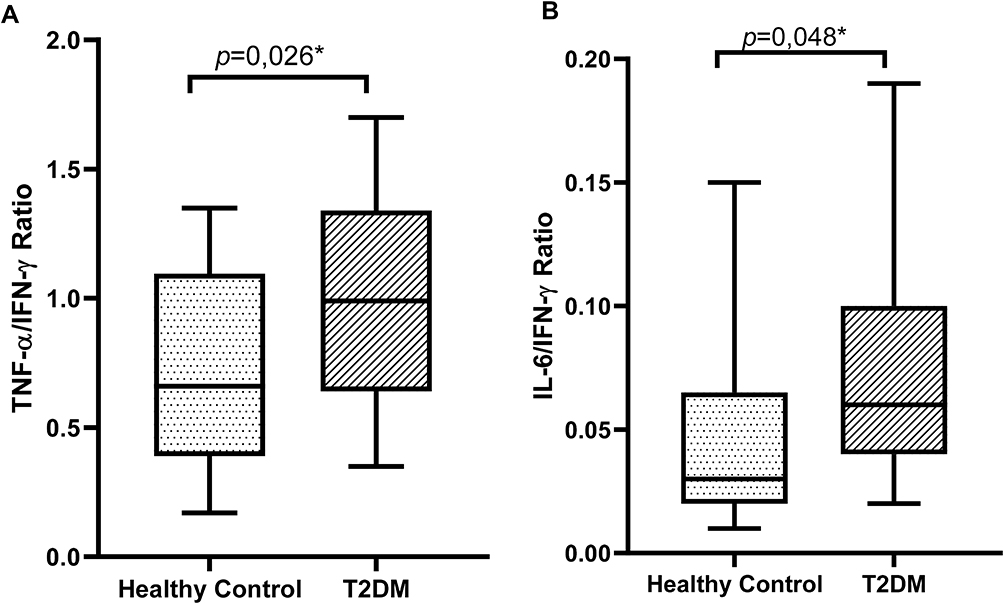 |
Figure 1 Ratios of (A) TNF-α/IFN-γ and (B) IL-6/IFN-γ in 3-day PHA-induced PBMC cultures in the control and T2DM groups. PHA, phytohemagglutinin; T2DM, type 2 diabetes mellitus; PBMCs; peripheral blood mononuclear cells; TNF-α, tumor necrosis factor-α; IL-6, interleukin-6; IFN-γ, interferon-γ. *p < 0.05. |
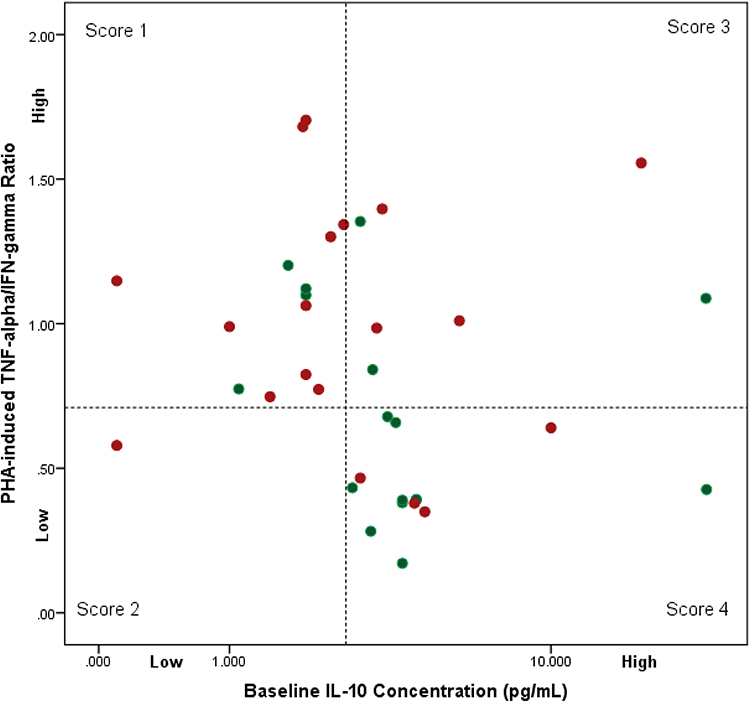
Having observed that the cellular responsiveness in monocytes was higher in T2DM, we attempted to investigate the role of IL-10. We found that the baseline IL-10 level affects monocytes activity. Figure 2 shows that 52.6% of the patients with T2DM had lower baseline IL-10 level and higher PHA-induced TNF-α/IFN-γ ratio, indicating that monocyte activity was not suppressed. In contrast, most of the healthy control subjects (58.8%) had a higher baseline IL-10 level and suppressed monocyte activity (p = 0.022). Interestingly, 50% of the patients with T2DM (4 out of 8) who had high baseline IL-10 levels presented with a high PHA-induced TNF-α/IFN-γ ratio. However, only 23% of healthy controls (3 out of 13) had high baseline IL-10 levels and high PHA-induced TNF-α/IFN-γ ratio.


Discussion
T2DM is a chronic hyperglycemic condition. This condition leads to the formation of advanced glycation end products, polyol products, and reactive oxygen species, which activate cellular immune responses in target tissues such as adipose tissue.12 However, cellular responses in circulatory immune cells such as monocytes and lymphocytes remain inconclusive. In this study, we found that IFN-γ level was lower in patients with T2DM than that in the control group, indicating that the capacity of T cells to produce IFN-γ is decreased. This finding is consistent with the findings of Foss-Freitas et al.13 They found that the plasma level of IFN-γ decreased in patients with T2DM compared with healthy controls and patients with type 1 DM. Stalenhoef et al14 also described impaired response of Th1 cells to PHA induction in patients with T2DM. This impaired Th1 cell response was characterized by reduced IFN-γ level, thus contributing to an increased chance of infection. The decrease in IFN-γ production in CD4+ and CD8+ T cells might be due to insulin resistance15 and genetic factors such as IFN gamma-874*A homozygote (low producer gene).5 Interestingly, the levels of TNF-α and IL-6 were similar between patients with T2DM and healthy controls. These findings contradict the conventional notion that proinflammatory cytokines such as TNF-α and IL-6 contribute to insulin resistance.16–18
In this study, TNF-α and IL-6 production was demonstrated to be induced by IFN-γ from T cells. TNF-α/IFN-γ and IL-6/IFN-γ ratios were higher in patients with T2DM than in healthy controls, indicating that the response of monocytes and macrophages to inflammatory stimuli has been impaired. Circulatory monocytes and macrophages in T2DM were believed to be more sensitive to proinflammatory stimuli; therefore, even at low IFN-γ exposure, they could produce high amount of proinflammatory cytokines. Giulietti et al19 reported that monocytes from T2DM showed higher levels of TNF-α, IL-6, IL-1, IL-8, and COX2. Fadini et al20 reported an imbalance between M1 and M2 monocytes owing to the low number of M2 monocytes. Moreover, Jagannathan et al21 revealed increased level of proinflammatory monocytes (CD14+/CD16+) in T2DM, and it correlated with HbA1c level.
High TNF-α and IL-6 production in response to IFN-γ in circulatory monocytes may result from higher level of STAT1 phosphorylation induced by IFN-γ in macrophages under high glucose conditions.22 Phosphorylated STAT1 translocates to nucleus and activates several proinflammatory genes such as MMP1.22 It is also found that mRNA and miRNA expression from monocytes is altered, resulting in the upregulation of TNF-α and IL-6 gene expression23 and downregulation of miR-146a and miR-155 expression, the key regulators of inflammatory process.24–26
IL-10 is an anti-inflammatory cytokine secreted by Treg cells, Th2 cells, B cells, macrophages, and DCs.27 IL-10 downregulates the production of proinflammatory cytokines and chemokines by lymphocytes and macrophages through JAK/STAT3/SOCS3 pathway.27 The binding of IL-10 to IL-10R activates JAK1 and subsequently induces STAT3 phosphorylation. STAT3 activation in turn upregulates SOCS3 expression, which prevents NF-κB nuclear translocation. Moreover, STAT3 upregulates the expression of anti-inflammatory response genes such as Bcl3, Etv3, and SHIP-1, which suppresses TNF-α expression.28 Our study showed that although the baseline IL-10 level was not different between patients with T2DM and control subjects, following IFN-γ induction, the majority of patients with T2DM having low baseline IL-10 level showed high TNF-α level. Higher circulating IL-10 level helps cells combat the chronic low-grade inflammation in obesity and T2DM.29 In contrast, low IL-10 level indicates that the regulatory mechanism has failed, resulting in the activation of monocytes and lymphocytes.30
Despite the small sample size in this study, we found that 50% of the patients with T2DM having high baseline IL-10 level also had high PHA-induced TNF-α level. This indicates that immune cells in T2DM exhibit IL-10 hyporesponsiveness. This finding is consistent with the findings of Barry et al31 who demonstrated that IL-10 was less effective in inhibiting TNF-α production in whole blood culture, and this was not explained by changes in IL-10 receptor or downstream signaling. Our findings might support the theory that IL-10 contributes to hyporesponsiveness in chronic low-grade inflammatory condition in T2DM.
Conclusion
In summary, we have demonstrated that in T2DM, T cell response is impaired owing to markedly reduced IFN-γ production. Moreover, circulatory monocytes showed enhanced cellular responsiveness to inflammatory stimuli such as IFN-γ, and the low baseline IL-10 level contributed to this increased responsiveness.
Acknowledgments
The authors would like to thank the participants, nurses, doctors in a cohort study for non-communicable disease, National Institute of Health Research and Development, Ministry of Health, Indonesia, to all staff in Integrated Laboratory Faculty of Medicine, Universitas Indonesia, and also to all who help this research.
Author Contributions
All authors made substantial contributions to conception and design, acquisition of data, and analysis as well as interpretation of data; participated in drafting the article or revising it critically for important intellectual content; provided final approval of the version to be published; and agree to be accountable for all aspects of the work.
Funding
This research was supported by the Indexed International Publication for Student Projects (PITTA) grant; World Class Research (WCR) grant from the Ministry of Research, Technology, and Higher Education, Republic of Indonesia number 173/SP2H/LT/DRPM/2019; and LPDP publication grant from the Ministry of Finance, Republic of Indonesia.
Disclosure
Dr Rona Kartika, Dr Dyah Purnamasari, Dr Rahma Ayu Larasati, and Drs Heri Wibowo report grants from Universitas Indonesia, grants from the Ministry of Research, Technology, and Higher Education, Indonesia, grants from the Ministry of Finance, Indonesia, during the conduct of the study. The authors report no conflicts of interest in this work.
References
1. Grossmann V, Schmitt VH, Zeller T, et al. Profile of the immune and inflammatory response in individuals with prediabetes and type 2 diabetes. Diabetes Care. 2015;38(7):1356–1364. doi:10.2337/dc14-3008
2. Indonesia Ministry of Health. Hasil Utama Riskesdas 2018 [Main Result of Basic Health Research 2008 in Indonesia]. Jakarta: Badan Penelitian dan Pengembangan Kesehatan; 2018.
3. Zhou T, Hu Z, Yang S, Sun L, Yu Z, Wang G. Role of adaptive and innate immunity in type 2 diabetes mellitus. J Diabetes Res. 2018;2018:7457269. doi:10.1155/2018/7457269
4. Makki K, Froguel P, Wolowczuk I. Adipose tissue in obesity-related inflammation and insulin resistance: cells, cytokines, and chemokines. ISRN Inflamm. 2013;2013:139239. doi:10.1155/2013/139239
5. Tsiavou A, Hatziagelaki E, Chaidaroglou A, Koniavitou K, Degiannis D, Raptis SA. Correlation between intracellular interferon-gamma (IFN-gamma) production by CD4+ and CD8+ lymphocytes and IFN-gamma gene polymorphism in patients with type 2 diabetes mellitus and latent autoimmune diabetes of adults (LADA). Cytokine. 2005;31(2):135–141. doi:10.1016/j.cyto.2005.02.011
6. Bosek I, Kuczerowski R. Evaluation of interferon-gamma in patients with type 2 diabetes and colorectal cancer. J Diabetes Metab. 2015;07(01). doi:10.4172/2155-6156.1000639
7. Zeng C, Shi X, Zhang B, et al. The imbalance of Th17/Th1/Tregs in patients with type 2 diabetes: relationship with metabolic factors and complications. J Mol Med. 2012;90(2):175–186. doi:10.1007/s00109-011-0816-5
8. Straczkowski M, Kowalska I, Nikolajuk A, Krukowska A, Gorska M. Plasma interleukin-10 concentration is positively related to insulin sensitivity in young healthy individuals. Diabetes Care. 2005;28(8):2036–2037. doi:10.2337/diacare.28.8.2036
9. O’Flynn K, Russul-Saib M, Ando I, et al. Different pathways of human T-cell activation revealed by PHA-P and PHA-M. Immunology. 1986;57(1):55–60.
10. Tiefenthaler G, Hünig T. The role of CD2/LFA-3 interaction in antigen- and mitogen-induced activation of human T cells. Int Immunol. 1989;1(2):169–175. doi:10.1093/intimm/1.2.169
11. Hoeksema MA, Scicluna BP, Boshuizen MC, et al. IFN-gamma priming of macrophages represses a part of the inflammatory program and attenuates neutrophil recruitment. J Immunol. 2015;194(8):3909–3916. doi:10.4049/jimmunol.1402077
12. Graves DT, Kayal RA. Diabetic complications and dysregulated innate immunity. Front Biosci. 2008;13:1227. doi:10.2741/2757
13. Foss-Freitas MC, Foss NT, Donadi EA, Foss MC. Effect of metabolic control on interferon-gamma and interleukin-10 production by peripheral blood mononuclear cells from type 1 and type 2 diabetic patients. Braz J Med Biol Res. 2007;40(5):671–677. doi:10.1590/S0100-879X2007000500010
14. Stalenhoef J, Alisjahbana B, Nelwan E, et al. The role of interferon-gamma in the increased tuberculosis risk in type 2 diabetes mellitus. Eur J Clin Microbiol Infect Dis. 2008;27(2):97–103. doi:10.1007/s10096-007-0395-0
15. Mahmoud MA, Ghareeb DA, Sahyoun HA, Elshehawy AA, Elsayed MM. In vivo interrelationship between insulin resistance and interferon gamma production: protective and therapeutic effect of berberine. Evid Based Complement Alternat Med. 2016;2016.
16. Hossain M, Faruque MO, Kabir G, et al. Association of serum TNF-α and IL-6 with insulin secretion and insulin resistance in IFG and IGT subjects in a Bangladeshi population. Int J Diabetes Mellit. 2010;2(3):165–168. doi:10.1016/j.ijdm.2010.08.004
17. Rodrigues KF, Pietrani NT, Bosco AA, Campos FMF, Sandrim VC, Gomes KB. IL-6, TNF-α, and IL-10 levels/polymorphisms and their association with type 2 diabetes mellitus and obesity in Brazilian individuals. Arch Endocrinol Metab. 2017;61(5):438–446. doi:10.1590/2359-3997000000254
18. Liu Y, Wang X, Zhao Y, et al. Upregulation of tumor necrosis factor-α-induced protein 8-like 2 mRNA is negatively correlated with serum concentrations of tumor necrosis factor-α and interleukin 6 in type 2 diabetes mellitus. J Diabetes Res. 2017;2017.
19. Giulietti A, van Etten E, Overbergh L, Stoffels K, Bouillon R, Mathieu C. Monocytes from type 2 diabetic patients have a pro-inflammatory profile. 1,25-Dihydroxyvitamin D(3) works as anti-inflammatory. Diabetes Res Clin Pract. 2007;77(1):47–57. doi:10.1016/j.diabres.2006.10.007
20. Fadini G, de Kreutzenberg SV, Boscaro E, et al. An unbalanced monocyte polarisation in peripheral blood and bone marrow of patients with type 2 diabetes has an impact on microangiopathy. Diabetologia. 2013;56(8):1856–1866. doi:10.1007/s00125-013-2918-9
21. Jagannathan R, Thayman M, Rao SR. Proinflammatory (CD14+CD16++) monocytes in type 2 diabetes mellitus patients with/without chronic periodontitis. Dent Res J. 2019;16(2):95–103. doi:10.4103/1735-3327.250976
22. Nareika A, Sundararaj KP, Im Y-B, Game BA, Lopes-Virella MF, Huang Y. High glucose and interferon gamma synergistically stimulate MMP-1 expression in U937 macrophages by increasing transcription factor STAT1 activity. Atherosclerosis. 2009;202(2):363–371. doi:10.1016/j.atherosclerosis.2008.05.043
23. Gupta S, Maratha A, Siednienko J, et al. Analysis of inflammatory cytokine and TLR expression levels in type 2 diabetes with complications. Sci Rep. 2017;7(1):7633. doi:10.1038/s41598-017-07230-8
24. Balasubramanyam M, Aravind S, Gokulakrishnan K, et al. Impaired miR-146a expression links subclinical inflammation and insulin resistance in type 2 diabetes. Mol Cell Biochem. 2011;351(1–2):197–205. doi:10.1007/s11010-011-0727-3
25. Baldeon RL, Weigelt K, de Wit H, et al. Type 2 diabetes monocyte microRNA and mRNA expression: dyslipidemia associates with increased differentiation-related genes but not inflammatory activation. PLoS One. 2015;10(6):e0129421. doi:10.1371/journal.pone.0129421
26. Corral-Fernández N, Salgado-Bustamante M, Martinez-Leija M, et al. Dysregulated miR-155 expression in peripheral blood mononuclear cells from patients with type 2 diabetes. Exp Clin Endocrinol Diabetes. 2013;121(06):347–353. doi:10.1055/s-0033-1341516
27. Cevey ÁC, Penas FN, Alba Soto CD, Mirkin GA, Goren NB. IL-10/STAT3/SOCS3 axis is involved in the anti-inflammatory effect of benznidazole. Front Immunol. 2019;10:1267. doi:10.3389/fimmu.2019.01267
28. Hutchins AP, Diez D, Miranda-Saavedra D. The IL-10/STAT3-mediated anti-inflammatory response: recent developments and future challenges. Brief Funct Genomics. 2013;12(6):489–498. doi:10.1093/bfgp/elt028
29. Esposito K, Pontillo A, Giugliano F, et al. Association of low interleukin-10 levels with the metabolic syndrome in obese women. J Clin Endocrinol Metab. 2003;88(3):1055–1058. doi:10.1210/jc.2002-021437
30. Mostafa Mtairag E, Chollet-Martin S, Oudghiri M, et al. Effects of interleukin-10 on monocyte/endothelial cell adhesion and MMP-9/TIMP-1 secretion. Cardiovasc Res. 2001;49(4):882–890. doi:10.1016/S0008-6363(00)00287-X
31. Barry JC, Shakibakho S, Durrer C, et al. Hyporesponsiveness to the anti-inflammatory action of interleukin-10 in type 2 diabetes. Sci Rep. 2016;6:21244. doi:10.1038/srep21244
 © 2020 The Author(s). This work is published and licensed by Dove Medical Press Limited. The full terms of this license are available at https://www.dovepress.com/terms.php and incorporate the Creative Commons Attribution - Non Commercial (unported, v3.0) License.
By accessing the work you hereby accept the Terms. Non-commercial uses of the work are permitted without any further permission from Dove Medical Press Limited, provided the work is properly attributed. For permission for commercial use of this work, please see paragraphs 4.2 and 5 of our Terms.
© 2020 The Author(s). This work is published and licensed by Dove Medical Press Limited. The full terms of this license are available at https://www.dovepress.com/terms.php and incorporate the Creative Commons Attribution - Non Commercial (unported, v3.0) License.
By accessing the work you hereby accept the Terms. Non-commercial uses of the work are permitted without any further permission from Dove Medical Press Limited, provided the work is properly attributed. For permission for commercial use of this work, please see paragraphs 4.2 and 5 of our Terms.