")
Back to Journals » OncoTargets and Therapy » Volume 12
Impact of Fucosylation on Self-Assembly of Prostate and Breast Tumor Spheroids by Using Cyclo-RGDfK(TPP) Peptide and Image Object Detection
Authors Kalaydina RV , Zhou H, Markvicheva E, Burov SV , Zulkernine F, Szewczuk MR
Received 24 October 2019
Accepted for publication 4 December 2019
Published 17 December 2019 Volume 2019:12 Pages 11153—11173
DOI https://doi.org/10.2147/OTT.S235811
Checked for plagiarism Yes
Review by Single anonymous peer review
Peer reviewer comments 2
Editor who approved publication: Dr Arseniy Yuzhalin
Regina-Veronicka Kalaydina,1 Hedi Zhou,1 Elena Markvicheva,2 Sergey V Burov,3 Farhana Zulkernine,4 Myron R Szewczuk1
1Department of Biomedical & Molecular Sciences, Queen’s University, Kingston, ON, Canada; 2Biomedical Materials Laboratory, Shemyakin-Ovchinnikov, Institute of Bioorganic Chemistry, Moscow, Russia; 3Laboratory of Novel Peptide Therapeutics, Cytomed J.S.Co., St-Petersburg, Russia; 4School of Computing, Queen’s University, Kingston, ON, Canada
Correspondence: Myron R Szewczuk
Department of Biomedical and Molecular Sciences, Queen’s University, 18 Stuart Street, Kingston, Ontario K7L 3N6, Canada
Tel +1-613 533 2457
Fax +1-613 533 6796
Email [email protected]
Introduction: Core fucosylation of N-glycans on the integrin β1 subunit is essential for the functional activity of the integrin. The binding of α5β1 integrin with the tripeptide Arg-Gly-Asp (RGD) motif within the extracellular matrix protein fibronectin may be influenced by the α-1,6-fucose core or α-1,2-fucose and α-1,3/4-fucose peripheral N-glycan profiles. Here, we investigated whether fucosylation impacts the formation of matrix-free 3D multicellular tumor spheroids (MCTS) from human triple negative breast MDA-MB231 cell line, prostate PC3 and DU145 cell lines and DU145 gemcitabine resistant (GemR) variant by using the cyclic Arg-Gly-Asp-D-Phe-Lys peptide modified with 4-carboxybutyl-triphenylphosphonium bromide (cyclo-RGDfK(TPP)) peptide method.
Methods: Microscopic imaging, lectin histochemistry, flow cytometry, WST-1 cell viability assay and You Only Look Once version 2 (YOLOv2) training object detection using cyclic learning rates were used to evaluate the formation of MCTS, morphologic changes, and the expression levels of α-1,6-fucose and α-1,2-fucose linkages on the cell surface.
Results: DU145 prostate cancer cells expressed higher α-1,6-fucose than α-1,2-fucose linkages on their cell surface, as determined by lectin cytochemistry and flow cytometry. Blockage of the α-1,6- and α-1,2-fucose linkages with Aspergillus oryzae lectin (AOL) and Ulex Europaeus agglutinin I (UEA I) one hour before the addition of cyclic-RGDfK(TPP) peptide to the monolayer of the cancer cells resulted in a statistically significant dose-dependent reduction in spheroid volumes using threshold diameters of 40 and 60 μm. Application of a 40 μm threshold diameter measurements of spheroids resulted in fewer false-positive ones compared to the 60 μm diameter threshold previously used in our studies. A state-of-the-art, image object detection system YOLOv2 was used to automate the analysis of spheroid measurements and volumes. The results showed that YOLOv2 corroborated manual spheroid detection and volume measurements with high precision and accuracy.
Conclusion: For the first time, the findings demonstrate that α-1,6- and α-1,2-fucose linkages of N-glycans on the cell surface receptors facilitate cyclo-RGDfK(TPP)-mediated self-assembly of cancer cells to form 3D multicellular tumor spheroids.
Keywords: DU145, DU145 GemR, PC3 and MDA-MB231 cell lines, cadherin, integrin, spheroid, prostaspheres, multicellular tumor spheroids, MCTS, fucosylation
Introduction
Core fucosylation of α-1,6-fucose linkages of N-glycans on the integrin β1 subunit is essential for the functional activity of α3β1 integrin.1 The deletion of core fucosylation linkages on the α3β1 integrin was shown to downregulate its functional activity. Isaji et al also reported that the binding affinity of integrin α5β1 to fibronectin was significantly reduced by the modification of the N-glycans of integrin’s α5 subunit by introducing a bisecting amino sugar residue N-acetylglucosamine (GlcNAc) using the enzyme β1,4-N-acetylglucosaminyltransferase III (GnT-III).2 The integrins consist of α and β heterodimeric transmembrane receptor subunits that bind extracellular matrix (ECM) proteins, involved in development, cell proliferation, protection against apoptosis, and malignancy.3 The fibronectin (FN) receptor α5β1 integrin plays essential roles in tumor growth, invasion, and malignant behavior.4 Although α5β1 integrin-mediated adhesion is dependent on the binding of its subunits to a defined tripeptide RGD sequence of FN, the strength of this binding is modulated by various factors including the glycosylation status of the integrin. The integrin α5β1 contains 14 and 12 potential asparagine-linked glycosylation sites on the α5 and β1 subunits, respectively.5 These studies propose that the interaction of cell surface integrin α5β1 with FN is dependent on the glycosylation status for the functional activity of the integrin.
To closely mimic the natural ECM FN protein binding to α5β1 integrins on the cell membrane, Akasov et al have developed a one-step highly reproducible technique of matrix-free 3D multicellular tumor spheroid (MCTS) formation by using a synthetic cyclo-RGDfK modified with 4-carboxybutyl-triphenylphosphonium bromide (cyclo-RGDfK(TPP)) peptide.6 The cyclo-RGDfK(TPP) peptide promotes the self-assembly of cancer cells, avoiding cell-plate surface adhesion.7 The interactions of the cyclo-RGDfK(TPP) peptide with α5β1 integrin induce cadherin expressions on the cell membrane. Cadherin–cadherin interactions among cancer cells result in cell compaction and spheroid formation.8 The self-assembly formation of 2D monolayer cells into MCTS by the application of the cyclo-RGDfK(TPP) peptide involves cell aggregation and tight compaction of the cells.
Aberrant patterns of glycosylation are now identified as one of the hallmarks of cancer.9 Aberrant glycosylation influences the tumor phenotype, where under- or overexpression of glycans on malignant cells are implicated in tumor progression and metastasis.10 Munkley and Elliot have eloquently described the importance of glycosylation in all aspects of cancer progression, particularly as they relate to the reported hallmarks of cancer.11 More specifically, glycans and their lectins are critical regulators of inflammation and the immune response to tumor cells.12 NF-κB and pro-inflammatory COX-2 are also regulated by the glycosylated state of cancer cells. The efficacy of inhibitors may be dependent on the COX-2 glycosylated state.11 Taken into consideration of all glycosylation modifications, the most prevalent in cancer includes elevated levels of sialylation, the branched glycan structures, and core fucosylation. Overexpression of branched-N-glycan structures has been reported to interfere with E-cadherin-mediated cell-cell adhesion,13 thus promoting migration and invasion. Additionally, altered glycosylation of growth factor receptors affects cancer cell receptor signal transduction pathways in modulating cell growth, and proliferation.12
Patterns of tumor growth, progression, cell invasiveness, acquired chemoresistance and metastasis are highly influenced by aberrant cell surface-specific sialoglycan structures on αvβ3, αvβ5, α5β1, and α6β4 integrins.14–19 Indeed, integrin α2β1 interaction with collagen type I is dependent on α2,3-sialylation of α2 subunits of the integrin receptor using LNCaP-derived C4-2B prostate cancer (PCa) cells.20 Hypersialylation of integrin β1 by α2,6-sialyltransferase activity activates integrin signaling and enhances colon cancer cell progression and metastasis.15 Similarly, the raised levels of cell surface α2,6-sialic acids also correlate with invasion, spread, and chemotherapy resistance of colorectal cancer due to increased expression of β-galactoside α2,6-sialyltransferase.21 The effect of altered sialoglycan patterns of αvβ3 integrin on the metastatic potential of melanoma cells was facilitated by αvβ3- and β1-6-branched sialylated complex-type N-glycans.22
Despite clear associations between hypersialylation and cancer progression and metastasis, the role of aberrant sialoglycan patterns in the formation of MCTS was not well defined until now. To this end, Akasov et al have demonstrated that sialylation facilitates MCTS formation in parental and chemoresistant breast MCF7 and pancreatic PANC1 cell lines using the cyclo-RGDfK(TPP) peptide method.23 The specific sialoglycan structures expressed on the cell surface also correlated with the ability of prostate cancer cells to form avascular multicellular prostaspheres.24 Until now, the effect of fucosylation on the formation of avascular MCTS is unknown. In this report, we compare the core α-1,6-fucose and the peripheral terminal α-1,2-fucose linkages to elucidate the role of fucosylation in the formation of breast and prostate cancer cell MCTS. For the first time, these findings show that fucosylation of α-1,6- and α-1,2-fucose linkages of N-glycans is essential for the formation of MCTS.
Materials and Methods
Cell Lines
PC3 cell line is a human prostate carcinoma, epithelial-like (ATCC® CRL1435™; Manassas, VA, USA). DU145 cell line is a human prostate carcinoma, epithelial-like (ATCC® HTB-81™) and are derived from the metastatic site in the bone and brain. MDA-MB-231 (ATCC® HTB-26™, American Type Culture Collection, Manassas, VA 20110, USA) is a human triple-negative breast cancer cell line obtained from the metastatic pleural effusion site of a 51-year-old woman with metastatic breast cancer. MDA-MB-231 is an invasive ductal adenocarcinoma. PC3 and DU145 cells lack the androgen receptor (AR) and prostate-specific antigen25 but have low levels of acid phosphatase and testosterone-5-α reductase activity.26 Cells were grown in 1× DMEM-conditioned medium supplemented with 10% FCS (HyClone), 5 μg/mL plasmocin™ (InvivoGen), 5% CO2 incubator at 37°C. At 80% confluence, the cells were passaged at least five times before use in the experiments. Gemcitabine-resistant DU145 (DU145GemR) variant cell lines were cultured in conditioned medium containing 0.01 μM gemcitabine for over 1 year. The cells were passaged at least five times at approximately 80% confluence before experimental use.
Reagents
Cyclic Arginyl-Glycyl-Aspartyl-D-Phenylalanyl-Lysine (cyclo-RGDfK) was modified with a 4-carboxybutyl-triphenylphosphonium bromide to generate cyclo-RGDfK(TPP), prepared using standard methods of solid-phase peptide synthesis6 in the laboratory of Professor Sergey Burov, Saint-Petersburg, Russia. The plant lectin Aspergillus oryzae (AOL) was ordered from Tokyo Chemical Industry (Tokyo, Japan) and Ulex Europaeus Agglutinin I (UEA-I) was ordered from Vector Laboratories Inc. (Burlingame, CA, USA).
Lectin-Based Cytochemistry
Lectin-based cytochemistry was performed on DU145 prostate cancer cells to investigate the localization and expression of α1,2 and α1,6 fucose linkages. Cells were cultured, then plated at a density of 75,000 cells/mL on 12mm sterile circular glass slides placed in sterile 24-well plates for 24 hrs in a 37°, 5% CO2 incubator. The prostate cancer cells were fixed with 4% paraformaldehyde (PFA), washed twice with phosphate-buffered saline (PBS, pH 7.4), and blocked with 5% bovine serum albumin (BSA) in PBS. Cells were treated with 10µg/mL-biotinylated AOL or UEA-I overnight at room temperature for lectin binding. They were washed three times with PBS the following day, incubated with AlexaFluor 594-conjugated streptavidin (Vector Laboratories Inc.) for an hour at room temperature, and placed in a light-sensitive chamber. Cells were washed three times with PBS, mounted on a glass slide, sealed with nail polish, and visualized using a Carl Zeiss Imager 2 fluorescence microscope using 10× and 20× objectives. The imaging software Corel Photo-Paint 8.0 was used to measure the density of the cell staining (red fluorescence). Wells that contained streptavidin but did not contain lectin were used as controls to normalize for background fluorescence.
Flow Cytometry Analysis
Prostate cancer cells were grown at approximately 90% confluence in T75 tissue culture flasks. To measure α1,6 fucose linkages, cells were stained with biotinylated AOL at 10µg/mL and dissolved in PBS containing 2% FBS for 1 hr on ice. They were washed three times with PBS containing 2% FBS, after which they were stained with DyLight288-conjugated streptavidin (Biolegend Inc., San Diego, CA, USA) for 1 hr on ice. The cells were rewashed with PBS containing 2% FBS and fixated with 4% PFA. Control cells used to normalize for background fluorescence were incubated with DyLight488-conjugated streptavidin and were not incubated with lectin. A total of 1 x 10⁶ cells underwent analysis by Beckman Coulter Cytomics FC500 flow cytometry and CxP software (Beckman Coulter, Brea, CA, USA) in the Queen’s University Biomedical Imaging Center (QUBIC). The median fluorescence for each histogram was represented for 100% of the gated cells.
Cell Proliferation WST-1 Assay
WST-1 assay measures cell viability based on the cleavage of the WST-1 tetrazolium salt to soluble formazan by cellular mitochondrial dehydrogenase enzyme.27 At 450 nm, the absorbance recorded is proportional to the number of living cells in culture. They were grown to 80%–90% confluence in T25 flasks and seeded in a 96-well tissue culture plate at a density of 10,000 cells/well for 3 hrs. Cells were treated with different concentrations of AOL and UEA-1 lectins or left untreated for 5 days. The attached cells were treated with 10 µL of WST-1 reagent (Roche Diagnostics Division de Hoffman La Roche Limitée, Laval-des-Rapides, QC, Canada) for 2 hrs at 37°C. Cell viability was determined as a percentage of control and illustrated as a bar graph by using GraphPad Prism software (GraphPad Software, Inc., La Jolla, CA, USA). The following formula was used to determine cell viability as a percent of control for each time point after each lectin treatment:
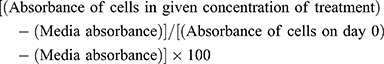
The cells growing in the conditioned medium are the control group.
Cyclo-RGDfK(TPP) Peptide-Based Spheroid Formation
MCTS were established from prostate cells using previously reported protocols.6,7,23 Cells were first grown in T25 or T75 tissue culture flasks until at least 90% confluent, then plated in flat-bottom Microwell 96-well plates at a density of 10,000 cells/well or 100µL/well. They settled at the bottom of the wells in the 2 to the 3 hr incubation period. The cell culture media were replaced with 100µL of cyclo-RGDfK(TPP) diluted in DMEM. A concentration of 50µM of cyclo-RGDfK(TPP) was used as per previously established protocols.6,23 The cells were incubated for six days in a 37ºC humidified incubator and monitored daily. Spheroid measurements were taken on days four, five and six.
Lectin Inhibition of Spheroid Formation
Prostate cancer cells were grown in T25 or T75 tissue culture flasks until at least 90% confluent, after which they were plated in flat-bottom microwell 96-well plates at a density of 10,000 cells/well at 100µL/well. They settled at the bottom of the wells in the 2- to the 3 hr incubation period. The medium was then replaced with lectin, either AOL or UEA-1, diluted in DMEM for an hour following initial incubation. Various concentrations (5, 10 and 25 µg/mL) were diluted in DMEM, and followed by 100µL of cyclo-RGDfK(TPP) in DMEM. A concentration of 50µM of cyclo-RGDfK(TPP) was used as per previously established protocols.6,23 Cells were incubated for seven days in a 37ºC humidified incubator and monitored daily.
Phase-Contrast Microscopy
Cells were plated and grown in microwell 96-well plates. The cells in the individual plates were visualized using an inverted phase-contrast microscope. Changes in cellular morphology, aggregation and spheroid formation were monitored with an image acquisition using a scope-mounted camera (Fischer Scientific). Images were taken throughout the experiment at 10× or 20× objectives on days 1 through day 6 to monitor spheroid development.
Manual Spheroid Identification and Measurement
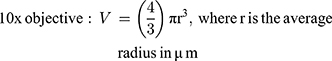
Phase-contrast images were uploaded to PowerPoint and annotated manually. A “compact, rounded sphere with distinct border, containing cells indistinguishable from one another”6,23 was identified and labeled with a number. Only spheroids measuring ≥ 60µm in diameter were included in the sample.23,24 Here, “microspheroids” were defined as collections of cells that possess the morphological criteria outlined above but do not measure ≥ 60µm in diameter. The diameter of the spheroids was measured manually using the scale bar obtained in phase-contrast images. The background of the scale bar obtained from phase-contrast images is made transparent by Photoshop so that the bar can be used directly as a digital ruler with precision. The scale bar was then overlaid onto spheroids and rotated to measure their diameters. Each spheroid was subject to two diameter measurements which were then averaged and divided to calculate the average radius, as per previously established protocols.6,23 Only images with the 10× objective were used for spheroid volume calculations using the following formula for calculating the volume, V, of a sphere:
Precision, p, took into account false positives and was used as a metric to assess manual spheroid identification. False positives have the morphological characteristics outlined in the definition of a spheroid but do not meet the diameter threshold of ≥ 60µm.
Automated Spheroid Detection and Measurement
The automated spheroid detection system was implemented after an image preprocessing phase using LabelImg software, training of the YOLOv2 convolutional neural network (CNN), extraction of the output JSON files for volume measurement, and validation using appropriate evaluation metrics. The workflow is summarized in Figure 1.
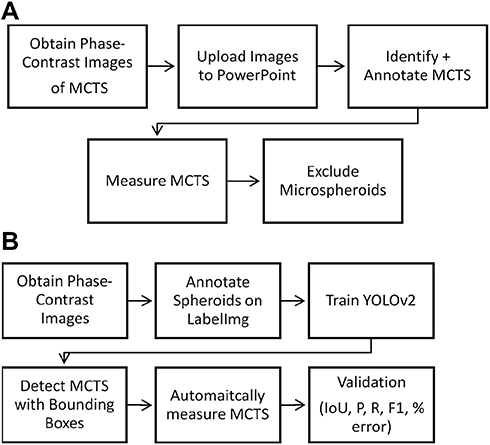 |
Figure 1 Overview of manual and automatic MCTS analysis. (A) Manual approach for spheroid identification and measurement. (B) An automated approach for spheroid detection and measurement using YOLOv2. Validation metrics include precision, recall, F1 score, IoU, and volume estimation accuracy. |
Image Preprocessing
Phase-contrast images are stored in a PASCAL VOC format to conform to the YOLOv2 Darkflow framework. Phase-contrast images were relabelled using LabelImg, an open-source graphical image annotation tool written in Python, that labels object bounding boxes using the acceptable annotation standard for YOLOv2 Darkflow. LabelImg contains the following information about the image: folder, associated file name, image width, image height, and the image depth (representing the color channels red, green, and blue). Each spheroid is labeled with a name representative of its class, the x max, the y max, x min, and y min pixel values, with a top left-justified starting point for the scale.
YOLOv2
The system was implemented using YOLOv2 Darkflow in Dr. Zulkernine’s lab at the Queen’s School of Computing. Darkflow is a TensorFlow translation of Darknet, an open-source neural network framework written in C. The network used a sum-squared error between predictions and ground truth object to calculate the loss of function. LabelImg achieves labeling and saves annotations as an XML file in the PascalVOC format. Training is performed using CAC high-performance computing machines from the Graham cluster using a 14 core Intel E5-2683 V4 CPUs, running at 2.1 GHz. When detecting bounding boxes (BB), YOLO divides the image into a 13×13 grid, with each cell in the grid responsible for predicting five BB. Each cell predicts both the existence and class of a BB. The BB is characterized according to these variables: the (x, y) coordinates relating to the center of the bounding box relative to the cell bounds, (w, h) coordinates according to the width/height bounding box relative to image dimensions, and the confidence of the extent to which an object is present within the BB. The combined confidence is also computed, which takes into account both BB presence and class prediction.
Machine Training
The annotations were defined as “ground-truth.” The data were split into 65–35% for training and testing. 598 images were used for training, and 317 images were used for testing the model, for a total of 915 images. Out of 317 images used to train and test the YOLOv2 network, 94 contained images of spheroids that had been treated with AOL and UEA-1 lectin, referred to as the “fucose dataset.” This was a custom set of data generated by incubating DU145 MCTS with AOL and UEA-1 lectin at various concentrations on the sixth day following application of cyclo-RGDfK(TPP) peptide to the cell culture monolayer. The image object detection system is compared to a manual analysis approach to assess the potential of YOLOv2 as a tool for ascertaining the role of fucosylation in spheroid formation.
Performance Measurement
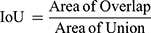
The following metrics were used to assess the performance of the spheroid detection system: Intersection over Union (IoU), % error, precision, recall, and F-score. The Intersection over Union (IoU) method is used to measure spheroid detection accuracy. The ground-truth bounding box (BB) is the manually annotated output from the LabelImg software, and the predicted bounding box is the output from YOLOv2. The formula below was used to calculate IoU:
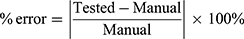
The accuracy of the spheroid volume measurements obtained using machine learning was assessed using the percent error formula, where tested values represent volume measurements using the automated approach, and the manual values represent volume measurements obtained using the manual approach:
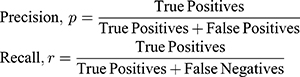
The positive predictive value of a test measures the number of times false positives are not identified. Recall or the negative predictive value of a test measures the number of times the false negatives are not identified. Precision, p, and recall, r, were calculated using true positives, false negatives, and false positives, respectively. A true positive is an MCTS with spheroidal morphology, also known as “a compact, rounded sphere with a distinct border, containing cells indistinguishable from one another”,23,24 and meets a minimum diameter threshold. A false negative represents a spheroid that was missed, and a false positive represents a spheroid has been falsely identified or incorrectly labeled. The F-score (F1) is a measure of a test’s accuracy incorporating both precision and recall. The formulae below were used:

Statistical Analysis
Data were analyzed using GraphPad Prism (version 6.0; San Diego, CA). A one-way ANOVA at 95% confidence interval was used to compare the ICC quantifications using Fischer’s LSD (Least Significant Difference) test. The D’Agostino-Pearson omnibus K2 test for normality was used to test the normality of the frequency distributions. The spheroid volumes were compared by ANOVA using the Holm-Sidak’s multiple comparisons test with 95% confidence with adjusted p values. In order to compare the manual volume estimations to the automated volume estimations performed by YOLOv2, using a nonparametric test (n < 30). Thus, a two-tailed, unpaired, Mann–Whitney U-Test at 95% confidence interval was used to compare the manual vs automated volume estimations using the fucose dataset described above (Figure 2).
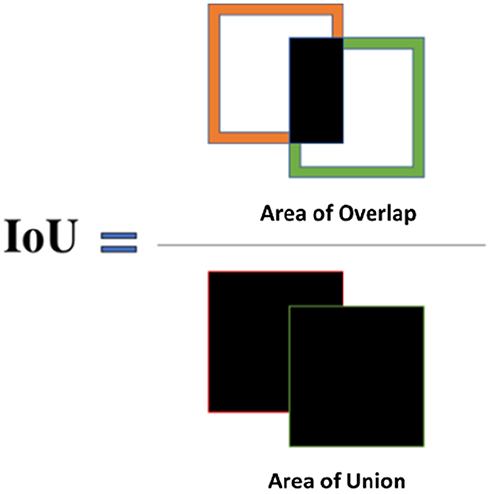 |
Figure 2 Schematic of the Intersection over Union method for assessing MCTS detection accuracy. The “Intersection over Union” (IoU) is used to assess MCTS detection accuracy. IoU is calculated using the ground-truth bounding box, also known as the manually annotated boxes obtained from LabelImg, and the predicted bounding boxes, or the output from YOLOv2. |
Results
DU145 Prostate Cancer Cells Express α-1,6- and α-1,2-Fucose in a 4:1 Ratio
DU145 prostasphere formation using the cyclo-RGDfK(TPP) peptide method was previously investigated and reported by us.24 Here, the relative cell-surface expression levels of α1,2 and α1,6 fucose linkages were analyzed in non-permeabilized DU145 cells with UEA-1 lectin specific for α-1,2-fucose and AOL (α-1,6-fucose) using lectin cytochemistry (Figure 3) and flow cytometry analyses (Figure 4). DU145 cells showed weak expression of α-1,2-fucose and moderate to high expression levels of α-1,6-fucose on the cell surface (Figure 3A). Quantification of lectin cytochemistry data showed that DU145 cells expressed significantly higher levels of α-1,6- compared to α-1,2 fucose linkages on the cell surface (Figure 3B). These findings were confirmed by flow cytometry analysis in Figure 4. Out of the 100% gated DU145 cell population, 56.9% of the cells expressed α-1,6-fucose, and 14.5% expressed α-1,2-fucose linkages.
 |
Figure 3 Cell-surface expression of core and terminal fucose on DU145 cells determined by cytochemistry. (A) Cytochemistry to determine the expression of α-1,6 and α-1,2 linked fucose (Fuc) on the surface of non-permeabilized DU145 cells. DU145 cells were stained with biotinylated lectins, AOL specific for α1,6, and UEA-1 specific for α1,2, for Fuc. Stained cells were then treated with DyLight 594 streptavidin. The background control was cells with only DyLight 594 streptavidin staining. Images were taken using an epifluorescent microscope using a 20× objective. The bars represent 100µm. The images are representative of three fields of view in two independent experiments. (B) Quantitative analysis was performed by assessing the density of cell staining corrected for background for four separate image panels, using Corel Photo-Paint 8.0. Each bar in the graph represents the mean fluorescence corrected density of staining ± standard error of the mean (S.E.M.) for all cells within the corresponding images. Results were compared by a one-way ANOVA with a 95% confidence interval using Fischer’s LSD test. *p < 0.01, **p < 0.003 (n = 4). |
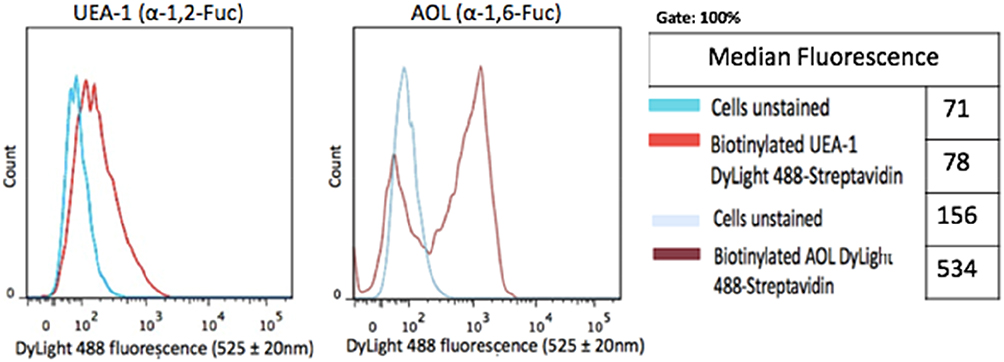 |
Figure 4 Cell-surface expression of core and terminal fucose on DU145 cells determined by flow cytometry. DU145 cells were stained with biotinylated lectins, AOL specific for α-1,6, and UEA-1 specific for α-1,2 for Fuc. Stained cells were then treated with DyLight 594 streptavidin. The background control was cells with only DyLight 594 streptavidin staining. Cells were analyzed by Beckman Coulter Cytomics FC500 flow cytometry and CxP software (Beckman Coulter). Overlay histograms are displayed. The median fluorescence for each histogram is assessed for 5×10⁵ acquired cells (100% gated). The data are a representation of one out of two experiments showing similar results. |
Pretreatment of DU145 Cells with AOL and UEA-1 Lectin Specific for α-1,6-Fucose and α-1,2-Fucose Linkages Inhibited Dose-Dependently MCTS Formation
To test the role of fucosylation on spheroid formation, we performed a lectin inhibition assay where monolayers of DU145 cells (Figure 5A) were pretreated with Aspergillus oryzae l-fucose-specific lectin AOL (α1,6-fucose), or Ulex Europaeus agglutinin I lectin UEA-1 (α1,2-fucose) for 1 hr in a dose-dependent manner together each with 50 μM cyclo-RGDfK(TPP) for 5 days of incubation. DU145 MCTS were identified by phase contrast microscopy and their volume measurements were manually performed using the threshold diameter of 40 µm and 60 µm, previously reported by us.24 Pretreatment of DU145 cells with 5 µg/mL of AOL show more satellite formation of cell colonies at the edges of the MCTS (Figure 5C) compared to control MCTS (Figure 5B). In Figure 5D and E, DU145 cell aggregates were formed following pretreatment of AOL lectin. In Figure 5F–G, tight compact DU145 MCTS were formed when the cells were pretreated with 5 and 10 µg/mL UEA-1 lectin.
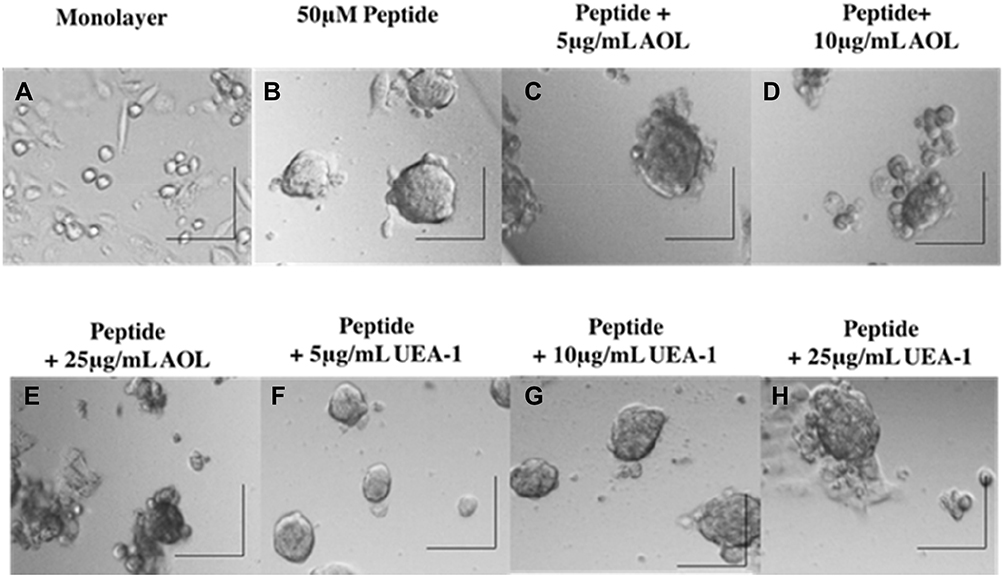 |
Figure 5 Phase-contrast images of DU145 MCTS formation on day 5 after incubation with cyclo-RGDfK(TPP) peptide and blockade of core and terminal fucose with AOL and UEA-1 lectins. Phase-contrast images of DU145 cells treated with a combination of 50 µM cyclo-RGDfK(TPP), referred to as “peptide,” and AOL or UEA-1 lectin at concentrations of 5 µg/mL, 10 µg/mL, and 25 µg/mL. Cells at 10,000 were plated per well in a 96-well plate for 5 days. (A) Monolayer of DU145 cell culture, (B) DU145 MCTS formed with peptide only, (C) DU145 MCTS formed with peptide + 5 µg/mL AOL, (D) DU145 MCTS formed with peptide + 10 µg/mL AOL, (E) DU145 MCTS formed with peptide + 25 µg/mL AOL, (F) DU145 MCTS formed with peptide + 5 µg/mL UEA-1, (G) DU145 MCTS formed with peptide + 10 µg/mL UEA-1, and (H) DU145 MCTS formed with peptide + 25 µg/mL UEA-1. The images are representative of two fields of view in two independent experiments. The images were taken at a magnification of 100×. The scale bar in each image represents 100 µm. |
The effect of blocking/masking α1,6-fucose, or α1,2-fucose with specific lectins on DU145 MCTS volumes was studied in a lectin inhibition assay. Spheroid volumes were defined as a compact rounded spheroid with a distinct threshold border of diameter ≥40 and ≥60 μm containing cells indistinguishable from one another.
Using the threshold diameter of 60 µm, blocking α1,6-fucose with 5 µg/mL AOL lectin 1 hr before the addition of 50 µM cyclo-RGDfK(TPP) was not statistically significant in reducing DU145 MCTS volumes compared to the untreated control (Figure 6). With 10 µg/mL AOL, the results showed significantly smaller MTCS volumes, and unexpectedly, 25 µg/mL AOL resulted in the formation of only six small MCTS (data not shown). Using UEA-1 specific for α-1,2-fucose linkages at 10 and 25 µg/mL resulted in significant MCTS volume reduction (Figure 6).
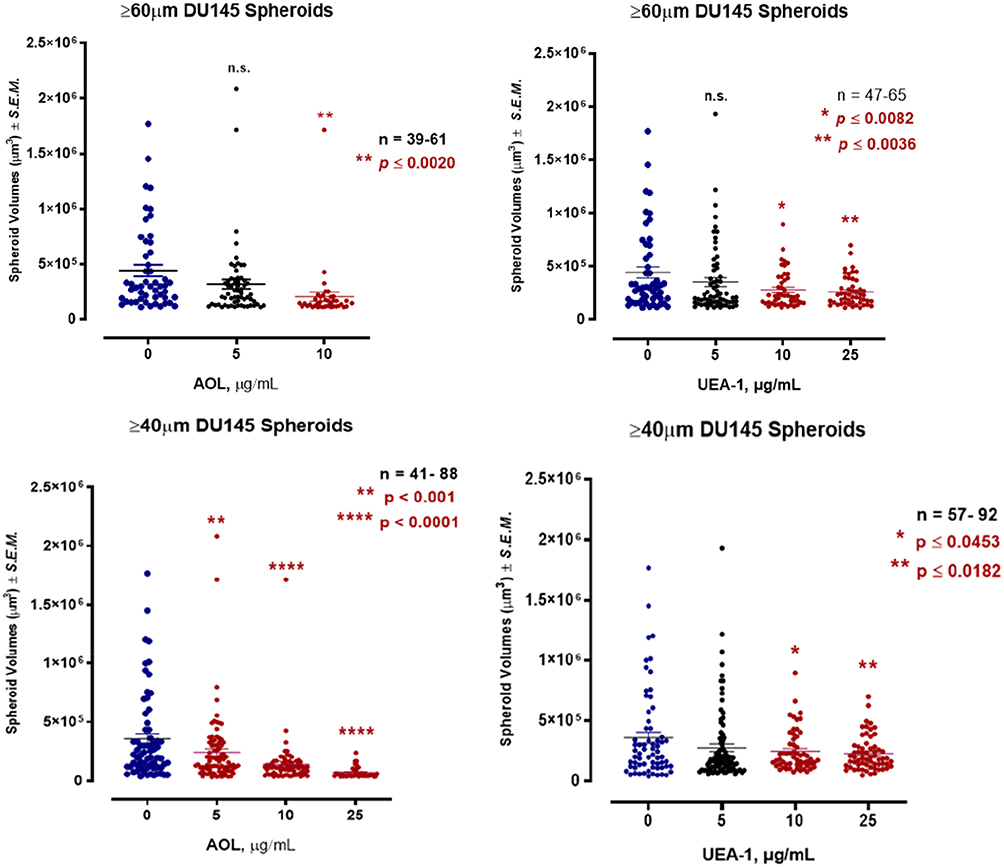

For DU145 MCTS using the threshold diameter of 40 µm, the dataset was expanded to include microspheroids which are aggregates of cells depicted in Figure 5D and E following AOL. Blocking α-1,6-fucose linkages with AOL specific lectin resulted in a dose-dependent reduction in spheroid volume (Figure 6), which was comparable to the results with 60µm diameter threshold. The minimum concentration of 5 µg/mL AOL lectin was sufficient to significantly reduce spheroid volumes. Blocking α-1,2-fucose terminal linkages with the UEA-1 specific lectin also resulted in a dose-dependent reduction in spheroid volumes. These latter results were found to be similar to those using the spheroid diameter threshold of 60µm.
The viability of the DU145 cells in the presence of increasing concentrations of the lectins was measured by the WST-1 cell proliferation assay. The DU145 cells were viable in a dose-dependent response treated with both AOL and UEA-1 for 24, 48 and 72 hrs (Figure 7).
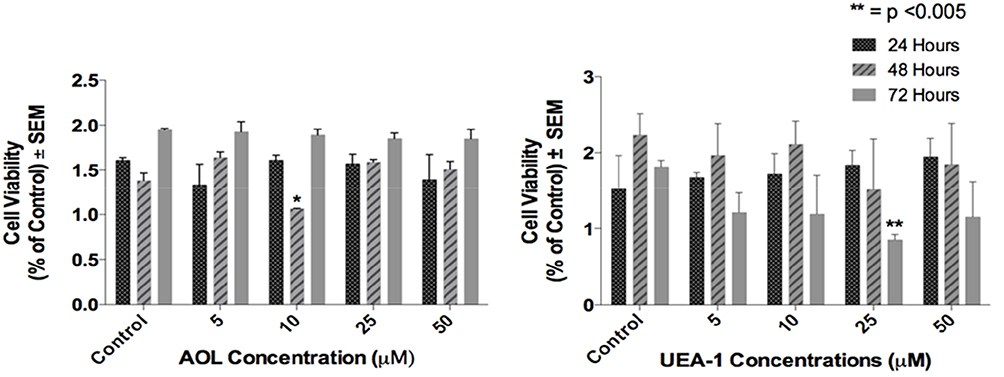 |
Figure 7 Cell viability of DU145 cells treated with AOL or UEA-1 lectins at indicated dosages using the WST-1 assay. Cells were incubated in 96 well plates (5000 cells/well) and allowed to adhere for 24 h in 1× DMEM media containing 10% FCS. The media were replaced with fresh DMEM media containing 5% FCS without or with various concentrations of lectins for 24, 48 and 72 hr as predetermined optimally. Cell viability was expressed as a percent of control ± S.E.M. of two-three independent experiments. *p < 0.005 (n = 6). |
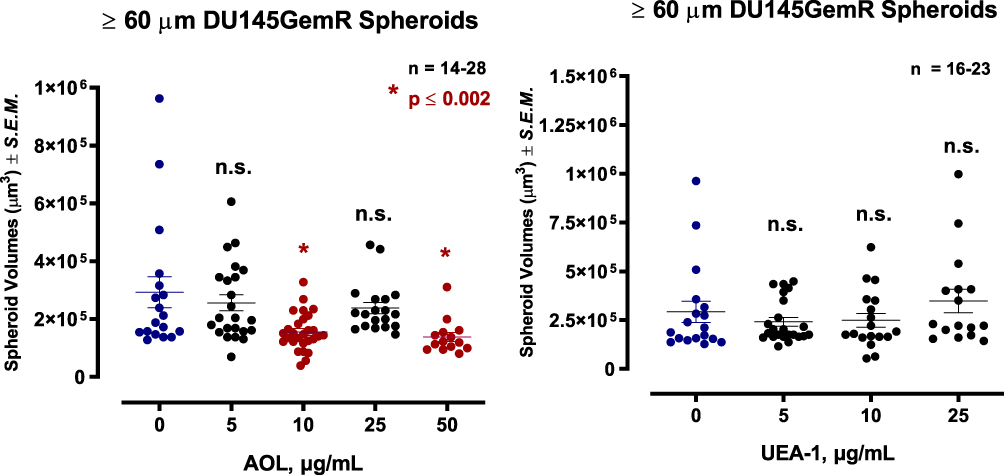
Pretreatment of DU145 GemR Cells with AOL and UEA-1 Lectins in a Dose-Dependent Manner Formed Satellite Formation of Cell Colonies at the Edges of the MCTS
DU145GemR cells formed satellite colonies of cells at the edges of the MCTS with 50 µM cyclo-RGDfK(TPP) peptide at day 5 incubation (Figure 8). Pretreatment of DU145GemR cells with AOL lectin 1 hr before the addition of cyclo-RGDfK(TPP) peptide formed irregular MCTS with reduction in spheroid volumes in a dose-dependent response (Figure 9). Interestingly, in contrast, there were no reductions in spheroid volumes using UAE-1 lectin.
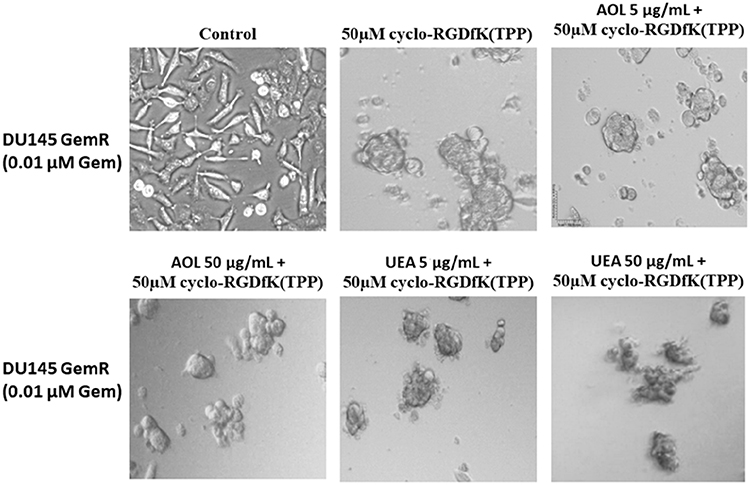 |
Figure 8 Phase-contrast images of DU145 GemR MCTS formation on day 5 with cyclo-RGDfK(TPP) peptide and pretreatment with AOL and UEA-1 lectins. Phase-contrast images of DU145 GemR cells pretreated with AOL or UEA-1 lectin at concentrations of 5 µg/mL and 50 µg/mL,for 1 hr followed with 50 µM cyclo-RGDfK(TPP). 10,000 cells were plated per well in a 96-well plate for 5 days. The images are representative of two fields of view in two independent experiments. The images are taken at a magnification of 100×. |

The PC3 Cell Line Is Unable to Form MCTS by Using Cyclo-RGDfK(TPP) Peptide-Mediated Self Assembly
Haq et al reported that PC3 and PC3GemR cells formed irregular multicellular aggregates at all concentrations of cyclo-RGDfK(TPP) peptide.24 No visible MCTS were seen after 6 days. At 100 µM of peptide, PC3GemR cells formed irregular multicellular aggregates. PC3 cells revealed a mixture of adhered monolayer cells and irregular multicellular aggregates. The data in Figure 10 support the lack of PC3 prostate cells MCTS formation with cyclo-RGDfK(TPP) peptide-mediated self-assembly. The reasons for these findings are unclear. Tran et al28 have shown that PC3 cells lacked E-cadherin expression, which may explain the difficulty of PC3 cells forming spheroids with our peptide method. The cyclo-RGDfK(TPP) peptide-mediated self-assembly of cells relies on the biochemical interactions of cell–cell adhesions involving α5β1 integrin6,7 and E-cadherin.8,29
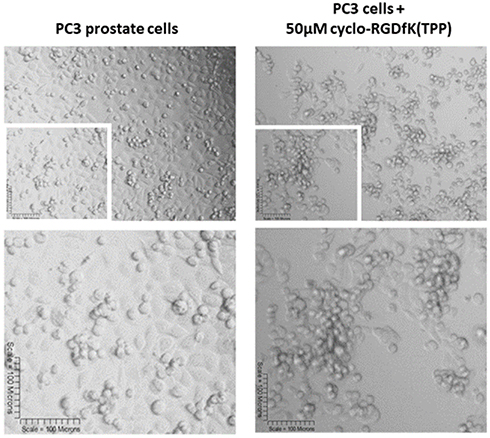 |
Figure 10 Phase-contrast images of PC3 cell line at 10× objective (top) treated with 50 µM cyclo-RGDfK(TPP) peptide 5 days. 10,000 cells were plated per well in a 96-well plate for 5 days. |
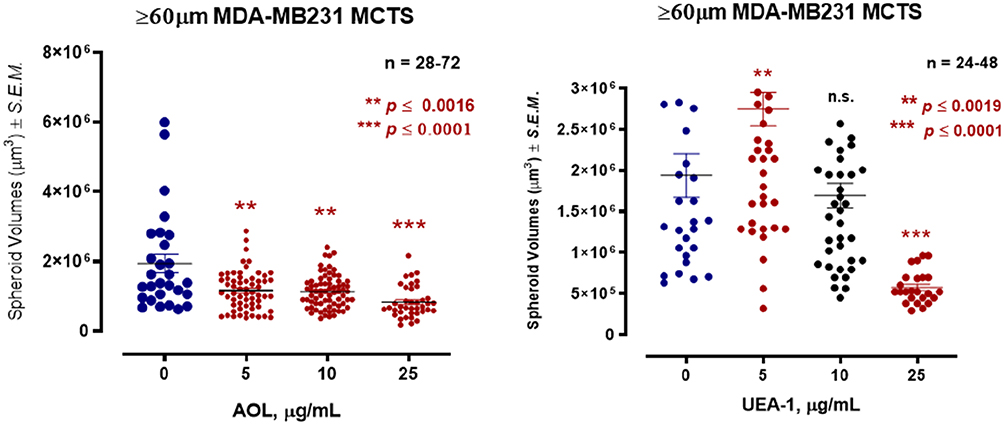
Pretreatment of MDA-MB231 Breast Cancer Cells with AOL and UEA-1 Lectins Inhibited MCTS Formation in a Dose-Dependent Manner
Terao et al30 reported that sphere-forming cells and pancreatic cancer PANC1 stem-like cells expressed high levels of fucosylated glycans. Using AAL and AOL lectins in Western blot analysis, they found that spheroid-forming cells demonstrated increased binding to both lectins, when compared to the monolayer cells.30 These findings may be explained by the branched N-glycans, including fucosylation sites, covalently conjugated to cell adhesion molecules. These glycans that are linked to both cadherins and integrins, are known to play key structural and functional roles in cell-cell recognition and interaction.31 Consistent with this premise, several other reports have shown that breast carcinoma cell lines,32 hepatoma29 and hepatocytes33 are able to form spheroids dependent on E-cadherin. Iglesias et al32 analyzed the capability of eleven breast cancer cell lines to form mammospheres. Only MCF7, T47D, BT474, MDA-MB-436 and JIMT1 cells could be passaged and developed into mammospheres, while SKBR3, MDA-MB-231, MDA-MB-468 and MDA-MB-435 could only form aggregates. For mammosphere formation in these latter studies, single cell suspensions were plated in 6-well tissue culture plates covered with poly-2-hydroxyethyl-methacrylate to prevent cell attachment at a density of 1,000 cells/mL in serum-free DMEM supplemented with 1% L-glutamine, 1% penicillin/streptomycin, 30% F12, 2% B27, 20 ng/mL epidermal growth factor (EGF) and 20 ng/mL basic fibroblast growth factor (FGFb).32 This medium was made semi-solid by the addition of 0.5% methylcellulose to prevent cell aggregation 7 days in culture.
In Figure 11, MDA-MB-231 breast cancer cells formed tight large compacted spheriods with 50 µM cyclo-RGDfK(TPP) peptide-mediated self-assembly for five days, which is in contrast to the method used by Iglesias et al32 Here, it is noteworthy that the relative levels of specific sialoglycan structures on the cell surface correlate with the ability of cancer cells to form avascular multicellular tumor spheroids and in vivo xenograft tumors.23 Akasov et al6 also reported that the cyclo-RGDfK(TPP) peptide mimicks the natural ECM protein’s ability to induce cell aggregation via α5β1 integrin. Using the threshold diameter of 60 µm, AOL lectin significantly reduced the spheroid volumes dose-dependently compared to the control group (Figure 12). UEA-1 lectin had no effect on the spheroid volumes at any of the concentrations of the lectin except at 25 µg/mL.
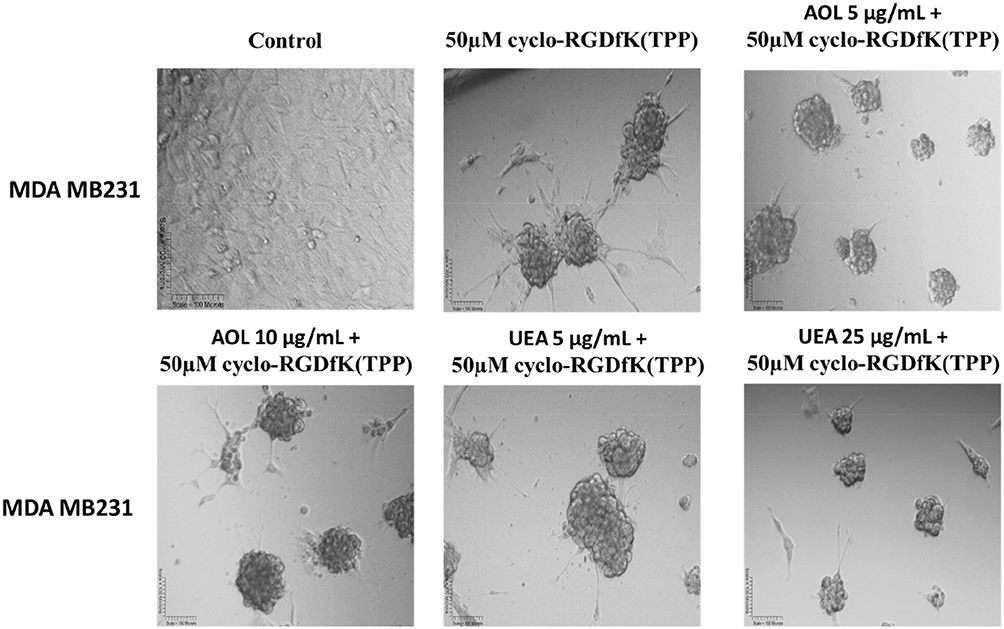 |
Figure 11 Phase-contrast images of MDA MB231 MCTS formation on day 5 with cyclo-RGDfK(TPP) peptide and pretreatment with AOL and UEA-1 lectins. Phase-contrast images of MDA MB231 cells pretreated with AOL or UEA-1 lectin at concentrations of 5 µg/mL and 50 µg/mL, for 1 hr followed with 50 µM cyclo-RGDfK(TPP). Cell at 10,000 were plated per well in a 96-well plate for 5 days. The images are representative of two fields of view in two independent experiments. The images are taken at a magnification of 100×. |

Re-Evaluating the Definition of Spheroid Threshold Diameter of ≥60µm and ≥40µm
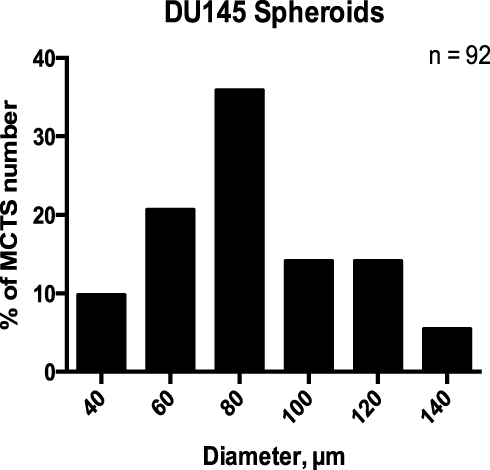
To determine whether the spheroid threshold diameter of ≥60µm is a suitable classifier of spheroid according to statistical analyses, the mean DU145 MCTS diameter was computed on day five using with 50 µM of cyclo-RGDfK(TPP) peptide. Manual spheroid detection was performed by visual microscopy to detect the morphology of the spheroids. Spheroids were subjected to diameter measurements using the scale-bar on the phase contrast images at a magnification of 100×. For this study, morphology was sufficient to classify MCTS. The size-frequency distribution included spheroids, measuring ≥40 µm and ≥60 µm in diameters, and microspheroids. A size-frequency distribution generated from 92 DU145 MCTS diameters showed a Gaussian distribution (Figure 13), confirmed by the D’Agostino-Pearson K2 omnibus test for normality (p > 0.05). Table 1 summarizes the statistical analysis performed on the dataset. The proposed definition of ≥40 µm (representing the mean - two standard deviations (SD), rounded to the nearest tenth) was chosen as a threshold diameter for investigating the dataset observed with the lectin inhibition assays. The mean minus two SDs was chosen as the diameter threshold based on the assumption that 95% of values in a normal distribution fall within two standard deviations of the mean.34
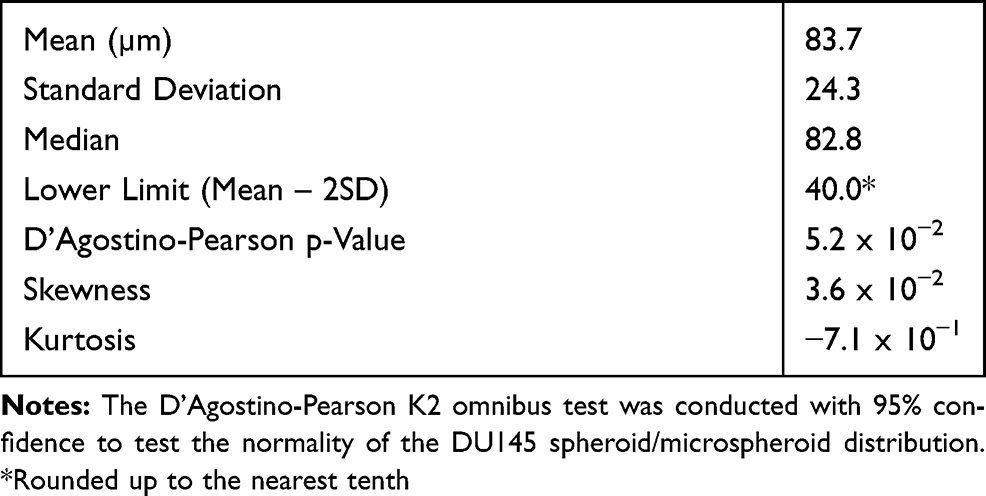 |
Table 1 Descriptive Statistics Accompanying the DU145 MCTS Size-Frequency Distribution |

Size Frequency Distributions of Spheroids and Microspheroids Treated with Lectin
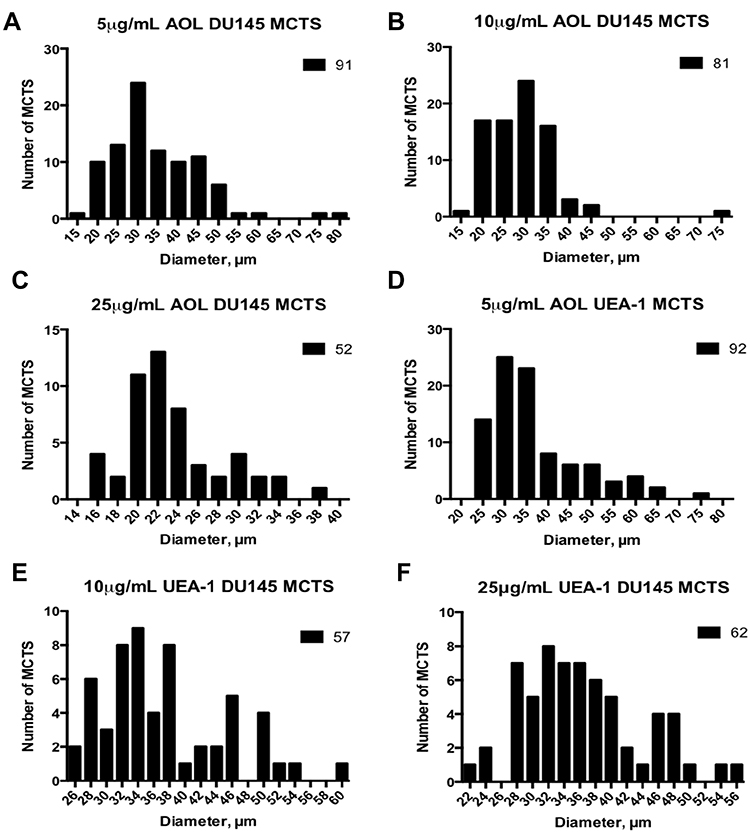
Size-frequency distributions of the diameters of DU145 spheroids and microspheroids were measured. Diameters ranging from 15 to 75 µm were recorded. The distributions were not normal and skewed positively, except for the higher concentration of 25 µg/mL UEA-1 lectin. Actual spheroids measuring ≥60µm were outliers in the majority of the size-frequency distributions (Figure 14). The mean diameter of spheroids and microspheroids for the indicated conditions was 34.7 µm, 28.7 µm, and 23.5 µm for 5 µg/mL, 10 µg/mL, and 25 µg/mL AOL concentrations, respectively (Table 2). The mean diameter of spheroids and microspheroids was 37 µm, 37 µm, and 36.3 µm for 5 µg/mL, 10 µg/mL, and 25 µg/mL UEA-1 lectin, respectively (Table 2). For distributions that are profoundly skewed to the right, the majority of the sample type may be composed of microspheroids as opposed to actual spheroids.
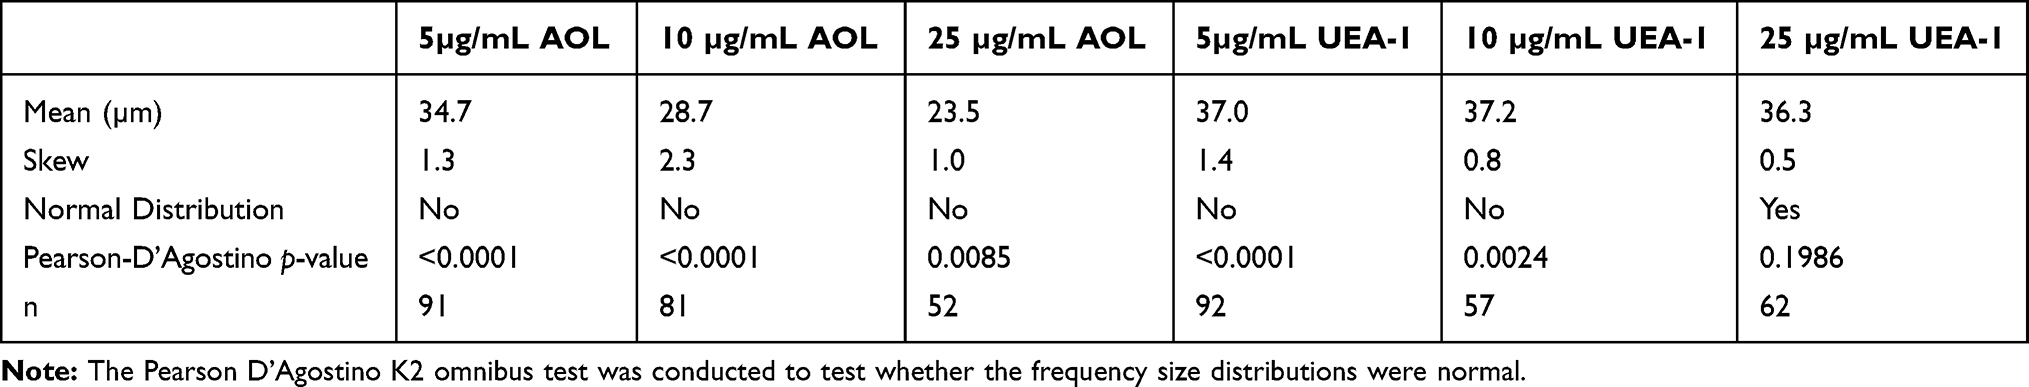 |
Table 2 Summary of Statistics for Frequency Size Distributions of DU145 Spheroids and Microspheroids Treated with Lectin |

High Object Detection Precision Using MCTS Diameter Threshold of ≥40µm
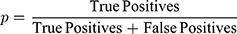
DU145 spheroid identification was further assessed using object detection precision measurements. Precision is calculated by dividing the number of true positives by the sum of true positives and false negatives. A false positive represents a collection of cells identified as spheroids even though they do not meet the criteria as identified in our previous report by Haq et al24 The false-positive measurements commonly occur when MCTS possess the appropriate spheroidal morphology but do not meet the minimum threshold diameter of 60 µm for classification as a spheroid. The overall precision of 95.6% for spheroid identification was achieved when 40 µm was used as the threshold diameter when compared to an overall precision of 63.6% using the 60 µm threshold diameter measurements (Figure 15) and Table 3. When the 60µm threshold diameter measurements were used in the lectin assays, the detection precision decreased from 77.4% to 11.5% with increased concentration of AOL lectin specific for α-1,6-fucose linkages (Figure 15A).
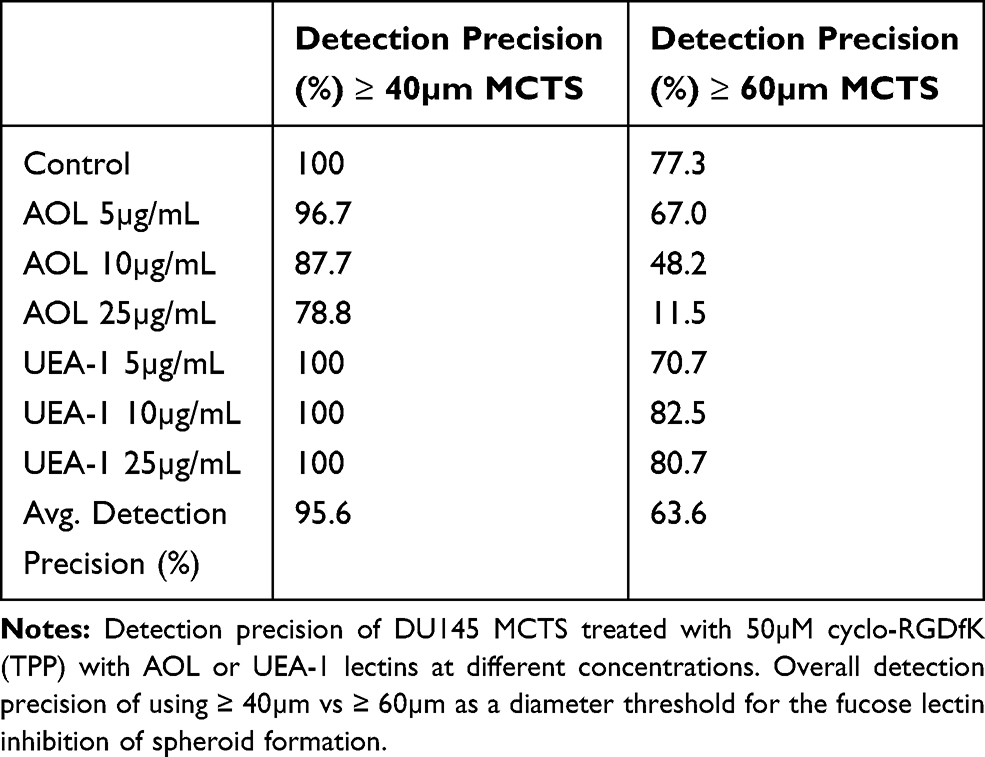 |
Table 3 Overview of Detection Precision for ≥ 40 and ≥ 60 DU145 MCTS in the Fucose Lectin Inhibition of Spheroid Formation |
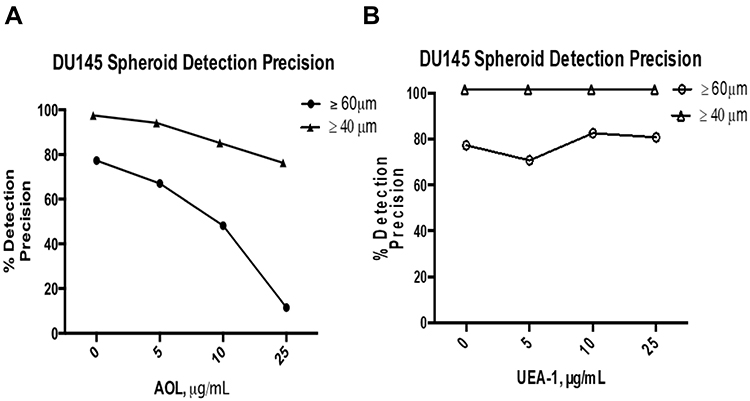 |
Figure 15 Comparison of the manual detection precisions of ≥40µm vs ≥60µm DU145 in the fucose lectin inhibition assay. Precision, p, is calculated using the formula, |
In contrast, the precision using MCTS diameter threshold of ≥40 µm remained high with a moderate reduction of 78.8% at the concentration of 25 µg/mL AOL. For the UEA-1 lectin specific for α-1,2-fucose linkages, the detection precision did not change significantly with increasing lectin concentrations using the ≥60 µm threshold diameter condition (Figure 15B); however, the precision of 100% was achieved with the ≥40 µm threshold diameter measurements.
Precision Image Object Detection of DU145 MCTS Using You Only Look Once Version 2 (YOLOv2) Analysis
YOLOv2 training analysis was used to provide a more precision of the image object detection. The dataset analysis consisted of 317 images and 575 spheroids for YOLOv2 training object detection using cyclic learning rates. Object detection identifies all objects in an image along with their class label and bounding boxes to train YOLOv2 (Table 4). Out of the 317 test set images, 94 images belonged to a class label of the “fucose” lectin dataset. These data were generated on day 6 following cyclo-RGDfK(TPP) peptide application with lectin concentrations of 5 and 10 µg/mL for AOL, and 5, 10, and 25 µg/mL for UEA-1. The dataset with the 25μg/mL AOL was not available. The YOLOv2 object detection was able to identify one to multiple MCTS per image (Figure 16). The object detection analysis contained an average of 1.7 spheroids per image. The YOLOv2 object detection training did not measure any false positives but did detect six false negatives, 11 true negatives, and 151 true positives (Table 4A and B). The evaluation of YOLOv2 MCTS detection performance on the fucose dataset is shown in Table 5, indicating the average precision of 100%, recall 95.9%, F1 98.1%, and IoU 69.1%. The precision which takes into account false positives was consistently high at 100% while recall (accounting for false negatives) ranged from 92.3–100% and F1 (accounting for both false positives and false negatives) ranged from 96.0–100% across all of the conditions of YOLOv2 analysis (Table 5). The IoU was used to measure the accuracy of spheroid detection by comparing the bounding box from the ground-truth annotations in the LabelImg software to the bounding box output by YOLOv2. The IoU was found to have the lowest statistic accuracy across the performance measurement metrics, ranging from 64.2–71.2%. The automated and manual measurements had comparable accuracy (Figure 17).
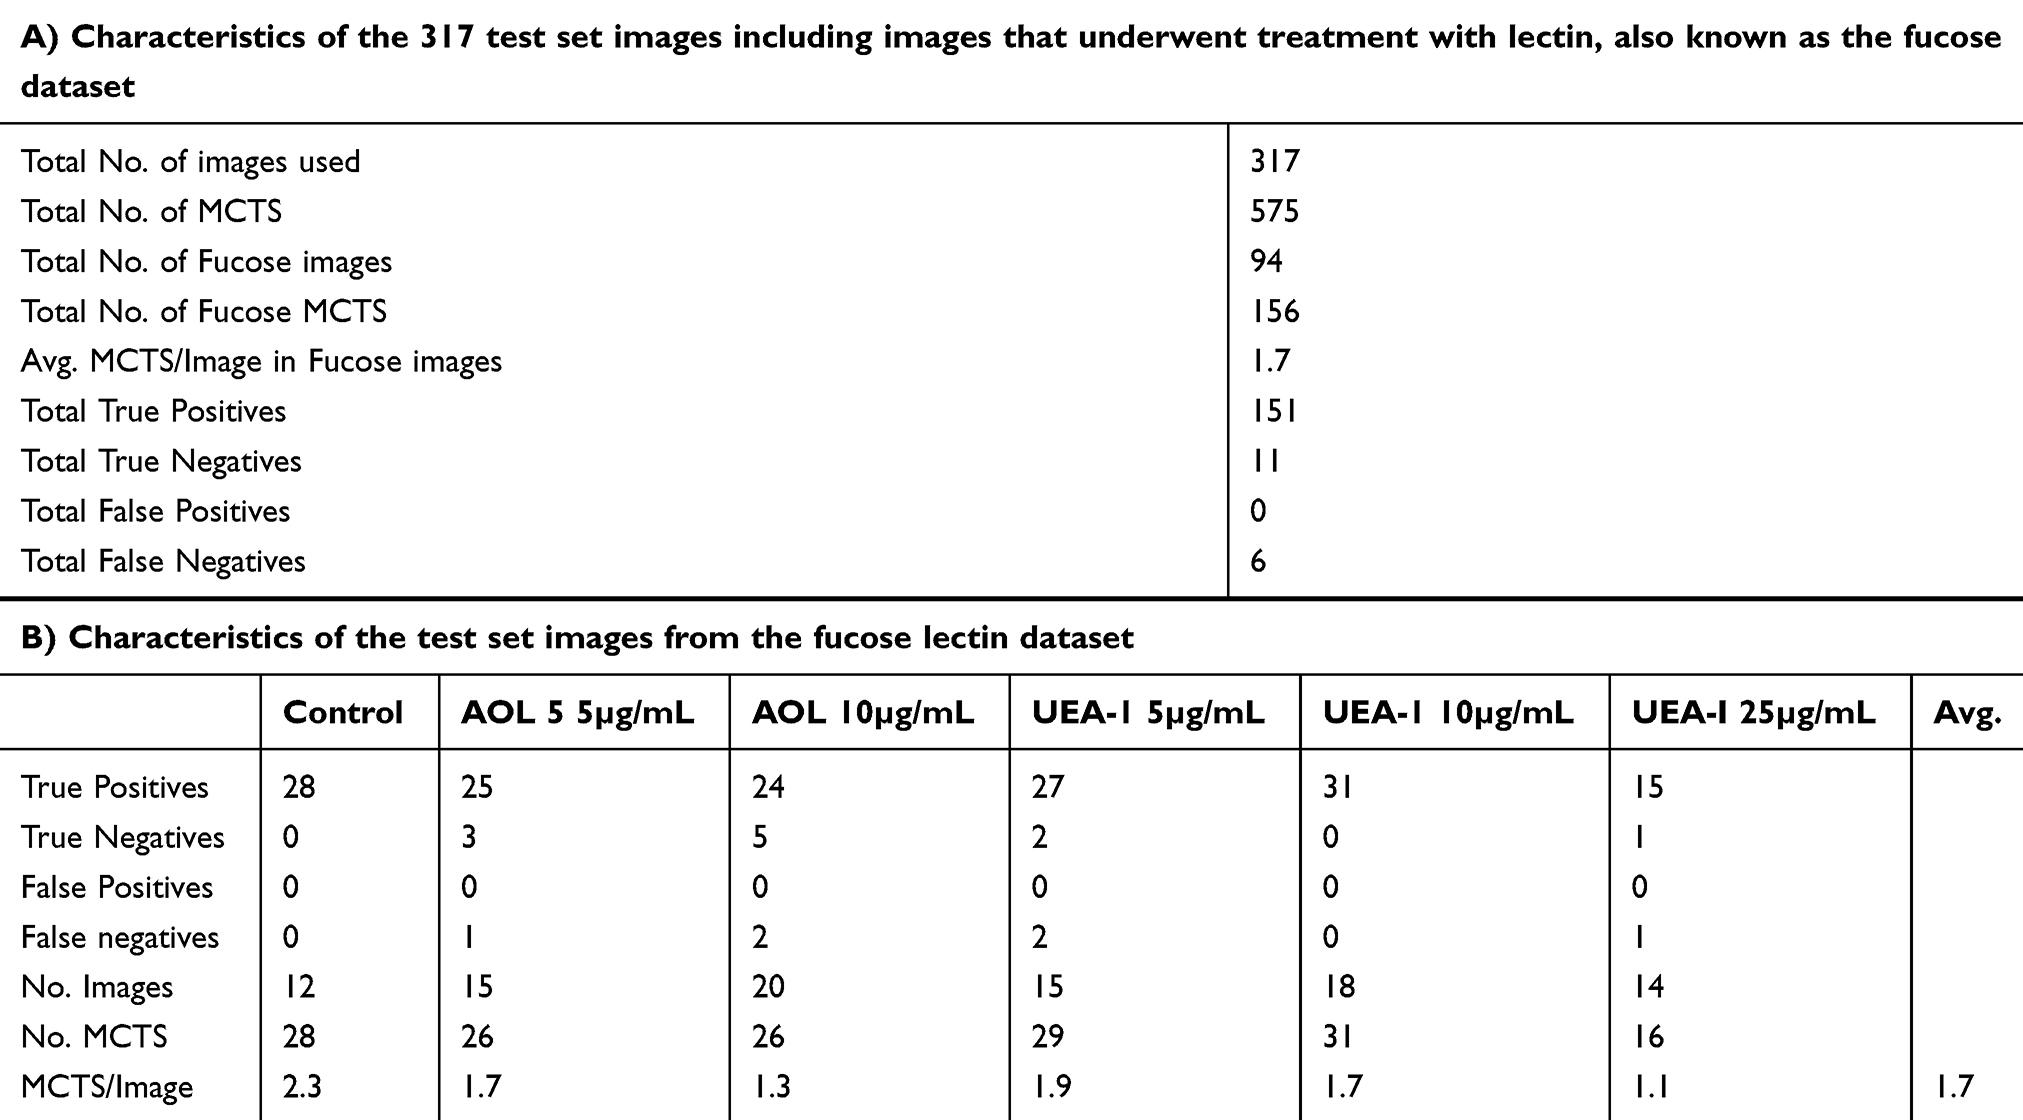 |
Table 4 Characteristics of the Test Set Images Used to Assess the Performance of YOLOv2 |
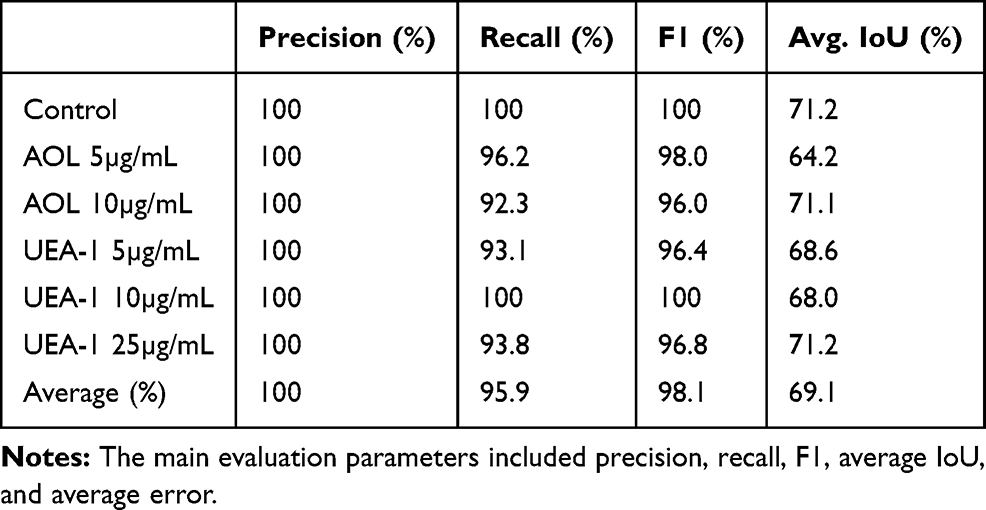 |
Table 5 Evaluation of YOLOv2 MCTS Detection Performance on the Fucose Lectin Dataset |
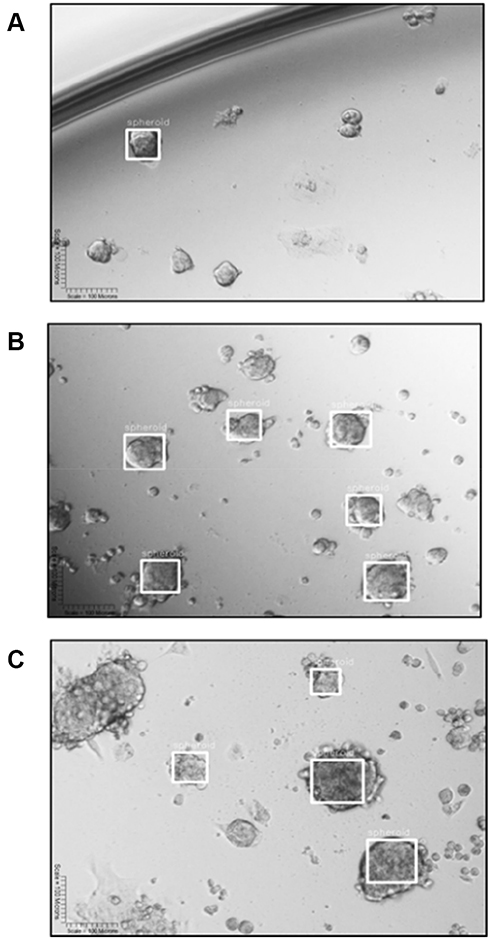 |
Figure 16 YOLOv2 training object detection of DU145 spheroids. (A) YOLOv2 divides an image into a 13×13 grid. (B) Each grid predicts the presence of a bounding box (BB) surrounding an object, represented as a white square, and identifies the confidence scores associated with this prediction. (C) YOLOv2 is trained to make a class prediction of the “spheroid” label above the BB. YOLOv2 can detect multiple spheroids of different sizes per image. |
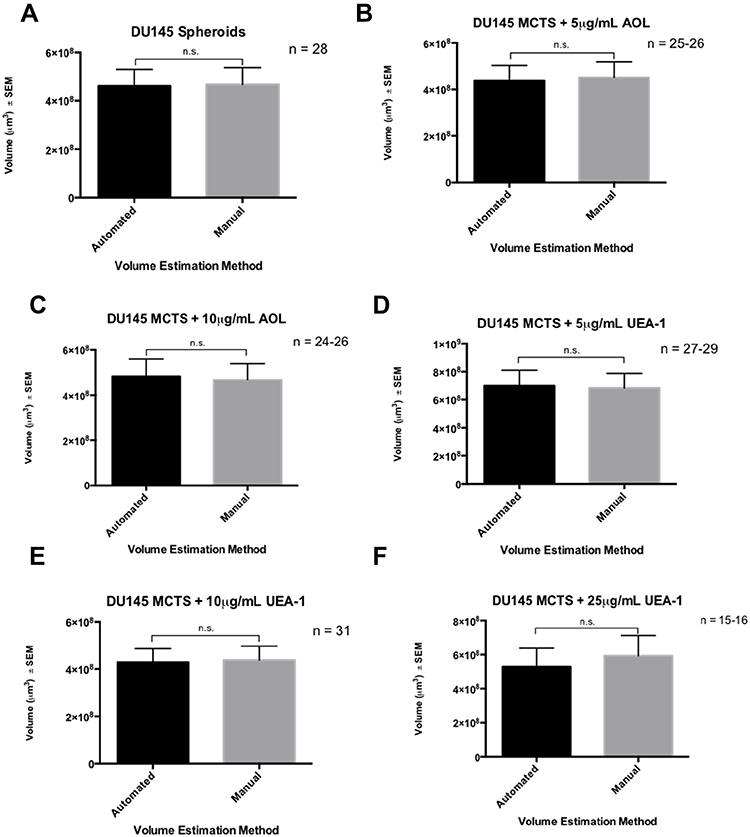

YOLOv2 Training Object Detection of the Spheroid Volume Is Comparable to the Manual Measurements
A custom fucose dataset of lectin conditions was generated to assess whether YOLOv2 training object detection of the spheroid volume was comparable to the manual measurements (Table 6). This dataset differed from the previous analysis on fucosylation described previously in two ways: the sample size of 15–31 MCTS per condition was small, and the spheroid volume measurements were conducted on day six following the application of cyclo-RGDfK(TPP) peptide to the DU145 cell culture. The manual spheroid detection and spheroid volume measurements were conducted as described previously.23,24 The calculated estimations were performed by the manual approach (the manual value), and the tested volume estimations obtained using YOLOv2 (the tested value). The percent error associated with the volume estimations performed by YOLOv2 ranged from 3.4–4.9%, and YOLOv2 had an average percent error of 4.1% for n = 15–31 MCTS (Table 6).
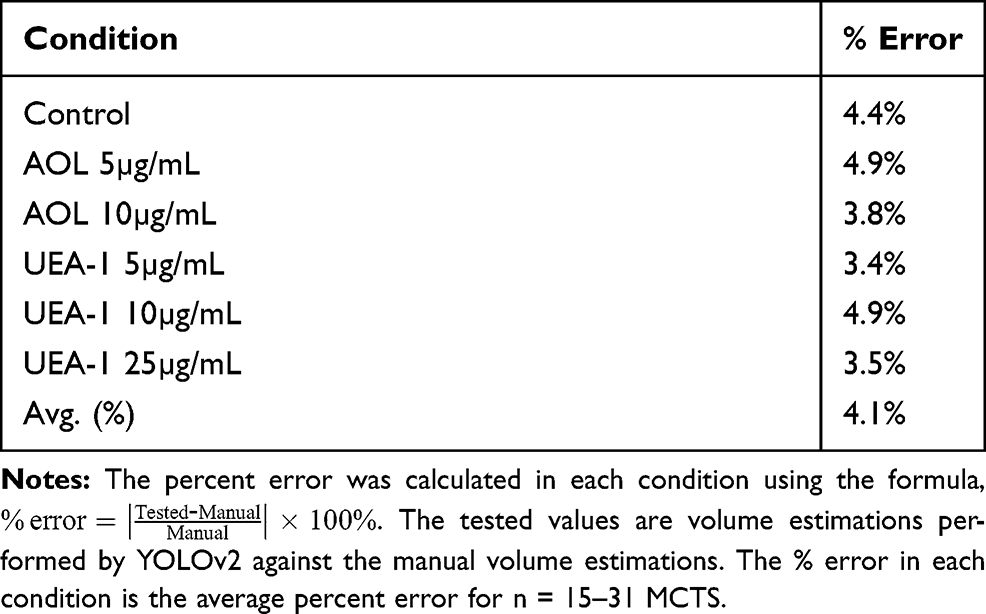 |
Table 6 Percent Error of YOLOv2 Volume Estimation on the Fucose Dataset |
Discussion
The core α-1,6-fucose fucosylation linkages facilitate prostasphere formation following the application of the cyclo-RGDfK(TPP) peptide to the monolayer culture of DU145 PCa cells. A reduction in prostasphere volume was observed with α-1,6-fucose specific AOL lectin and α-1,2-fucose specific UEA lectin following cyclo-RGDfK(TPP) peptide on day five. Using a spheroid diameter threshold of 40µm, the data showed a concentration-dependent reduction of DU145 MCTS volumes in response to the AOL lectin treatment for a sample size of 480 MCTS. Pretreatment of DU145GemR cells with AOL lectin 1 hr before the addition of cyclo-RGDfK(TPP) peptide formed irregular MCTS with reduction in spheroid volumes in a dose-dependent response. In contrast, blockage with UAE-1 lectin had no reduction in DU145GemR spheroid volumes in a dose-dependent response. Interestingly, the PC3 prostate cell line did not form spheroid with cyclo-RGDfK(TPP) peptide-mediated self-assembly. MDA-MB-231 breast cancer cells formed tight compacted spheriods with 50 µM cyclo-RGDfK(TPP) peptide-mediated self-assembly. AOL lectin significantly reduced the spheroid volumes dose-dependently compared to the control group. UEA-1 lectin had no effect on the spheroid volumes at any of the concentrations of the lectin except at 25 µg/mL.
Using lectin cytochemistry and flow cytometry, the core α-1,6-fucose expression was significantly higher than α-1,2-fucose on the cell surface of DU145 prostate cancer cells. The flow cytometry data showed that slightly more than half of the gated population of cells expressed α-1,6-fucose. These latter data may explain the variation in spheroid diameter threshold and volume following the addition of cyclo-RGDfK(TPP) peptide following treatment with α-1,6-fucose specific AOL lectin. The core α-1,6-fucose fucosylation linkages play a significant role in vertebrate N-glycans expressions.35 Awan et al have suggested that core fucosylation alters the orientation of N-glycans on integrin β1 using molecular modeling analyses.36 N-glycans on β1 integrin expressed with core fucosylation were found to be more rigid compared to the non-fucosylated N-glycans, which may be more restricted due to hydrogen bonds built in-between the fucose and asparagine.36 The molecular modeling data suggest that core fucosylation can reduce total glycan assembly and potentially favor the interaction of the glycan with other molecules.36 The specific N-glycan expressions are necessary for the optimal interaction of the α5β1 integrin binding with the RGD motif in cyclo-RGDfK(TPP) peptide. Treatment of DU145 cells with AOL specific for the core α-1,6-fucose may result in N-glycans losing critical structural conformations. Given the importance of the α5β1-RGD interaction for MCTS formation,6 the fucosylation of the α5 and β1 subunits may be critical for MCTS formation due to its control of the hydrogen bonds and structural orientations of the N-linked oligosaccharide.37
Altered glycosylation and, in particular, aberrant fucosylation has been associated with aggressive prostate cancer.38 The cyclo-RGDfK(TPP) approach forming small, avascular spheroids recapitulates cell-cell and cell-matrix interactions occurring in vivo. The reductions in prostasphere volume in response to fucose blockade with specific lectins are consistent with a group that has shown that pre-treating orospheres with the only commercially available fucosylation inhibitor, 2F-peracetyl-fucose, resulted in fewer and smaller spheroids.39 However, the effects of the fucosylation inhibitor were attributed to inhibition of FUT3-mediated fucosylation, which affects E-mediated selectin binding and cell extravasation.40 Additionally, our findings are consistent with other studies that have used lectins to interfere with glycosylation in MCTS formation with observed reductions in spheroid volume.23,24,41
To maximize reproducibility and efficiency, an accurate definition of a spheroid that incorporates a statistically relevant size restriction can improve the MCTS image object detection. Additionally, an automated image object detection system can improve the speed and accuracy of MCTS image object detection and volume estimations. Although the image object detection approach in this study is in its early stages of development and improvement, it is a novel and precise approach to analyzing avascular multicellular tumor spheroids. Improving analysis techniques is critical for assays requiring monitoring changes to spheroid volume over time, including drug screening assays, which currently are not always highly reproducible. Understanding multi-cellular spheroids and their implications of drug uptake and diffusion as well as their kinetics and extent of self-sorting have been eloquently reviewed.42–44 This present study focused on the impact of fucosylation in the formation of the spheroid platform using the cyclo-RGDfK(TPP) peptide self-assembly method that mimics the tumor microenvironment.
Conclusion
Given the importance of the α5β1-RGD motif interaction of the cyclo-RGDfK(TPP)-mediated spheroid self-assembly, fucosylation of N-glycans on the β1 subunit of integrin could play an essential role in facilitating prostasphere formation. Here, fucosylation impacts the formation of matrix-free 3D multicellular tumor spheroids (MCTS) from human triple negative breast MDA-MB231 cell line, prostate PC3 and DU145 cell lines and DU145 gemcitabine resistant (GemR) variant by using cyclo-RGDfK(TPP)-mediated spheroid self-assembly method. Blockage of the α-1,6- and α-1,2-fucose linkages with Aspergillus oryzae lectin (AOL) and Ulex Europaeus agglutinin I (UEA I) one hour before the addition of cyclic-RGDfK(TPP) peptide to the monolayer of the cancer cells resulted in a statistically significant dose-dependent reduction in spheroid volumes using spheroid threshold diameters of 40 and 60 µm. Application of a 40 µm threshold spheroid diameter measurements resulted in less false-positive ones compared to the 60 µm diameter threshold previously used in our studies.
In this study, we employed two analysis techniques to determine the precision of object image detection. Lowering the spheroid threshold diameter from 60 µm to 40 µm and implementing YOLOv2 training object detection of the spheroid volume analysis confirmed that core fucosylation facilitates prostasphere formation with high detection precision. Implementing YOLOv2 to automate the detection and volume estimation of spheroids proved to be an acceptable approach for ascertaining the role of fucosylation in prostasphere formation. The image object detection system had comparable detection and volume estimation to the manual measurements with high precision (100%), recall (95.9%), F1 (98.1%), moderately high IOU (69.1%), and a low average % error when estimating spheroid volumes.
It is recommended that for any future studies involving spheroids volume measurements using the cyclo-RGDfK(TPP) method, the minimum threshold diameter of ≥40µm should be determined for each cancer cell line as opposed to applying the same parameters for all spheroid-forming cell studies. Modifying the threshold diameter definition to ≥40µm would capture a more statistically representative sample of spheroids with less false positives when identifying spheroids manually. Also, the issue between a spheroid formation and cell aggregate may contribute to differences in measuring spheroid size by the microscopic analysis alone. Alternatively, the three-dimensional nature can be evaluated using nuclear arrangement and cortical actin staining of cells that constitute the spheroid structure.45
YOLOv2 training object detection of the spheroid volume is recommended for diverse datasets. For both manual and YOLOv2 training object detection of the spheroid volumes, the radius of the spheroid must be defined. It is noteworthy that a spheroid has several features, including the spheroid boundary, single-cell boundaries, invasive radius, and core radius.46 The radius being used should be specified (ie, invasive, core, boundaries, etc.) and applied consistently to improve the accuracy of spheroid volume estimations.
Acknowledgments
We would like to thank Alexandra Wojaczek for developing the YOLOv2 model used in this study.
Author Contributions
All authors contributed to data analysis, drafting or revising the article, gave final approval of the version to be published, and agree to be accountable for all aspects of the work. Conceptualization, R.K., F.Z. and M.R.S.; Methodology, R.K., F.Z. and M.R.S.; Software, R.K. and F.Z.; Validation, R.K., F.Z. and M.R.S.; Formal Analysis, R.K., H.Z., E.M, F.Z. and M.R.S.; Investigation, R.K., H.Z., F.Z. and M.R.S.; Resources, S.V.B., E.M., F.Z. and M.R.S.; Data Curation, R.K., H.Z., F.Z. and M.R.S.; Writing-Original Draft Preparation, R.K., and M.R.S.; Writing-Review & Editing, R.K., H.Z., F.Z., S.V.B., E.M. and M.R.S.; Visualization, R.K., H.Z., S.V.B., E.M. F.Z. and M.R.S.; Supervision, F.Z. and M.R.S.; Project Administration, F.Z. and M.R.S.; Funding Acquisition, S.V.B., E.M. F.Z. and M.R.S.
Funding
This work was supported in part by grants to M R Szewczuk from the Natural Sciences and Engineering Research Council of Canada (NSERC). The peptide synthesis work was supported in part by the Russian Foundation for Basic Research (grant N 18-04-01087) to S. Burov and E. Markvicheva). R. Kalaydina is the recipient of the Queen’s University Graduate Award (QGA).
Disclosure
The authors report no conflicts of interest in this work.
References
1. Zhao Y, Itoh S, Wang X, et al. Deletion of core fucosylation on α3β1 integrin down-regulates its functions. J Biol Chem. 2006;281(38):343–350.
2. Isaji T, Gu J, Nishiuchi R, et al. Introduction of bisecting GlcNAc into integrin alpha5beta1 reduces ligand binding and down-regulates cell adhesion and cell migration. J Biol Chem. 2004;279(19):19747–19754. doi:10.1074/jbc.M311627200
3. Hynes RO. Integrins: bidirectional, allosteric signaling machines. Cell. 2002;110(6):673–687. doi:10.1016/S0092-8674(02)00971-6
4. Varner JA, Cheresh DA. Integrins and cancer. Curr Opin Cell Biol. 1996;8(5):724–730. doi:10.1016/S0955-0674(96)80115-3
5. Zheng M, Fang H, Hakomori S. Functional role of N-glycosylation in alpha 5 beta 1 integrin receptor. De-N-glycosylation induces dissociation or altered association of alpha 5 and beta 1 subunits and concomitant loss of fibronectin binding activity. J Biol Chem. 1994;269(16):12325–12331.
6. Akasov R, Zaytseva-Zotova D, Burov S, et al. Formation of multicellular tumor spheroids induced by cyclic RGD-peptides and use for anticancer drug testing in vitro. Int J Pharm. 2016;506(1–2):148–157. doi:10.1016/j.ijpharm.2016.04.005
7. Akasov R, Gileva A, Zaytseva-Zotova D, et al. 3D in vitro co-culture models based on normal cells and tumor spheroids formed by cyclic RGD-peptide induced cell self-assembly. Biotechnol Lett. 2017;39(1):45–53. doi:10.1007/s10529-016-2218-9
8. Lin RZ, Chang HY. Recent advances in three-dimensional multicellular spheroid culture for biomedical research. Biotechnol J. 2008;3(9–10):1172–1184. doi:10.1002/biot.200700228
9. Kim YJ, Varki A. Perspectives on the significance of altered glycosylation of glycoproteins in cancer. Glycoconj J. 1997;14(5):569–576. doi:10.1023/A:1018580324971
10. Dube DH, Bertozzi CR. Glycans in cancer and inflammation—potential for therapeutics and diagnostics. Nat Rev Drug Discovery. 2005;4(6):477. doi:10.1038/nrd1751
11. Munkley J, Elliott DJ. Hallmarks of glycosylation in cancer. Oncotarget. 2016;7(23):35478. doi:10.18632/oncotarget.v7i23
12. Pinho SS, Reis CA. Glycosylation in cancer: mechanisms and clinical implications. Nat Rev Cancer. 2015;15(9):540. doi:10.1038/nrc3982
13. Duguay D, Foty RA, Steinberg MS. Cadherin-mediated cell adhesion and tissue segregation: qualitative and quantitative determinants. Dev Biol. 2003;253(2):309–323. doi:10.1016/S0012-1606(02)00016-7
14. Bull C, Stoel MA, den Brok MH, Adema GJ. Sialic acids sweeten a tumor’s life. Cancer Res. 2014;74(12):3199–3204. doi:10.1158/0008-5472.CAN-14-0728
15. Uemura T, Shiozaki K, Yamaguchi K, et al. Contribution of sialidase NEU1 to suppression of metastasis of human colon cancer cells through desialylation of integrin beta4. Oncogene. 2009;28(9):1218–1229.
16. Dennis JW, Granovsky M, Warren CE. Glycoprotein glycosylation and cancer progression. Biochim Biophys Acta. 1999;1473(1):21–34. doi:10.1016/S0304-4165(99)00167-1
17. Dennis JW, Laferte S. Tumor cell surface carbohydrate and the metastatic phenotype. Cancer Metastasis Rev. 1987;5(3):185–204. doi:10.1007/BF00046998
18. Hakomori S. Glycosylation defining cancer malignancy: new wine in an old bottle. Proc Natl Acad Sci U S A. 2002;99(16):10231–10233. doi:10.1073/pnas.172380699
19. Handa K, Hakomori SI. Carbohydrate to carbohydrate interaction in development process and cancer progression. Glycoconj J. 2012;29(8–9):627–637. doi:10.1007/s10719-012-9380-7
20. Van Slambrouck S, Groux-Degroote S, Krzewinski-Recchi MA, Cazet A, Delannoy P, Steelant WF. Carbohydrate-to-carbohydrate interactions between alpha2,3-linked sialic acids on alpha2 integrin subunits and asialo-GM1 underlie the bone metastatic behaviour of LNCAP-derivative C4-2B prostate cancer cells. Biosci Rep. 2014;34:5. doi:10.1042/BSR20140096
21. Park JJ, Lee M. Increasing the alpha 2, 6 sialylation of glycoproteins may contribute to metastatic spread and therapeutic resistance in colorectal cancer. Gut Liver. 2013;7(6):629–641. doi:10.5009/gnl.2013.7.6.629
22. Pochec E, Bubka M, Rydlewska M, Janik M, Pokrywka M, Litynska A. Aberrant glycosylation of alphavbeta3 integrin is associated with melanoma progression. Anticancer Res. 2015;35(4):2093–2103.
23. Akasov R, Haq S, Haxho F, et al. Sialylation transmogrifies human breast and pancreatic cancer cells into 3D multicellular tumor spheroids using cyclic RGD-peptide induced self-assembly. Oncotarget. 2016;7(40):66119–66134. doi:10.18632/oncotarget.v7i40
24. Haq S, Samuel V, Haxho F, et al. Sialylation facilitates self-assembly of 3D multicellular prostaspheres by using cyclo-RGDfK(TPP) peptide. Onco Targets Ther. 2017;10:2427–2447. doi:10.2147/OTT.S133563
25. Tai S, Sun Y, Squires JM, et al. PC3 is a cell line characteristic of prostatic small cell carcinoma. Prostate. 2011;71(15):1668–1679. doi:10.1002/pros.v71.15
26. Russell PJ, Kingsley EA. Human prostate cancer cell lines. Methods Mol Med. 2003;81:21–39. doi:10.1385/1-59259-372-0:21
27. Tan AS, Berridge MV. Superoxide produced by activated neutrophils efficiently reduces the tetrazolium salt, WST-1 to produce a soluble formazan: a simple colorimetric assay for measuring respiratory burst activation and for screening anti-inflammatory agents. J Immunol Methods. 2000;238(1–2):59–68. doi:10.1016/S0022-1759(00)00156-3
28. Tran NL, Nagle RB, Cress AE, Heimark RL. N-Cadherin expression in human prostate carcinoma cell lines: an epithelial-mesenchymal transformation mediating adhesion with stromal cells. Am J Pathol. 1999;155(3):787–798. doi:10.1016/S0002-9440(10)65177-2
29. Lin R-Z, Chou L-F, Chien -C-CM, Chang H-Y. Dynamic analysis of hepatoma spheroid formation: roles of E-cadherin and β1-integrin. Cell Tissue Res. 2006;324(3):411–422. doi:10.1007/s00441-005-0148-2
30. Terao N, Takamatsu S, Minehira T, et al. Fucosylation is a common glycosylation type in pancreatic cancer stem cell-like phenotypes. World J Gastroenterol. 2015;21(13):3876–3887. doi:10.3748/wjg.v21.i13.3876
31. Zhao Y, Sato Y, Isaji T, et al. Branched N-glycans regulate the biological functions of integrins and cadherins. FEBS J. 2008;275(9):1939–1948. doi:10.1111/j.1742-4658.2008.06346.x
32. Manuel Iglesias J, Beloqui I, Garcia-Garcia F, et al. Mammosphere formation in breast carcinoma cell lines depends upon expression of E-cadherin. PLoS ONE. 2013;8(10):e77281. doi:10.1371/journal.pone.0077281
33. Takei R, Suzuki D, Hoshiba T, et al. Role of E-cadherin molecules in spheroid formation of hepatocytes adhered on galactose-carrying polymer as an artificial asialoglycoprotein model. Biotechnol Lett. 2005;27(16):1149–1156. doi:10.1007/s10529-005-8652-8
34. Ghasemi A, Zahediasl S. Normality tests for statistical analysis: a guide for non-statisticians. Int J Endocrinol Metabol. 2012;10(2):486–489. doi:10.5812/ijem
35. Varki A, Cummings RD, Esko JD, et al. Essentials of Glycobiology.
36. Awan B, Turkov D, Schumacher C, et al. FGF2 induces migration of human bone marrow stromal cells by increasing core fucosylations on N-glycans of integrins. Stem Cell Rep. 2018;11(2):325–333. doi:10.1016/j.stemcr.2018.06.007
37. Janik ME, Litynska A, Vereecken P. Cell migration-the role of integrin glycosylation. Biochim Biophys Acta. 2010;1800(6):545–555. doi:10.1016/j.bbagen.2010.03.013
38. Khabaz MN, McClure J, McClure S, Stoddart RW. Glycophenotype of prostatic carcinomas. Folia Histochem Cytobiol. 2010;48(4):637–645. doi:10.2478/v10042-010-0089-9
39. Desiderio V, Papagerakis P, Tirino V, et al. Increased fucosylation has a pivotal role in invasive and metastatic properties of head and neck cancer stem cells. Oncotarget. 2015;6(1):71–84. doi:10.18632/oncotarget.v6i1
40. Okeley NM, Alley SC, Anderson ME, et al. Development of orally active inhibitors of protein and cellular fucosylation. Proc Natl Acad Sci U S A. 2013;110(14):5404–5409. doi:10.1073/pnas.1222263110
41. Balmana M, Mereiter S, Diniz F, Feijao T, Barrias CC, Reis CA. Multicellular human gastric-cancer spheroids mimic the glycosylation phenotype of gastric carcinomas. Molecules. 2018;23:11. doi:10.3390/molecules23112815
42. Achilli TM, Meyer J, Morgan JR. Advances in the formation, use and understanding of multi-cellular spheroids. Expert Opin Biol Ther. 2012;12(10):1347–1360. doi:10.1517/14712598.2012.707181
43. Achilli TM, McCalla S, Meyer J, Tripathi A, Morgan JR. Multilayer spheroids to quantify drug uptake and diffusion in 3D. Mol Pharm. 2014;11(7):2071–2081. doi:10.1021/mp500002y
44. Achilli TM, McCalla S, Tripathi A, Morgan JR. Quantification of the kinetics and extent of self-sorting in three dimensional spheroids. Tissue Eng Part C Methods. 2012;18(4):302–309. doi:10.1089/ten.tec.2011.0478
45. Raghavan S, Ward MR, Rowley KR, et al. Formation of stable small cell number three-dimensional ovarian cancer spheroids using hanging drop arrays for preclinical drug sensitivity assays. Gynecol Oncol. 2015;138(1):181–189. doi:10.1016/j.ygyno.2015.04.014
46. Hou Y, Konen J, Brat DJ, Marcus AI, Cooper LAD. TASI: a software tool for spatial-temporal quantification of tumor spheroid dynamics. Sci Rep. 2018;8(1):7248. doi:10.1038/s41598-018-25337-4
 © 2019 The Author(s). This work is published and licensed by Dove Medical Press Limited. The full terms of this license are available at https://www.dovepress.com/terms.php and incorporate the Creative Commons Attribution - Non Commercial (unported, v3.0) License.
By accessing the work you hereby accept the Terms. Non-commercial uses of the work are permitted without any further permission from Dove Medical Press Limited, provided the work is properly attributed. For permission for commercial use of this work, please see paragraphs 4.2 and 5 of our Terms.
© 2019 The Author(s). This work is published and licensed by Dove Medical Press Limited. The full terms of this license are available at https://www.dovepress.com/terms.php and incorporate the Creative Commons Attribution - Non Commercial (unported, v3.0) License.
By accessing the work you hereby accept the Terms. Non-commercial uses of the work are permitted without any further permission from Dove Medical Press Limited, provided the work is properly attributed. For permission for commercial use of this work, please see paragraphs 4.2 and 5 of our Terms.