")
Back to Journals » Diabetes, Metabolic Syndrome and Obesity » Volume 12
Impact of food pattern on glycemic control among type 2 diabetic patients: a cross-sectional study in the United Arab Emirates
Received 19 March 2019
Accepted for publication 20 May 2019
Published 16 July 2019 Volume 2019:12 Pages 1143—1150
DOI https://doi.org/10.2147/DMSO.S209320
Checked for plagiarism Yes
Review by Single anonymous peer review
Peer reviewer comments 2
Editor who approved publication: Professor Ming-Hui Zou
Amena Sadiya, Rama Mnla
Lifestyle Clinic, Rashid Centre for Diabetes and Research, Sheikh Khalifa Medical City Ajman, Ajman, United Arab Emirates
Background: Optimum nutrition has an integral role in glycemic control of diabetic patients. In this study, we intend to explore the frequency of food group/item consumption and its association with the risk of poor glycemic control (HbA1c >7%) among type 2 diabetes (T2D) patients in the United Arab Emirates (UAE), since there are no data available in this region.
Methods: In this retrospective cross-sectional study, data on frequency of food group/item consumption of 843 T2D patients aged ≥18 years were collected from records documented by dietitians in a tertiary care center in the UAE.
Results: The trends of food consumption demonstrate that one-third of the participants consumed all five major food groups, and 10% adhered to the recommended “MyPlate” meal pattern with the optimum mix of food groups. Univariate analysis indicated that participants who adhered to the MyPlate meal pattern presented lower HbA1c (β=−0.78, 95% CI −1.22, −0.25; P<0.01). Daily intake of fresh fruit was shown to be protective (β=−0.64, 95% CI −1.26, −0.04; P=0.04) while fruit juice intake >1 time/day increased the risk of poor glycemic control (β=1.53, 95% CI 0.72, 2.35; P<0.001). Multiple logistic regression models (area under the receiver operating characteristics curve =0.67) showed consumption of fizzy drinks and fast food ≥1 time/week increased the odds of poor glycemic control by 2.05 (95% CI 1.16, 3.68; P=0.01) and 1.83 (95% CI 1.02, 3.3 P=0.04), respectively, while fresh fruit consumption indicated a clinically relevant protective effect (OR=0.65, 95% CI 0.23, 1.79; P=0.4).
Conclusion: Consuming food such as fizzy drinks and fast food ≥1 time/week could possibly serve as an independent predictor for poor glycemic control, while fresh fruit could have a protective effect on glycemic control among T2D patients.
Clinical Trial Registry: ClinicalTrials.gov Identifier: NCT03388229
Keywords: diabetes, food pattern, United Arab Emirates, food consumption, glycemic control
Introduction
Almost one in five people in the United Arab Emirates (UAE) population between the ages of 20 and 79 years have type 2 diabetes (T2D), compared to one in 11 adults globally.1 Investment in effective interventions for the management of diabetes has become necessary to battle this global epidemic. Evidence has shown that individuals with diabetes maintaining HbA1c ≤7% significantly lower their risk of kidney damage, retinopathy, neuropathy, and cardiovascular problems.2 Poor glycemic control in patients with T2D is due to multiple factors and suboptimal dietary pattern is one of them. Medical nutrition therapy (MNT) improves metabolic outcomes such as HbA1c in people with diabetes.3 MNT delivered by a registered dietitian is associated with a 0.5–2% decrease in HbA1c for people with T2D.4,5 Previous research in this region also validated that lifestyle interventions significantly improved HbA1c in T2D Emirati patients.6,7
People's eating patterns and choices are largely influenced by cultural and social factors, and studies have also shown ethnic differences in glycemic response to a standard food, emphasizing the importance of considering ethnic differences when making dietary recommendations.8 The use of dietary patterns and diet quality through food groups to assess dietary intake has become increasingly common in nutritional epidemiology studies owing to the complexity and multidimensionality of the diet.9,10 The American Diabetes Association (ADA) recommends carbohydrate intake from whole grains, vegetables, fruits, legumes, and dairy products, with an emphasis on foods higher in fiber and lower in glycemic load. In addition, people with diabetes should avoid sugar-sweetened beverages and should minimize the consumption of sucrose-containing foods.11 The majority of patients with T2D are not achieving optimum glycemic control, with deleterious consequences, and this could be partially attributed to non-adherence to healthy lifestyle options.12 Furthermore, studies reporting the dietary pattern of T2D patients and its association with glycemic control are scarce in the UAE.13,14 Assessing food consumption patterns among the T2D Emirati population may be beneficial for the development of regional diabetes management intervention recommendations.
Hence, in this study, we aim to explore the frequency of food group/item consumption and its association with risk of poor glycemic control (HbA1c >7%) among T2D patients in the UAE.
Materials and methods
This retrospective cross-sectional study included patients visiting Rashid Centre for Diabetes and Research, located in Ajman, UAE, from January 2011 until January 2015. Prior to the initiation of the study, the protocol was approved by the Ministry of Health and Prevention, Research Ethics Committee, UAE (MOHAP/DXB/SUBC/No.29/2017), and the study was conducted in accordance with the ethical standards laid down in the 1964 Declaration of Helsinki and its later amendments. None of the patients was directly involved in the study and no written informed consent was given by participants for their clinical records to be used in this study. Patients' records and information were anonymized and deidentified prior to analysis. No financial or other incentives were offered.
Subjects
In total, 3,653 patients (all patients who visited during the study period) were screened and 843 were recruited based on the inclusion criteria, namely Emirati men and women, aged ≥18 years, diagnosed with T2D. Individuals were excluded from the study if they had undergone bariatric surgery, reported being pregnant, had been diagnosed with chronic kidney disease (estimated glomerular filtration rate <30 mL/min/1.73 m2), and/or had incomplete data.
Data collection
A detailed review of the electronic medical record (EMR) for each patient who consulted the dietitian for the first time was retrieved. All the patients completed their clinical assessments within 30 days from their first visit to the clinic. The dietary information was recorded by the dietitians after an interview-based consultation using a structured pretested frequency of food consumption questionnaire with face validity and content clarity. The questionnaire was a part of the nutrition care process used for nutritional assessment besides 24-hour dietary recall. The patients were asked if they had eaten a particular food item or items from a food group in the previous month on a daily/weekly/monthly basis, with the aid of household measurement tools. This questionnaire included 17 questions and listed the frequency of consumption of 13 food groups and not the number of servings; hence, it did not provide information on portions. The groups included cereal (rice, bread, pasta, potatoes), legumes (beans, lentils), meat and substitutes (red meat, poultry, fish, cheese), fruit (fresh fruit, dates), vegetables (raw, cooked), fruit juices (sweetened, fresh), milk and milk products (milk, yoghurt), nuts and seeds, fizzy drinks (carbonated beverages, sweetened and diet cola, energy drinks), fast food (burgers, pizzas, fried chicken), sweets and confectionery (chocolate, cakes, traditional sweets), and hot beverages (tea, coffee, traditional coffee/qahwah). The other questions recorded the dietary pattern, ie, the number of meals per day, the “MyPlate” meal pattern (ADA-recommended meal pattern, ie, dividing a plate into four sections of approximately 30% grains, 40% vegetables, 10% fruits, and 20% protein),15 whole grains, water, physical activity, and intake of artificial sweeteners (not all data were included in the study). Data on medication were not recorded, while body weight and height were recorded using an electronic balance with a stadiometer (SECA, Hamburg, Germany) to the nearest 0.1 kg and 0.1 cm, respectively. Fat mass and lean body mass were determined from the body composition through bioelectric impedance using an InBody-230 instrument (Biospace, Dogok-dong, South Korea) under standardized conditions. Body mass index (BMI), waist circumference, and blood pressure were recorded using standard clinical procedures. A blood sample (8 mL) was obtained after an overnight fast of ≥8 hours and HbA1c was determined using a Roche COBAS 6000 analyzer (Mannheim, Germany). Blood HbA1c was reported in the NGSP (%) unit, which is used in the UAE.
Statistical analysis
All statistical analyses was performed using Stata statistical software (version 14; Stata Corp., College Station, TX, USA). Continuous variables are presented as means ± SD and categorical variables as numbers and percentages. Statistical significance was set at P<0.05. The data set included all the variables with missing data of ≤5%. Both univariate linear regression and multivariate regression models were utilized to analyze the association between frequency of food consumption and glycemic control. Food groups that are sources of carbohydrates (ie, milk and milk products, fruit, fruit juice, fizzy drinks, sweets and confectionery, and fast food) were grouped into two categories, ie, <1 time/week and ≥1 time/week, for the univariate linear regression. Multiple logistic regression models were created to test the effect of food items high in simple carbohydrates on glycemic control (HbA1c >7% vs ≤7%). Model assumptions were checked and met, and interactions between age, gender, and duration of diabetes did not show any effect modification. The potential confounders were identified based on the literature, and when the effect of the predictor on the outcome was more than 10%, it was adjusted. The adjusted confounders included age, gender, duration of diabetes, and waist circumference. Multiple regression techniques were used for model building, with a hierarchical block design to determine the contribution of food groups/items to poor glycemic control. The covariates that were correlated (P<0.25) were entered into stepwise logistic regression (backward selection) to determine predictors.
Results
The demographic, anthropometric, and metabolic characteristics of the study participants are presented in Table 1. The female to male ratio was 3:2 and the mean age was 54.6±12.05 years, of which 61% ranged between 30 and 60 years and 31% were above 60 years. The BMI and waist circumference did not differ significantly between genders; however, the fat mass percent varied between genders (male =31.2±13.6%, female =37.0±12.9%).
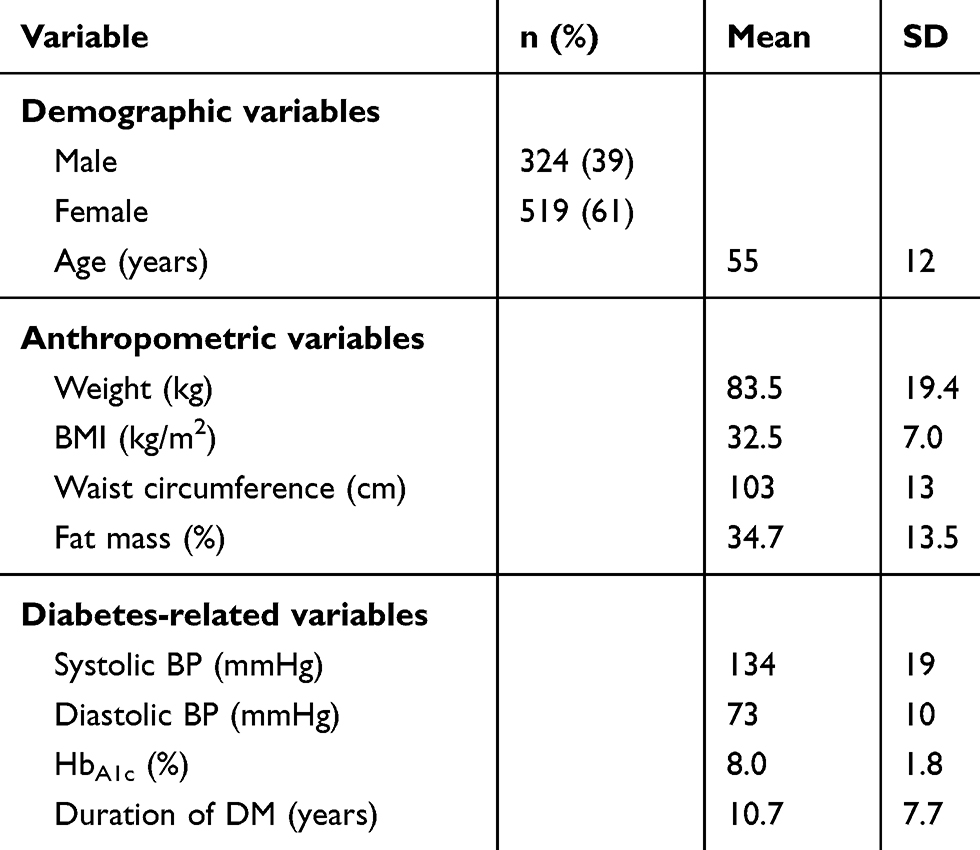 |
Table 1 Characteristics of the study population |
Figure 1 illustrates the food group/item consumption frequency by patients with T2D in the UAE. The highest frequency was ≥2 times/day and the lowest was none to ≤3 times/month. It was observed that all the participants consumed cereals more than twice daily, and only 18% of the study patients consumed wholegrain cereals. The daily protein intake was largely made up of meat and meat substitutes, which were consumed at least once daily by 94%, whereas plant sources of protein (beans and lentils) were consumed daily by 7.6% of the patients. Fruit and fruit juice consumption was ≥1 time/day in 54.8% and 18.8%, respectively. The frequency of intake of vegetables was ≤1 time/day in 80.6% of the participants. About 80% of the study participants consumed fizzy drinks and fast food ≤3 times/month. However, the consumption of traditional sweets and chocolates/confectionery was ≥1 time/week in 44.2% of participants (Figure 1). It was also observed that 32.9% of them chose to eat meals from restaurants/food outlets ≥3 times/week and 57% of these T2D patients exercised ≤3 times/month or never, whereas 32.6% exercised ≥3 times/week (not shown in Figure 1).
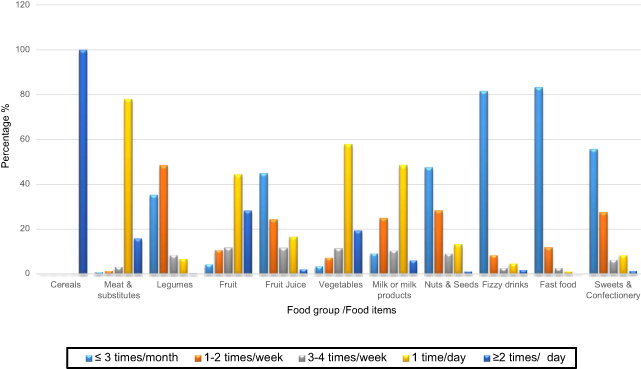 |
Figure 1 Food group/item consumption frequency in patients with type 2 diabetes mellitus in the United Arab Emirates (n=843). |
The univariate linear regression analysis in Table 2 shows the association between dietary factors and glycemic control (HbA1c); the β-coefficient represents the predicted change in HbA1c (%) with a change in category of variable compared to baseline category (≤3 times/month). The confidence intervals represent the mean value of the change in HbA1c for a given value of predictor category. Participants who adhered to the MyPlate meal pattern showed a reduction in HbA1c (β=−0.78, 95% CI −1.22, −0.25; P<0.01), while consumption of wholegrain cereals (wholegrain bread, traditional wholegrain bread) compared to refined cereals (white bread, buns, traditional bread with refined flour) showed a reduction in HbA1c (β=−0.32, 95% CI −0.68, 0.04; P=0.08). Consumption of fruit once daily was reported to reduce HbA1c (β=0.64; P=0.04), whereas consumption of fruit juices more than once daily increased HbA1c (β=1.53; P<0.001). Fizzy drink consumption once daily also showed a substantial increase in HbA1c (β=1.1; P<0.001). No significant associations were seen between HbA1c and other food groups (meat and beans, cereal, meat and meat substitutes, vegetables, milk and milk products, and nuts and seeds).
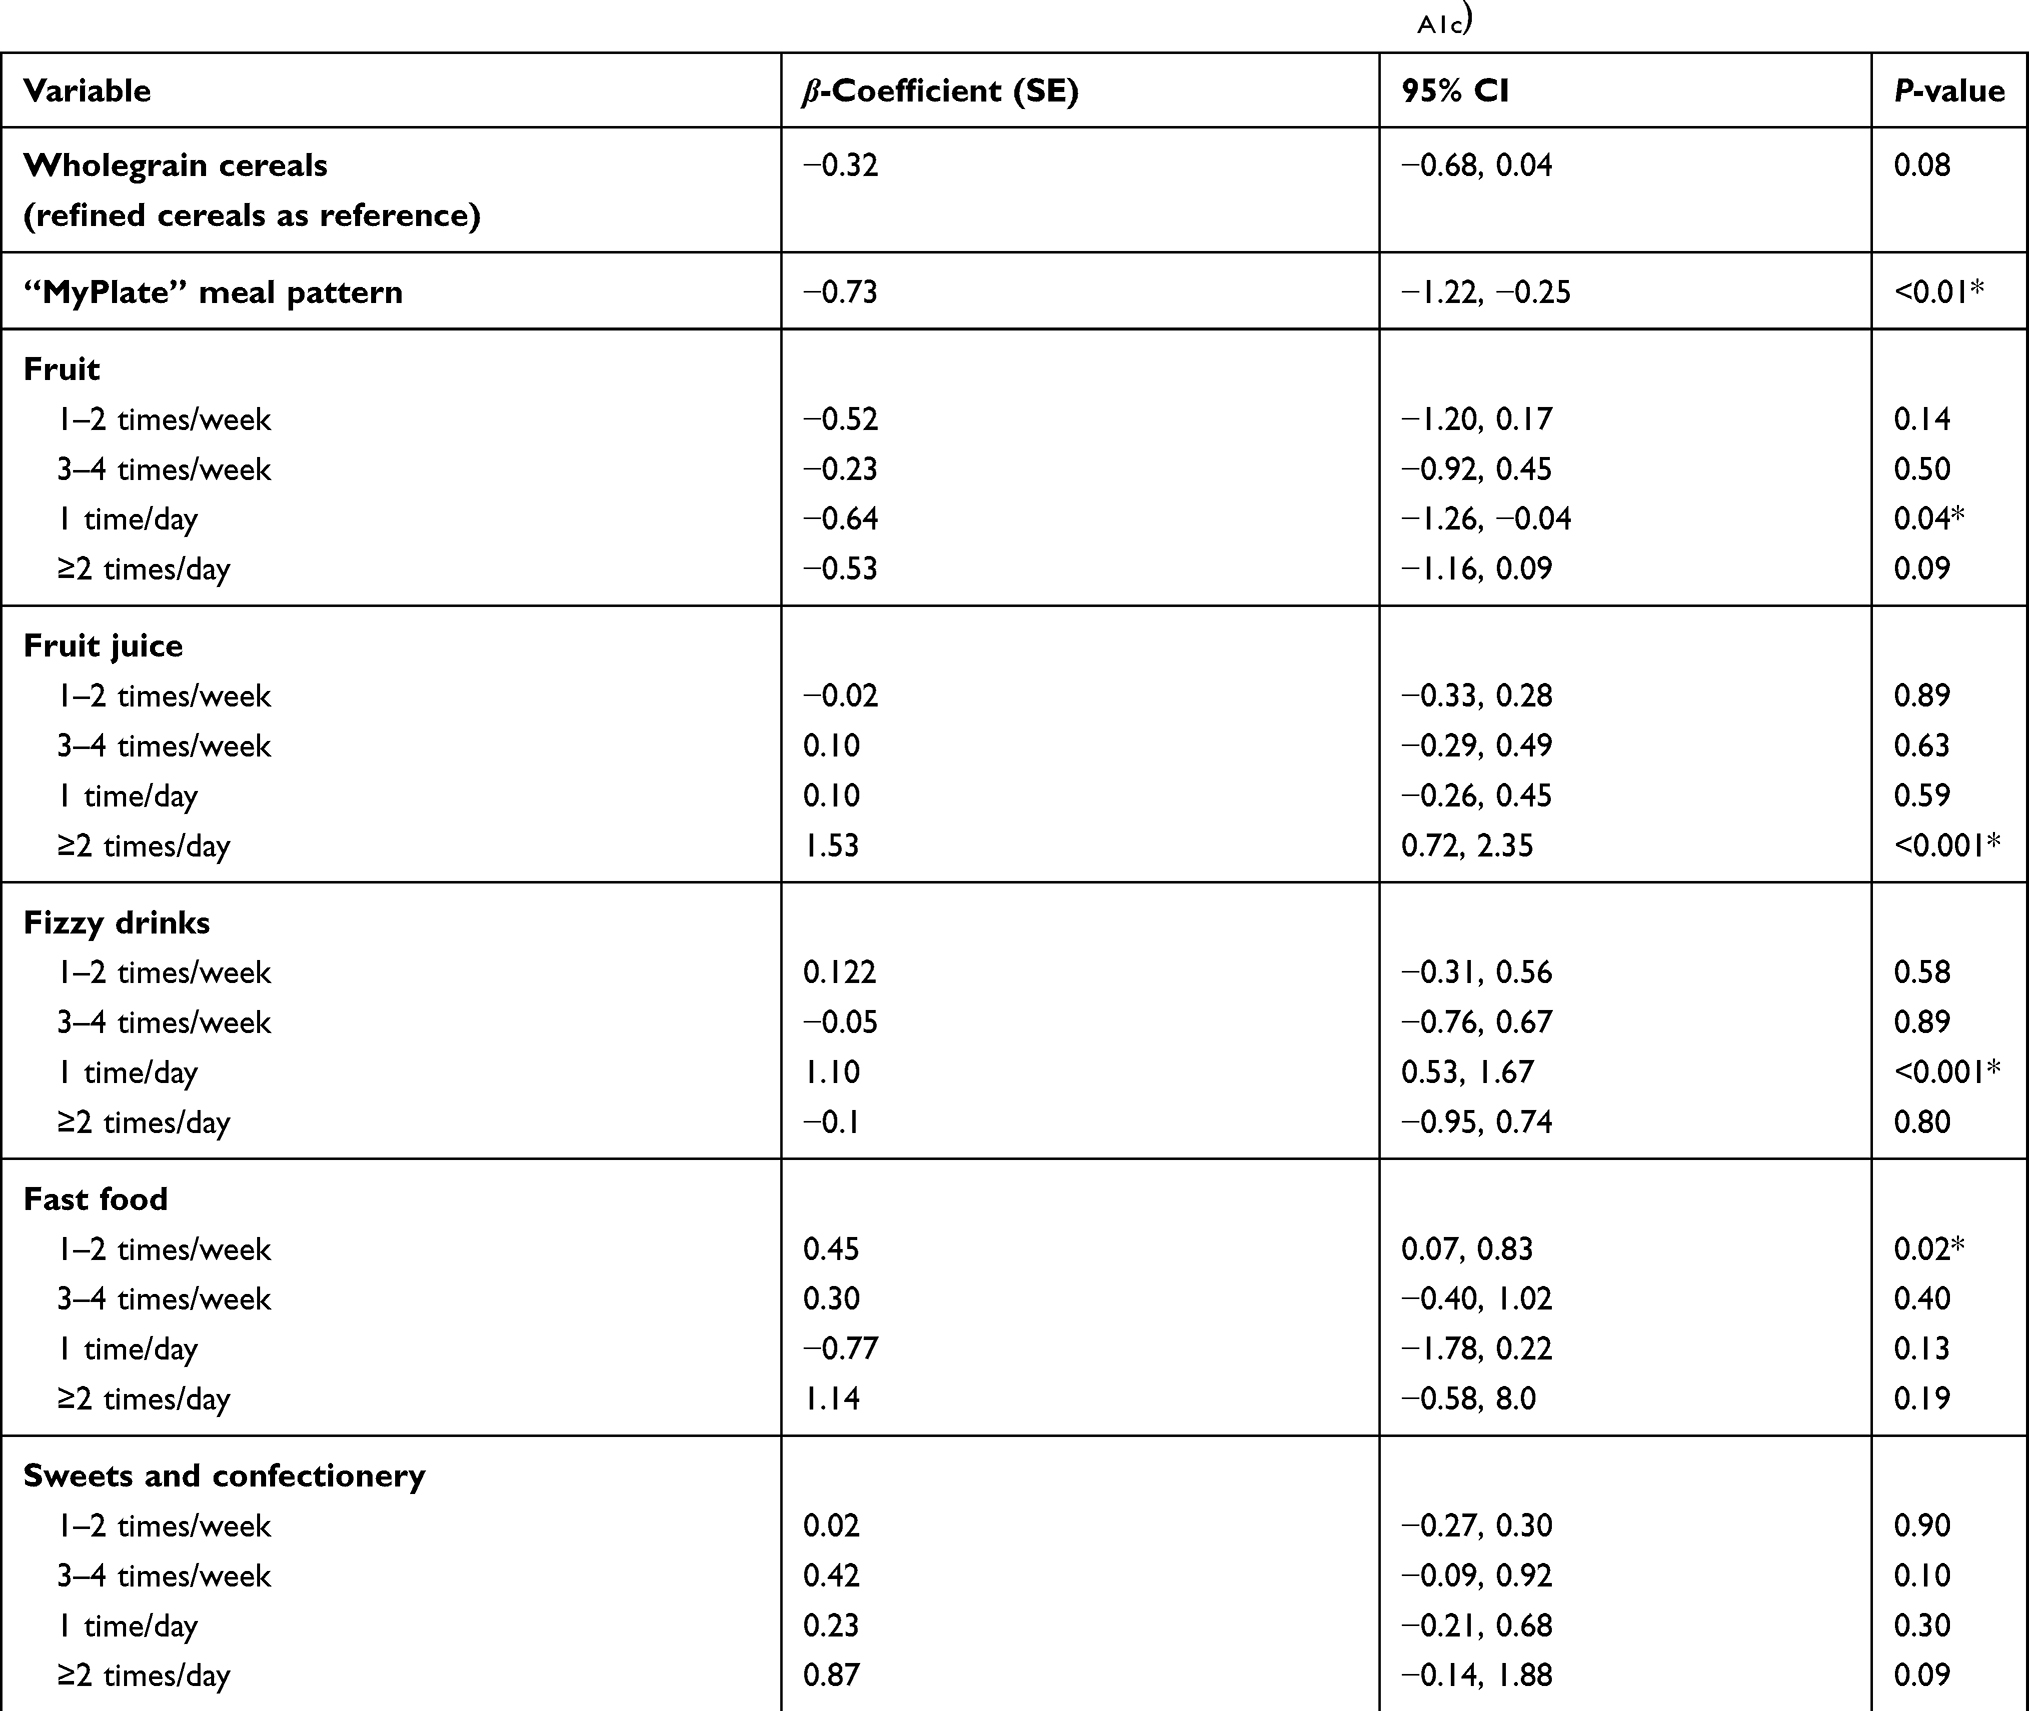 |
Table 2 Univariate analysis of the frequency of food groups/items and glycemic control (HbA1c) |
The hierarchical regression analyses of dietary factors associated with glycemic control are shown in Table 3. In the unadjusted model (model I), the odds of poor glycemia reduced by 57% (OR=0.43, 95% CI 0.18, 1.01) on consumption of fruit ≥1 time/week. On adjusting the potential confounders, model II was considered the best competing model (area under the receiver operating characteristics curve [AUC]=0.67, n=784), showing consumption of fruits to have a protective effect (OR=0.38. 95% CI 0.16, 0.90) and that fizzy drinks increased the risk of poor glycemic control (OR=1.94, 95% CI 1.23, 3.05). Further adjustment in model III (AUC=0.67, n=474) with waist circumference indicated that consumption of fizzy drinks once or more per week increased the odds of poor glycemic control (OR=2.05, 95% CI 1.16, 3.68; P=0.01); similarly, fast-food consumption also showed an increased odds of poor glycemic control (OR=1.83, 95% CI 1.02, 3.3; P=0.04). Although consumption of fruit ≥1 time/week is likely to be protective for glycemic control, by 35%, this was not statistically significant; however, it could be clinically relevant (Table 3).
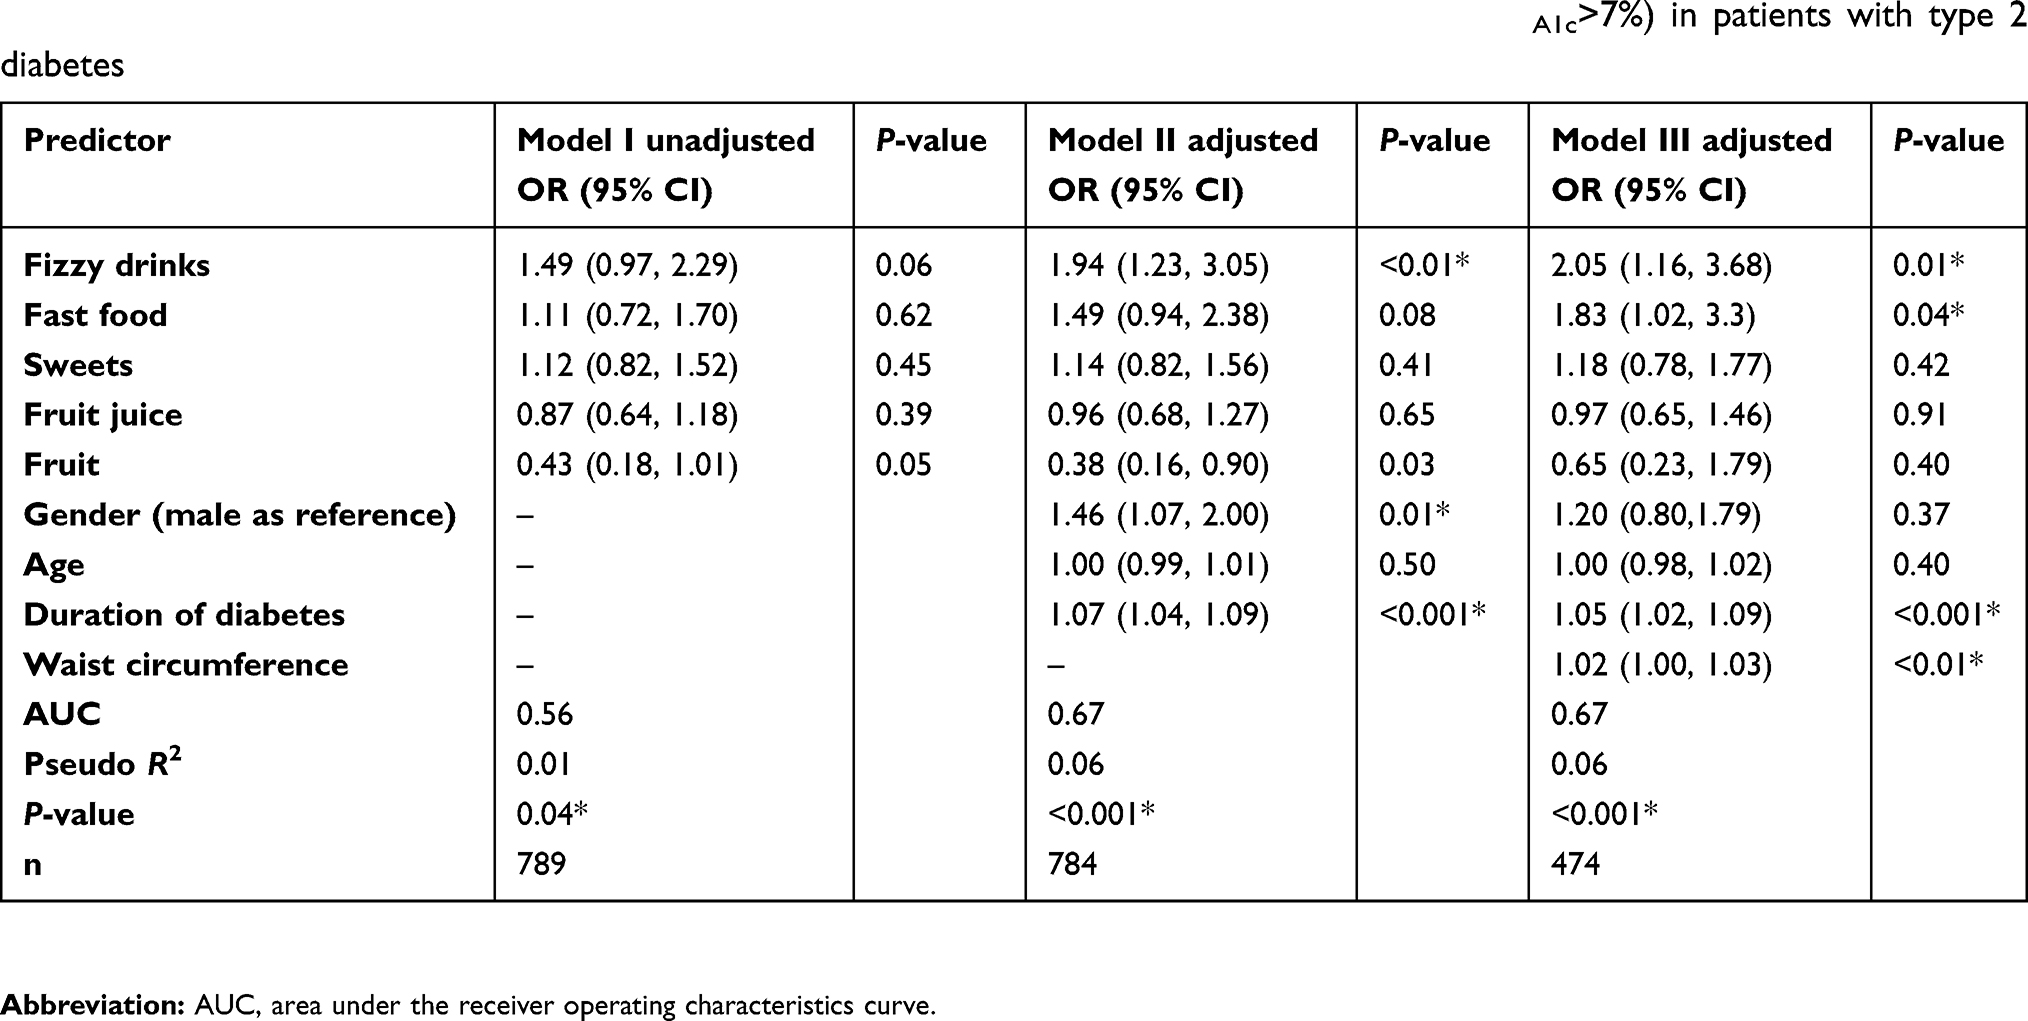 |
Table 3 Multivariate model analysis of dietary factors associated with poor glycemic control (HbA1c>7%) in patients with type 2 diabetes |
Discussion
The UAE has a very diverse population, of whom only 11.6% are UAE nationals (Emiratis) and the remainder is made up of expatriates.16 Nineteen percent of the UAE population is living with diabetes mellitus,1 and understanding the frequency of food group/item consumption and its association with glycemic control is crucial. This study describes the food consumption frequency and its association with the odds of poor glycemic control in 843 patients who are receiving their treatment at Rashid Center for Diabetes and Research in Ajman, UAE.
The demographic data in our study are representative of the national data with reference to age group, gender, anthropometric measures, and metabolic markers of T2D patients.14,17 The trends in food consumption demonstrate that only one-third (n=294) of the subjects consumed all the five major food groups (cereals, meat and meat substitutes, milk and milk products, fruits, and vegetables) daily, and only 10% adhered to the ADA-recommended MyPlate meal pattern with the optimum mix of food groups. Our findings are consistent with studies reported from T2D patients from Mediterranean countries.18 Our results on the intake of whole grains (18%), nuts (14.7%), and legumes (7.6%) are in consensus with consolidated data from 16 European countries (n=41,056), where the authors reported that a suboptimal diet was strongly associated with disease-specific mortality from coronary heart disease, stroke, and T2D (range 48–53%), with suboptimal intakes of whole grains (4–17%), nuts (7–15%), fruits and vegetables (6–22%), and processed meat (12–18%) representing the main contributors to mortality rates.19 Furthermore, we observed that 46% of the patients did not consume milk and milk products daily and 23% of them did not consume vegetables daily. Consumption of fizzy drinks (81.6%) and fast food (83.3%) ≤3 times/week could be attributed to the inverse relationship (r=−0.24, P<0.001) (r=−0.30, P<0.001) between the consumption of fizzy drinks/fast food and the age of participants, as supported in earlier studies.20
The univariate correlation between glycemic control and frequency of consumption of a food group/item showed that participants consuming meals in the recommended MyPlate model could have lower HbA1c (β=−0.73, 95% CI −1.22, −0.25; P<0.01), which is in agreement with dietary guidelines.21 Our study has shown a positive association between consumption of fruits once a day (β=−0.64, 95% CI −1.26, −0.04; P=0.04) and glycemic control; this correlation was quantified in the regression model. Model III showed a 35% (OR=0.65, 95% CI 0.23, 1.79; P=0.04) reduction in risk of poor glycemic control, in consensus with the ADA recommendations of increasing consumption of fruits and vegetables to 8–10 servings per day for diabetic patients. Our results also concur with a large epidemiological study in Chinese adults (n=500,000), wherein a higher frequency of fresh fruit consumption (>3 days/week) was associated with lowered risks of death and development of major vascular complications among diabetic individuals.22 The literature suggests that the mechanism of action could be attributed to dietary fiber,23 minerals (eg, potassium), and antioxidants (eg, vitamins and polyphenols),24 which may work synergistically to contribute toward several benefits on metabolism, including anti-oxidative, anti-inflammatory, anti-proliferative, anti-platelet, anti-hyperglycemic, anti-dyslipidemic, anti-hypertensive, and anti-atherogenic effects, and modulation of the composition and metabolic activity of gut microbiota.25 This could reduce the risk of vascular complications among those who have already developed diabetes.26 In our study, consumption of fruit juice did not show an effect on glycemic control unless the frequency was ≥2 times/week (β=1.53, 95% CI 0.72, 2.35; P<0.001). Our results are in consensus with a meta-analysis of 12 trials showing that fruit juice may have no overall effect on fasting glucose and insulin concentrations in diabetic populations.27
The multivariate model showed that after the adjustment for potential confounders, fizzy drinks could potentially increase the odds of hyperglycemia by 2.05 (205%) in T2D patients. Our results are in agreement with the strong evidence from the Nurses’ Health Study, which indicates that nurses who said they had one or more servings a day of a sugar-sweetened soft drink or fruit punch were twice as likely to have developed T2D.28 Such studies are not available among individuals with diabetes; however, there is little reason to suspect that the diabetic state would mitigate the adverse effects of sugar-sweetened beverages. Sugar-sweetened beverages have higher glycemic index and glycemic load because of the high amounts of corn syrup and total simple sugars, particularly glucose and fructose. Large quantities of such foods could be associated with higher blood glucose levels and insulin levels, and could elevate free fatty acid levels.29
In addition, a meta-analyses of 11 cohorts reported that after adjustment for age, gender, energy intake, BMI, and other dietary covariates, each additional serving of sugar-sweetened beverage was associated with higher fasting glucose (β ± SE 0.014±0.004 [mmol/L]; P=1.5×10⁻³) and higher fasting insulin (0.030±0.005 [log e pmol/L]; P=2.0×10⁻¹⁰).30 Furthermore, literature on the consumption of fizzy drinks reports that they increase the risk of diabetic complications, ie, chronic kidney disease and proliferative diabetic retinopathy.31,32
Model III in our study also showed an increased odds (OR=1.83, 95% CI 1.02, 3.3; P=0.04) of poor glycemia on consumption of fast food once or more daily. Similar findings have been observed in several studies across three UK-based diabetes screening studies, suggesting that increased exposure to fast-food outlets was associated with increased risk of T2D (OR=1.02, 95% CI 1.00, 1.04), indicating a strong influence of fast food in the pathology of T2D.33 Endothelial function is reported to be impaired after ingestion of fast food, which is related to increases in circulating glucose and triglycerides, and/or elevated oxidative stress.34,35 In addition, fast food induces greater and sustained overall cardiac workload in individuals with T2D compared with BMI- and age-matched controls.36
The limitations of our study refer to the method of dietary data collection, which was based on self-reported food frequency data collected from EMRs. The lack of validated nutritional tools across countries in the Middle East could possibly be the reason for the scant body of nutritional information in this region. In addition, although we adjusted for several variables that we considered as key potential confounders, other factors may also interact with the frequency of food consumption (eg, employment, social support from the family). Thus, this study could not establish causality since it is an observational study. It includes only patients referred to the lifestyle clinic and generalization to T2D patients in this region should be considered with caution. Although the study sample included patients from Ajman region, the internal validity is enhanced by including only Emirati patients, as they share similar cultural and dietary habits across the UAE.
While this study has these limitations, it does give a clear snapshot of the dietary preferences of the T2D Emirati population and may help both in providing information for clinical practice recommendations in this region and in giving direction for designing future prospective studies to assess these improvements.
Conclusion
Our findings show that consuming fizzy drinks and fast food at least once or more weekly could possibly serve as an independent predictor for poorly controlled glycemia (HbA1c ≥7%) among T2D Emirati individuals. In addition, the intake of fresh fruits once or more weekly could decrease the odds of poor glycemic control. The results of this study, therefore, support the recommendations of the ADA for MNT in diabetic patients, and it would be of value to adapt the regional recommendations in light of the information provided in this study. However, our study design was cross-sectional and data were self-reported; hence, no inferences should be drawn regarding causality effects. Randomized controlled trials are suggested to prove the causality in this area.
Data availability
The data used to support the findings of this study are restricted by the Ministry of Health and Prevention Research Ethics Committee–UAE, in order to protect patient privacy. Data are available from Amena Sadiya, [email protected]/[email protected] for researchers who meet the criteria for access to confidential data.
Acknowledgments
The authors would like to acknowledge the contributions of Joseph George for IT support; Shibby Verghese, Sijo Skaria, Shaima Alhosani, and Farha Taqdis for data collection; and Yohannes Tesfa, Omar Adas, and Vidya Jakapure for reviewing the paper. The authors would also like to express their appreciation to Sheikh Khalifa Medical City Ajman for providing them with financial support.
Author contributions
AS, as the principal investigator, was responsible for the study concept and design, and played a central role in the analysis and interpretation of the data. Both authors contributed to data acqusition and took part in drafting the article or revising it critically for important intellectual content; gave final approval of the version to be published; and agree to be accountable for all aspects of the work.
Disclosure
The authors report no conflicts of interest in this work.
References
1. International Diabetes Federation. IDF Diabetes Atlas.
2. Nathan DM; DCCT/EDIC Research Group. The diabetes control and complications trial/epidemiology of diabetes interventions and complications study at 30 years: overview. Diabetes Care. 2014;37(1):9–16. doi:10.2337/dc13-2112
3. Papamichou D, Panagiotakos DB, Itsiopoulos C. Dietary patterns and management of type 2 diabetes: a systematic review of randomised clinical trials. Nutr Metab Cardiovasc. 2019. doi:10.1016/j.numecd.2019.02.004
4. UK Prospective Diabetes Study (UKPDS) Group. Effect of intensive blood-glucose control with metformin on complications in overweight patients with type 2 diabetes (UKPDS 34). Lancet. 1998;352:854–865. doi:10.1016/S0140-6736(98)07037-8
5. Coppell KJ, Kataoka M, Williams SM, et al. Nutritional intervention in patients with type 2 diabetes who are hyperglycaemic despite optimised drug treatment–Lifestyle Over and Above Drugs in Diabetes (LOADD) study: randomised controlled trial. Bmj. 2010;341:c3337. doi:10.1136/bmj.c3337
6. Abdi S, Sadiya A, Ali S, Varghese S, Abusnana S. Behavioural Lifestyle Intervention Study (BLIS) in patients with type 2 diabetes in the United Arab Emirates: a randomized controlled trial. BMC Nutr. 2015;1:37. doi:10.1186/s40795-015-0028-4
7. Sadiya A, Abdi S, Abusnana S. Lifestyle intervention for weight loss: a group-based program for Emiratis in Ajman, United Arab Emirates. Diabetes Metab Syndr Obes. 2016;18(9):101–108. doi:10.2147/DMSO.S103620
8. Jones-McLean EM, Shatenstein B, Whiting SJ. Dietary patterns research and its applications to nutrition policy for the prevention of chronic disease among diverse North American populations. Appl Physiol Nutr Metab. 2010;35:195–198. doi:10.1139/H10-003
9. Antonio JP, Sarmento RA, de Almeida JC. Diet quality and glycemic control in patients with type 2 diabetes. J Acad Nutr Diet. 2019;119(4):652–658. doi:10.1016/j.jand.2018.11.006
10. Dis Rahati S, Shahraki M, Arjomand G, Shahraki T. Food pattern, lifestyle and diabetes mellitus. Int J High Risk Behav Addict. 2014;3(1):
11. Evert AB, Dennison M, Gardner CD, et al. Nutrition therapy for adults with diabetes or prediabetes: a consensus report. Diabetes Care. 2019;42(5):731–754. doi:10.2337/dci19-0014
12. Juarez DT, Ma C, Kumasaka A, Shimada R, Davis J. Failure to reach target glycated a1c levels among patients with diabetes who are adherent to their antidiabetic medication. Popul Health Manag. 2014;17(4):218–223. doi:10.1089/pop.2013.0099
13. Baynouna LM, Neglekerke NJ, Ali HE, et al. Audit of healthy lifestyle behaviors among patients with diabetes and hypertension attending ambulatory health care services in the United Arab Emirates. Glob Health Promot. 2017;21(4):44–51. doi:10.1177/1757975914528248
14. Al-Kaabi J, Fatma Al-Maskari F, Saadi H, et al. Assessment of dietary practice among diabetic patients in the United Arab Emirates. Rev Diabet Stud Summer. 2008;5(2):110–115.
15. Evert AB, Boucher JL, Cypress M, et al. Nutrition therapy recommendations for the management of adults with diabetes. Diabetes Care. 2014;37(Suppl 1):S120–43. doi:10.2337/dc14-S120
16. United Arab Emirates Population. April 2, 2019.
17. Razzak HA, Harbi A, Shelpai W, Qawas A. Epidemiology of diabetes mellitus in the United Arab Emirates. Curr Diabetes Rev. 2018;14(6):542–549. doi:10.2174/1573399813666170920152913.
18. Thanopoulou A, Karamanos B, Angelico F, et al. Nutritional habits of subjects with type 2 diabetes mellitus in the Mediterranean Basin: comparison with the non-diabetic population and the dietary recommendations. Multi-Centre Study of the Mediterranean Group for the Study of Diabetes (MGSD). Diabetologia. 2004;47:367. doi:10.1007/s00125-003-1316-0
19. Schwingshackl L, Knüppel S, Michels N, et al. Intake of 12 food groups and disability-adjusted life years from coronary heart disease, stroke, type 2 diabetes, and colorectal cancer in 16 European countries. Eur J Epidemiol. 2019. doi:10.1007/s10654-019-00523-4
20. Dave JM, An LC, Jeffery RW, Ahluwalia JS. Relationship of attitudes toward fast food and frequency of fast-food intake in adults. Obesity (Silver Spring). 2009;17(6):1164–1170. doi:10.1038/oby.2009.26
21. Maryniuk MD. From pyramids to plates to patterns: perspectives on meal planning. Diabetes Spectr. 2017;30:67–70. doi:10.2337/ds16-0080
22. Du H, Li L, Bennett D, et al. Fresh fruit consumption in relation to incident diabetes and diabetic vascular complications: a 7-y prospective study of 0.5 million Chinese adults. PLoS Med. 2017;14:4. doi:10.1371/journal.pmed.1002230
23. Silva FM, Kramer CK, de Almeida JC, Steemburgo T, Gross JL, Azevedo MJ. Fiber intake and glycemic control in patients with type 2 diabetes mellitus: a systematic review with meta-analysis of randomized controlled trials. Nutr Rev. 2013;71:790–801. doi:10.1111/nure.2013.71.issue-12
24. Kim Y, Keogh JB, Clifton PM. Polyphenols and glycemic control. Nutrients. 2016;8:E17. doi:10.3390/nu8010017
25. Xu YJ, Tappia PS, Neki NS, et al. Prevention of diabetes-induced cardiovascular complications upon treatment with antioxidants. Heart Fail Rev. 2014;19:113–121. doi:10.1007/s10741-013-9379-6
26. Chan HT, Yiu KH, Wong CY, et al. Increased dietary fruit intake was associated with lower burden of carotid atherosclerosis in Chinese patients with type 2 diabetes mellitus. Diabet Med. 2013;30:100–108. doi:10.1111/dme.12142
27. Wang B, Liu K, Mi M, Wang J. Effect of fruit juice on glucose control and insulin sensitivity in adults: a meta-analysis of 12 randomized controlled trial. PLoS One. 2014;9(4):e95323. doi:10.1371/journal.pone.0095323.
28. Schulze MB, Manson JE, Ludwig DS, et al. Sugar-sweetened beverages, weight gain, and incidence of type 2 diabetes in young and middle-aged women. Jama. 2004;292:927–934. doi:10.1001/jama.292.8.927
29. Giugliano D, Ceriello A, Esposito K. The effects of diet on inflammation: emphasis on the metabolic syndrome. J Am Coll Cardiol. 2006;48(4):677–685. doi:10.1016/j.jacc.2006.03.052
30. McKeown NM, Dashti HS, Ma J, et al. Sugar-sweetened beverage intake associations with fasting glucose and insulin concentrations are not modified by selected genetic variants in a ChREBP-FGF21 pathway: a meta-analysis. Diabetologia. 2018;61(2):317–330. doi:10.1007/s00125-017-4475-0
31. Yuzbashian E, Asghari G, Mirmiran P, Zadeh-Vakili A, Azizi F. Sugar-sweetened beverage consumption and risk of incident chronic kidney disease: tehran lipid and glucose study. Nephrology (Carlton). 2016;21(7):608–616. doi:10.1111/nep.12646
32. Fenwick EK, Gan AT, Man RE, et al. Diet soft drink is associated with increased odds of proliferative diabetic retinopathy. Clin Exp Ophthalmol. 2018. doi:10.1111/ceo.13154
33. Bodicoat DH, Carter P, Comber A, et al. Is the number of fast-food outlets in the neighbourhood related to screen-detected type 2 diabetes mellitus and associated risk factors? Public Health Nutr. 2015;18(9):1698–1705. doi:10.1017/S1368980014002316
34. Ceriello A, Quagliaro L, Piconi L, et al. Effect of postprandial hypertriglyceridemia and hyperglycemia on circulating adhesion molecules and oxidative stress generation and the possible role of simvastatin treatment. Diabetes. 2004;53:701–710. doi:10.2337/diabetes.53.6.1467
35. Tyldum GA, Schjerve IE, Tjonna AE, et al. Endothelial dysfunction induced by post-prandial lipemia: complete protection afforded by high-intensity aerobic interval exercise. J Am Coll Cardiol. 2009;53:200–206. doi:10.1016/j.jacc.2008.09.033
36. Hollekim-Strand SM, Malmo V, Follestad T, Wisløff U, Ingul CB. Fast food increases postprandial cardiac workload in type 2 diabetes independent of pre-exercise: a pilot study. Nutr J. 2015;14:p1–11. doi:10.1186/s12937-015-0069-1
 © 2019 The Author(s). This work is published and licensed by Dove Medical Press Limited. The full terms of this license are available at https://www.dovepress.com/terms.php and incorporate the Creative Commons Attribution - Non Commercial (unported, v3.0) License.
By accessing the work you hereby accept the Terms. Non-commercial uses of the work are permitted without any further permission from Dove Medical Press Limited, provided the work is properly attributed. For permission for commercial use of this work, please see paragraphs 4.2 and 5 of our Terms.
© 2019 The Author(s). This work is published and licensed by Dove Medical Press Limited. The full terms of this license are available at https://www.dovepress.com/terms.php and incorporate the Creative Commons Attribution - Non Commercial (unported, v3.0) License.
By accessing the work you hereby accept the Terms. Non-commercial uses of the work are permitted without any further permission from Dove Medical Press Limited, provided the work is properly attributed. For permission for commercial use of this work, please see paragraphs 4.2 and 5 of our Terms.