")
Back to Journals » Clinical Epidemiology » Volume 12
Impact of Being Eligible for Type 2 Diabetes Treatment on All-Cause Mortality and Cardiovascular Events: Regression Discontinuity Design Study
Authors Petersen I , Nicolaisen SK, Ricciardi F , Sharma M , Thomsen RW , Baio G , Pedersen L
Received 28 February 2020
Accepted for publication 30 April 2020
Published 3 June 2020 Volume 2020:12 Pages 569—577
DOI https://doi.org/10.2147/CLEP.S251704
Checked for plagiarism Yes
Review by Single anonymous peer review
Peer reviewer comments 2
Editor who approved publication: Professor Henrik Sørensen
Irene Petersen,1,2 Sia Kromann Nicolaisen,2 Federico Ricciardi,3 Manuj Sharma,1 Reimar W Thomsen,2 Gianluca Baio,3 Lars Pedersen2
1Department of Primary Care and Population Health, University College London, London, UK; 2Department of Clinical Epidemiology, Aarhus University, Aarhus, Denmark; 3Department of Statistical Science, University College London, London, UK
Correspondence: Irene Petersen
Department of Primary Care and Population Health, University College London, London NW3 2PF, UK
Tel +44 20 801 68032
Email [email protected]
Background: Individuals with type 2 diabetes (T2D) have a twofold increased risk for cardiovascular events (CVE), and CVE is responsible for nearly 80% of the mortality. Current treatment guidelines state that individuals should immediately initiate antidiabetic treatment and cardiovascular risk-factor management from T2D diagnosis. However, the evidence base is sparse, and randomized trials are unlikely to be conducted. We examined the impact of being eligible for T2D treatment, as determined by the threshold of HbA1c ≥ 6.5% (≥ 48 mmol/mol), on all-cause mortality and CVE. We hypothesised that individuals who were just above this threshold had a lower risk of CVE and all-cause mortality than individuals just below.
Methods and Findings: We used the regression discontinuity design (RDD), a quasi-experimental design, comparing rates of all-cause mortality and CVE in people just below and just above the eligibility for treatment threshold. We included Danish healthcare records from 43,070 individuals aged 40– 80 years with no previous T2D record and the first record of HbA1c in the range of 6.0– 7.0% (42– 53 mmol/mol) between 2006 and 2014. In total, 36,360 individuals had the first record of HbA1c between 6.0% and 6.4% (42– 47 mmol/mol), and 6710 individuals had a first record between 6.5% and 7.0% (48– 53 mmol/mol). Individuals with a measurement just above 6.5% (48 mmol/mol) had a 21% lower rate of death or CVE, compared to those just below (hazard ratio: 0.79 (95% CI 0.69– 0.90)). Few individuals received early metformin treatment. However, the chance of metformin treatment initiation within 3 months was substantially higher for individuals with an HbA1c measurement above (14%) than below (1%) the threshold.
Conclusion: Individuals with first record of HbA1c measure just above treatment threshold experienced a 21% lower rate of death or CVE than those just below. Lifestyle modifications and cardiovascular risk-factor management may contribute to this reduced rate.
Keywords: type 2 diabetes, glycated hemoglobin A1c, regression discontinuity design, cardiovascular event, mortality
Introduction
Individuals with type 2 diabetes have a twofold increased risk for cardiovascular events (CVE), and CVE is responsible for nearly 80% of the mortality in type 2 diabetes patients.1,2 Current international treatment guidelines state that patients with type 2 diabetes should immediately initiate lifestyle modifications and be treated with metformin therapy (if tolerated) and cardiovascular risk-factor management from the time of first type 2 diabetes diagnosis, which since 2012 has been based on either plasma glucose or hemoglobin A1c (HbA1c) criteria.3,4 The rationale of early glucose-lowering intervention is to hinder later micro- and macrovascular complications and mortality associated with hyperglycemia.5 However, randomized trial evidence for the effectiveness of the early aggressive intervention in newly diagnosed type 2 diabetes patients on CVE and death is sparse.2,6 The evidence for early metformin treatment mainly stems from a small subgroup of overweight patients in the UK Prediction Diabetes Study, in which metformin-treated patients had a 30% reduction of macrovascular complications and 36% reduced all-cause mortality.7 Likewise, the evidence for multifactorial risk-factor management mainly stems from patients with long-standing type 2 diabetes.8 Additional randomized controlled trials (RCTs) providing better evidence for initial type 2 diabetes treatment are unlikely to be done. To gain further insight into the effectiveness of early treatment in newly diagnosed type 2 diabetes patients, we rely on evidence based on data from clinical practice.6 However, in clinical practice, it is often a challenge to identify patient groups that are directly comparable as in an RCT. We, therefore, used a novel method in observational medical research, the regression discontinuity design (RDD) which is a quasi-experimental design comparing rates of an event in people just below and people just above a specific treatment threshold.9–11 The idea of the RDD, in the context of this study, is that individuals who are just below or just above the threshold for being eligible for type 2 diabetes treatment, ie, HbA1c ≥6.5% (≥48 mmol/mol), are in reality very similar. Therefore, we used the RDD to estimate the effect of type 2 diabetes treatment eligibility on all-cause mortality and CVE.
Methods
Data Sources
We used population-based registry data from the Central Denmark Region and the North Denmark Region. The population is around 1.8 million, which corresponds to approximately 30% of the total Danish population. The registries include data from the clinical laboratory information system (LABKA), the Danish National Patient Registry, the Aarhus University Prescription Database (AUPD) and the Danish Civil Registration System. All data sources can be linked via a personal identifier, the CPR number.
LABKA includes biochemistry data from every blood sample analyzed in clinical chemistry department laboratories in the two regions. Data have been kept in the computerized laboratory databases since 1997. The databases cover data from hospitals as well as general practitioners and include results from HbA1c measurements.12 Every measurement is recorded according to the Nomenclature for Properties and Units (NPU) clinical laboratory terminology and includes information on the date of analysis, the NPU code, the component, the result and unit of analysis.
The Danish National Patient Registry includes information on outcomes and comorbidities.13 This registry contains data on dates of admission and discharge from all Danish non-psychiatric hospitals since 1977 and from emergency room and outpatient clinic visits since 1995. Each hospital discharge or outpatient visit is recorded in the registry with one primary diagnosis and potentially several secondary diagnoses classified according to the International Classification of Diseases (ICD-10).
Since 1998, the AUPD has recorded data on reimbursed prescriptions dispensed at all community pharmacies of the Central Denmark Region and the North Denmark Region.14 Pharmacies are equipped with electronic accounting systems primarily used to secure reimbursement from the National Health Service. The registry includes prescriber identifier, the product number, number of tablets and packages dispensed, ATC code, volume, package name, active substance, dosage, and date of dispensing.
The Danish Civil Registration System has recorded all changes in vital status and migration for the entire Danish population since 1968, with daily electronic updates.15
The Regression Discontinuity Design
The RDD has been widely used since the 1960s in econometrics, social sciences and politics,16–18 but it has rarely been applied in medical and epidemiological research.9–11 The design relies on the assumption that the threshold acts as a randomizing device for individuals close to the threshold, ie, those just below and those just above the threshold are similar. In our study, we used the RDD to examine the effect of being eligible for type 2 diabetes treatment as determined by the threshold rule HbA1c ≥6.5% (≥48 mmol/mol) on all-cause mortality and CVE. According to official clinical guidelines, an individual is assigned to a treatment group (treatment vs no treatment) based on an HbA1c measurement under the influence of measurement errors and various other factors that can potentially result in small changes from the actual to the measured value. Given these circumstances, one can ask if an individual whose HbA1c was measured to be 47 mmol/mol is much different from an individual whose value was measured to be 48 mmol/mol? Treatment guidelines, however, will treat these two individuals very differently, which is what the RDD utilizes as the pseudo-random treatment allocation. As the threshold only acts as a randomizing device for individuals close to the threshold, the RDD estimates the local effect of being eligible for treatment. It is a balancing act to only include patients close to the threshold, but also to include enough patients to ensure statistical power and to include data points for the regression model.
If the threshold is strictly adhered to when assigning treatment (treatment probability is either 0 (below) or 1 (above the threshold)), the RDD is termed sharp and we can easily estimate a causal effect of treatment. In most situations, however, this is not the case, ie, there are individuals above the threshold who are untreated and vice versa and the design is termed fuzzy.9,11 In a fuzzy design, a simple RDD analysis is equivalent to an intention-to-treat analysis.9,11
For the RDD to provide valid estimates, the decision rule for treatment and cut-off value should be known.11 In the context of this study, from 2012 and onwards, patients have been eligible for type 2 diabetes treatment, be it initiation of lifestyle modification and metformin treatment, if they had an HbA1c of ≥6.5% (≥48 mmol/mol). Before 2012, a type 2 diabetes diagnosis was based on plasma glucose criteria rather than on any measured HbA1c values per se. However, at least, since 2006, American Diabetes Association/European Association for the Study of Diabetes consensus recommendations have stipulated initiation of both metformin and lifestyle intervention immediately after type 2 diabetes diagnosis, and to aim for an HbA1c level of <6.5% (<48 mmol/mol) in most people with newly diagnosed type 2 diabetes.19
Study Population
For this study, we included individuals aged 40–80 years with a first record of HbA1c measurement in the range of 5.8–7.3% (40–56 mmol/mol) in the period during 2006–2014 and who had lived in the region for at least 1 year prior to the time of the measurement. As we detail below, our primary analyses were focused on those with HbA1c measurements values within 6.0–7.0% (42–53 mmol/mol).
Follow-up started at the time of the initial HbA1c measurement and everyone was followed until the first occurrence of CVE, death, or end of the study period (December 2014). We included information on date of birth, gender, information on hospitalization and hospital diagnoses prior to the first record of HbA1c measurement, and dispensed prescriptions, including antibiotics, antihypertensives, statins and antidepressants, within 1 year prior to the first record of HbA1c measurement. We excluded individuals who were lost to follow-up during the study period. Patients with a previous hospital diagnosis of type 1 diabetes or type 2 diabetes and individuals who were treated with metformin or other glucose-lowering drugs prior to the initial HbA1c measurement were also excluded. In addition, we excluded individuals who experienced CVE before the initial HbA1c measurement.
Outcomes
Our primary outcome was a composite of all-cause mortality and CVE (myocardial infarction or stroke). All-cause mortality and CVE were also evaluated separately. Myocardial infarction and stroke were defined as inpatient or outpatient first-time diagnoses in the Danish National Patient Registry (see Table S1 supplemental data for codes), and all-cause mortality was obtained from the Danish Civil Registration System.
Analyses
We performed a number of descriptive analyses and plots to ascertain that our data met the basic assumptions for the RDD as described by Moscoe et al.11 1) By plotting frequency and values of the HbA1c measurements in a histogram, we assessed whether HbA1c was measured and reported continuously. This is to ensure that neither patients nor doctors have been able to deliberately change the value of the measurement and hereby change treatment allocation group. 2) We tabulated the distribution of covariates to show that they were not discontinuous at the threshold and to confirm that individuals whose measurement was just below the threshold for treatment initiation and individuals just above were similar (exchangeable) at the time of the initial measurement, as is also the case in RCTs.
In our primary analyses, our focus was on those with HbA1c values within 6.0–7.0% (42–53 mmol/mol) with pre-specified guideline threshold of 6.5% (48 mmol/mol). However, we also report results from the broader and the narrower ranges to evaluate the sensitivity of the results in the choice of the bandwidth. We also stratified our analyses on sex, age and calendar time (early (2006–2011) and late (2012–2014)), and finally, we adjusted our primary analyses for diuretics, antihypertensives and year.
In order to ensure our findings, using the pre-specified guideline threshold of 6.5% (48 mmol/mol), were not just due to chance, we conducted supportive analyses. We sought to evaluate whether we would observe a jump (discontinuity) for other values of HbA1c and therefore repeated our analysis for a threshold of 6.0% (42 mmol/mol) and 7.0% (53 mmol/mol), respectively.
We examined the effect of diabetes treatment eligibility on all-cause mortality and CVE in a Cox regression model with the following parameterization of the hazard function h:
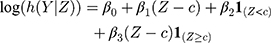
where Z denotes the vector of HbA1c values, Y the vector containing the outcomes, c the threshold (6.5% (48 mmol/mol)),  is the trend of the line below the threshold,
  is the trend of the line above the threshold, and
  is the difference at the threshold, ie, the estimator of the intention-to-treat. We inspected the plot of the fitted hazard function from this model against the initial HbA1c measurement to visually confirm the discontinuity at the threshold. A visible jump at the threshold indicates a non-zero treatment effect, whereas continuity at the threshold indicates a null effect, ie,
  . The local effects were estimated for the three above-mentioned HbA1c ranges.
All analyses were conducted using SAS version 9.4 (SAS Institute Inc., Cary, NC).
The study was approved by the Danish Data Protection Agency (record number: KEA-2015-4).
Results
In total, 717,449 individuals in the Central Denmark Region and the North Denmark Region had a first record of HbA1c in the period between 2006 and 2014. Of the total population, 290,333 met the inclusion criteria. HbA1c was measured and reported continuously and there was no evidence that patients nor doctors have changed treatment allocation around the threshold (Figure 1). Among these, 43,070 had a first record of HbA1c within the range of 6.0–7.0% (42–53 mmol/mol), 36,360 (84%) individuals had an HbA1c below the recommended threshold for treatment, 6.0–6.4% (42–47 mmol/mol) and 6710 (16%) had an HbA1c above the threshold, 6.5–7.0% (48–53 mmol/mol) (Table 1). The median age was similar among individuals below and above the threshold (63 years), but the sex ratio differed slightly with 52% women below the threshold and 48% women above the threshold (Table 1). The standardized differences indicate a high degree of comparability between individuals below and above the threshold on prescribing of statins, NSAIDS, glucocorticoids, antidepressants, antibiotics and antiplatelets (Table 1). However, there were some differences for individuals receiving diuretic and antihypertensive treatment (Table 1).
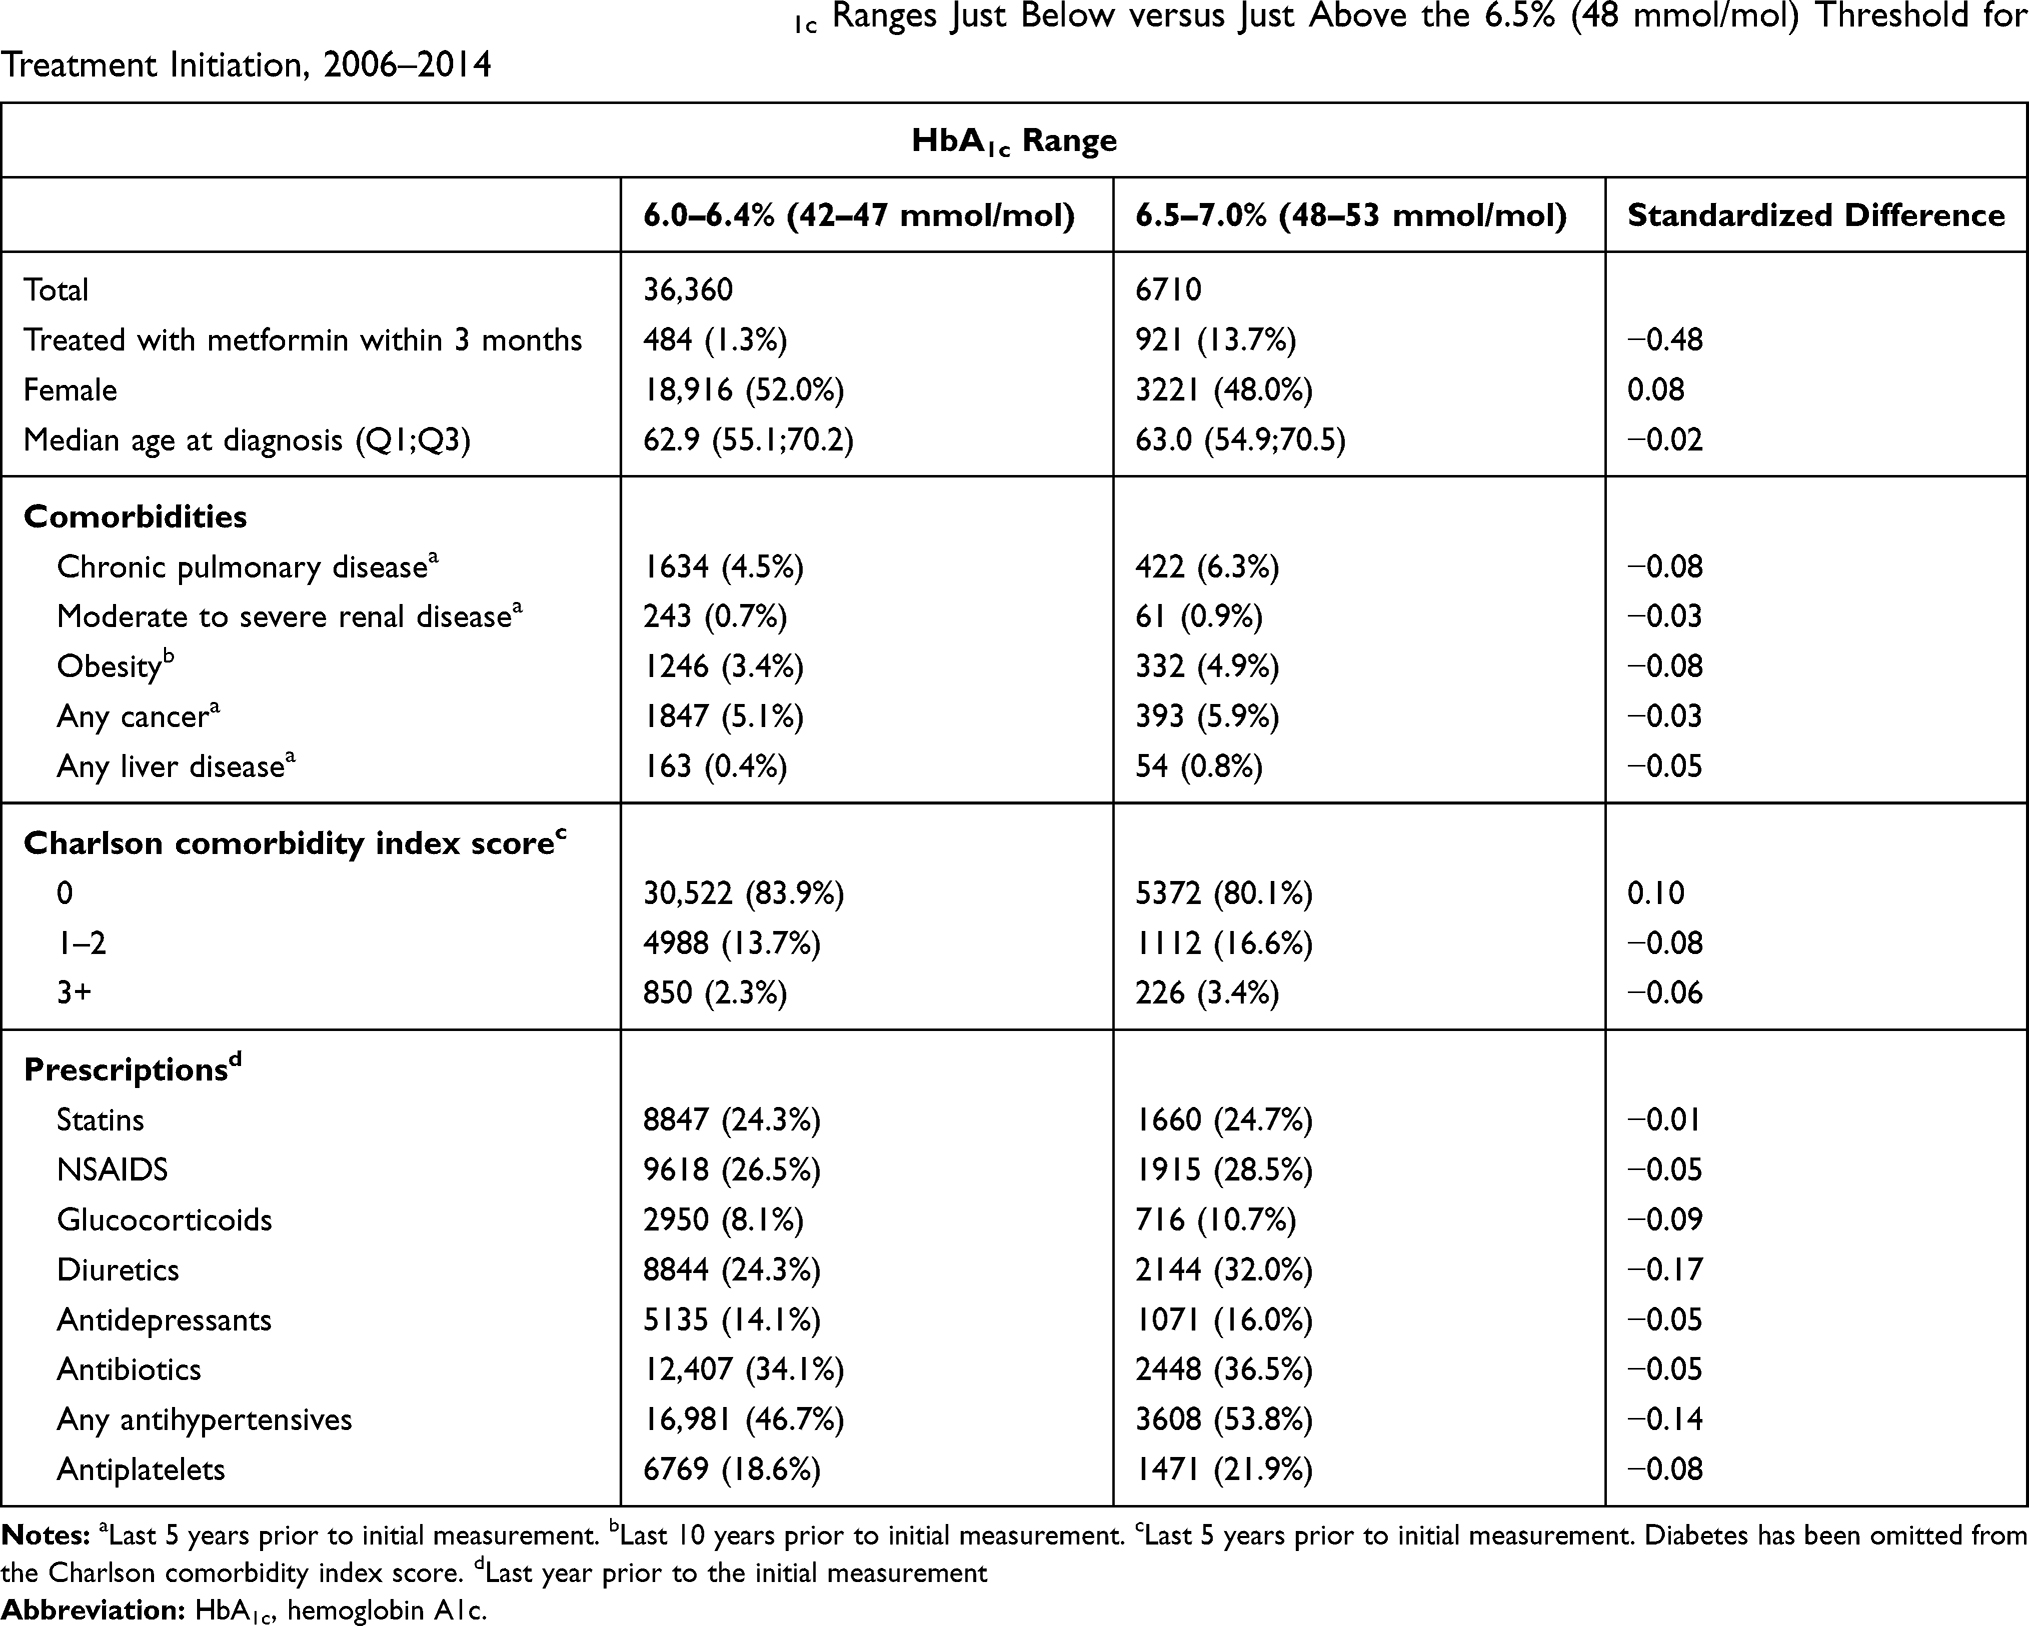 |
Table 1 Characteristics of Individuals Within HbA1c Ranges Just Below versus Just Above the 6.5% (48 mmol/mol) Threshold for Treatment Initiation, 2006–2014 |
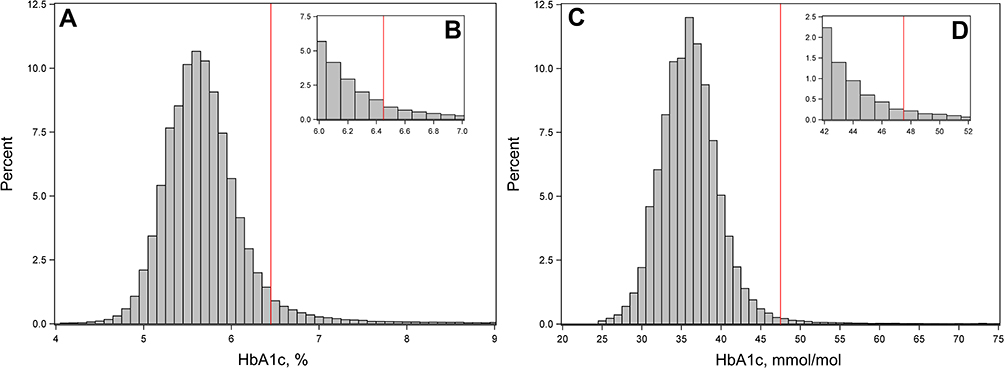 |
Figure 1 Hemoglobin A1c (HbA1c) test results among 525,266 individuals in Central and Northern Denmark with an incident HbA1c test during 2006–2012 (A and B, HbA1c in %) and 2013–2014 (C and D, HbA1c in mmol/mol). Histograms show continuity of HbA1c test results around the threshold of 6.5% (48 mmol/mol) (vertical red lines). |
The differences were larger when choosing a broader range of HbA1c and became smaller when choosing a narrower range of HbA1c (Table S2 supplemental data).
These patterns were similar when we stratified the sample on men and women, calendar periods and those aged below and above 60 years (Tables S3–S8 supplemental data).
The median follow-up for all-cause mortality or CVE was 4.06 (IQR 2.18–6.69) years among those with an HbA1c of 6.0–6.4% (42–47 mmol/mol), and 5.18 (IQR 2.61–7.33) years for those with an HbA1c of 6.5–7.0% (48–53 mmol/mol), event rates were, in general, more frequent among individuals with a first record of HbA1c measurement above the threshold than among those below the threshold. Thus, there were 27.5 (95% CI 26.7–28.3) events per 1000 person-years in those with an HbA1c of 6.0–6.4% (42–47 mmol/mol) and 37.2 (95% CI 35.1–39.3) events per 1000 person-years in those with an HbA1c of 6.5–7.0% (48–53 mmol/mol). However, when looking only at the threshold, there was a discontinuity (Figure 2) and individuals with a first record of HbA1c measurement just above the threshold show a 21% lower rate of death or CVE than those just below the threshold (Hazard ratio (HR) 0.79 (95% CI 0.69–0.90)) (Table 2). The estimates were similar after adjustment for diuretic, antihypertensive treatment and year (Table 2).
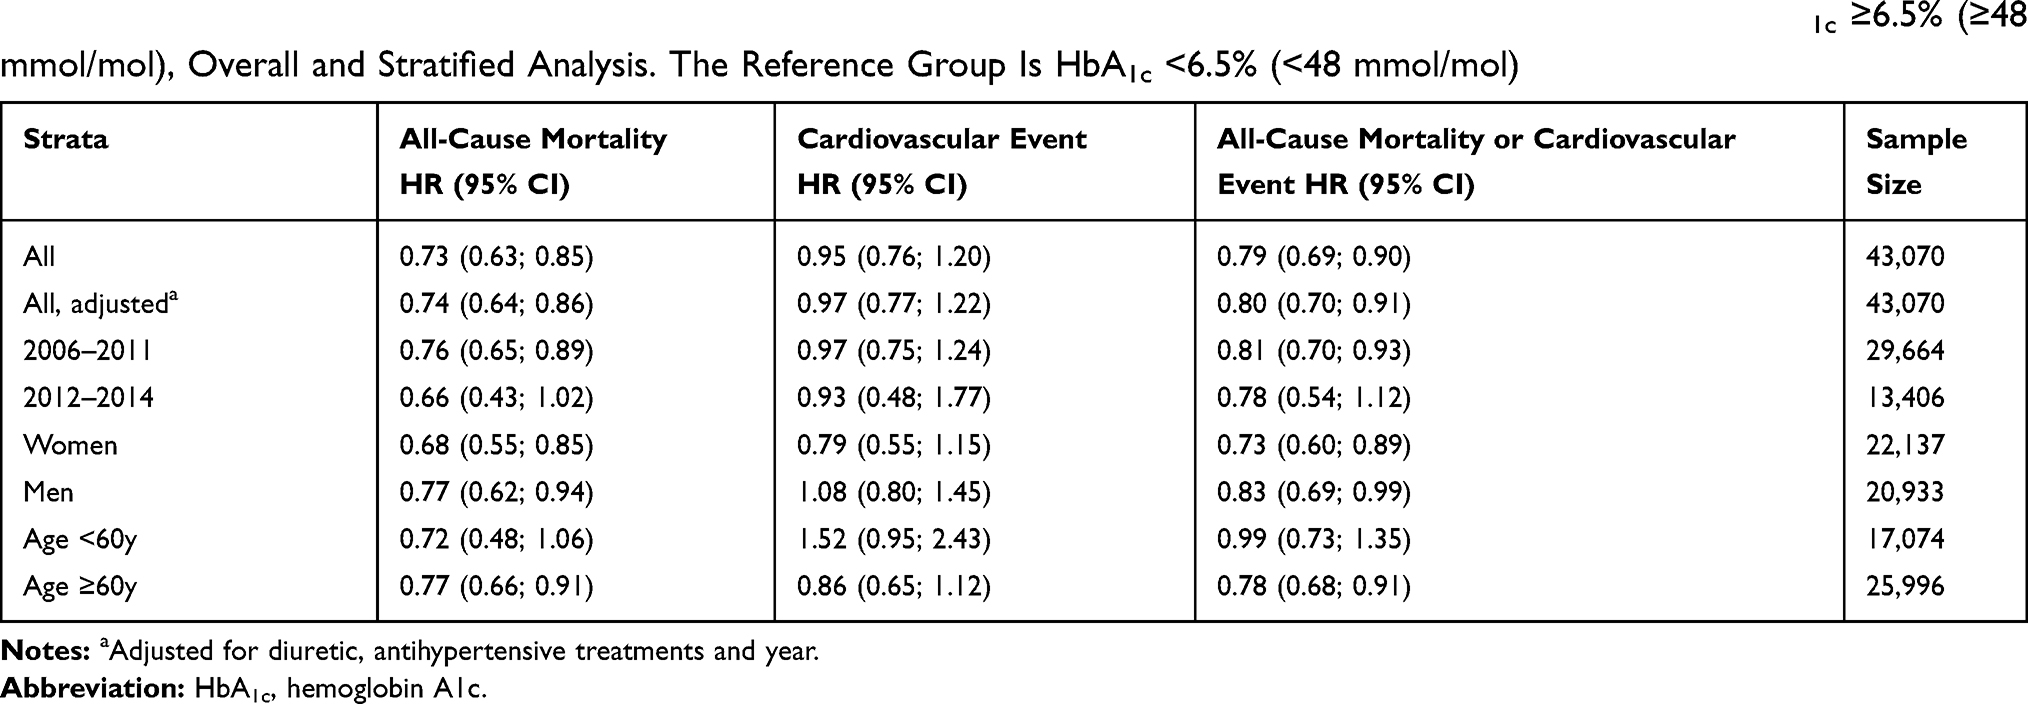 |
Table 2 Hazard Ratios of All-Cause Mortality, Cardiovascular Events and Composite Endpoint Associated with HbA1c ≥6.5% (≥48 mmol/mol), Overall and Stratified Analysis. The Reference Group Is HbA1c <6.5% (<48 mmol/mol) |
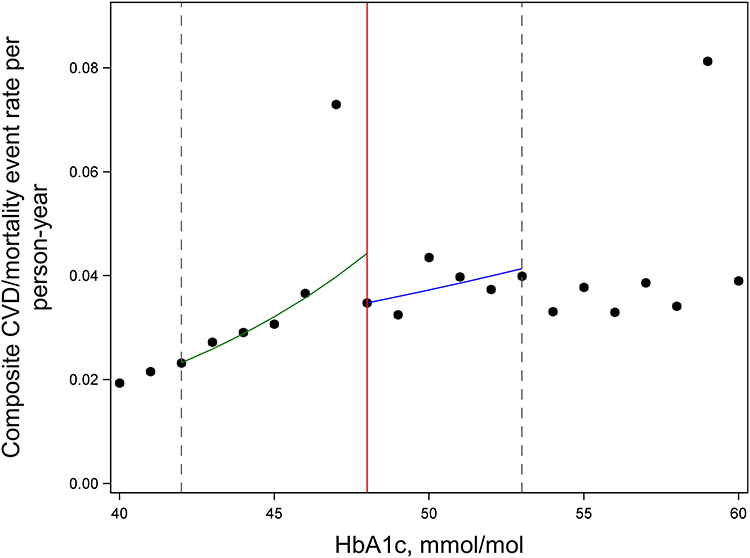 |
Figure 2 Rates of cardiovascular events or death according to first record of hemoglobin A1c (HbA1c) measurement. HbA1c threshold of 6.5% (48 mmol/mol) is shown by the red line. The range used for the primary analysis (6.0% (42 mmol/mol) to 7.0% (53 mmol/mol)) is indicated by dashed lines. The figure shows the regression discontinuity above the threshold (blue line) and below the threshold (green line). |
Narrowing the overall range of HbA1c to 6.2–6.8% (44–51 mmol/mol) provided similar results, but reduced the precision of the estimates as the sample was smaller (Table S9 supplemental data).
The analyses stratified on calendar time provided similar estimates as the overall results (Table 2). The analyses stratified on men and women suggested a larger positive effect for women (HR 0.73 (0.60–0.89)) than for men (HR 0.83 (0.69–0.99)) of being just above the threshold for type 2 diabetes treatment (Table 2). The analyses stratified on age below and above 60 years suggested that there was no effect in those below the age of 60, but a 22% reduction in those aged above 60 (HR 0.78 (0.68–0.91)) (Table 2).
Sensitivity Analyses
In our first sensitivity analysis, we limited the sample and only followed individuals from when they had HbA1c measurements above 5.5% (37 mmol/mol) and repeated our analyses. The rate of death or CVE was similar to our original results when comparing those with an HbA1c of 6.0–6.4% (42–47 mmol/mol) and 6.5–7.0% (48–53 mmol/mol) (HR 0.81 (95% CI 0.71–0.92), N=44,846). As Figure 2 revealed that individuals with an HbA1c of 6.4% (47 mmol/mol) had high rates of the outcome, we conducted an analysis excluding individuals (n=266) with an HbA1c of 6.4% (47 mmol/mol) and found this had minimal impact on the overall results.
When moving the threshold to 6.0% (42 mmol/mol), we observed no discontinuity when comparing those just below and those above (HR 1.02 (95% CI 0.95; 1.09)) (Tables S10–S11 supplemental data) When moving the threshold to 7.0% (53 mmol/mol), we saw a slight discontinuity (HR 0.86 (0.70; 1.06)) (Tables S12–S13 supplemental data).
Metformin
Since guidelines recommend initiation of metformin treatment when the HbA1c value exceeds 6.5% (48 mmol/mol), we evaluated the treatment threshold rule by plotting the initial HbA1c measurement against the probability of metformin treatment initiation within 1 and 3 months, respectively, of the date of the HbA1c measurement (Figure S1 supplemental data). The probability of early metformin treatment initiation was higher for patients above the threshold. However, only 921 individuals (14%) above the threshold (6.5–7.0% (48–53 mmol/mol)) and 484 individuals (1%) below the threshold (6.0–6.4% (42–47 mmol/mol)) initiated metformin treatment within 3 months after their initial HbA1c record.
Discussion
In this study, we demonstrated the impact of being eligible for type 2 diabetes treatment on all-cause mortality and CVE in everyday clinical practice. We found that individuals just above the treatment threshold had a 21% lower rate of death or CVE than those just below the threshold (HR 0.79 (95% CI 0.69–0.90)). The positive effect of being eligible for treatment was slightly larger for women (HR 0.73 (0.60–0.89)) than for men (HR 0.83 (0.69–0.99)), but no effect was observed in those aged below 60 years. Relatively few individuals (14%) received metformin treatment within 3 months of their first record of HbA1c measurement above the threshold, and the beneficial effect associated with being just above versus just below the treatment threshold is thus unlikely to be mediated by metformin treatment initiation alone.
For many years, type 2 diabetes guidelines have emphasized immediate lifestyle modifications, including physical activity, healthy diet and weight loss, when type 2 diabetes is first diagnosed, with metformin therapy (if tolerated) as a first-line glucose-lowering pharmacological treatment in most individuals started immediately at or soon after diagnosis. Usually, this is combined with aggressive cardiovascular risk-factor management against hypertension, dyslipidemia, and platelet aggregation.3,5 While such multifactorial intervention has been shown to reduce CVE and mortality in patients with long-standing type 2 diabetes,8 the effectiveness of the early intervention on subsequent cardiovascular outcomes in newly diagnosed type 2 diabetes patients has been less clear.2,6
It is well known that glucose levels under the current diagnostic threshold (ie, prediabetes, corresponding to HbA1c 6.0–6.4% (42–47 mmol/mol)) are also associated with increased risk of CVE.4 This is likely related to pathophysiological processes accompanying type 2 diabetes that have often been present for several years before diagnosis of manifest type 2 diabetes.20,21 Vistisen et al recently showed that CVE and mortality rates were 37% to 54% increased with prediabetes (HbA1c 6.0–6.4% or 5.7–6.4%) versus normoglycemia, and that two-thirds of this excess risk were explained by clustering of cardiometabolic risk factors such as smoking, lipids, and high blood pressure in people with prediabetes.22 This supports our suggestions that multifactorial type 2 diabetes treatment in people reaching an HbA1c of just above 6.5% (48 mmol/mol) may indeed lower the risk of CVE and death in this population. Our finding that being eligible for treatment had a slightly larger positive effect among women than men is in contrast to previous research on sex differences in type 2 diabetes.23,24 Thus, Arnezt et al concluded that, in general, women with type 2 diabetes have higher morbidity and cardiovascular mortality than men.23 Yet, they also emphasized a need for further research designed specifically to evaluate sex differences in the effectiveness and outcome of the available treatments.23
Clinical Relevance
Our study suggests that early treatment in newly diagnosed type 2 diabetes substantially reduces the risk of cardiovascular events and all-cause mortality. Since only one in seven individuals started metformin soon after becoming eligible for type 2 diabetes treatment, the prognostic benefits from “crossing the line” from prediabetes to HbA1c-defined diabetes cannot be attributed to the initiation of metformin alone, but rather multifactorial interventions. Our study thus supports current guidelines of prompt treatment intervention from the time of first type 2 diabetes diagnosis, with lifestyle counselling, aggressive cardiovascular risk-factor management, and glucose-lowering therapy. Our results also raise the possibility that individuals with prediabetes, ie, those who have an HbA1c just under the diabetes diagnostic threshold, currently receive too little clinical attention. Finally, reaching the threshold for being eligible for treatment may also have an impact on individual susceptibility to treatment and lifestyle modifications. Thus, there may be a “gosh my HbA1c is too high” effect leading to the realization that changes are needed to improve health.
Strengths and Limitations
To our knowledge, this is the first time that the RDD has been applied to Danish healthcare data. One of the key strength of using data from a tax-supported, universal healthcare system is that the study is not subject to selection biases stemming from selective inclusion of specific hospital, health insurance systems, or age groups.
In this study, we examined the effect of diabetes treatment eligibility. We also considered to evaluate the causal effect of metformin treatment initiation on all-cause mortality and CVE. To estimate this effect, it is necessary to scale the effect of diabetes treatment eligibility by the difference in the probability of metformin treatment at the threshold. However, since only one in seven of the individuals above the treatment threshold initiated metformin treatment within 3 months, we were not able to provide reliable estimates of the causal effect of metformin treatment on all-cause death and CVE. In addition, as glucose-lowering pharmacological treatment may often be combined with other cardiovascular risk-factor management,3–5 we would not have been able to distinguish the effect of each of these components.
Our supportive analysis confirmed that there was no discontinuity in the risk of mortality or CVE when we selected thresholds of 6% (42 mmol/mol). This may help to reassure us that the observed discontinuity at 6.5% (≥48 mmol/mol) is due to clinical intervention and not just due to chance. On the other hand, our results suggest that there might also be a slight discontinuity at 7% (53 mmol/mol). Perhaps due to the fact that the 7% (53 mmol/mol) threshold has been an important, pragmatic glucose-lowering treatment target for type 2 diabetes patients in the earlier part of our study period, this threshold may also have served as a pragmatic cutoff value among many clinicians to initiate more intensive diabetes therapy.
If the test results are near the threshold for diabetes diagnosis, guidelines recommend the health care professionals to follow the patient closely and repeat the test in 3–6 months either by HbA1c or alternative tests (an abnormal fasting plasma glucose or 2-hrs plasma glucose) to confirm the diabetes diagnosis.4 However, using repeated measurements to verify a patient’s diabetes status will violate the RDD assumption of random allocation of measurements around the diagnostic threshold. We, therefore, had to rely on one HbA1c test in our analysis. Given the chronic progressive nature of prediabetes/type 2 diabetes, it is likely that few individuals in our study who initially were below the HbA1c threshold would “cross the line” shortly after their first measurement and become eligible for treatment. Thus, our study may underestimate the actual effects of being eligible for type 2 diabetes treatment, but not changing our conclusions.
Conclusion
Individuals eligible for type 2 diabetes treatment as determined by the diagnostic threshold rule HbA1c ≥6.5% (≥48 mmol/mol) experienced a 21% lower rate of death or CVE compared to those just below the threshold. Less than one in seven patients initiated metformin treatment within 3 months. Therefore, other factors, including lifestyle modifications and more aggressive cardiovascular risk-factor control following the recording of an HbA1c ≥6.5% (≥48 mmol/mol), may contribute to this reduced rate of death and CVE.
Disclosure
IP, GB and FR received funding from the UK Medical Research Council for research to develop the Regression Discontinuity Design (Grant number MR/K014838/1). IP has also received funding from Novo Nordisk, but not in relation to this project. SKN, LP, and RWT did not report receiving fees, honoraria, grants or consultancies. Department of Clinical Epidemiology is, however, involved in studies with funding from various companies as research grants to (and administered by) Aarhus University. Department of Clinical Epidemiology is a member of the Danish Centre for Strategic Research in Type 2 Diabetes (DD2), supported by the Danish Agency for Science (grant nos. 09-067009 and 09-075724), the Danish Health and Medicines Authority, the Danish Diabetes Association, and an unrestricted donation from Novo Nordisk A/S. Project partners are listed on the website www.DD2.nu. Department of Clinical Epidemiology participates in the International Diabetic Neuropathy Consortium (IDNC) research program, which is supported by a Novo Nordisk Foundation Challenge program grant (Grant number NNF14SA000 6). The authors report no other conflicts of interest in this work.
References
1. Fox CS, Golden SH, Anderson C, et al. Update on prevention of cardiovascular disease in adults with type 2 diabetes mellitus in light of recent evidence: a scientific statement from the American Heart Association and the American Diabetes Association. Diabetes Care. 2015;38(9):1777–1803. doi:10.2337/dci15-0012
2. Abdul-Ghani M, DeFronzo RA, Del Prato S, Chilton R, Singh R, Ryder REJ. Cardiovascular disease and type 2 diabetes: has the dawn of a new era arrived? Diabetes Care. 2017;40(7):813–820. doi:10.2337/dc16-2736
3. National Institute for Health and Care Excellence. Type 2 diabetes in adults: management. Guidance and guidelines. NICE. Available from: https://www.nice.org.uk/guidance/ng28.
4. Standards of Medical Care in Diabetes. American Diabetes Association. Available from: https://professional.diabetes.org/content-page/standards-medical-care-diabetes.
5. Chamberlain JJ, Rhinehart AS, Shaefer CF, Neuman A. Diagnosis and management of diabetes: synopsis of the 2016 American Diabetes Association Standards of Medical Care in Diabetes. Ann Intern Med. 2016;164(8):542–552. doi:10.7326/M15-3016
6. Svensson E, Baggesen LM, Johnsen SP, et al. Early glycemic control and magnitude of HbA1c reduction predict cardiovascular events and mortality: population-based cohort study of 24,752 metformin initiators. Diabetes Care. 2017;40(6):800–807. doi:10.2337/dc16-2271
7. King P, Peacock I, Donnelly R. The UK Prospective Diabetes Study (UKPDS): clinical and therapeutic implications for type 2 diabetes. Br J Clin Pharmacol. 1999;48(5):643–648. doi:10.1046/j.1365-2125.1999.00092.x
8. Gaede P, Lund-Andersen H, Parving -H-H, Pedersen O. Effect of a multifactorial intervention on mortality in type 2 diabetes. N Engl J Med. 2008;358(6):580–591. doi:10.1056/NEJMoa0706245
9. O’Keeffe AG, Geneletti S, Baio G, Sharples LD, Nazareth I, Petersen I. Regression discontinuity designs: an approach to the evaluation of treatment efficacy in primary care using observational data. BMJ. 2014;349:g5293. doi:10.1136/bmj.g5293
10. Bor J, Moscoe E, Mutevedzi P, Newell M-L, Bärnighausen T. Regression discontinuity designs in epidemiology: causal inference without randomized trials. Epidemiology. 2014;25(5):729–737. doi:10.1097/EDE.0000000000000138
11. Moscoe E, Bor J, Bärnighausen T. Regression discontinuity designs are underutilized in medicine, epidemiology, and public health: a review of current and best practice. J Clin Epidemiol. 2015;68(2):132–143. doi:10.1016/j.jclinepi.2014.06.021
12. Grann ER, Nielsen F, Thomsen R. Existing data sources for clinical epidemiology: the clinical laboratory information system (LABKA) research database at Aarhus University, Denmark. Clin Epidemiol. 2011;3:133–138. doi:10.2147/CLEP.S17901
13. Schmidt M, Schmidt SAJ, Sandegaard JL, Ehrenstein V, Pedersen L, Sørensen HT. The Danish National Patient Registry: a review of content, data quality, and research potential. Clin Epidemiol. 2015;7:449–490. doi:10.2147/CLEP.S91125
14. Ehrenstein V. Existing data sources for clinical epidemiology: aarhus university prescription database. Clin Epidemiol. 2010;2:273–279. doi:10.2147/CLEP.S13458
15. Schmidt M, Pedersen L, Sørensen HT. The Danish civil registration system as a tool in epidemiology. Eur J Epidemiol. 2014;29(8):541–549. doi:10.1007/s10654-014-9930-3
16. Thistlethwaite DL, Campbell DT. Regression-discontinuity analysis: an alternative to the ex post facto experiment. J Educ Psychol. 1960;51(6):309–317. doi:10.1037/h0044319
17. Lee DS. Randomized experiments from non-random selection in U.S. House elections. J Econom. 2008;142(2):675–697. doi:10.1016/j.jeconom.2007.05.004
18. Imbens G, Lemieux T. Regression discontinuity designs: a guide to practice. J Econom. 2008;142(2):615–635. doi:10.1016/j.jeconom.2007.05.001
19. Nathan DM, Buse JB, Davidson MB, et al. Management of hyperglycaemia in type 2 diabetes: a consensus algorithm for the initiation and adjustment of therapy: a consensus statement from the American Diabetes Association and the European Association for the Study of Diabetes. Diabetologia. 2006;49(8):1711–1721. doi:10.1007/s00125-006-0316-2
20. Hulman A, Simmons RK, Brunner EJ, et al. Trajectories of glycaemia, insulin sensitivity and insulin secretion in South Asian and white individuals before diagnosis of type 2 diabetes: a longitudinal analysis from the Whitehall II cohort study. Diabetologia. 2017;60(7):1252–1260. doi:10.1007/s00125-017-4275-6
21. Thrasher J. Pharmacologic management of type 2 diabetes mellitus: available therapies. Am J Med. 2017;130(6S):S4–S17. doi:10.1016/j.amjmed.2017.04.004
22. Vistisen D, Witte DR, Brunner EJ, et al. Risk of cardiovascular disease and death in individuals with prediabetes defined by different criteria: the Whitehall II Study. Diabetes Care. 2018;41(4):899–906. doi:10.2337/dc17-2530
23. Arnetz L, Ekberg NR, Alvarsson M. Sex differences in type 2 diabetes: focus on disease course and outcomes. Diabetes Metab Syndr Obes Targets Ther. 2014;7:409–420. doi:10.2147/DMSO.S51301
24. Roche MM, Wang PP. Sex differences in all-cause and cardiovascular mortality, hospitalization for individuals with and without diabetes, and patients with diabetes diagnosed early and late. Diabetes Care. 2013;36(9):2582–2590. doi:10.2337/dc12-1272
 © 2020 The Author(s). This work is published and licensed by Dove Medical Press Limited. The full terms of this license are available at https://www.dovepress.com/terms.php and incorporate the Creative Commons Attribution - Non Commercial (unported, v3.0) License.
By accessing the work you hereby accept the Terms. Non-commercial uses of the work are permitted without any further permission from Dove Medical Press Limited, provided the work is properly attributed. For permission for commercial use of this work, please see paragraphs 4.2 and 5 of our Terms.
© 2020 The Author(s). This work is published and licensed by Dove Medical Press Limited. The full terms of this license are available at https://www.dovepress.com/terms.php and incorporate the Creative Commons Attribution - Non Commercial (unported, v3.0) License.
By accessing the work you hereby accept the Terms. Non-commercial uses of the work are permitted without any further permission from Dove Medical Press Limited, provided the work is properly attributed. For permission for commercial use of this work, please see paragraphs 4.2 and 5 of our Terms.