")
Back to Journals » Therapeutics and Clinical Risk Management » Volume 12
Impact of baseline systolic blood pressure on visit-to-visit blood pressure variability: the Kailuan study
Authors Wang A, Li Z, Yang Y, Chen G, Wang C, Wu Y, Ruan C, Liu Y, Wang Y, Wu S
Received 5 May 2016
Accepted for publication 23 June 2016
Published 2 August 2016 Volume 2016:12 Pages 1191—1196
DOI https://doi.org/10.2147/TCRM.S112082
Checked for plagiarism Yes
Review by Single anonymous peer review
Peer reviewer comments 2
Editor who approved publication: Dr Deyun Wang
Anxin Wang,1–5,* Zhifang Li,6,* Yuling Yang,6 Guojuan Chen,6 Chunxue Wang,1–4 Yuntao Wu,7 Chunyu Ruan,7 Yan Liu,7 Yilong Wang,1–4 Shouling Wu7
1Department of Neurology, Beijing Tiantan Hospital, Capital Medical University, 2China National Clinical Research Center for Neurological Diseases, 3Center of Stroke, Beijing Institute for Brain Disorders, 4Beijing Key Laboratory of Translational Medicine for Cerebrovascular Disease, 5Department of Epidemiology and Health Statistics, School of Public Health, Capital Medical University, Beijing, 6Graduate School, 7Department of Cardiology, Kailuan Hospital, North China University of Science and Technology, Tangshan, People’s Republic of China
*These authors contributed equally to this work
Background: To investigate the relationship between baseline systolic blood pressure (SBP) and visit-to-visit blood pressure variability in a general population.
Methods: This is a prospective longitudinal cohort study on cardiovascular risk factors and cardiovascular or cerebrovascular events. Study participants attended a face-to-face interview every 2 years. Blood pressure variability was defined using the standard deviation and coefficient of variation of all SBP values at baseline and follow-up visits. The coefficient of variation is the ratio of the standard deviation to the mean SBP. We used multivariate linear regression models to test the relationships between SBP and standard deviation, and between SBP and coefficient of variation.
Results: Approximately 43,360 participants (mean age: 48.2±11.5 years) were selected. In multivariate analysis, after adjustment for potential confounders, baseline SBPs <120 mmHg were inversely related to standard deviation (P<0.001) and coefficient of variation (P<0.001). In contrast, baseline SBPs ≥140 mmHg were significantly positively associated with standard deviation (P<0.001) and coefficient of variation (P<0.001). Baseline SBPs of 120–140 mmHg were associated with the lowest standard deviation and coefficient of variation. The associations between baseline SBP and standard deviation, and between SBP and coefficient of variation during follow-ups showed a U curve.
Conclusion: Both lower and higher baseline SBPs were associated with increased blood pressure variability. To control blood pressure variability, a good target SBP range for a general population might be 120–139 mmHg.
Keywords: blood pressure variability, coefficient of variation, standard deviation, systolic blood pressure
Introduction
Blood pressure (BP) variability is defined as the standard deviation or coefficient of variation of beat-to-beat BP obtained by intra-arterial monitoring for 24 hours1 or noninvasive ambulatory BP monitoring achieved during a period.2 BP variability included two types: short-term BP variability, which fluctuates during 24 hours (beat-to-beat, minute-to-minute, hour-to-hour, and day-to-night changes) and long-term BP variability, which fluctuates over a longer period (days, weeks, months, seasons, and even years).3 Previous studies suggested that BP variability is independently associated with the occurrence of hypertensive target organ damage and cardiovascular events,4–9 as well as the poor prognosis of cardiovascular diseases.10–13 Controlling the level of BP variability might be a good method to prevent related diseases. Thus, an investigation of the risk factors of BP variability is important and necessary.
Elevated BP is a major modifiable risk factor for macrovascular diseases (such as coronary heart disease and cerebrovascular events), and is also associated with the progression of microvascular complications.14,15 Previous studies16,17 have shown that elevated BP levels can lead to an increase in short-term BP variability. However, few studies have investigated the relationship between BP levels and long-term BP variability, especially in the general population.
In this study, we examined the association between baseline systolic blood pressure (SBP) and visit-to-visit BP variability (ie, BP variations that are reproducible rather than a random phenomenon18) in a general population. In addition, we also determined what level of SBP at baseline will have a lower long-term BP variability.
Methods
Study design
The Kailuan study is a prospective cohort study and was conducted in the Kailuan community in Tangshan, Hebei Province, People’s Republic of China.19–21 In total, 101,510 participants (81,110 males; age range, 18–98 years) were enrolled in the Kailuan study from June 2006 to October 2007. The Ethics Committees of both the Kailuan General Hospital and the Beijing Tiantan Hospital approved the study protocol and all participants provided written informed consent.
All participants underwent a clinical examination and a standardized interview, which included questions on smoking and alcohol consumption, socioeconomic parameters, diet, lifestyle, family medical history, physical activity, sleeping time and quality, known diagnosis of arterial hypertension, coronary heart disease, diabetes mellitus, hyperlipidemia and stroke, and current treatment of these diseases. Anthropomorphic parameters (ie, body height, weight, waist and hip circumference) were measured. Body mass index was calculated as the ratio of body weight (in kilograms) divided by the square of body height (in meters). Fasting blood samples were biochemically examined for the concentrations of glucose, high-density lipoproteins, low-density lipoproteins, triglycerides, total cholesterol, and high-sensitivity C-reactive protein.
BP was assessed after the participant had rested for at least 5 minutes. The study participants had refrained from smoking and drinking of coffee, tea, or alcohol for at least 3 hours, and had refrained from any exercise for 30 minutes immediately prior to BP and resting heart rate measurements. BP was measured on the left arm and recorded to the nearest 2 mmHg using a mercury sphygmomanometer under a standard procedure. The average of three readings taken at interval of ≥5 minutes was used in the data analysis. If two of the three measurements differed by >5 mmHg, an additional reading was taken. All the devices that were used to measure the BP and other indices were checked and calibrated by specialized persons. The interview and all examinations were carried out by specially trained medical doctors and nurses.
The study participants were asked to attend a face-to-face interview every 2 years (2008–2009, 2010–2011, and 2012–2013). The follow-up interviews and clinical examinations were performed by hospital physicians, research physicians, or research nurses, who were masked to the results of the previous examinations. In the present investigation, participants who had a history of myocardial infarction, stroke, arterial fibrillation, or any cancer were excluded to avoid bias for these diseases having a great effect on the two main variables of SBP and BP variability. In addition, participants who did not participate in all follow-up examinations or had no SBP data at baseline were included, too.
BP variability was defined as the standard deviation and the coefficient of variation of all values of SBP recorded during the baseline and follow-up visits. The coefficient of variation is the ratio of the standard deviation to the mean SBP.
Statistical analysis
Continuous variables were described by mean (± standard deviation) and categorical variables were described as percentages. To compare the two groups, we used Student’s t-test or analysis of variance for nonpaired samples of normally distributed parameters and the Wilcoxon or Kruskal–Wallis rank test for nonparametric variables. The chi-square test was applied for the comparison of categorical variables.
We used multivariate linear regression models to test the relationships between SBP and standard deviation, and between SBP and coefficient of variation. We created four multivariate-adjusted models. Model 1 only included the SBP predictor variable. Model 2 adjusted for the potential confounders of age and sex. Model 3 adjusted for the following confounders: age, sex, body mass index, fasting blood glucose, low-density lipoproteins, high-density lipoproteins, total cholesterol, triglycerides, high-sensitivity C-reactive protein, education level, smoking status, drinking status, and physical activity. In addition to the confounders that were adjusted for in model 3, model 4 adjusted for the use of antihypertensive drugs.
We further used multivariate linear regression models to test the relationships between SBP and BP variability by using SBP as a category variable; this was classified into four groups according to the cutoff value of normal BP (SBP <120 mmHg), the high-normal BP values (SBP 120–139 mmHg), and the clinical classification of hypertension (grade 1 hypertension: SBP 140–159 mmHg; grade 2 and 3 hypertension: SBP ≥160 mmHg). Then we would compare the correlation coefficients and investigate the tendencies in different categories of SBP based on the shape of the relationship between SBP and BP variability showed on the linear chart. Finally, we analyzed the association between an SBP increase of 1 mmHg and BP variability increase in different SBP groups.
Two-sided P-values were reported for all analyses. Statistical significance was considered for P<0.05. All statistical analyses were performed using SAS software, Version 9.3 (SAS Institute Inc., Cary, NC, USA).
Results
Of the 101,510 subjects who were originally recruited into the Kailuan study, we excluded 5,205 participants who had a history of myocardial infarction (n=1,316), stroke (n=2,014), atrial fibrillation (n=383), or any cancer (n=330); or who had no SBP data at baseline (n=1,162). Then, we excluded 52,945 participants who did not participate in all three face-to-face follow-up examinations (in 2008–2009, 2010–2011, and 2012–2013). Finally, 43,360 participants (32,959 of whom were males) met the inclusion criteria and were eligible for analysis in this study. The mean age was 48.2±11.5 years.
The participants’ average SBP, standard deviation, and coefficient of variation in the current study were 128.1±19.7 mmHg, 10.9±5.8 mmHg, and 8.3%±4.0%, respectively. Baseline characteristics of the present study cohort stratified by the four groups of baseline SBP are shown in Table 1. The mean age, body mass index, levels of fasting blood glucose, low-density lipoprotein, high-density lipoprotein, total cholesterol, triglycerides, and high-sensitivity C-reactive protein and the prevalence of physical activity more than four times per week gradually increased with an increase in baseline SBP from group 1 to group 4. However, the number of current smokers and people with a higher education level gradually declined with an increase in baseline SBP.
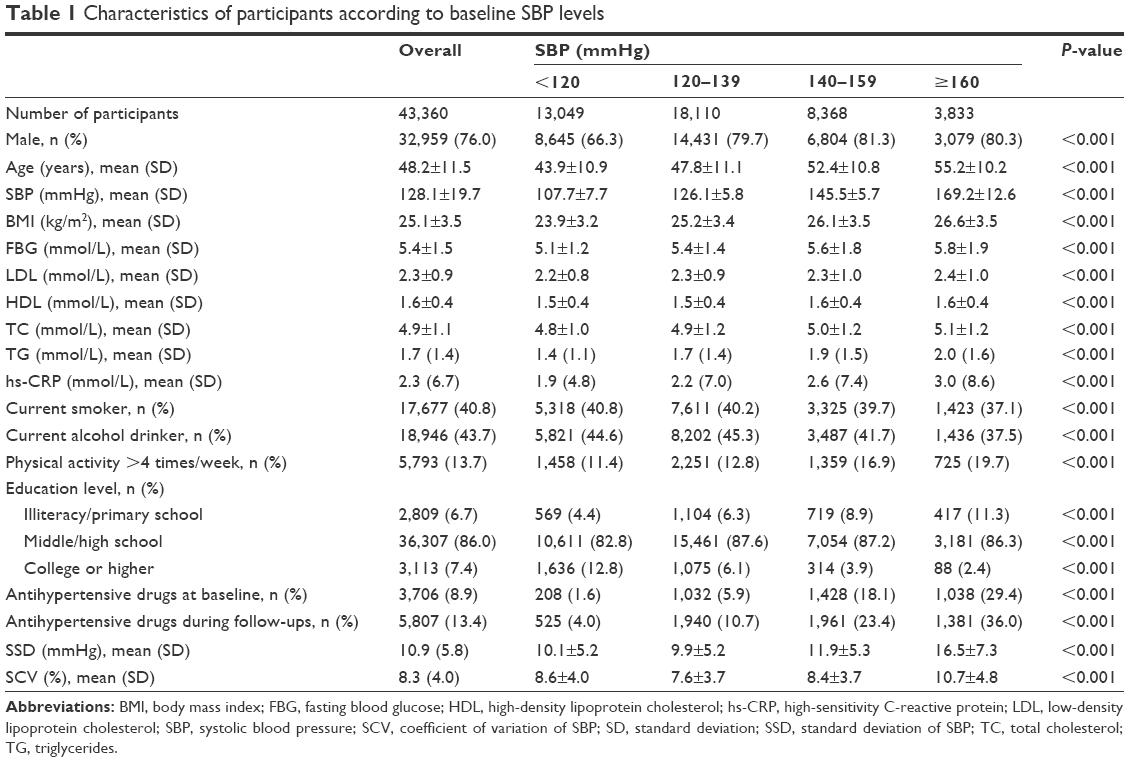 | Table 1 Characteristics of participants according to baseline SBP levels |
Table 2 shows the linear regression coefficients of standard deviation and coefficient of variation during the follow-ups from baseline SBP. In all four models of the multivariate linear regression, SBP at baseline was significantly related to the standard deviation and coefficient of variation during follow-up. After adjusting for all potential confounders, including age, sex, body mass index, fasting blood glucose, total cholesterol, low-density lipoproteins, triglycerides, high-sensitivity C-reactive protein, education level, smoking status, drinking status, physical activity, and antihypertensive drugs at baseline and during follow-up, the regression coefficients of standard deviation and coefficient of variation were 0.062 (P<0.001) and 0.007 (P<0.001), from the baseline SBP, respectively.
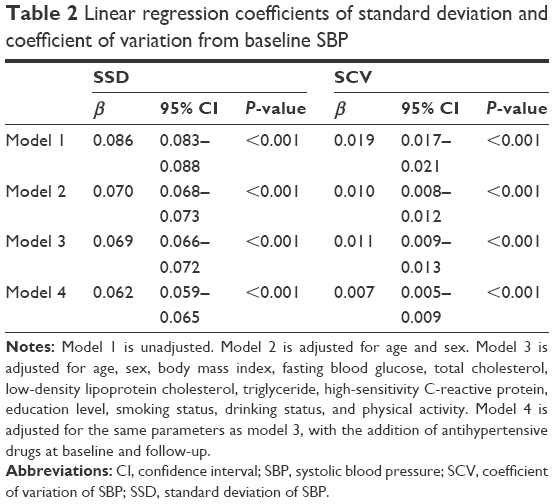 | Table 2 Linear regression coefficients of standard deviation and coefficient of variation from baseline SBP |
Both lower and higher baseline SBP is associated with an increased standard deviation and coefficient of variation (there is a U-shaped relationship). Participants with baseline SBPs of 120–139 mmHg have the lowest standard deviation and coefficient of variation (Figure 1).
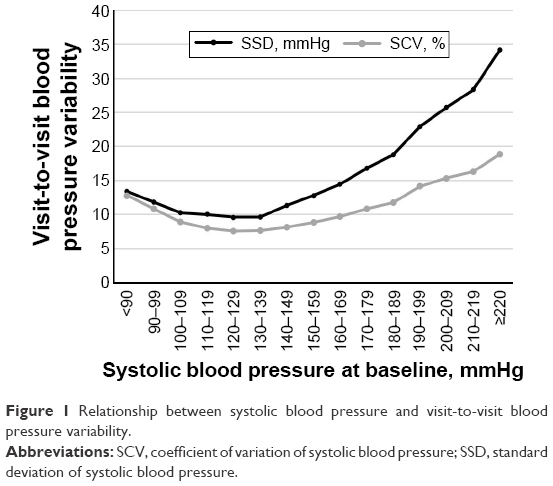 | Figure 1 Relationship between systolic blood pressure and visit-to-visit blood pressure variability. |
To test the relationship between different baseline SBP level groups and standard deviation and coefficient of variation during follow-up, baseline SBP was treated as a categorized variable in the linear regression model. After adjusting for all potential confounders, compared with participants with SBPs of 120–139 mmHg, the coefficients of standard deviation were 0.734, 1.427, and 5.468 for participants with baseline SBPs of <120, 140–159, and ≥160 mmHg, respectively, and the corresponding coefficients of variation were 0.510, 1.234, and 2.487, respectively (Table 3).
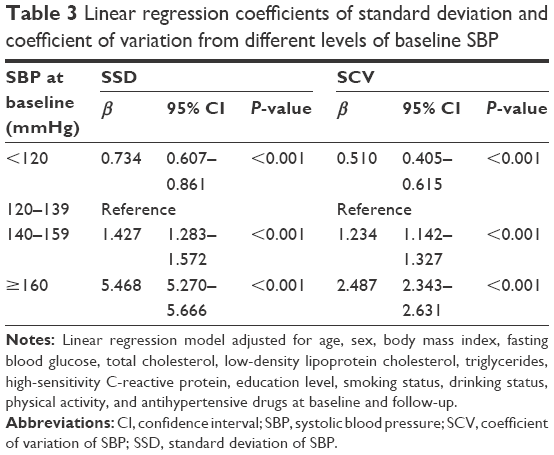 | Table 3 Linear regression coefficients of standard deviation and coefficient of variation from different levels of baseline SBP |
To further confirm the relationship between baseline SBP and standard deviation and coefficient of variation during follow-up in the four different baseline SBP level groups, four additional linear regression models, including all potential confounder analyses, were tested, dividing participants into four subgroups. In participants with baseline SBPs of <120 mmHg, the baseline SBP was inversely related to the standard deviation and coefficient of variation during follow-up. In contrast, the baseline SBPs were significantly associated with standard deviation and coefficient of variation in participants with baseline SBPs of ≥140 mmHg (Table 4).
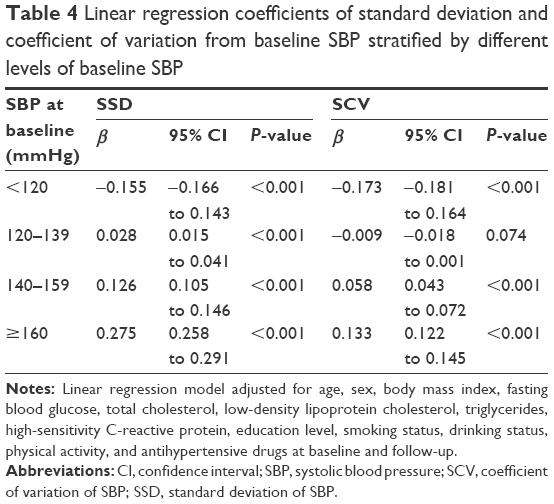 | Table 4 Linear regression coefficients of standard deviation and coefficient of variation from baseline SBP stratified by different levels of baseline SBP |
Discussion
In this large prospective cohort study of 43,360 participants in the Kailuan study, baseline SBP was independently associated with visit-to-visit BP variability after controlling for all potential confounders. The relationship between SBP at baseline and BP variability showed a U curve and the participants with the range of 120–139 mmHg of SBP had a lower BP variability at follow-up.
The BP variability reflects the stability condition of BP over a period of time. Although in some studies the predictive value of BP variability for organ damage and incidence of cardiovascular events has shown to be even higher than that of BP itself,22 BP may affect the BP variability in a short term as well as in a more prolonged term.23 Previous studies23,24 have shown that elevated BP levels can lead to an increase in short-term BP variability. Mancia et al reported that hypertension was associated with the BP variability analyzed by beat-to-beat in a short term (24h), and the association was greater so as the hypertension becomes progressively more marked.23 And then the relationship trend was confirmed existent between mean SBP and visit-to-visit BP variability (relatively long-term) by Muntner et al.8 To our knowledge, no studies using population-based data have assessed the association between the baseline SBP and visit-to-visit BP variability in a long term.25 In the present study, we found a U curve relationship between baseline SBP and visit-to-visit BP variability. Participants with baseline SBPs of 120–139 mmHg had a lower long-term BP variability in 6 years of follow-up, compared with baseline SBPs <120 or ≥140 mmHg. The mechanism for this relationship was speculated that the antioscillatory influence of the arterial baroreceptor reflex is impaired26,27 due to the functional alterations of central and peripheral arteries in subjects with too high or too low BP.28
It has been demonstrated that elevated visit-to-visit BP variability is associated with increased all-cause mortality.8,29,30 Therefore, it is very important to control the long-term BP variability. Previous studies showed that through the potential strategies of adjusting behaviors, controlling large artery stiffening and rationally using antihypertensive drugs to reduce the BP fluctuations between clinic visits could effectively reduce the damage to organs from hypertension and the risk of cardiovascular morbidity.31 In addition, several studies recommended controlling BP consistently and avoiding large BP differences from one visit to another.29,32 As suggested by our study, BP controlled at 120–139 mmHg achieved the lowest visit-to-visit BP variability and then optimized cardiovascular protection. The results are consistent with previous studies investigating the association of absolute SBP values and cardiovascular mortality.17,33 The INVEST study33 reported that among the patients who had diabetes mellitus and coronary artery disease, the usual control group (baseline SBPs of 130–140 mmHg) had the lowest risk of all-cause mortality compared with the tight control group (baseline SBPs of <130 mmHg) and the uncontrolled group (baseline SBPs of >140 mmHg). In addition, the IDNT17 study suggested that the risk for cardiovascular deaths and congestive heart failure events was increased in patients with baseline SBPs ≤120 mmHg. Overall, our study further provides evidence from a large Asian cohort that both excessively low and high baseline SBPs would increase the level of long-term BP variability.
This study has several strengths, including the prospective design, the large sample size in an Asian population, enrolment of females and males, standardized evaluation of directly measured BP, and broad assessment of potential confounders. However, our study has some limitations. First, because most of the participants from the Kailuan coalmine were male, the sex distribution of participants was unbalanced. Therefore, this sample cannot be viewed as representative of the Chinese general population. However, studying such a geographically confined and controlled population greatly reduces residual confounding due to diverse socioeconomic factors and lifestyle patterns. Second, some participants who did not attend all three face-to-face follow-up sessions may impact the results in this study. Third, the results of our study were based on a post hoc approach as in the previous studies,23,24,29 which means that the comparisons of visit-to-visit BP variability on progression have involved nonrandomized groups, Therefore, factors other than those under study may play a role.29,31 Fourth, during the long period of follow-up, several patients with an early event have been excluded, which may limit the analysis to the later part of the study.31
In conclusion, both lower and higher baseline SBPs were associated with an increased visit-to-visit BP variability. To control BP variability, a good target SBP range for a general population might be 120–139 mmHg.
Acknowledgments
We thank all the participants and their relatives in the study and the members of the survey teams in the eleven regional hospitals of the Kailuan Medical Group, as well as the project development and management teams in Beijing Tiantan Hospital and the Kailuan Group. We also thank Peiyao Wang for her English assistance.
Disclosure
The authors report no conflicts of interest in this work.
References
Frattola A, Parati G, Cuspidi C, Albini F, Mancia G. Prognostic value of 24-hour blood pressure variability. J Hypertens. 1993;11(10):1133–1137. | ||
Kikuya M, Hozawa A, Ohokubo T, et al. Prognostic significance of blood pressure and heart rate variabilities: the Ohasama study. Hypertension. 2000;36(5):901–906. | ||
Parati G, Ochoa JE, Lombardi C, Bilo G. Assessment and management of blood-pressure variability. Nat Rev Cardiol. 2013;10(3):143–155. | ||
Hammarstrom S. The variability of blood pressure in hypertension. Acta Med Scand. 1948;131(Suppl 206):94–101. | ||
Mallamaci F, Minutolo R, Leonardis D, et al. Long-term visit-to-visit office blood pressure variability increases the risk of adverse cardiovascular outcomes in patients with chronic kidney disease. Kidney Int. 2013;84(2):381–389. | ||
Di Iorio B, Pota A, Sirico ML, et al. Blood pressure variability and outcomes in chronic kidney disease. Nephrol Dial Transplant. 2012;27(12):4404–4410. | ||
Lau KK, Wong YK, Chang RS, et al. Visit-to-visit systolic blood pressure variability predicts all-cause and cardiovascular mortality after lacunar infarct. Eur J Neurol. 2014;21(2):319–325. | ||
Muntner P, Shimbo D, Tonelli M, Reynolds K, Arnett DK, Oparil S. The relationship between visit-to-visit variability in systolic blood pressure and all-cause mortality in the general population: findings from NHANES III, 1988 to 1994. Hypertension. 2011;57(2):160–166. | ||
Hata J, Arima H, Rothwell PM, et al. Effects of visit-to-visit variability in systolic blood pressure on macrovascular and microvascular complications in patients with type 2 diabetes mellitus: the ADVANCE trial. Circulation. 2013;128(12):1325–1334. | ||
Kikuya M, Ohkubo T, Metoki H, et al. Day-by-day variability of blood pressure and heart rate at home as a novel predictor of prognosis: the Ohasama study. Hypertension. 2008;52(6):1045–1050. | ||
Schillaci G, Pucci G. The importance of instability and visit-to-visit variability of blood pressure. Expert Rev Cardiovasc Ther. 2010;8(8):1095–1097. | ||
Hansen TW, Thijs L, Li Y, et al. Prognostic value of reading-to-reading blood pressure variability over 24 hours in 8938 subjects from 11 populations. Hypertension. 2010;55(4):1049–1057. | ||
Kai H, Kudo H, Takayama N, Yasuoka S, Kajimoto H, Imaizumi T. Large blood pressure variability and hypertensive cardiac remodeling – role of cardiac inflammation. Circ J. 2009;73(12):2198–2203. | ||
Adler AI, Stratton IM, Neil HA, et al. Association of systolic blood pressure with macrovascular and microvascular complications of type 2 diabetes (UKPDS 36): prospective observational study. BMJ. 2000;321(7258):412–419. | ||
Chobanian AV, Bakris GL, Black HR, et al. Seventh report of the Joint National Committee on Prevention, Detection, Evaluation, and Treatment of High Blood Pressure. Hypertension. 2003;42(6):1206–1252. | ||
Palatini P, Julius S. The role of cardiac autonomic function in hypertension and cardiovascular disease. Curr Hypertens Rep. 2009;11(3):199–205. | ||
Berl T, Hunsicker LG, Lewis JB, et al. Impact of achieved blood pressure on cardiovascular outcomes in the Irbesartan Diabetic Nephropathy Trial. J Am Soc Nephrol. 2005;16(7):2170–2179. | ||
Howard SC, Rothwell PM. Reproducibility of measures of visit-to-visit variability in blood pressure after transient ischaemic attack or minor stroke. Cerebrovasc Dis. 2009;28(4):331–340. | ||
Wang A, Li Z, Zhou Y, et al. Hypertriglyceridemic waist phenotype and risk of cardiovascular diseases in China: results from the Kailuan study. Int J Cardiol. 2014;174(1):106–109. | ||
Wang A, Liu X, Guo X, et al. Resting heart rate and risk of hypertension: results of the Kailuan cohort study. J Hypertens. 2014;32(8):1600–1605; discussion 1605. | ||
Wang A, Wu J, Zhou Y, et al. Measures of adiposity and risk of stroke in China: a result from the Kailuan study. PLoS One. 2013;8(4):e61665. | ||
Parati G, Ochoa JE, Salvi P, Lombardi C, Bilo G. Prognostic value of blood pressure variability and average blood pressure levels in patients with hypertension and diabetes. Diabetes Care. 2013;36(Suppl 2):S312–S324. | ||
Mancia G, Ferrari A, Gregorini L, et al. Blood pressure and heart rate variabilities in normotensive and hypertensive human beings. Circ Res. 1983;53(1):96–104. | ||
Mancia G, Di Rienzo M, Parati G. Ambulatory blood pressure monitoring use in hypertension research and clinical practice. Hypertension. 1993;21(4):510–524. | ||
Faramawi MF, Fischbach L, Delongchamp R, et al. Obesity is associated with visit-to-visit systolic blood pressure variability in the US adults. J Public Health (Oxf). 2015;37(4):694–700. | ||
Bertinieri G, Di Rienzo M, Cavallazzi A, Ferrari AU, Pedotti A, Mancia G. Evaluation of baroreceptor reflex by blood pressure monitoring in unanesthetized cats. Am J Physiol. 1988;254(2 Pt 2):H377–H383. | ||
Sanya EO, Tutaj M, Brown CM, Goel N, Neundorfer B, Hilz MJ. Abnormal heart rate and blood pressure responses to baroreflex stimulation in multiple sclerosis patients. Clin Auton Res. 2005;15(3):213–218. | ||
Shimbo D, Shea S, McClelland RL, et al. Associations of aortic distensibility and arterial elasticity with long-term visit-to-visit blood pressure variability: the Multi-Ethnic Study of Atherosclerosis (MESA). Am J Hypertens. 2013;26(7):896–902. | ||
Mancia G, Facchetti R, Parati G, Zanchetti A. Visit-to-visit blood pressure variability, carotid atherosclerosis, and cardiovascular events in the European Lacidipine Study on Atherosclerosis. Circulation. 2012;126(5):569–578. | ||
Brickman AM, Reitz C, Luchsinger JA, et al. Long-term blood pressure fluctuation and cerebrovascular disease in an elderly cohort. Arch Neurol. 2010;67(5):564–569. | ||
Mancia G. Short- and long-term blood pressure variability: present and future. Hypertension. 2012;60(2):512–517. | ||
Nagai M, Kario K. Visit-to-visit blood pressure variability, silent cerebral injury, and risk of stroke. Am J Hypertens. 2013;26(12):1369–1376. | ||
Cooper-DeHoff RM, Gong Y, Handberg EM, et al. Tight blood pressure control and cardiovascular outcomes among hypertensive patients with diabetes and coronary artery disease. JAMA. 2010;304(1):61–68. |
 © 2016 The Author(s). This work is published and licensed by Dove Medical Press Limited. The full terms of this license are available at https://www.dovepress.com/terms.php and incorporate the Creative Commons Attribution - Non Commercial (unported, v3.0) License.
By accessing the work you hereby accept the Terms. Non-commercial uses of the work are permitted without any further permission from Dove Medical Press Limited, provided the work is properly attributed. For permission for commercial use of this work, please see paragraphs 4.2 and 5 of our Terms.
© 2016 The Author(s). This work is published and licensed by Dove Medical Press Limited. The full terms of this license are available at https://www.dovepress.com/terms.php and incorporate the Creative Commons Attribution - Non Commercial (unported, v3.0) License.
By accessing the work you hereby accept the Terms. Non-commercial uses of the work are permitted without any further permission from Dove Medical Press Limited, provided the work is properly attributed. For permission for commercial use of this work, please see paragraphs 4.2 and 5 of our Terms.