")
Back to Journals » Pharmacogenomics and Personalized Medicine » Volume 13
Impact of APOE Alleles-by-Diet Interactions on Glycemic and Lipid Features– A Cross-Sectional Study of a Cohort of Type 2 Diabetes Patients from Western Mexico: Implications for Personalized Medicine
Authors Torres-Valadez R , Ramos-Lopez O , Frías Delgadillo KJ, Flores-García A , Rojas Carrillo E, Aguiar-García P , Bernal Pérez JA, Martinez-Lopez E , Martínez JA, Zepeda-Carrillo EA
Received 31 August 2020
Accepted for publication 23 October 2020
Published 26 November 2020 Volume 2020:13 Pages 655—663
DOI https://doi.org/10.2147/PGPM.S277952
Checked for plagiarism Yes
Review by Single anonymous peer review
Peer reviewer comments 4
Editor who approved publication: Dr Martin H Bluth
Rafael Torres-Valadez,1,2,* Omar Ramos-Lopez,3,* Kevin J Frías Delgadillo,1 Aurelio Flores-García,1 Esaú Rojas Carrillo,4 Pedro Aguiar-García,1 J Antonio Bernal Pérez,4 Erika Martinez-Lopez,5 J Alfredo Martínez,6,7 Eloy A Zepeda-Carrillo1,8
1Specialized Unit in Research, Development and Innovation in Genomic Medicine, Nayarit Center for Innovation and Technology Transfer, Autonomous University of Nayarit, Tepic, Nayarit, Mexico; 2Integral Health Academic Unit, Autonomous University of Nayarit, Tepic, Nayarit, Mexico; 3Faculty of Medicine and Psychology, Autonomous University of Baja California, Tijuana, Baja California, Mexico; 4Family Medicine Unit No. 24 “Ignacio García Tellez”, Mexican Social Security Institute, Tepic, Nayarit, Mexico; 5Institute of Translational Nutrigenetics and Nutrigenomics, Department of Molecular and Genomic Biology, University Center of Health Sciences, University of Guadalajara, Guadalajara, Jalisco, Mexico; 6Precision Nutrition and Cardiometabolic Health, IMDEA-Food Institute (Madrid Institute for Advanced Studies), Madrid, Spain; 7CIBERobn, Fisiopatología De La Obesidad y La Nutrición, Carlos III Health Institute, Madrid, Spain; 8Tepic Civil Hospital “Dr. Antonio González Guevara”, Health Services in Nayarit, Tepic, Nayarit, Mexico
*These authors contributed equally to this work
Correspondence: Eloy A Zepeda-Carrillo
Nayarit Center for Innovation and Technology Transfer, Autonomous University of Nayarit, Calle Tres S/N, Ciudad Industrial, Tepic, Nayarit 63117, México
Tel +52-3112487861
Email [email protected]
Purpose: To analyze clinically relevant interactions between the apolipoprotein E (APOE) ϵ2, ϵ3 and ϵ4 alleles and nutritional factors on glycemic control and lipid levels in a cohort of type 2 diabetes (T2D) patients from western Mexico.
Patients and Methods: In this cross-sectional study of the cohort of T2D patients, a total of 224 individuals were selected for interaction studies. Clinical and anthropometric data were obtained from pre-designed medical records. Dietary intake was assessed by validated three-day food consumption records. Biochemical measurements were determined by automated methods. APOE genotyping was performed by a real-time allelic discrimination assay. Gene–diet interactions were tested by corrected multiple linear regression analyses, which were adjusted by potential confounding factors such as age, sex, energy intake, BMI and anti-hyperglycemic therapy (Metformin, Glibenclamide or Insulin), and years with T2D.
Results: Seventy-six percent of patients with T2D were on Metformin therapy. The frequencies of the APOE alleles were ϵ2 (5.8%), ϵ3 (74.1%) and ϵ4 (20.1%). After statistical settings, significant APOE alleles-by-diet interactions in relation to the metabolic profile were found. Interestingly, higher blood levels of total cholesterol (p int. = 0.016), non-HDL-c (p int. = 0.024), and LDL-c (p int. = 0.030) were found only in carriers of the APOE ϵ2 allele with a low consumption of MUFA. In contrast, carriers of the APOE ϵ4 allele with a high ω-6:ω-3 PUFA ratio in the diet had higher %HbA1c blood concentrations (p int. = 0.035).
Conclusion: This study suggests a differential metabolic impact of APOE alleles on lipid/glycemic phenotypes depending on the dietary intake, with important potential implications in the personalized medicine and nutritional management of patients with type 2 diabetes mellitus.
Keywords: type 2 diabetes, APOE alleles, glycemic control, ω-6:ω-3 PUFA ratio, personalized medicine, gene–nutrient interactions
Introduction
Type 2 diabetes (T2D) has been considered one of the four globally important non-communicable diseases.1 T2D prevalence is increasing significantly in middle-income countries, such as Mexico, which is in sixth place worldwide with a T2D prevalence of 10.3%.2 T2D control and accompanying complications are a challenge for health systems around the world to stop the increase in mortality from this disease.1
The interaction of genetic, environmental and behavioral factors can explain the development of T2D and associated manifestations.3 Among environmental agents, dietary intake has been extensively explored to establish treatment strategies for the personalized control of metabolic disorders (hyperglycemia and hyperlipidemia) that characterizes patients with T2D.4 In Mexico, in recent decades, the intake of processed foods with a high glycemic index (sugary drinks) and saturated fats has considerably increased in the general population and particularly in patients with T2D, which impacts the development of the disease, as well as in the metabolic control of these patients.5,6
Nutrition is considered a cornerstone for glycemic and lipid control,4 which is a therapeutic goal of paramount importance to avoid relevant complications of T2D, such as cardiovascular disease (CVD) since it is a cause of the high prevalence of mortality in these patients.7 However, these strategies have not been completely effective despite the efforts made. The influence of nutritional factors on glycemic and lipid control in T2D patients is influenced by genetic factors.8 In this context, some studies in populations with and without T2D have found association of APOE genotypes with serum levels of fatty acids, omega-6 (ω-6), omega-3 (ω-3), total cholesterol (TC), low-density lipoprotein cholesterol (LDL-c) and triglycerides (TG), but the results have not been replicated in other studies.9–11
The APOE gene encodes for apolipoprotein E (ApoE), which is a glycoprotein that participates as a ligand of the cellular receptors of most lipoproteins in the main tissues involved in lipid metabolism, being considered a key regulator of plasma lipids.12 Two functional polymorphisms rs429358 (Cys112Arg) and rs7412 (Arg158Cys) have been fully described in the APOE gene, leading to three alleles (ε2, ε3 and ε4), translating the respective isoforms, ApoE2, ApoE3 and ApoE4, that have been associated with lipid levels on several populations.13 ApoE3 is commonly considered as the ancestral isoform with a normal affinity for cellular receptors, whereas ApoE2 and ApoE4 have opposite receptor binding capabilities. The ApoE4 isoform is associated with elevated TC levels due to its high receptor affinity and the rapid saturation of intracellular cholesterol that suppresses the expression of cellular receptors. Conversely, the ApoE2 isoform reduces binding to the cellular receptor, significantly decreasing intracellular lipid uptake.14
Based on the role of ApoE isoforms in lipid metabolism and the effect of lipids on insulin action, it is worth considering putative interactions with dietary intake, serum lipid levels and glycemic control markers in T2D patients. Therefore, changes in therapeutic strategies with a personalized medicine approach could have a positive impact on the clinical management of these patients. The aim of this study was the screening of clinically relevant interactions between the APOE ε2, ε3 and ε4 alleles and nutritional factors on glycemic control and lipid levels in a cohort of T2D patients from western Mexico.
Patients and Methods
Patients and Study Design
This cross-sectional study, which involved a total of 432 T2D patients from western Mexico, who were enrolled to build this cohort as described in supplementary text S1 (Figure S1). Diagnosis of T2D was according to the American Diabetes Association (ADA) criteria: fasting plasma glucose level of 126 mg/dL (7.0 mmol/L) or higher, a 2-h plasma glucose level of 200 mg/dL (11.1 mmol/L) or higher during a 75-g oral glucose tolerance test, or a random plasma glucose of 200 mg/dL.15 Relevant exclusion criteria were the presence of major surgeries, cancer, kidney, autoimmune and thyroid diseases, drug use in the last 6 months of recruitment, and pregnant women. At the time of recruitment, patients with T2D had no clinically evident complications. Many of the patients in this cohort attend T2D care and follow-up program where they receive drug treatment and nutritional counseling, which was taken into account in the analyses. Of the total cohort, 224 T2D patients were selected, according to the clinical, biochemical and genetic information available, to carry out gene-nutrient association and interaction studies (Figure S1). This study was performed between April and December 2019 and was conducted in accordance with the updated version of Helsinki Declaration-Ethical Principles for Medical Research Involving Human Subject on the “64th WMA General Assembly from, Fortaleza, Brazil, 2013”.16 Written informed consent was obtained from all participants in the study.
The project was approved by the Local Research and Ethics Committee in Health Research 1801, Family Medicine Unit No.24 “Ignacio García Téllez”. Mexican Social Security Institute. COFEPRIS registration number 17 CI 18017 144.
Anthropometric Measurements
Anthropometric measurements, demographics and clinical data were collected by medical personnel following standardized methods.17 Body mass index (BMI-kg/m2) was determined by body electrical bioimpedance (Tanita SC-331S, body composition analyzer, Tanita Corporation, Japan). Normal weight (18.5–24.9 kg/m2), overweight (25.0–29.9 kg/m2) and obesity (≥30 kg/m2) were defined according to World Health Organization (WHO) criteria.18 Waist circumference (WC) was measured at the midpoint between the top of the iliac crest and the lower rib using a stretch-resistant tape, as described elsewhere.19
Dietary Assessment
Habitual dietary intake was assessed by trained nutritionists using validated 3-day food records to self-register the amount and mode of preparation of all foods consumed during two weekdays and one weekend day, as detailed elsewhere.19 Food scales were used to show examples of real food portion sizes. Dietary data were coded in the Nutritionist Pro™ Diet Analysis software (Axxya Systems, Stafford, TX, USA) to obtain the averaged intakes of nutrients. Newer or specific regional Mexican dishes were calculated from validated Mexican food composition tables.20 Dietary reference values were based on the general recommendations for the Mexican population reported by the Official Mexican Norms NOM-037-SSA2-2012 and NOM-015-SSA2-2010 of the Health Secretary, as previously reported.21
Blood Tests
Blood samples (10 mL) were drawn after a 12-h fast and centrifuged for serum processing. Biochemical blood determinations of glucose, TC, TG, high-density lipoprotein cholesterol (HDL-c), alanine aminotransferase (ALT), and aspartate aminotransferase (AST) were performed on the Cobas 6000 analyzer (Roche Diagnostics International Ltd, Risch-Rotkreuz, Switzerland) using commercial kits provided by the company. The turbidimetric immunoassay inhibition method was used to measure the glycated hemoglobin (HbA1c). Concentrations of LDL-c were calculated according to the Friedewald formula,22 except when TG levels were higher than 400 mg/dL. The non-high-density lipoprotein cholesterol (non-HDL-c) was estimated as TC - HDL-c. The triglycerides-glucose index (TyG index) was calculated as a marker of insulin resistance, as described elsewhere.23
APOE Genotyping
The APOE genotypes were determined using 5´ allelic discrimination method.24 The reactions were performed using two TaqMan® SNP Genotyping Assays (Applied Biosystems, Foster, CA, USA): rs429358 (C/T) and rs7412 (C/T). Genotypes were performed by PCR Real Time in a LightCycler thermocycler instrument® 96 (Roche Diagnostics, Mannheim, Germany). The characteristics of context sequence of each of these probes correspond to the catalog number C___904973__10 for rs7412 and C___3084973__20 for rs429358 (ThermoFisher Scientific). The accuracy of the APOE genotyping was verified using positive and negative controls. As a quality control measure, 20% of the samples were replicated obtaining 100% reproducibility. Genetic analyses including the Hardy–Weinberg equilibrium (HWE) test and the Analysis of Molecular Variance (AMOVA) test were performed using the Convert 1.31 and the Arlequin 3.0 software.
Statistical Analyses
Parametric statistical tests were used after the assessment of the normality of the main study biochemical and nutritional variables by the Kolmogorov–Smirnov test. Continuous variables were expressed as means ± standard deviations (S.D.), and categorical variables were reported as frequencies and percentages. For comparison purposes, the APOE genotypes were grouped according to the following alleles: APOE ε2 (ε2ε2, ε2ε3, and ε2ε4); APOE ε3 (ε3ε3); and APOE ε4 (ε3ε4 plus ε4ε4). Statistical differences in continuous and categorical variables between the APOE alleles were evaluated by one-way ANOVA tests (with the respective post-hoc analyses) and chi-square tests, respectively. Multiple linear regression tests were used to the screening for relevant gene–diet interactions, with age, sex, BMI, energy intake, drinking, smoking, anti-hyperglycemic therapies (Metformin, Glibenclamide or Insulin) and years with T2D as covariates. All the tests with significant p-value were corrected by Bonferroni method. Statistical analyses were performed in the statistical program Stata 12 (StataCorp LLC, College Station, TX, USA; www.stata.com) and IBM SPSS Statistics version 21.0 for Windows (IBM Corp, Inc., Chicago, IL, United States). Statistical significance was set at p < 0.05 to two-tailed.
Results
The clinical, biochemical, pharmacological and APOE genotypes characteristics of T2D study cohort are reported in supplementary information (Tables S1, S2 and S3). The frequencies of the APOE genotypes in the T2D patients included in the association and interaction analyzes (n = 224) were ɛ2ɛ2 (0.4%), ɛ2ɛ3 (4.0%), ɛ2ɛ4 (1.3%), ɛ3ɛ3 (74.2%), ɛ3ɛ4 (18.3%), ɛ4ɛ4 (1.8%), whose distributions across the population were concordant with the HWE (p = 0.560). The frequencies of the APOE alleles were ε2 (5.8%), ε3 (74.1%) and ε4 (20.1%). The AMOVA analyses also revealed a genetic homogeneity regarding this genetic variant (p = 0.631).
The characteristics of the T2D patients selected by association and interaction analyzes, concerning demographic, anthropometric, and clinical variables by APOE alleles are reported (Table 1). Approximately 82% of T2D patients had overweight or obesity according to BMI categories. Means of age, general and central adiposity markers as well as the time of disease evolution were not statistically different between APOE alleles. Similar proportions of men and women were also found between allelic groups (Table 1).
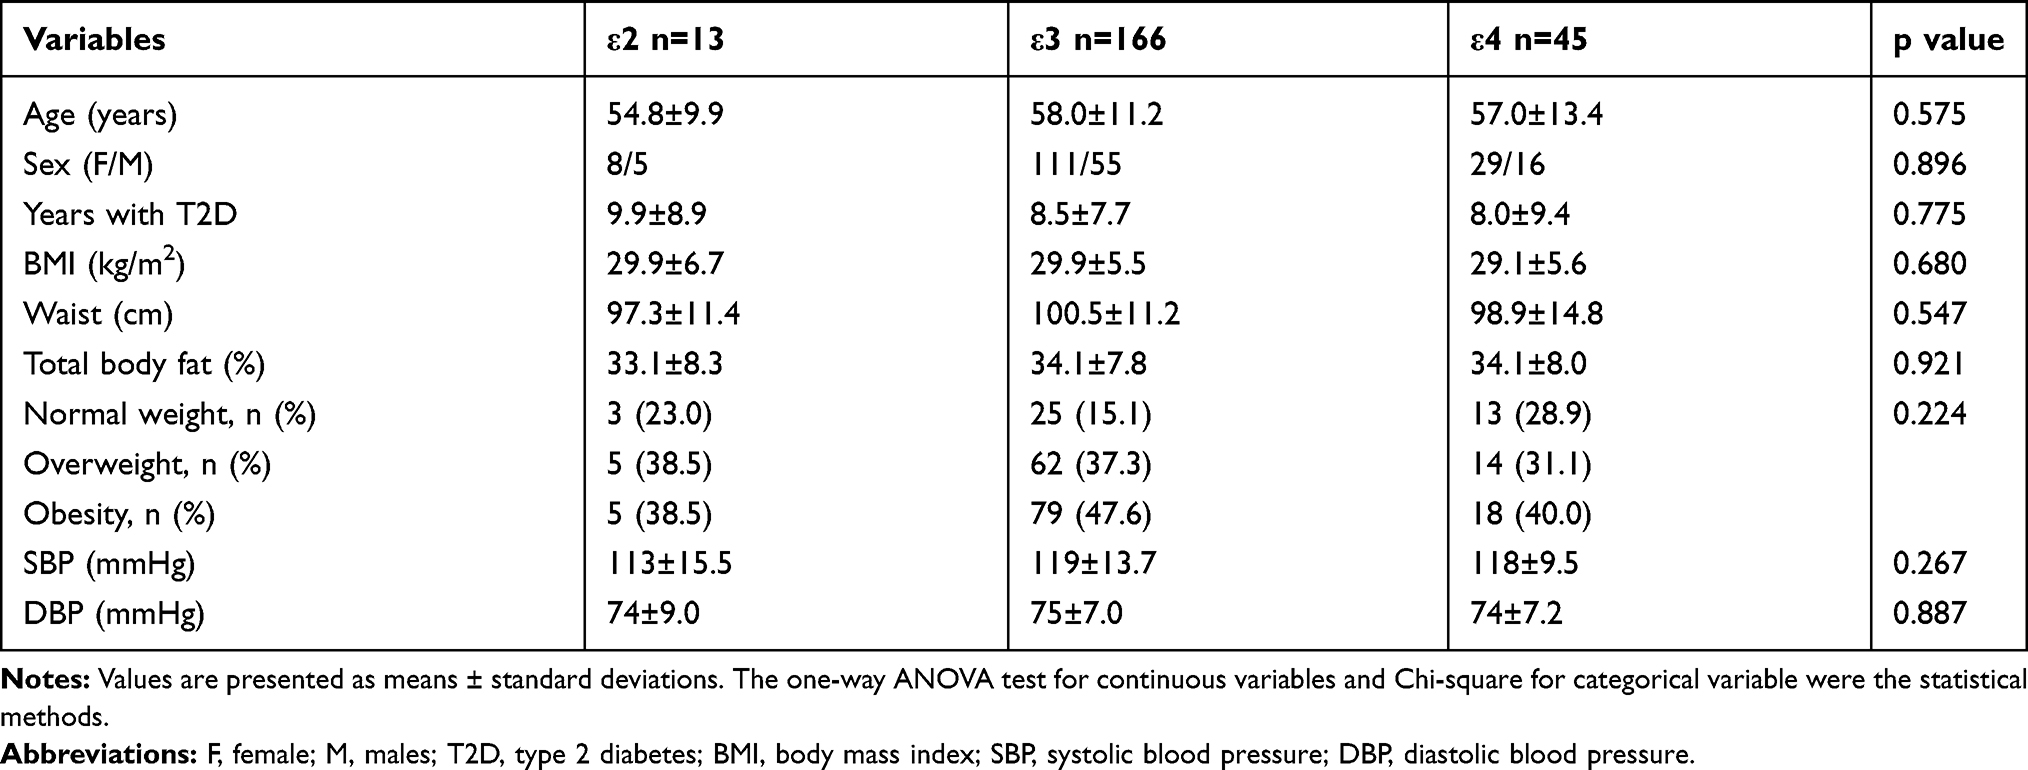 |
Table 1 Characteristics of the T2D Patients According to APOE Alleles |
The daily dietary intakes of total caloric consumption and macronutrients by APOE alleles are shown (Table 2). Regardless of the APOE genetic profile, all patients consumed higher amounts of protein, total fat, saturated fatty acids (SFA), dietary cholesterol as well as a higher ω-6:ω-3 PUFA ratio regarding the recommendations for the general population (Table 2). Conversely, deficient intakes of fiber, polyunsaturated fatty acids (PUFA) and most antioxidants (vitamin C, zinc, and magnesium) were found (Table 2). Carriers of the APOE ε3 allele had a higher calorie consumption than ε4 allele carriers (p = 0.015). On the contrary, no differences in the averaged intakes of carbohydrates, protein, total and type of fats (SFA, monounsaturated fatty acids [MUFA] and PUFA, including the ω-6:ω-3 PUFA ratio), cholesterol and fiber by APOE alleles were detected.
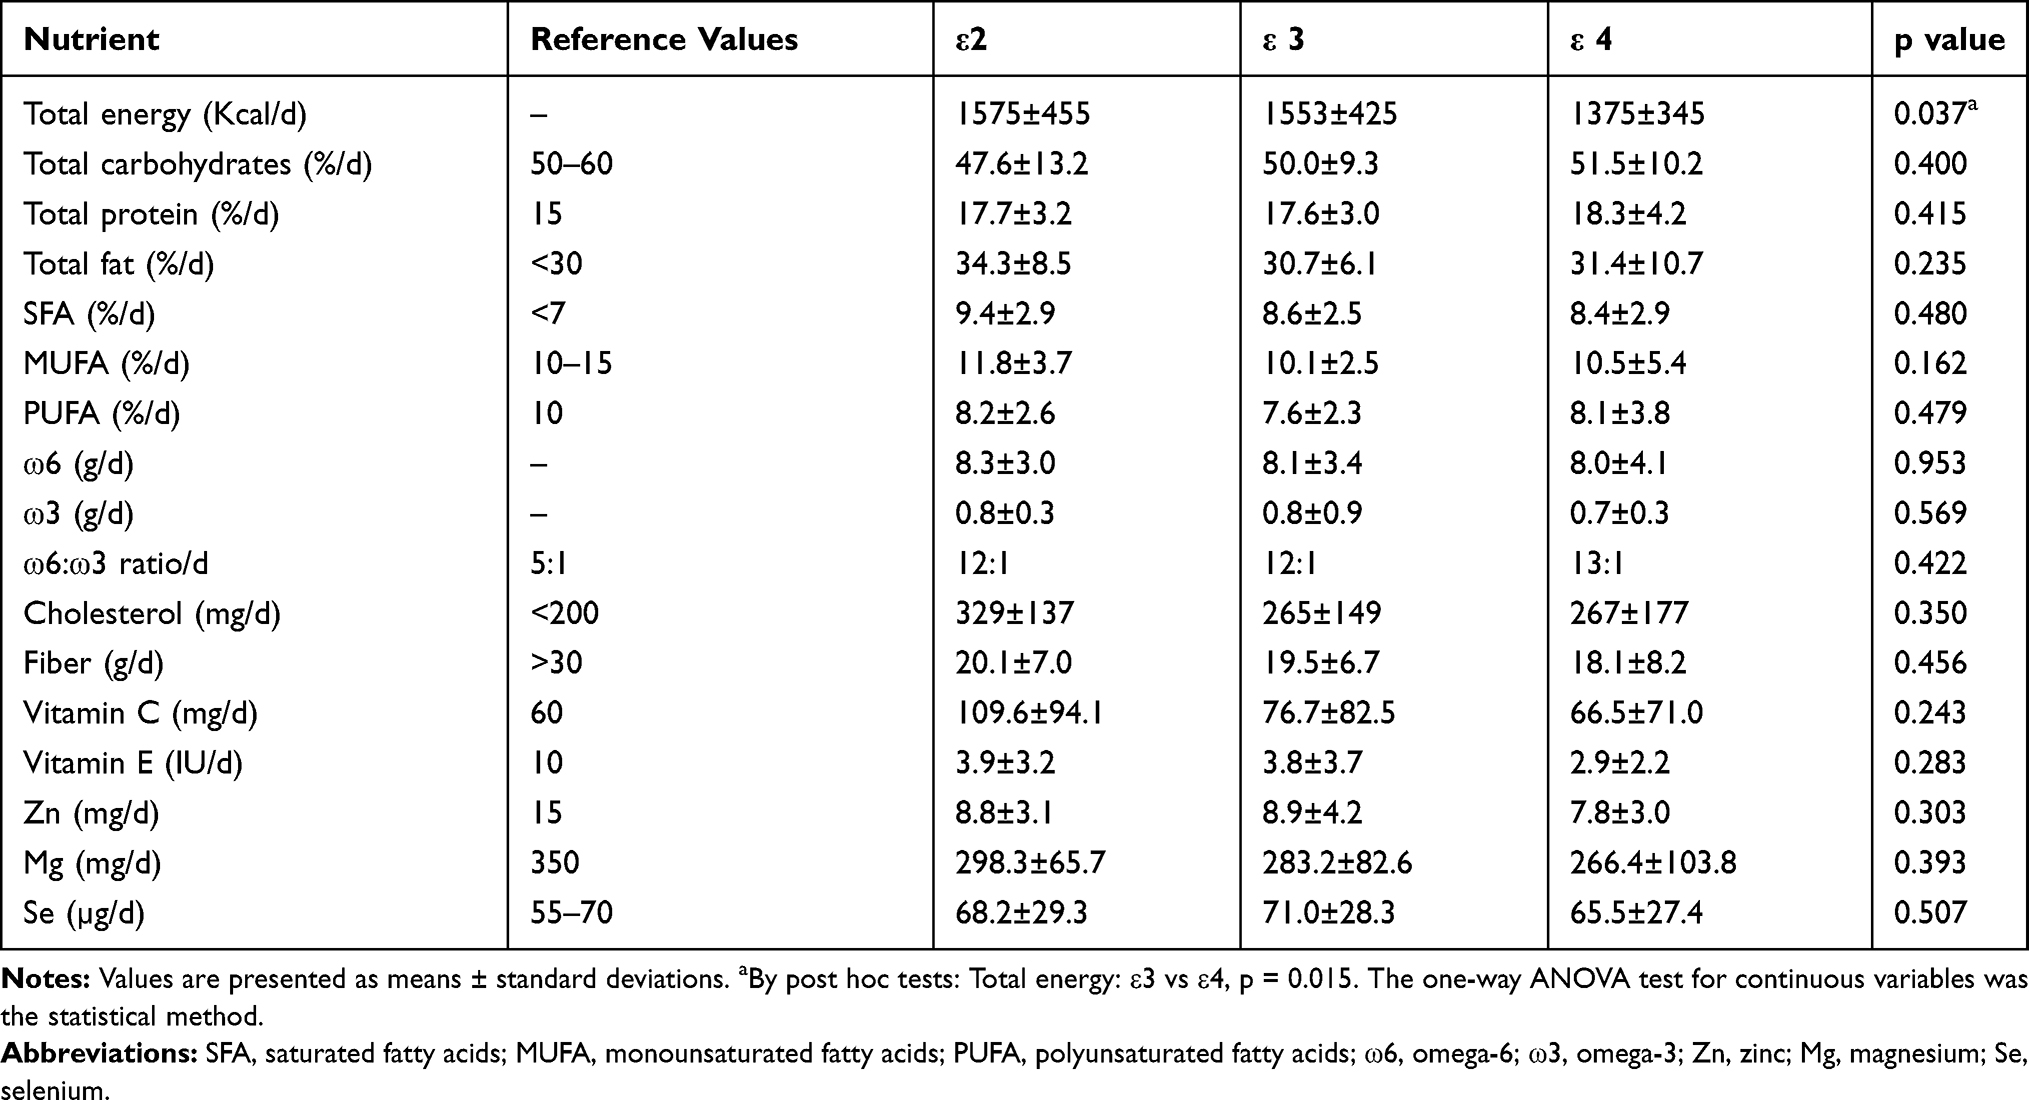 |
Table 2 Nutrient Intakes According to APOE Alleles |
The metabolic features of the T2D patients as categorized by APOE alleles are reported (Table 3). Regarding the established general recommendations, increased blood lipids (non-HDL-c, LDL-c, and TG) were found in all patients, except in APOE ε2 allele carriers. As expected, glucose concentration, %HbA1c and TyG index were above the reference cutoffs (Table 3). Moreover, glucose concentration and %HbA1c were higher in APOE ε3 allele carriers than the other allelic subgroups. There were no direct relationships between APOE alleles and the lipid and hepatic profile, except a statistical tendency for lower serum levels of LDL-c among APOE ε2 allele carriers (Table 3).
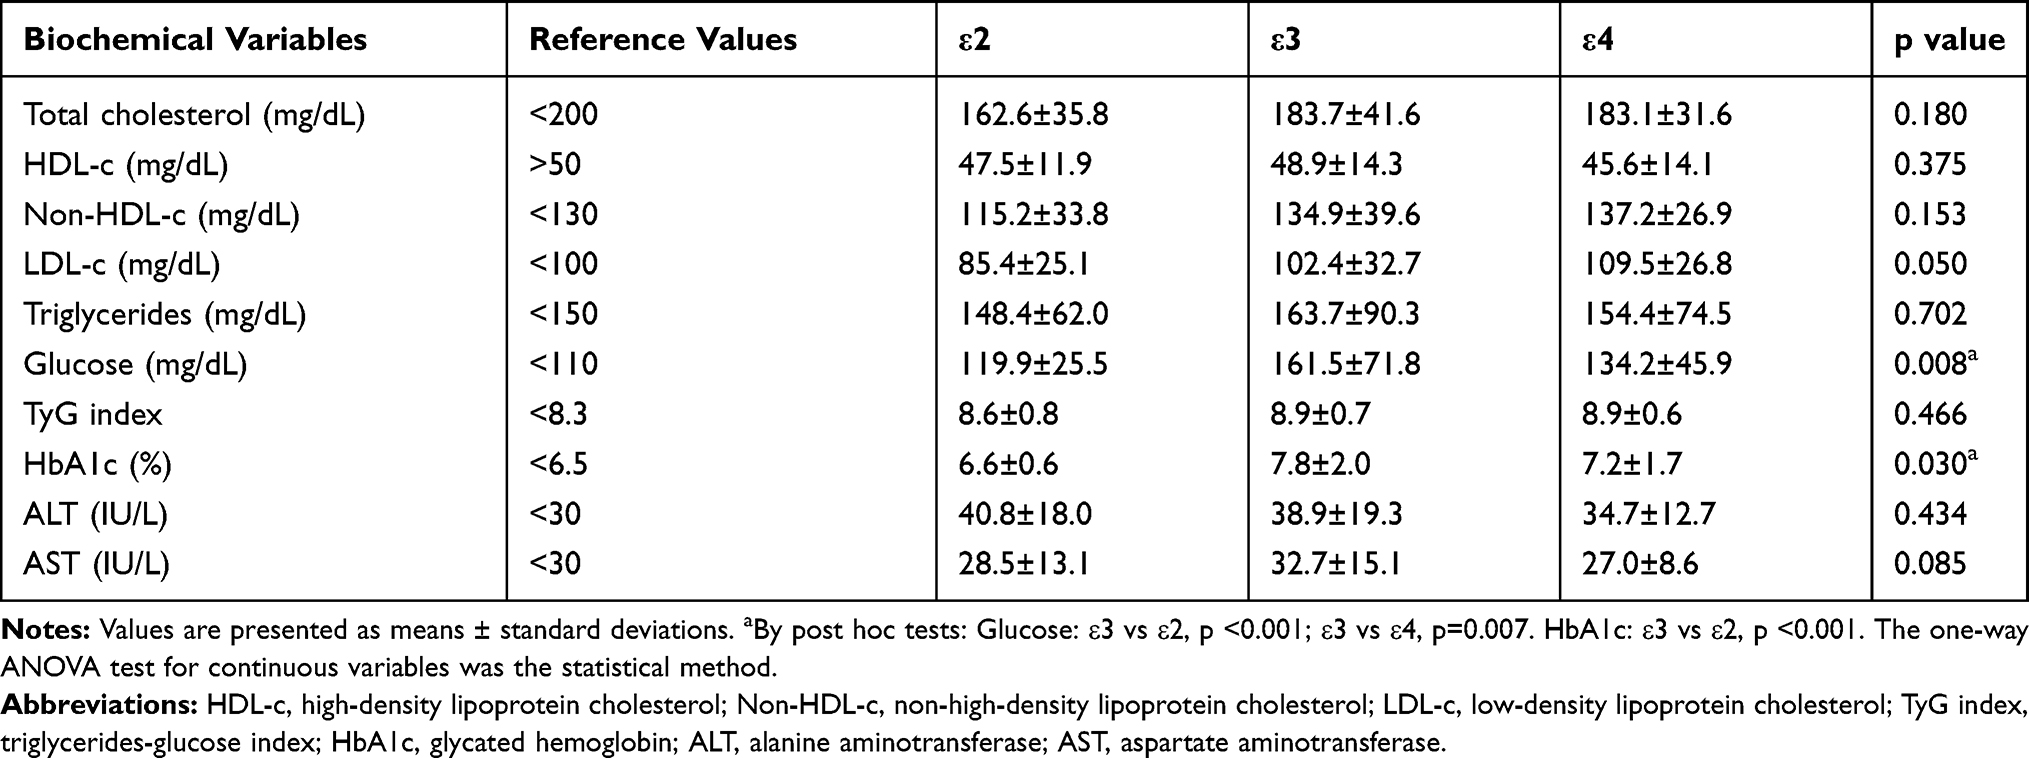 |
Table 3 Biochemical Profile According to APOE Alleles |
Relevant APOE alleles-by-diet interactions in relation to the metabolic phenotypes of the T2D patients are plotted (Figure 1). Of note, higher serum concentrations of TC (P int. = 0.016), non-HDL-c (P int. = 0.024), and LDL-c (P int. = 0.030) were found only in APOE ε2 allele carriers with a concomitant low consumption of MUFA. Instead, carriers of the APOE ε4 allele with a combined high dietary ω-6:ω-3 PUFA ratio underwent a worse glycemic control as measured by %HbA1c (P int. = 0.035), which was not observed for the other genetic groups (Figure 1). No relevant gene–diet interactions regarding body composition and other metabolic parameters were found.
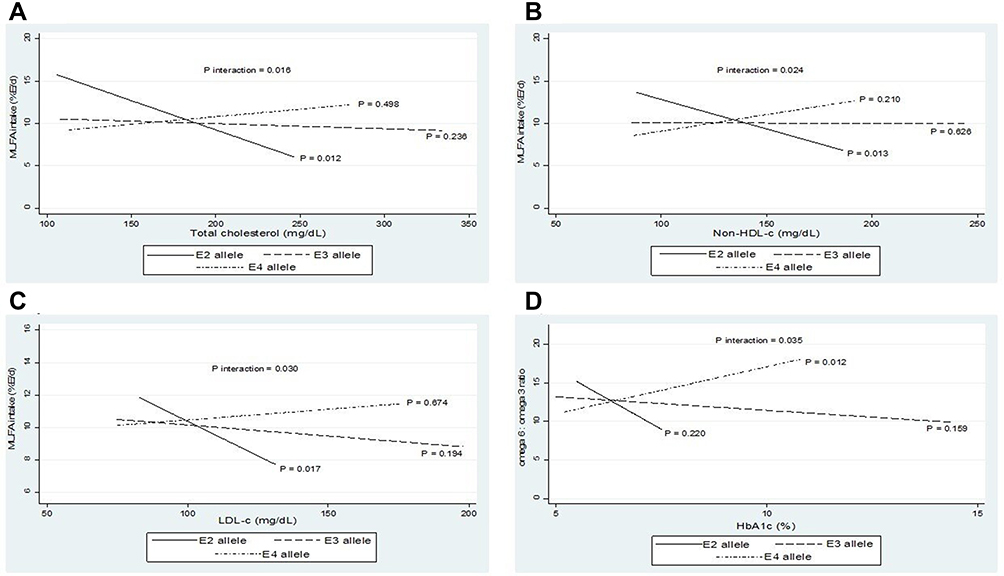 |
Figure 1 Impact of APOE alleles-by-diet interactions on lipid and glycemic phenotypes. (A) APOE-MUFA intake interaction regarding Total cholesterol. (B) APOE-MUFA intake interaction in relation to Non-HDL-c. (C) APOE-MUFA intake interaction concerning LDL-c. (D) APOE ω6:ω3 ratio interaction regarding HbA1c. Interactions were adjusted by age, sex, BMI, energy intake, drinking, smoking, anti-hyperglycemic therapies (Metformin, Glibenclamide or Insulin) and years with T2D as covariates. MUFA: monounsaturated fatty acids. |
Discussion
The interplay between lipids and carbohydrates can modulate the glycemic control in T2D patients.25 In this study, the frequencies found on APOE alleles ε2 (5.8%), ε3 (74.1%), ε4 (20.1%) in T2D patients are similar to those reported for the general Mexican population.26 Globally, APOE ε3 allele is the most common with a range of 35% to 97%.27,28 The range of APOE ε4 allele worldwide is 5% to 40%, where the highest frequencies are found in indigenous populations such as Pygmies, Tutsi (Central Africa), Hui, Mowanjum (Oceania), and Huicholes “Wirrarikas” in Nayarit, Mexico (North America). The frequency of the APOE ε2 allele has been reported with a global range of 0% to 15%, with the highest frequencies in sub-Saharans (Africa), Malaysian (Asia) and Papuans populations (Oceania).27–29 Several genetic studies have reported that the mestizo population from Mexico has a genetic component of three main ancestral lineages that are African, European and Amerindian.26,30 These data may explain the frequencies and the HWE found of APOE alleles in this cohort of T2D patients from western Mexico, where there is important European (Spanish) and Amerindian genetic influences.31
Dietary habits are one of the relevant factors involved, not only in the rapidly rising incidence of T2D among developing countries but also in the developing microvascular and macrovascular complications mainly CVD.32 In this study, a high consumption of fat and cholesterol as well as deficient intakes of fiber, antioxidants and essential PUFA were found regardless of the APOE alleles. Epidemiological studies have shown that this Westernized dietary pattern may contribute to the progression of T2D, with a negative impact on glycemic and lipid control.32–34
In this research, APOE alleles-by-diet interactions influencing lipid and glycemic phenotypes in T2D were found. These findings have an important clinical implication in the integral management of T2D patients by targeting specific dietary changes that contribute to improving glycemic and lipid control. Interestingly, a worse blood lipid profile, TC, Non-HDL-c and LDL-c, was found in carriers of the APOE ε2 allele consuming low amounts of MUFA. The ApoE2 isoform is widely known to decrease the hepatic clearance of very-low-density lipoprotein cholesterol (VLDL-c) due to low-affinity for the receptor.35 By combining this slow clearance with a low consumption of MUFA of the T2D patient, it favors a greater blood availability of cholesterol, significantly increasing serum concentrations of LDL-c oxidized and the risk of presenting global cardiometabolic disease (GCMD).36 Instead, carriers of the APOE ε4 allele showing a high dietary ω-6:ω-3 PUFA ratio had higher %HbA1c. This higher ω-6:ω-3 PUFA ratio could contribute to the understanding of the insulin resistance syndrome in carriers of APOE ε4 allele described in other studies,13 which explain the high of %HbA1c observed in the patients of this study. These findings highlight the effects of diet on the metabolism of T2D patients, where the APOE alleles ε2 and ε4 principally, played a differential role depending on the nutritional context and the effect of the affinity of cell receptors involved in lipoprotein metabolism such as LDLR on carriers of the ε2 allele decreased respect of the ε4 allele carriers increased. This could explain to some extent the blood levels of TC, Non-HDL-c and LDL-c that show these patients with T2D studied.
Consistent with our results, gene–diet interactions (including APOE gene) were found to be potentially attributable to quantile-specific heritability of TG concentrations in a cohort from The Framingham Study.37 Also, a differential responsiveness of fasting TG to MUFA intake was found, with an increase and decrease in TG concentrations in APOE ε3 and APOE ε4 carriers, respectively.38 However, no statistically significant interactions were observed between APOE alleles and SFA intake concerning TC and LDL-c levels in a Lithuanian adult population.39 Additionally, no relevant interactions between APOE SNPs/haplotypes and dietary factors with plasma lipids were found after correction for multiple testing in two different cohorts.40 Factors such as ethnic differences between populations, study design, mode of inheritance and food culture could help to explain this variability. The alleles ε2, ε3 and ε4 of the APOE gene are relatively frequent in several regions. For this reason, identifying its interactions with one of the main environmental risk factors, such as diet, and in one of the pathologies with the highest prevalence in the world, allows us to have a closer approach towards personalized medicine in T2D.
For almost three decades, achieving an adequate metabolic balance in T2D patients represented by optimal %HbA1c and serum lipid levels has become a real challenge in the clinical management of this disease.41 It is estimated that in developing countries, such as Mexico, less than 20% of T2D patients maintain adequate glycemic control, and more than 50% have some type of dyslipidemia characterized mainly by small and dense LDL-c.42 These data reinforce international estimates that more than 80% of T2D patients will die of CVD, and these patients have 3 or 4 times more risk of suffering GCMD.43 Therefore, the genetic component as an important determinant in the integral management of T2D and as a risk factor for CVD and GCMD in these patients is undeniable. Our results indicate interactions between the APOE alleles and the dietary fatty acids with worse lipidic and glycemic control in this type of patient. In this order of ideas, the implementation of personalized diets based on the genome could considerably reduce the presence of comorbidities that are killing T2D patients.44,45
The strengths of this study include the identification of relevant interactions between APOE genetic variants and diet in the lipidic/glycemic phenotypes of the T2D patients through robust statistical analyses using potential confounders as covariates such as anti-hyperglycemic therapy, BMI, energy intake, sex, age, drinking and smoking principally. Furthermore, AMOVA analysis did not reveal a significant influence of genetic ancestry on our results. Therefore, although the main interactions were observed in carriers of the APOE 2 allele which is the lower frequency, it does not minimize direct implication in the behavior of this disease, since the lipid factor is not constantly considered in glycemic control in the T2D patient.
On the other hand, the cross-sectional design of this study limits the extrapolation of the results obtained. Moreover, although interaction studies are very reliable in small sample sizes, type I and type II statistical errors cannot be completely ruled out. Therefore, it is necessary to complement this study in the future with longitudinal prospective investigations that consider a greater number of patients, the role of other genetic variants and lifestyle factors (physical activity, sleep patterns, behavior) that at this time it was not possible to carry out. Finally, although three-day food records provide sufficient and detailed information on dietary intake and are a well-validated instrument, the bias present in self-report assessments of food consumption should be taken into account.46
Conclusion
The present study suggests a differential effect of APOE alleles on lipid/glycemic phenotypes depending on dietary intake in T2D patients. This information could have important implications in the personalized medicine and nutritional management of patients with type 2 diabetes within the new era of precision medicine.
Acknowledgments
The authors express their gratitude to the participants for the construction of this cohort study and their enthusiastic support, and the staff of Family Medicine Unit No. 24 of Mexican Institute of Social Security for their valuable help. They acknowledge the students of the degree in Nutrition Luis Roberto Mejia Godoy and Ivette Xitlalli Eleuterio Salvador for their support in obtaining the nutritional data of all the patients in this study.
To the Interinstitutional Program for the Strengthening of Research and Graduate Studies of the Pacific (Dolphin Program) for promoting the collegiate work that led to the creation of the Dolphin Research Networks whiting the mobility subprogram of professors and researchers.
The support from CIBEROBN is gratefully acknowledged.
Funding
This work was supported The National Council for Science and Technology (CONACyT), México (grant number: INFR-2016-01-268517) and Secretary of Public Education (SEP), México (grant number: P/PFCE-2018-18MSU0019M-04). Both sources did not participate in the collection, analysis and interpretation of data; neither in the writing and/or in the decision to submit this article.
Disclosure
The authors declare that they have no known competing financial or non-financial interests or personal relationships that could have appeared to influence the work reported in this research.
References
1. World Health Organization (WHO). Global Report on Diabetes. Diabetes and the Global Public Agenda. 2016. http://www.who.int/publications-detail/global-report-on-diabetes.
2. World Health Organization (WHO). Profile of the countries for to diabetes; 2016. http://www.who.int/diabetes/country-profiles/mex_es.pdf?ua=1.
3. Morales J, Glantz N, Larez A, et al. Understanding the impact of five major determinants of health (genetics, biology, behavior, psychology, society/environment) on type 2 diabetes in U.S. Hispanic/Latino families: mil Familias - a cohort study. BMC Endocr Disord. 2020;20(1):4. doi:10.1186/s12902-019-0483-z
4. Parry SA, Hodson L. Managing NAFLD in Type 2 Diabetes: the Effect of Lifestyle Interventions, a Narrative Review. Adv Ther. 2020;37(4):1381–1406. doi:10.1007/s12325-020-01281-6
5. Rivera-Iñiguez I, Panduro A, Ramos-Lopez O, Villaseñor-Bayardo SJ, Roman S. DRD2/ANKK1 TaqI A1 polymorphism associates with overconsumption of unhealthy foods and biochemical abnormalities in a Mexican population. Eat Weight Disord. 2019;24(5):835–844. doi:10.1007/s40519-018-0596-9
6. Ramos-Lopez O, Mejia-Godoy R, Frías-Delgadillo KJ, et al. Interactions between DRD2/ANKK1 TaqIA Polymorphism and Dietary Factors Influence Plasma Triglyceride Concentrations in Diabetic Patients from Western Mexico: A Cross-sectional Study. Nutrients. 2019;11(12):2863. doi:10.3390/nu11122863
7. Henning RJ. Type-2 diabetes mellitus and cardiovascular disease. Future Cardiol. 2018;14(6):491–509. doi:10.2217/fca-2018-0045
8. Ley SH, Hamdy O, Mohan V, Hu FB. Prevention and management of type 2 diabetes: dietary components and nutritional strategies. Lancet. 2014;383(9933):1999–2007. doi:10.1016/S0140-6736(14)60613-9
9. Liang S, Steffen LM, Steffen BT, et al. APOE genotype modifies the association between plasma omega-3 fatty acids and plasma lipids in the Multi-Ethnic Study of Atherosclerosis (MESA). Atherosclerosis. 2013;228(1):181–187. doi:10.1016/j.atherosclerosis.2013.02.004
10. Castellanos-Tapia L, López-Alvarenga JC, Ebbesson SOE, et al. “Apolipoprotein E isoforms 3/3 and 3/4 differentially interact with circulating stearic, palmitic, and oleic fatty acids and lipid levels in Alaskan Natives.”. Nutrition Res. 2015;35(4):294–300. doi:10.1016/j.nutres.2015.02.002
11. Weber KS, Knebel B, Strassburger K, et al. “Associations between explorative dietary patterns and serum lipid levels and their interactions with ApoA5 and ApoE haplotype in patients with recently diagnosed type 2 diabetes.”. Cardiovasc Diabetol. 2016;15(1):138. doi:10.1186/s12933-016-0455-9
12. Karjalainen JP, Mononen N, Hutri-Kähönen N, et al. The effect of apolipoprotein E polymorphism on serum metabolome - a population-based 10-year follow-up study. Sci Rep. 2019;9(1):458. doi:10.1038/s41598-018-36450-9
13. Fallaize R, Carvalho-Wells AL, Tierney AC, et al. APOE genotype influences insulin resistance, apolipoprotein CII and CIII according to plasma fatty acid profile in the Metabolic Syndrome. Sci Rep. 2017;7(1):6274. doi:10.1038/s41598-017-05802-2
14. Phillips MC. “Apolipoprotein E isoforms and lipoprotein metabolism.”. IUBMB Life. 2014;66(9):616–623. doi:10.1002/iub.1314
15. American Diabetes Association. Diagnosis and classification of diabetes mellitus. Diabetes Care. 2010;33(Suppl 1):S62–S69. doi:10.2337/dc10-S062
16. World Medical Association. World Medical Association Declaration of Helsinki: ethical principles for medical research involving human subjects. JAMA. 2013;310(20):2191–2194. doi:10.1001/jama.2013.281053
17. Torres-Castillo N, Campos-Perez W, Gonzalez-Becerra K, et al. Waist Circumference Is an Anthropometric Parameter That Identifies Women with Metabolically Unhealthy Phenotypes. Nutrients. 2018;10(4):447. doi:10.3390/nu10040447
18. Obesity: preventing and managing the global epidemic. Report of a WHO consultation. World Health Organ Tech Rep Ser. 2000;894:i–253.
19. Ramos-Lopez O, Panduro A, Rivera-Iñiguez I, Dopamine RS. D2 receptor polymorphism (C957T) is associated with sugar consumption and triglyceride levels in West Mexicans. Physiol Behav. 2018;194:532–537. doi:10.1016/j.physbeh.2018.07.004
20. Pérez LA (2014) SMAE, Sistema Mexicano de Alimentos Equivalentes. 4a ed. México: Fomento de Nutrición y Salud, A.C./Ogali.
21. Campos-Pérez W, González-Becerra K, Ramos-López O, et al. Same Dietary but Different Physical Activity Pattern in Normal-weight and Overweight Mexican Subjects. J Food Nutrition Res. 2016;4:729–735.
22. Friedewald WT, Levy RI, Fredrickson DS. Estimation of the concentration of low-density lipoprotein cholesterol in plasma, without use of the preparative ultracentrifuge. Clin Chem. 1972;18(6):499–502.
23. Navarro-González D, Sánchez-Íñigo L, Pastrana-Delgado J, Fernández-Montero A, Martinez JA. Triglyceride–glucose index (TyG index) in comparison with fasting plasma glucose improved diabetes prediction in patients with normal fasting glucose: the Vascular-Metabolic CUN cohort. Prev Med. 2016;86:99–105. doi:10.1016/j.ypmed.2016.01.022
24. Koch W, Ehrenhaft A, Griesser K, et al. TaqMan systems for genotyping of disease-related polymorphisms present in the gene encoding apolipoprotein E. Clin Chem Lab Med. 2002;40(11):1123–1131. doi:10.1515/CCLM.2002.197
25. Tay J, Luscombe-Marsh ND, Thompson CH, et al. Comparison of low- and high-carbohydrate diets for type 2 diabetes management: a randomized trial. Am J Clin Nutr. 2015;102(4):780–790. doi:10.3945/ajcn.115.112581
26. González HM, Tarraf W, Jian X, et al. Apolipoprotein E genotypes among diverse middle-aged and older Latinos: study of Latinos-Investigation of Neurocognitive Aging results (HCHS/SOL). Sci Rep. 2018;8(1):17578. doi:10.1038/s41598-018-35573-3
27. Egert S, Rimbach G, Huebbe P. ApoE genotype: from geographic distribution to function and responsiveness to dietary factors. Proc Nutr Soc. 2012;71(3):410–424. doi:10.1017/S0029665112000249
28. Abondio P, Sazzini M, Garagnani P, et al. The Genetic Variability of APOE in Different Human Populations and Its Implications for Longevity. Genes. 2019;10(3):222. doi:10.3390/genes10030222
29. Aceves D, Ruiz B, Nuño P, Roman S, Zepeda E, Panduro A. Heterogeneity of apolipoprotein E polymorphism in different Mexican populations. Human Biology. 2006;78(1):65–75. doi:10.1353/hub.2006.0021
30. Galanter JM, Fernandez-Lopez JC, Gignoux CR, et al. Development of a panel of genome-wide ancestry informative markers to study admixture throughout the Americas. PLoS Genet. 2012;8(3):e1002554. doi:10.1371/journal.pgen.1002554
31. Rubi‐Castellanos R, Martínez‐Cortés G, Francisco Muñoz‐Valle JF, et al. Pre-Hispanic Mesoamerican demography approximates the present-day ancestry of Mestizos throughout the territory of Mexico. American Journal of Physical Anthropology. 2009;139(3):284–294. doi:10.1002/ajpa.20980
32. Sami W, Ansari T, Butt NS, Hamid MRA. Effect of diet on type 2 diabetes mellitus: A review. Int J Health Sci. 2017;11(2):65–71.
33. Beigrezaei S, Ghiasvand R, Feizi A, Iraj B. Relationship between Dietary Patterns and Incidence of Type 2 Diabetes. Int J Prev Med. 2019;10(1):122. doi:10.4103/ijpvm.IJPVM_206_17
34. Naja F, Hwalla N, Itani L, et al. Dietary patterns and odds of Type 2 diabetes in Beirut, Lebanon: a case–control study. Nutr Metab (Lond). 2012;9(1):111. doi:10.1186/1743-7075-9-111
35. Liehn EA, Ponomariov V, Diaconu R, et al. Apolipoprotein E in Cardiovascular Diseases: novel Aspects of an Old-fashioned Enigma. Arch Med Res. 2018;49(8):522–529. doi:10.1016/j.arcmed.2018.08.008
36. Wu JHY, Micha R, Mozaffarian D. Dietary fats and cardiometabolic disease: mechanisms and effects on risk factors and outcomes. Nat Rev Cardiol. 2019;16(10):581–601. doi:10.1038/s41569-019-0206-1
37. Williams PT. Gene-environment interactions due to quantile-specific heritability of triglyceride and VLDL concentrations. Sci Rep. 2020;10(1):4486. doi:10.1038/s41598-020-60965-9
38. Rathnayake KM, Weech M, Jackson KG, Lovegrove JA. Impact of the Apolipoprotein E (epsilon) Genotype on Cardiometabolic Risk Markers and Responsiveness to Acute and Chronic Dietary Fat Manipulation. Nutrients. 2019;11(9):2044. doi:10.3390/nu11092044
39. Petkeviciene J, Smalinskiene A, Luksiene DI, et al. Associations between apolipoprotein E genotype, diet, body mass index, and serum lipids in Lithuanian adult population. PLoS One. 2012;7(7):e41525. doi:10.1371/journal.pone.0041525
40. Shatwan IM, Winther KH, Ellahi B, et al. Association of apolipoprotein E gene polymorphisms with blood lipids and their interaction with dietary factors. Lipids Health Dis. 2018;17(1):98. doi:10.1186/s12944-018-0744-2
41. Nathan DM, Genuth S, et al.; Diabetes Control and Complications Trial Research Group. The effect of intensive treatment of diabetes on the development and progression of long-term complications in insulin-dependent diabetes mellitus. N Engl J Med. 1993;329(14):977–986. doi:10.1056/NEJM199309303291401
42. Bardini G, Rotella CM, Giannini S. Dyslipidemia and diabetes: reciprocal impact of impaired lipid metabolism and Beta-cell dysfunction on micro- and macrovascular complications. The Review of Diabetic Studies. 2012;9(2–3):82–93. doi:10.1900/RDS.2012.9.82
43. Fox CS, Golden SH, Anderson C, et al. Update on prevention of cardiovascular disease in adults with type 2 diabetes mellitus in light of recent evidence: a scientific statement from the american heart association and the american diabetes association. Diabetes Care. 2015;38(9):1777–1803. doi:10.2337/dci15-0012
44. Ramos-Lopez O, Cuervo M, Goni L, et al. Modeling of an integrative prototype based on genetic, phenotypic, and environmental information for personalized prescription of energy-restricted diets in overweight/obese subjects. Am J Clin Nutr. 2020;111(2):459–470. doi:10.1093/ajcn/nqz286
45. Ramos-Lopez O, Riezu-Boj JI, Milagro FI, et al. Models Integrating genetic and lifestyle interactions on two adiposity phenotypes for personalized prescription of energy-restricted diets with different macronutrient distribution. Front Genet. 2019;10:686. doi:10.3389/fgene.2019.00686
46. Subar AF, Freedman LS, Tooze JA, et al. Addressing current criticism regarding the value of self-report dietary data. J Nutr. 2015;145(12):2639–2645. doi:10.3945/jn.115.219634
 © 2020 The Author(s). This work is published and licensed by Dove Medical Press Limited. The full terms of this license are available at https://www.dovepress.com/terms.php and incorporate the Creative Commons Attribution - Non Commercial (unported, v3.0) License.
By accessing the work you hereby accept the Terms. Non-commercial uses of the work are permitted without any further permission from Dove Medical Press Limited, provided the work is properly attributed. For permission for commercial use of this work, please see paragraphs 4.2 and 5 of our Terms.
© 2020 The Author(s). This work is published and licensed by Dove Medical Press Limited. The full terms of this license are available at https://www.dovepress.com/terms.php and incorporate the Creative Commons Attribution - Non Commercial (unported, v3.0) License.
By accessing the work you hereby accept the Terms. Non-commercial uses of the work are permitted without any further permission from Dove Medical Press Limited, provided the work is properly attributed. For permission for commercial use of this work, please see paragraphs 4.2 and 5 of our Terms.