")
Back to Journals » ClinicoEconomics and Outcomes Research » Volume 10
Impact of a pharmacist-led diabetes management on outcomes, utilization, and cost
Authors Maeng DD, Graham J, Bogart M, Hao J, Wright EA
Received 18 May 2018
Accepted for publication 3 July 2018
Published 24 September 2018 Volume 2018:10 Pages 551—562
DOI https://doi.org/10.2147/CEOR.S174595
Checked for plagiarism Yes
Review by Single anonymous peer review
Peer reviewer comments 3
Editor who approved publication: Professor Giorgio Colombo
Daniel D Maeng, Jove Graham, Michael Bogart, Jing Hao, Eric A Wright
Department of Epidemiology and Health Services Research, Geisinger, Danville, PA, USA
Purpose: Pharmacist-led medication therapy disease management (MTDM) has shown improvement in clinical outcomes in patients with certain chronic diseases. However, only limited data demonstrating the impact on health care utilization and cost of care are available. This study seeks to evaluate the impact of a pharmacist-led MTDM program on clinical surrogate outcomes, care utilization, and cost of care among patients with diabetes mellitus.
Methods: A retrospective cohort study was conducted by utilizing electronic health records and insurance claims data. Patients were identified between February 2011 and December 2014. Data were collected from Geisinger, a large integrated health care system located in Pennsylvania and southern New Jersey. A total of 5,500 patients with diabetes mellitus were identified; 2,750 were enrolled in MTDM and were 1-to-1 propensity score-matched to a comparison cohort not enrolled in a pharmacist-led MTDM program.
Results: There were no differences between groups in composite HbA1c, blood pressure, or low-density lipoprotein cholesterol goal attainment at 12 months (12% vs 12%, P=0.53). HbA1c goal was reached more frequently among patients without MTDM compared to those at 12 months (57% vs 51%, P<0.0001). There were no significant differences between the two cohorts in the attainment of blood pressure or low-density lipoprotein cholesterol goals at 12 months. MTDM was associated with reduced all-cause hospitalization rate (–19.6%; P=0.02) as well as increased primary care physician visits (18.5%; P<0.001) and lower average per-member-per-month medical cost (–13%, P=0.027).
Conclusion: Despite the lack of impact on the clinical surrogate outcomes, MTDM was associated with lower cost of care and fewer hospitalizations, possibly facilitated by increased monitoring (ie, higher primary care utilization).
Keywords: diabetes, pharmacist, medication therapy management, health outcomes, HbA1c, utilization, cost of care
Introduction
Over 30 million people in the United States have diabetes mellitus (DM).1 In addition to the morbidity and mortality associated with DM, the cost burden for an individual with DM is more than twice as high as it is for an individual without DM, while the total direct and indirect cost burden of DM in 2012 was estimated to be $245 billion.2 Although the clinical, humanistic, and economic burdens associated with DM are high, they can be improved through appropriate management of hyperglycemia and the often-associated comorbidities such as hypertension and hyperlipidemia. The potential impact of adequate treatment of all three of these risk factors has shown significant improvements in glycemic level, blood pressure, and lipid control; a >50% decrease in the risk of cardiovascular disease; and a >60% decrease in all manifestations of microvascular diseases such as nephropathy, retinopathy, and autonomic neuropathy.3 Despite evidence supporting the benefits of these risk factors in patients with DM, <10% of adults with DM in the United States have these factors adequately controlled.4,5
Among a multitude of other system-level initiatives, the American Diabetes Association recommend the expanding role of teams to intensify treatment.6 In addition to other team members, pharmacist-led management of diabetes is well-studied as an effective intervention to improve glycemic control and cardiovascular risk in patients with diabetes.7 However, universal adoption by health care systems has not occurred. One of the barriers for more wide-spread implementation is the lack of information on the relative impact of these services on health care utilization and cost of care.8 To improve the management of our patients with DM, Geisinger has developed and implemented a program of pharmacist-led management of DM, referred to as medication therapy disease management (MTDM). Initially piloted in 2008, the program embeds MTDM pharmacists within primary care provider (PCP) clinics where the pharmacists collaboratively manage a select population of patients with DM. This study assesses the impact of an MTDM program on the achievement of guideline-based disease targets, health care utilization, and cost.
Geisinger is a physician-led integrated health care system serving ~3 million residents across central and northeastern Pennsylvania and southern New Jersey. As of 2017, it consists of 12 hospitals, two research centers, two skilled nursing facilities, a substance abuse treatment center, and health insurance through the Geisinger Health Plan (GHP). It also includes 83 primary and specialty clinic sites, 44 of which are community-based primary care clinics. Approximately 40% of Geisinger patients have insurance coverage through GHP.
Medication therapy and disease management protocol
For DM, the defining characteristics are so unambiguous and the evidence base for successful treatment is so extensive to allow for rules-based, precision management that can be skillfully carried out by non-physician health care professionals, such as appropriately trained pharmacists. The distinguishing features of Geisinger’s pharmacist-led MTDM program relative to the prevailing DM standard of care include embedding of a MTDM pharmacist within each PCP clinic site and autonomy of the pharmacist in performing the MTDM functions.
Patients diagnosed with DM may be referred to the MTDM program at any time. Patients are referred by their physician who completes a pharmacist MTDM referral electronically in Geisinger’s electronic health records (EHRs) system. The decision for referral to MTDM is made by the physician based on his or her clinical judgment; no predetermined set of criteria are used to determine the patients’ eligibility for MTDM. At the initial visit, the pharmacist extensively interviews and educates the patient and verifies information with the EHR. The pharmacist is authorized to manage prescriptions for all the DM-related conditions. If a new prescription is needed, the MTDM pharmacist ensures that a written, e-prescribed, or telephoned prescription is generated by following collaborative practice guidelines. The pharmacist schedules subsequent MTDM appointments or laboratory testing as needed, independent of the referring physician. Every attempt is made to coordinate these appointments with preexisting appointments to make it convenient for the patient.
Methods
This study was funded by GlaxoSmithKline and approved by Geisinger’s Institutional Review Board. Geisinger’s EHR and GHP claims databases were queried to obtain the retrospective data covering a 6-year period from January 1, 2009, to December 31, 2014. To ensure patient confidentiality, patient information, such as patient name, address, and contact information, was removed from the final data sets. As noted above, the MTDM program was initially piloted in 2008 with one pharmacist in a single primary care site, and it was subsequently expanded after February 2011 to include 24 primary care sites as of 2015. For the purposes of this study, those patients who have enrolled in that initial pilot phase of the MTDM program were excluded, because it was deemed that the early pilot MTDM program had not been fully developed and mature. As such, the MTDM intervention group in this study included only those patients who had been enrolled in the MTDM program between February 2011 and December 2014. The non-MTDM comparison group was defined as those meeting the inclusion and exclusion criteria as described below but were not referred to the MTDM at any point during the same period. Pre-MTDM claims data from 2009 to 2010 were used to account for any preexisting differences between the intervention and the comparison groups.
The study population was defined as patients who were aged ≥18 years during the study period, who had a primary or secondary diagnosis for DM defined as an ICD, ninth Revision, Clinical Modification (ICD-9-CM) diagnosis code of 250.xx; received health care services from a Geisinger primary care clinic; and had ≥1 month of both medical and prescription drug coverage through GHP. Patients were excluded if they were pregnant (ICD-9-CM 650.xx) or had gestational diabetes (ICD-9-CM 648.8); if they had any MTDM encounter prior to February 2011 (ie, exposed to MTDM during the pilot phase); or if they had previously requested not to be included in any research studies. Patients with <6 months of EHR data prior to their index date (defined as the date of first visit with a MTDM pharmacist) or <12 months of EHR data after index date were excluded to ensure adequate baseline and follow-up observation. Patients with only one MTDM encounter were also excluded, as a single encounter was attributable to a lack of engagement within the MTDM. Figure 1 shows the illustration of the observation schema.
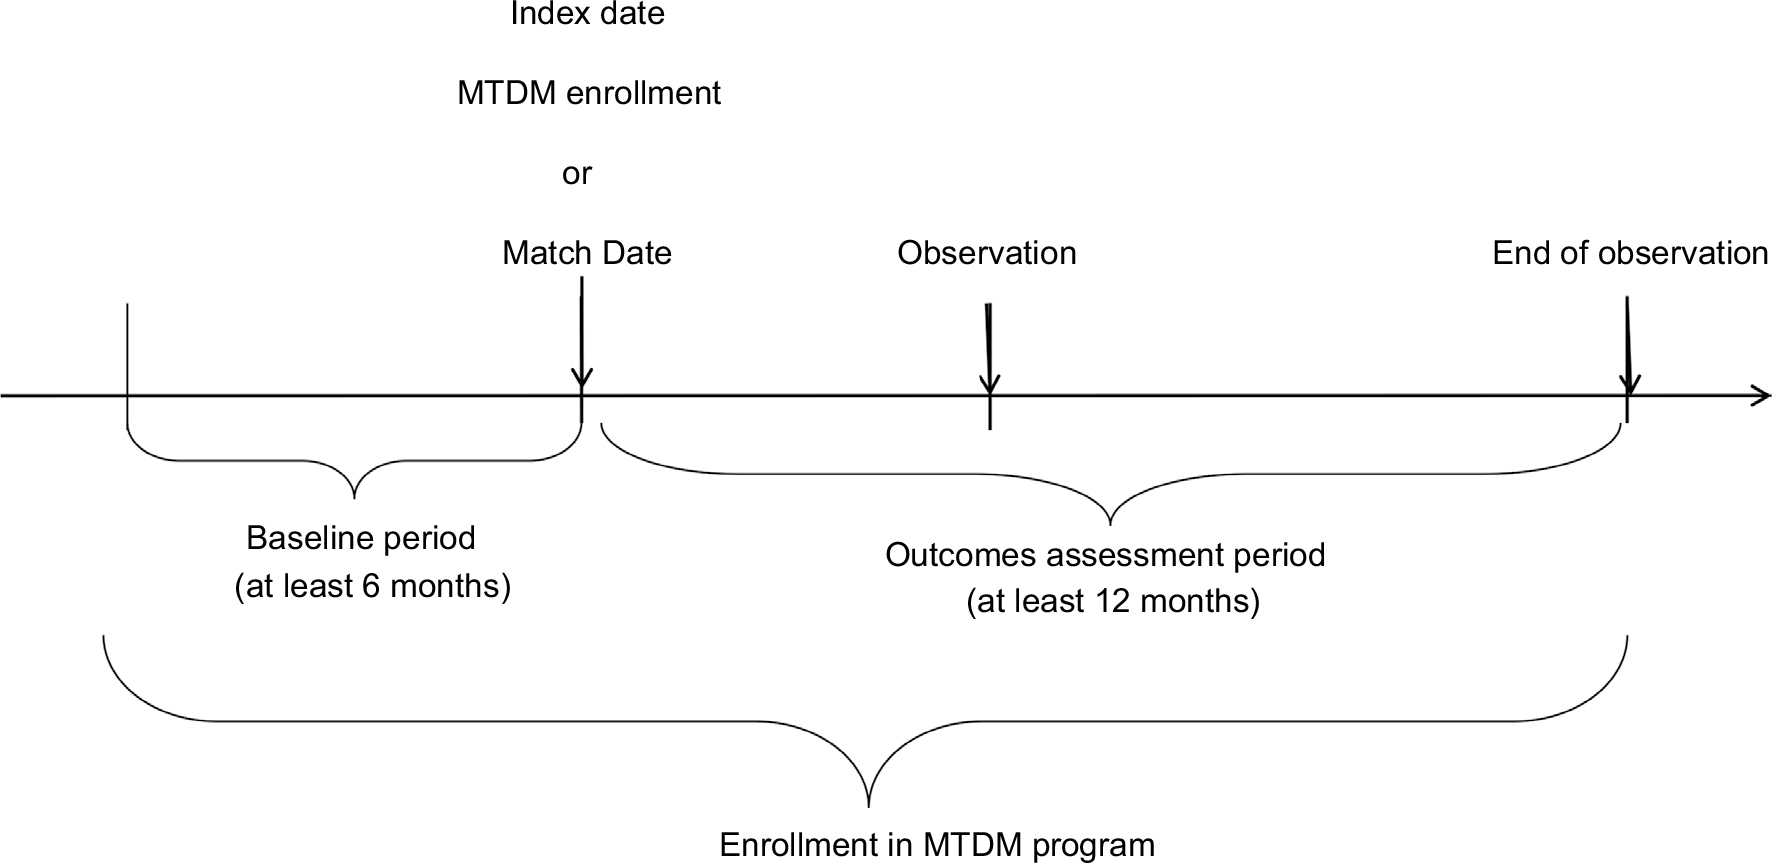 | Figure 1 Study observation schema. Abbreviation: MTDM, medication therapy disease management. |
The main outcome variables of interest were the percent of patients meeting three predefined targets concurrently and percent of patients meeting each individual target at 12 months following the initial MTDM visit with a pharmacist. Those three targets were: glycemic control of HbA1c <8; blood pressure of systolic pressure <130 mmHg and diastolic pressure <80 mmHg; and low-density lipoprotein cholesterol (LDL-C) levels of <100 or <70 mg/dL for patients with coronary heart disease or chronic kidney disease. Because this was an observational study, some patients did not have visits scheduled at exactly 12 months of follow-up; in these cases, the most recent measures prior to 12 months were carried forward.
For health care utilization and cost of care, GHP claims data were used to capture the per-member-per-month (PMPM) rates of all-cause acute inpatient admissions, emergency department (ED) visits, physician office visits, and the average PMPM total cost of care. Cost of care was defined as the allowed amounts, defined as the sum of GHP’s payments to the health care providers plus patients’ out-of-pocket costs in the forms of deductibles, copays, and coinsurance. All-cause costs were reported to avoid any potential bias that may result from inaccurate identification of diabetes-related care utilization. Total cost was divided into medical and prescription drug costs. Also, the analysis of utilization and cost was limited to the subsample who had prescription drug coverage through GHP to ensure that all the patients in the analysis had comparable access to prescription drugs. Within this subsample, the 1-to-1 matched balanced cohort was maintained by dropping from the subsample of those in the MTDM intervention group whose matched comparison did not have GHP prescription drug coverage.
Statistical analysis
We used a propensity scoring model to estimate the probability of MTDM enrollment and match the MTDM and control patients with similar scores at a 1:1 ratio. For MTDM patients, propensity was calculated from the first MTDM visit (i.e. index date). For control patients, since there was no enrollment date, propensity scores were calculated for every encounter they had during the period, with each encounter serving as a potential index date. Propensity was calculated as a function of the following patient characteristics at index date: sex; Caucasian race; whether the index date encounter was a primary care visit; age (by decile); most recent HbA1c, LDL-C, systolic and diastolic BP, and BMI prior to index; Quan-Charlson Comorbidity Index;9 presence of other comorbidities (acute myocardial infarction, unstable angina, stable angina, coronary heart disease, ischemic stroke, peripheral artery disease, type 1 and type 2 DM, hypertension, hyperlipidemia, valvular disease, bipolar disorder, depression, schizophrenia – see Table S2 for the ICD-9 and procedure codes used to identify these conditions); history of coronary artery bypass grafting or coronary revascularization procedures; whether the patient was taking antihypertensive, antihyperlipidemic, or statin medication prior to index; number of ED visits in the prior year; and number of inpatient admissions in the previous year. After initial modeling, the propensity model was also adjusted to include the squared normalized distance between the patient’s HbA1c and diastolic blood pressure value and the population mean for those values.
To be eligible for matching to an MTDM patient, the comparison patient needed to have a potential index date within ±30 days of the MTDM patient’s index date, similar propensity score (specifically, a logit-propensity score that was within 0.6 standard deviations of the overall logit-score distribution), similar Quan-Charlson Comorbidity Index (within ±1 point), same GHP insurance status as of the index date (yes or no), same prior diagnosis status for hypertension (yes or no), hyperlipidemia (yes or no), and chronic obstructive pulmonary disease (yes or no). A greedy matching algorithm was used to match the MTDM patients to the comparison patient with the nearest propensity score without replacement. To assess whether the covariates are balanced after matching, standardized mean or percentage differences – represented by |d| – between the MTDM and the comparison cohorts for all the covariates were calculated. |d| ≤0.10 indicates a good balance between cohorts, whereas |d| >0.10 would suggest a variable is imbalanced and therefore would confound the comparison of outcomes between groups if not accounted for.10
To test for differences in the proportions of patients in the two cohorts who had achieved target levels for HbA1c, LDL-C, and BP at 12 months following the index date, a series of logistic regression models were used with the cohort (MTDM or control) as the explanatory variable. Differences in the proportions of patients who had achieved each target individually and all three targets as a composite outcome were compared, with differences of P<0.05 considered statistically significant. Linear regression models were also used to test for differences between cohorts in mean and difference in mean change from baseline, for all three outcome measures at last follow-up.
To estimate the impact on health care utilization and cost, a difference-in-difference approach was used. The difference-in-difference method is intended to account for both baseline (ie, pre-index date) differences between the MTDM and the non-MTDM cohorts and the secular trends over the study period not attributable to the MTDM program. The baseline period was defined as the period from January 2009 until index date, and for the post-intervention period, the first 12 months was separately considered from the period after the first 12 months to distinguish short- and long-term effects of MTDM. For each cost variable (eg, prescription drug cost), a linear regression model was estimated, and for each utilization variable (eg, hospitalizations), Poisson models were estimated for the count data. Models were adjusted for each of the calendar years (to account for secular trends and inflation), month (to capture seasonality), health plan type (commercial, Medicare, Medicaid, or the Exchange plans), whether the patient was in a patient-centered medical home, whether the patient was enrolled in case management, and length of GHP enrolment during the study period (to account for the possibility that continuous enrollment with a single health plan impacted care continuity and coordination). Finally, we included an interaction term between the case management and patient-centered medical home indicators, to account for the possibility that health plan case management might have a different effect within a medical home environment.
The impact of MTDM was then estimated as the difference between the regression-adjusted “observed” and “expected” values. “Observed” values represent the regression-adjusted mean estimates for the MTDM cohort, while “expected” values represent the regression-adjusted estimates for the same patients with the MTDM group indicators set to zero, that is, using counterfactual data from the non-MTDM cohort to estimate the outcomes of the MTDM cohort if those patients never enrolled in the MTDM program. Bootstrap standard errors with 100 replications were obtained to calculate the corresponding 95% confidence intervals.11
Results
The final matched sample was 5,500 patients with diabetes (Figure 2). Approximately 22% (615/2,750) of MTDM cases had between two and five MTDM visits, and over half (1378/2750) had ≥15 MTDM visits, up to a maximum of 146 MTM visits. After the propensity score match, patient characteristics were well balanced (Table 1). Furthermore, prevalence of comorbid conditions was also similar after the matching (shown in Table S1).
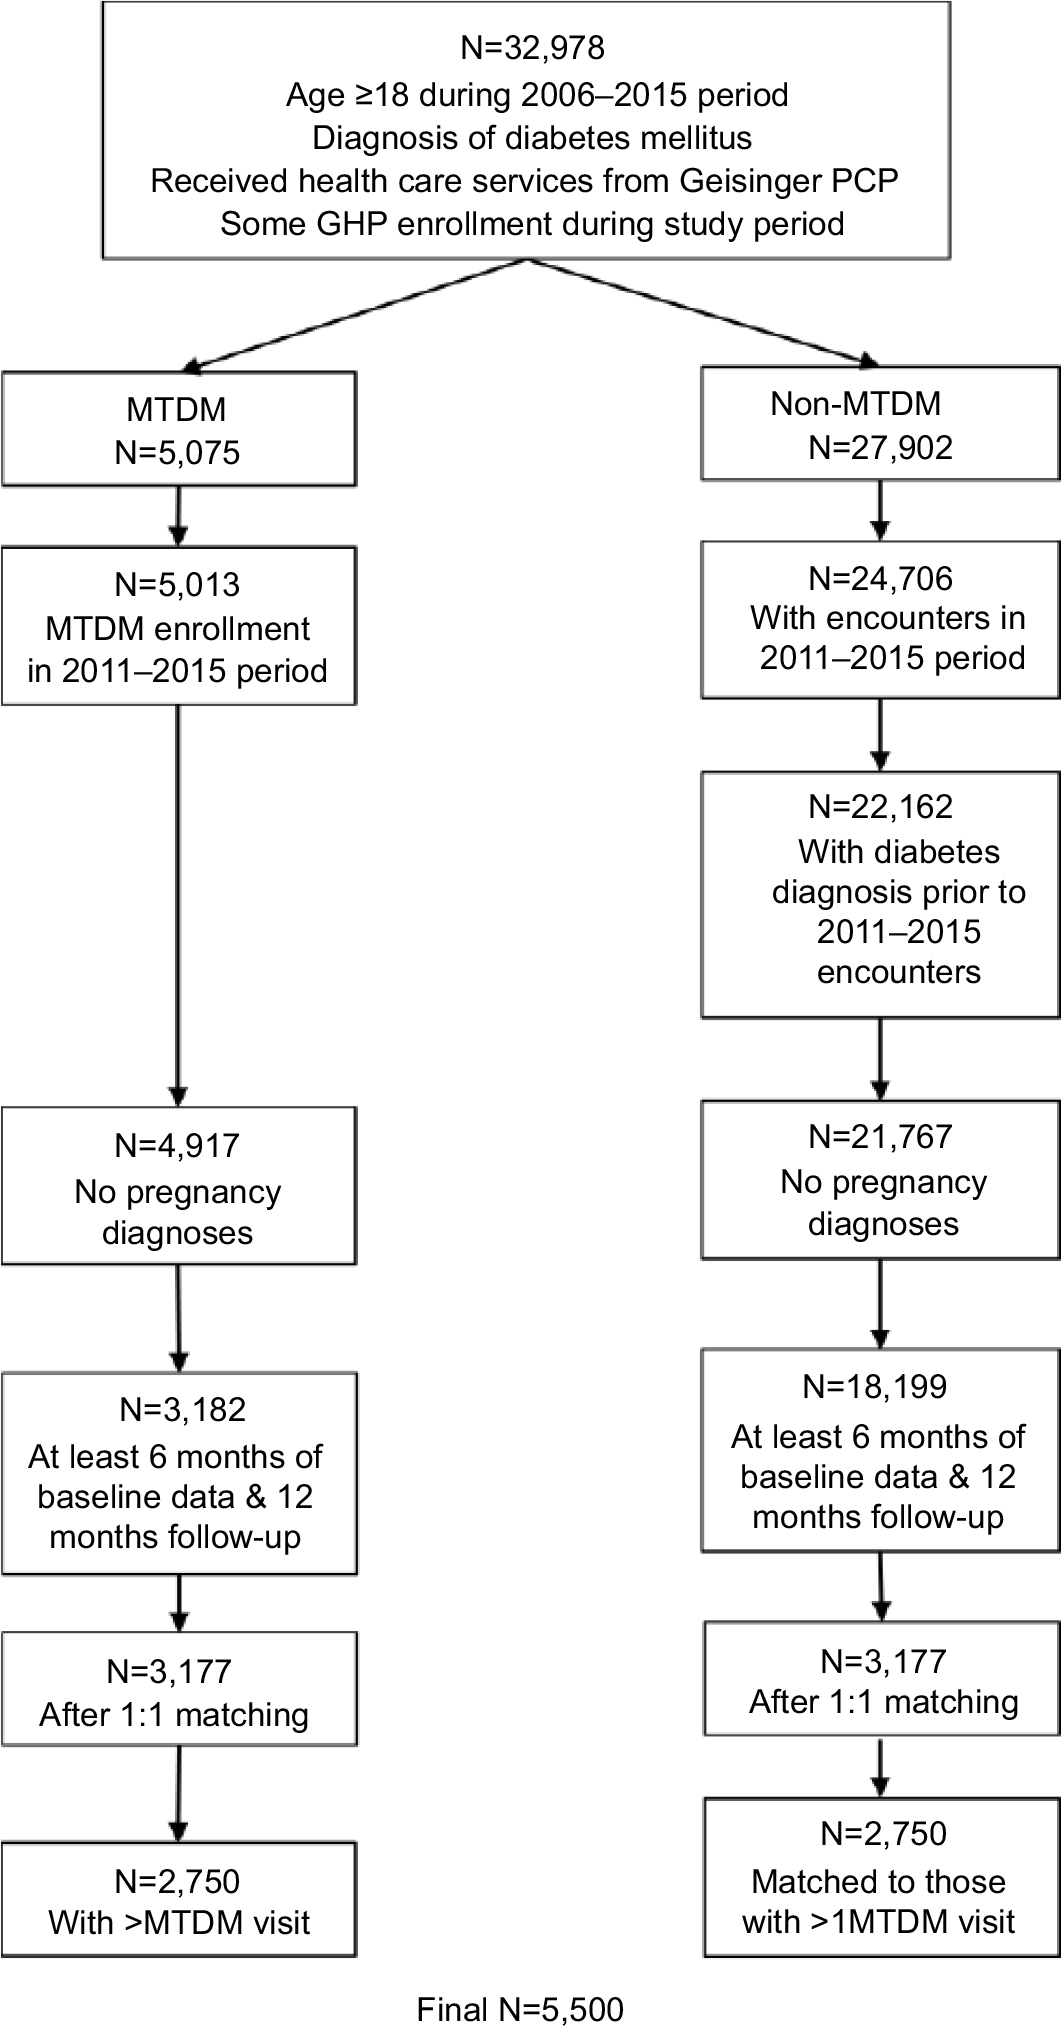 | Figure 2 Waterfall diagram for the MTDM intervention and non-MTDM comparison cohorts. Abbreviations: MTDM, medication therapy disease management; PCP, primary care provider; GHP, Geisinger Health Plan. |
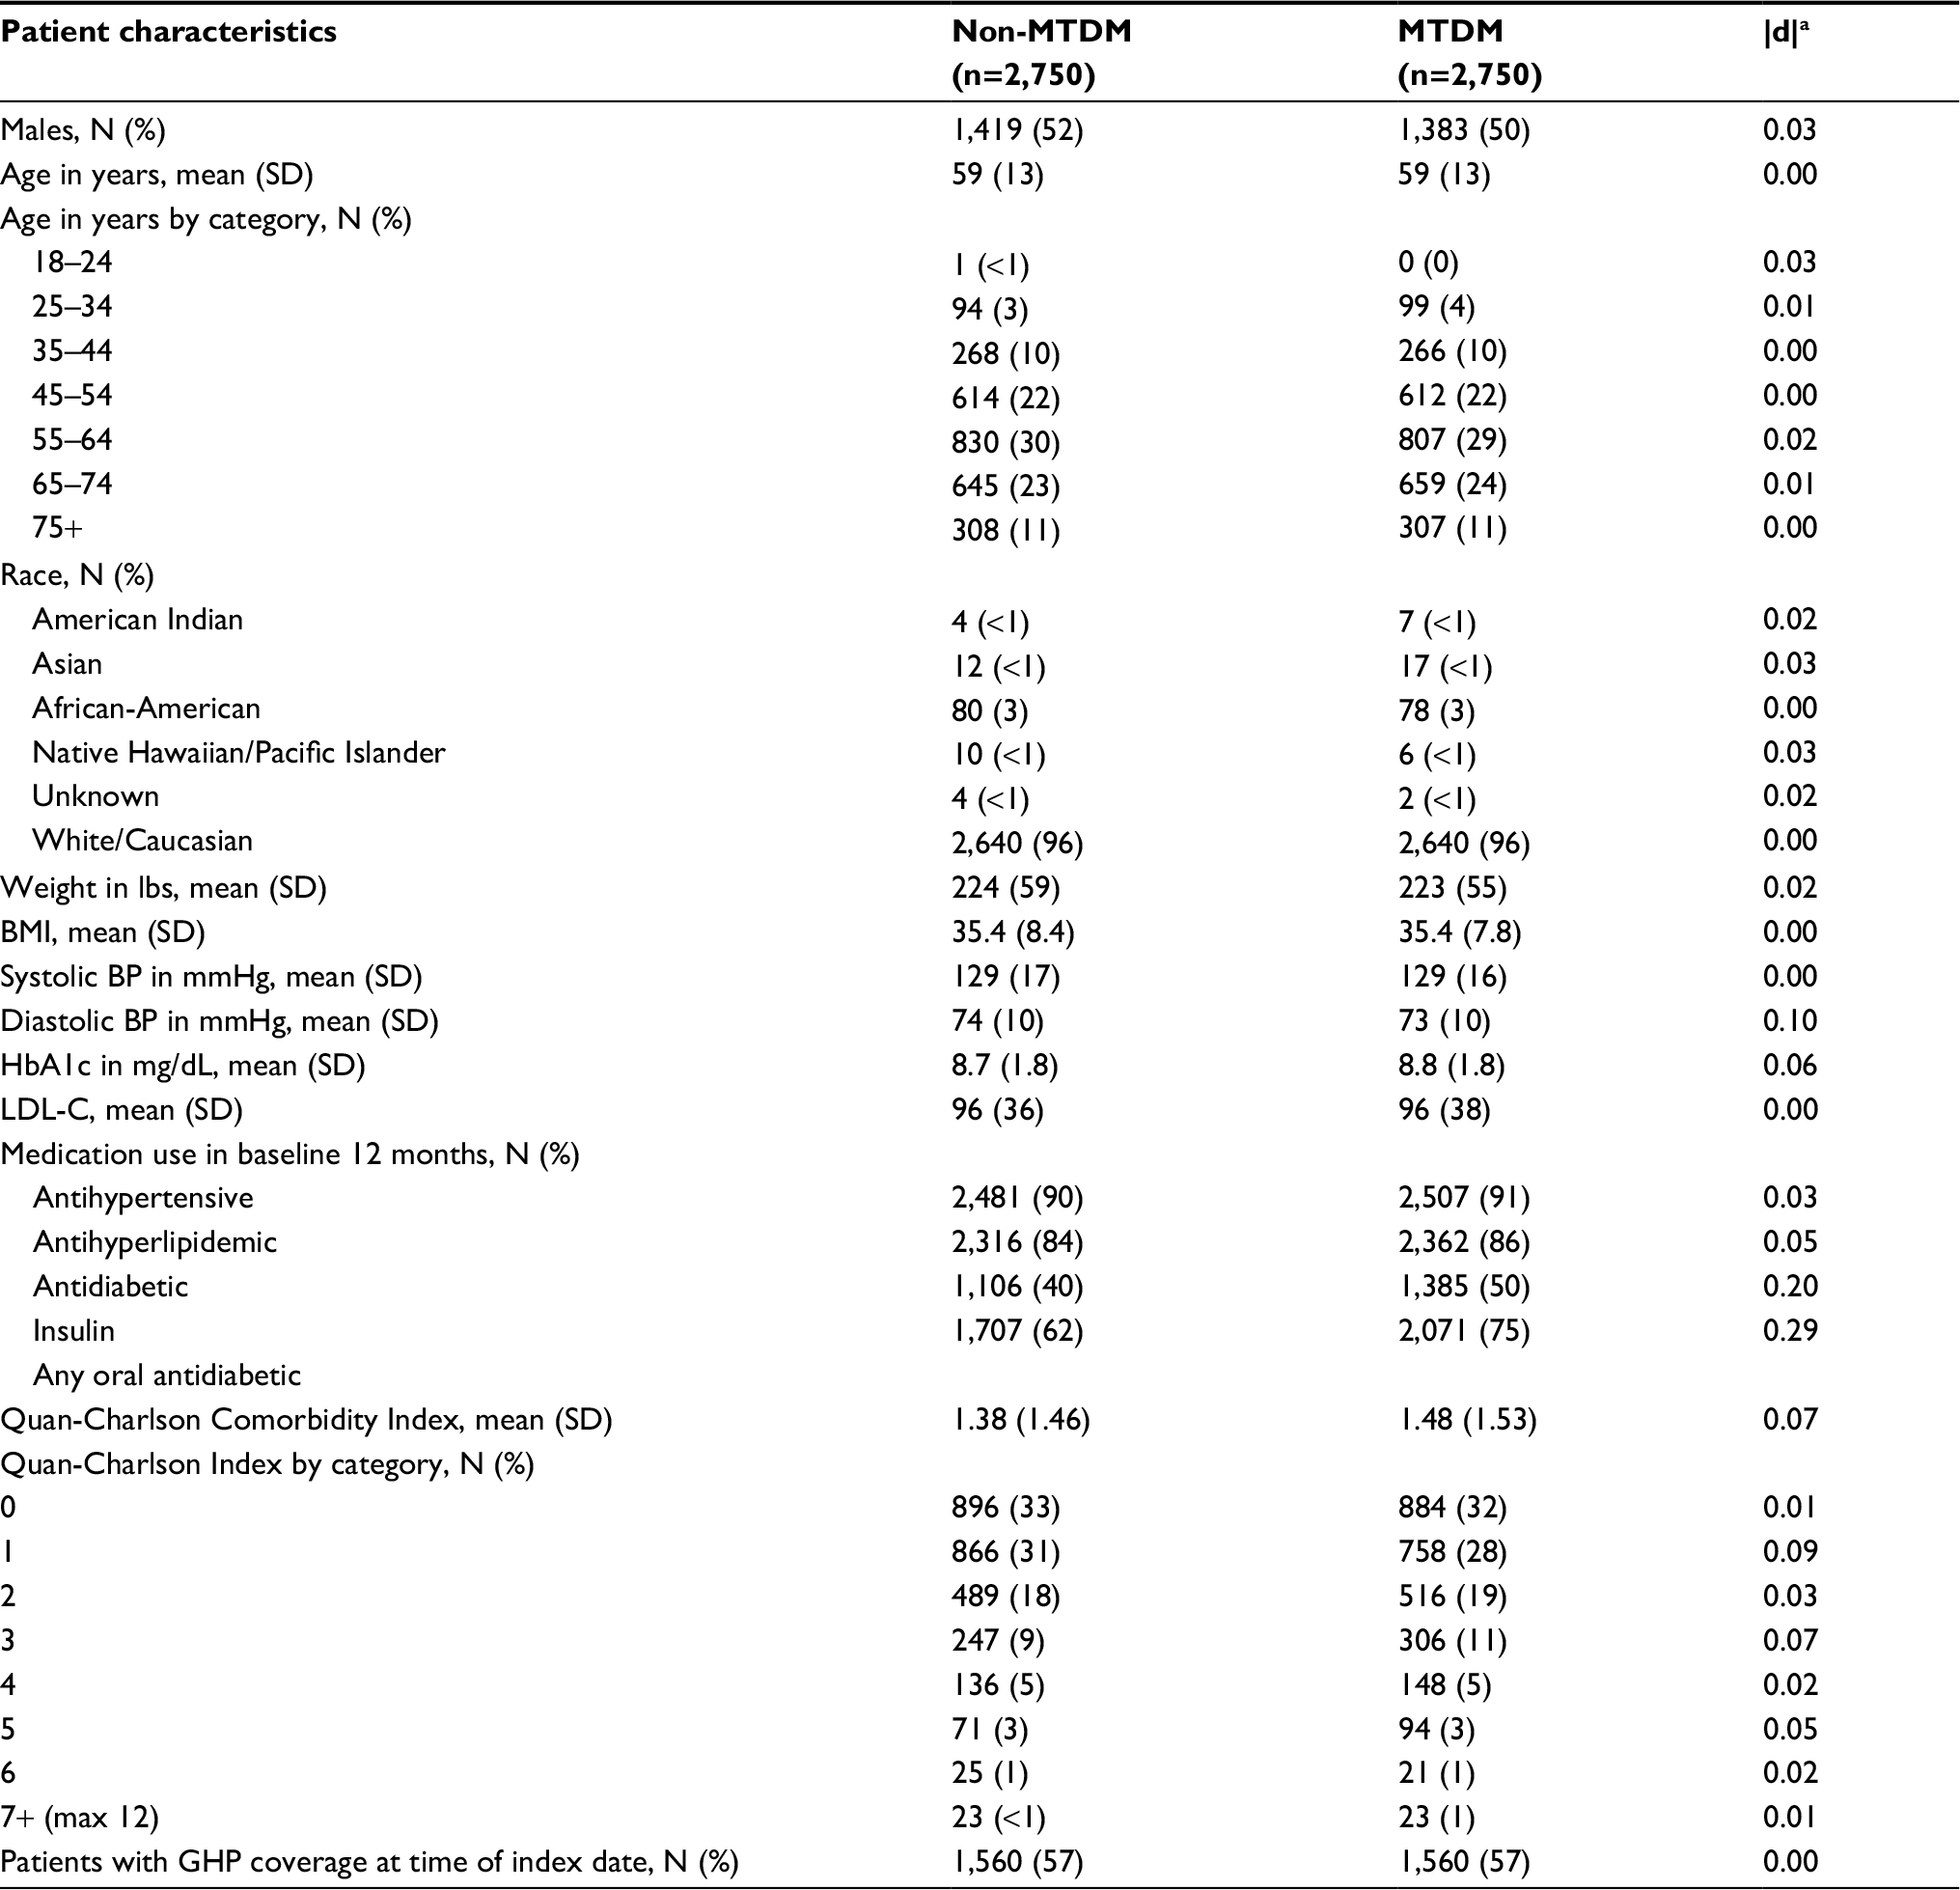 | Table 1 Baseline characteristics of the propensity-matched cohorts Note: a|d| denotes standardized difference in mean or percentages and is not confounded by sample size as P-values are. Abbreviations: LDL-C, low-density lipoprotein cholesterol; MTDM, medication therapy disease management; GHP, Geisinger Health Plan. |
Patient follow-up ranged from 365 to 1679 days, with a median of 935 days. As noted above, not all patients had scheduled follow-up visits exactly at or near 365 days. Therefore, a sensitivity analysis was conducted in which patients whose outcome values were carried forward >6 months were excluded from the sample (Table 2).
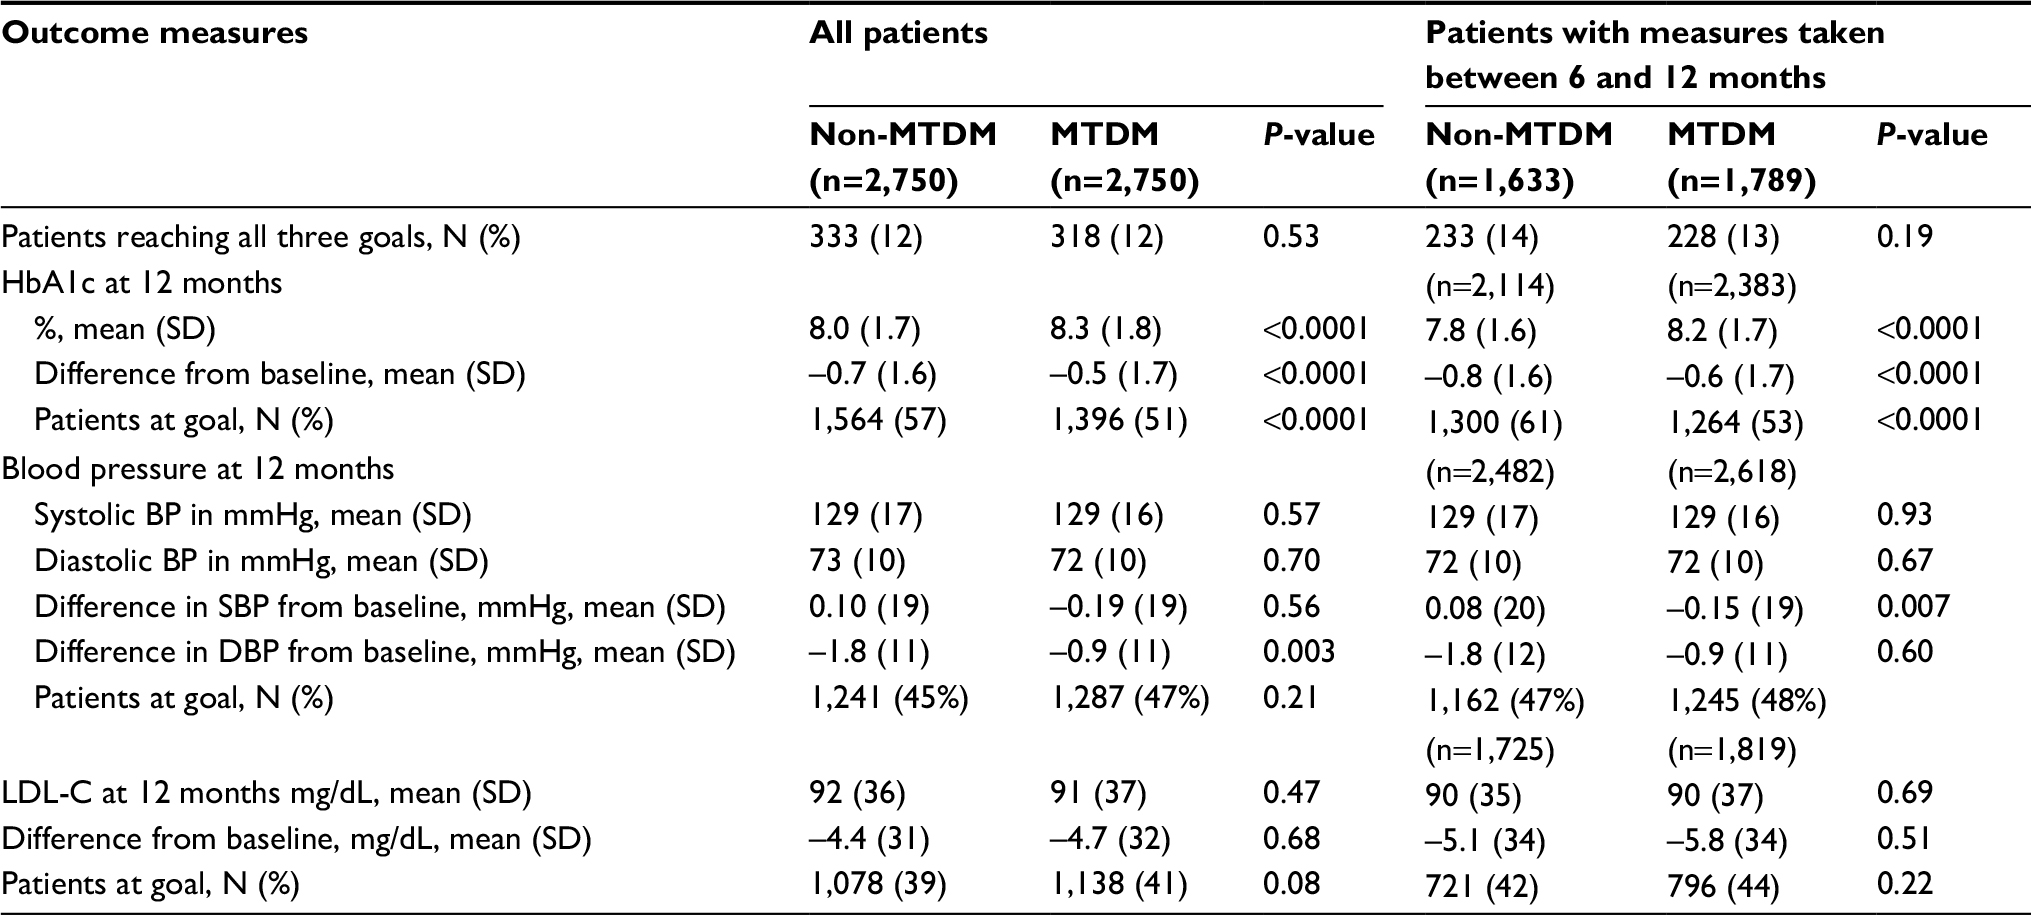 | Table 2 Primary and individual endpoints (HbA1c, BP, and LDL-C) at 12 months for the two cohorts Abbreviations: LDL-C, low-density lipoprotein cholesterol; MTDM, medication therapy disease management. |
The percent of patients achieving all three targets simultaneously were similar between the MTDM and the non-MTDM cohorts (MTDM, 318 [12%]; non-MTDM, 333 [12%]; P=0.53), even after excluding patients whose latest outcome values were taken before 6 months following the index date (MTDM, 228 [13%]; non-MTDM, 233 [14%]; P=0.19) (Table 2). Both groups had reductions noted in HbA1c from baseline, but the change in HbA1c was more modest in the MTDM group than the comparison group (–0.5% vs –0.7%, P<0.0001), resulting in 51% of MTDM patients and 57% of comparison patients at goal (P<0.0001). The MTDM cohort also showed a smaller decline in DBP from baseline than the non-MTDM comparison cohort (–0.9 to –1.8 mmHg, P=0.003); however, DBP goal attainment remained similar between groups. No additional differences between the cohorts were noted.
As noted above, the analysis of utilization and cost was limited to the subsample of patients who had GHP prescription drug coverage. This subsample consisted of 2,058 patients in each of the MTDM and non-MTDM groups, or ~75% of the propensity score-matched sample. Patients’ exposure to MTDM was associated with a reduction in the acute inpatient admission (270 vs 335 per 1,000 members per year or 19.6% reduction; P=0.02) as well as an increase in the PCP visit rate (5,555 vs 4,687 per 1,000 members per year or 18.5% increase; P<0.001), following the index date (Tables 3 and 4). MTDM was also associated with a statistically significant total medical cost savings ($1,061 vs $1,230 PMPM or 13.7% reduction; P=0.027) (Table 5). No significant impact on prescription drug costs was observed.
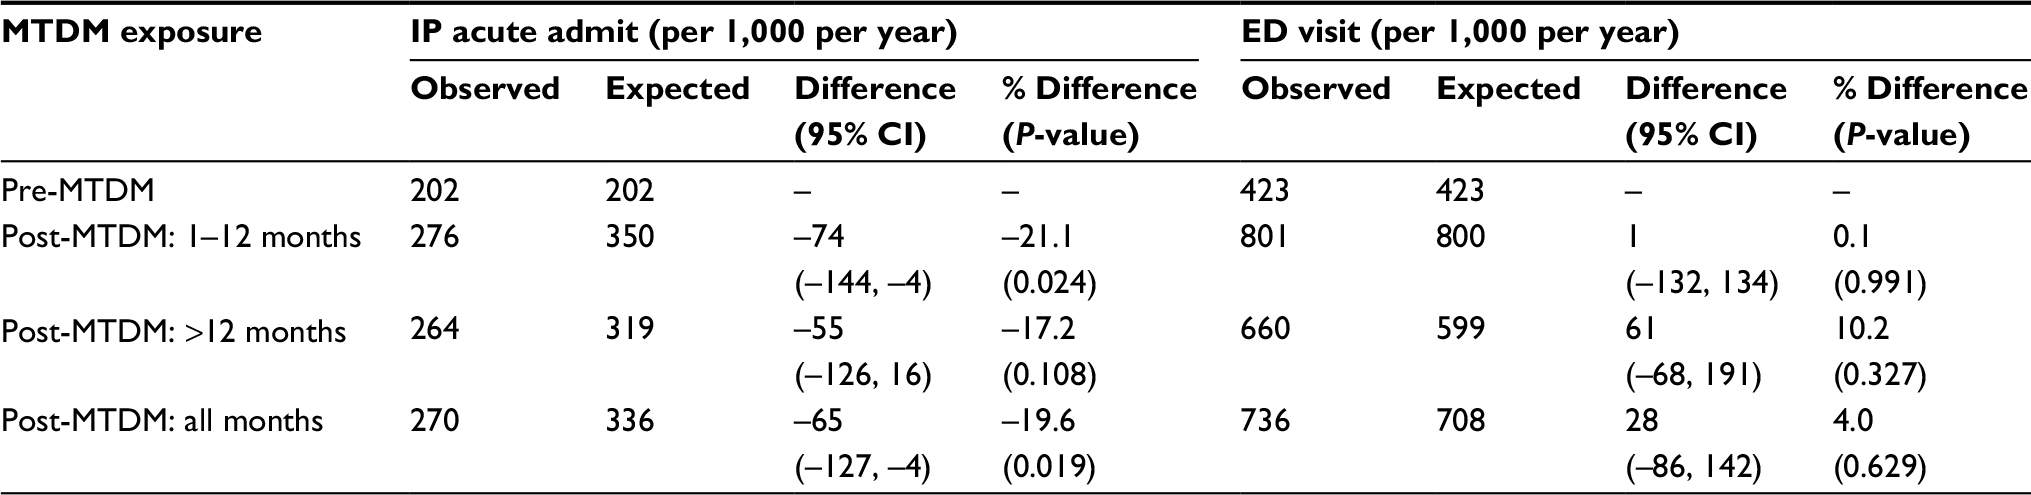 | Table 3 MTDM impact on acute care utilization Abbreviations: ED, emergency department; IP, inpatient; MTDM, medication therapy disease management. |
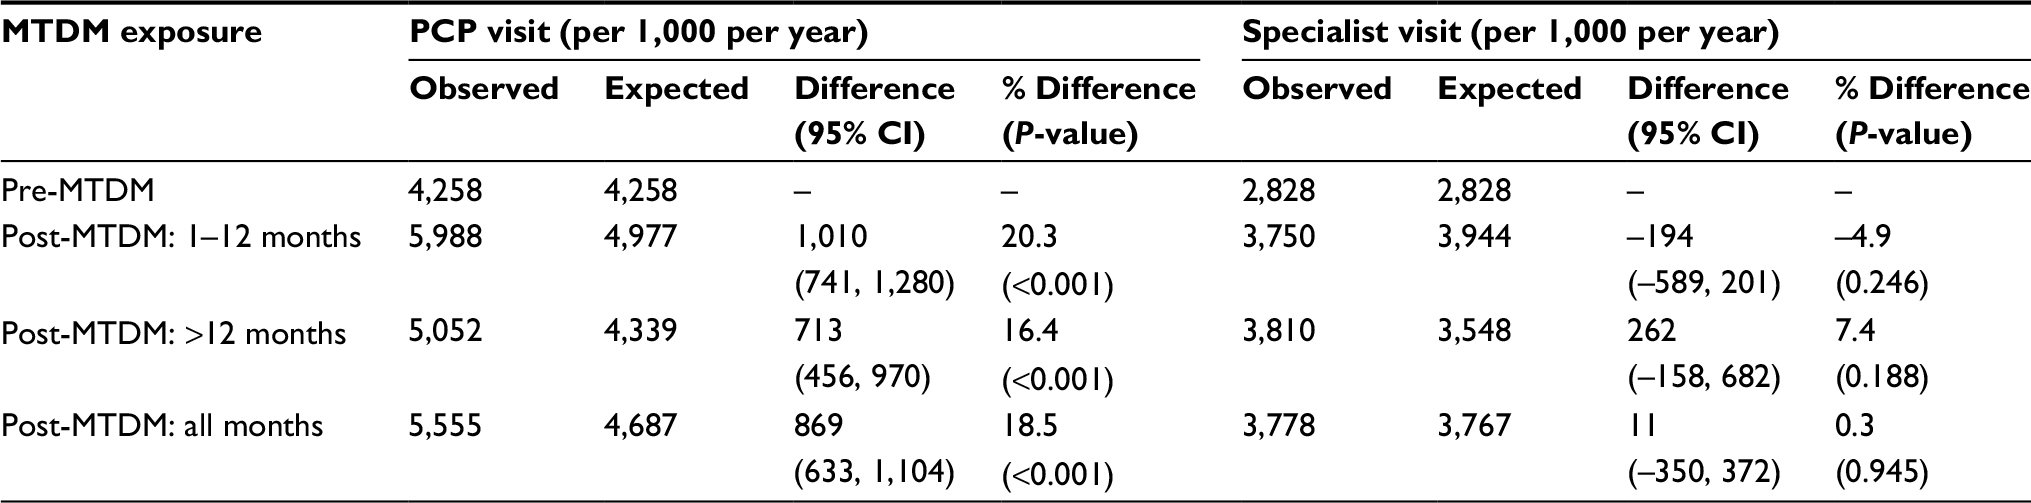 | Table 4 MTDM impact on physician office visits Abbreviations: PCP, primary care physician; MTDM, medication therapy disease management. |
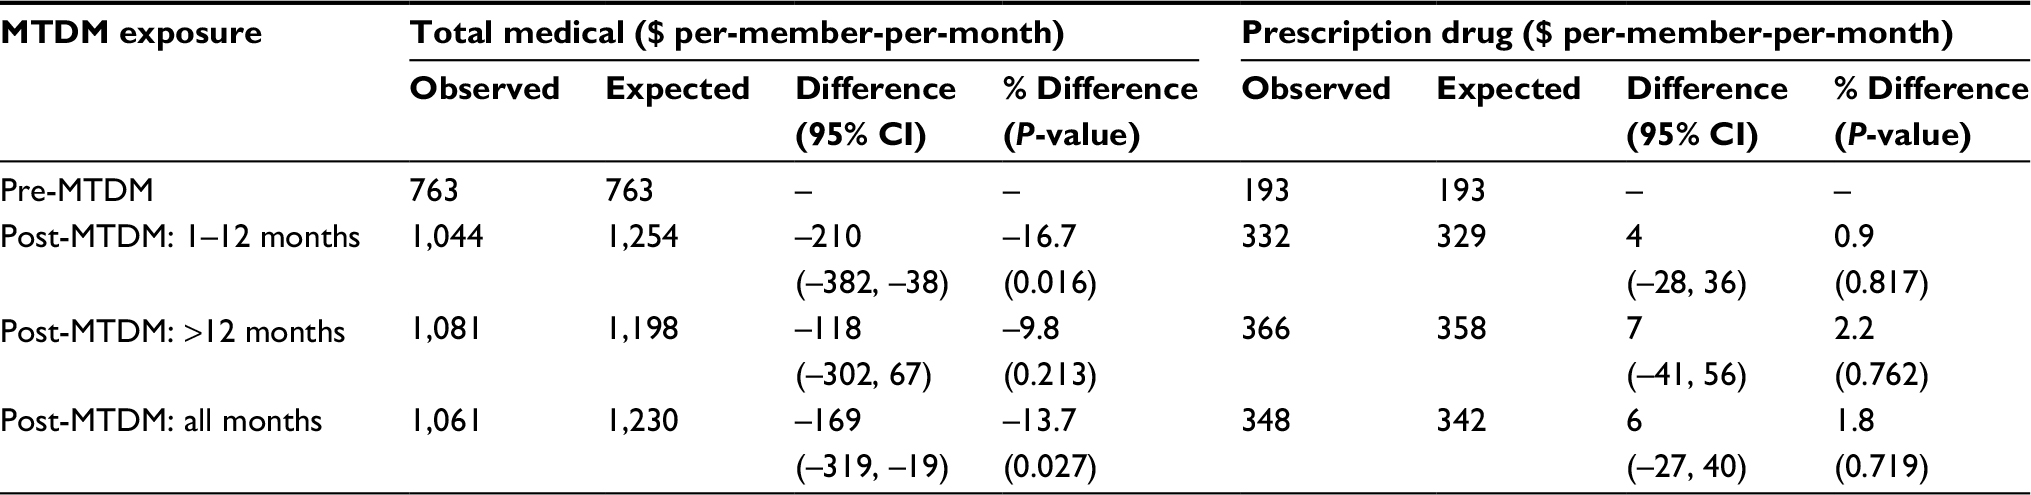 | Table 5 MTDM impact on cost of care Abbreviation: MTDM, medication therapy disease management. |
Discussion
Patients in a pharmacist-led MTDM program experienced lower rates of inpatient admissions and lower medical costs. Glycemic control among patients in the MTDM program has improved although to a lesser extent than matched controls. Our findings are consistent with a previous study conducted in another integrated health system setting,12 in which authors compared patients in a pharmacist-led diabetes management program within a patient-centered medical home versus patients not enrolled in the program. They reported similar observations of no significant differences in clinical outcomes but a significantly higher estimated rate of ambulatory care visits and lower rate of hospitalizations.
Other studies have shown positive associations between pharmacist-led management program and the clinical outcomes considered in this study.13–16 A meta-analysis of 15 randomized controlled trials also noted significant improvements in cardiovascular risk factors related to pharmacist-managed care.17 However, there are clear differences between these previous studies and the current study including differences in settings (eg, Veterans Affairs and community health center vs integrated health system), study design (eg, randomized clinical trial vs observational study), lower individual study sample sizes, and the differences in the design and maturity of the disease management programs. In our study, the MTDM program resulted in significant reduction in high-cost medical utilization leading to significant per-member per-month savings despite moderate improvements in HbA1c and less improvement than the comparator. Future research should seek to explore the mechanisms explaining the optimal medication management for DM patients.
Despite these explanations and comparisons with other studies, interpreting our seemingly contradictory finding is challenging. Our initial hypothesis, based on the collection of evidence to date, has been that pharmacist management would improve glycemic control, which would in-turn drive lower utilization and cost. Yet, despite a smaller reduction in HbA1c in the MTDM group, we have observed a decrease in inpatient admissions and a reduction in medical costs. While evidence suggests that improving glycemic control is associated with improved microvascular and possible macrovascular outcomes, evidence on acute health care utilization is not clear. In addition, there is evidence to suggest that the tight glycemic control increases the risk of harm via hypoglycemia18 without a benefit on most micro- or macrovascular outcomes.19
It is possible that based on the MTDM treatment protocol, pharmacists have tailored the regimens to the patients in ways that avoided hypoglycemia. They may have also avoided over-basalization (eg, hyper-focus on morning blood glucose at goal while disregarding glucose readings throughout the rest of day) and chose drugs with inherently better health/safety profile (eg, medication with less weight gain, lower cardiovascular and heart failure risk, and b-cell sparing medications). The MTDM treatment protocol includes early initiation and titration of metformin along with the initiation of newer evidence-based antidiabetic agents (eg, glucagon-like peptide-1 (GLP-1) agonists) for glycemic control over sulfonylureas. In a separate analysis, we have noted a 14% lower odds of using sulfonylureas in MTDM-managed patients versus comparison patients (OR 0.86, 95% CI 0.79, 0.94, P=0.002), higher odds of being placed on GLP-1 agonists (OR 1.90, 95% CI 1.45, 2.49, P<0.0001), biguanides (OR 1.12, 95% CI 1.02, 1.23, P=0.02), meglitinide analogs (OR 2.97, 95% CI 2.31, 3.81, P<0.0001), and insulin (OR 1.11, 95% CI 1.01, 1.21, P=0.02). These complementary mechanisms may support our non-congruent findings and may also support a reevaluation of HbA1c goal attainment as a metric for success in this type of program.
Another potential mechanism is increased collaboration with PCPs. The MTDM pharmacists are co-located in clinics with PCPs. This increased access could encourage greater patient–clinician interactions on an on-going basis that would not otherwise be possible in the traditional DM disease management model. The significant increase in the PCP visit rates among the MTDM patient cohort may reflect this. To the extent that increased PCP visits imply greater opportunity for surveillance, early detection, and prevention of potentially acute events, the increased PCP visit rate may be indicative of the underlying mechanism through which cost reductions and lower hospitalizations can be achieved. However, further studies are necessary to reveal the more precise mechanism.
Although we have mitigated the bias in our study design via propensity-score matching, which resulted in very close agreement on observed baseline characteristics between groups, we recognize that unmeasured confounding variables could also have influenced our unexpected findings. Our study observed and compared patients managed by an MTDM program and those not managed by an MTDM program after program implementation, and there may have been other dissimilar factors between cohorts that we did not measure or balance on. One example is baseline medication use, which in a post hoc analysis we noted had some differences between cohorts that could indicate differences in acuity or treatment (ie, the MTDM group had higher baseline use of insulin, sulfonylureas, metformin, meglitinides, and DPP4 inhibitors). We acknowledge that baseline differences like these, observed or unobserved, may have contributed to our results.
There are several additional potential limitations. The non-MTDM comparison group has been drawn from DM patients who were likely eligible for the MTDM program enrollment but were not referred to it by physicians for unknown reasons, implying a potential selection bias. We have attempted to mitigate this potential bias via an extensive propensity score matching algorithm. Additionally, if physicians were selecting higher-risk or more-difficult-to-manage patients into MTDM, our results are expected to underestimate the true effect. Another limitation is the unknown generalizability of the MTDM program beyond Geisinger. Although the MTDM program was designed to be scalable and generalizable,20 future studies are needed to examine the feasibility of similar MTDM programs elsewhere.
Finally, because patients were in an observational study and not adhering to a strict visit schedule, some patients were assigned as their end points the clinical values that were taken close to, rather than exactly at, the 12-month point. We attempted to assess the impact of this limitation by performing a sensitivity analysis as shown in Table 2, and the results were virtually identical. The patients considered “at goal” in this study, however, might not have remained so throughout the study period or vice versa. As such, future research could use longitudinal models to capture temporal dynamics between the clinical measures and the patients’ exposure to the MTDM program.
Conclusion
Despite the lack of impact on clinical surrogate outcomes, the results suggest that MTDM was associated with an overall lower cost of care and fewer hospitalizations. This finding is consistent with the expectation that pharmacist-led MTDM directly impact utilization and cost of care among a diabetic cohort and should be considered as an important member of a multidisciplinary team in the management of diabetes.
Acknowledgments
The authors would like to thank Michael A Evans, RPh, Associate Vice President of Strategy and Innovation at Geisinger and Joseph J Chronowski, MBA Senior Clinical Informatics Analyst at Geisinger, for their support of this study. The authors would also like to thank Michael Gionfriddo, Pharm D, PhD, Assistant Professor at Geisinger’s Center for Pharmacy Innovation and Outcomes, for his helpful comments. Funding for this study has been provided by GlaxoSmithKline. The authors also acknowledge that they were employees of Geisinger (DDM, JG, JH, and EAW) and GlaxoSmithKline (MB) during the time when this study was conducted. In addition, JG has received grants from PCORI, FDA, and Intarcia Therapeutics. MB is a shareholder of GlaxoSmithKline. DDM had full access to all the data in the study and takes responsibility for the integrity of the data and the accuracy of the data analysis.
The abstract of this paper was presented at the 77th Scientific Sessions of the American Diabetes Association, San Diego, June 9–13, 2017, as a poster presentation with interim findings. The poster’s abstract has been published online: https://professional.diabetes.org/sites/professional.diabetes.org/files/media/2017_ada_lb_abstracts_highres.pdf (Accessed May 17, 2018).
Disclosure
The authors report no conflicts of interest in this work.
References
Centers for Disease Control and Prevention. National Diabetes Statistics Report, 2017; 2017. Available from:https://www.cdc.gov/diabetes/pdfs/data/statistics/national-diabetes-statistics-report.pdf. Accessed August 30, 2018. | ||
American Diabetes Association. Economic costs of diabetes in the U.S. in 2012. Diabetes Care. 2013;36(4):1033–1046. | ||
Gaede P, Vedel P, Larsen N, Jensen GV, Parving HH, Pedersen O. Multifactorial intervention and cardiovascular disease in patients with type 2 diabetes. N Engl J Med. 2003;348(5):383–393. | ||
Saydah SH, Fradkin J, Cowie CC. Poor control of risk factors for vascular disease among adults with previously diagnosed diabetes. JAMA. 2004;291(3):335–342. | ||
Malik S, Lopez V, Chen R, Wu W, Wong ND. Undertreatment of cardiovascular risk factors among persons with diabetes in the United States. Diabetes Res Clin Pract. 2007;77(1):126–133. | ||
American Diabetes Association. 1. Improving care and promoting health in populations: standards of medical care in diabetes – 2018. Diabetes Care. 2018;41(Suppl 1):S7–S12. | ||
Fazel MT, Bagalagel A, Lee JK, Martin JR, Slack MK. Impact of diabetes care by pharmacists as part of health care team in ambulatory settings: a systematic review and meta-analysis. Ann Pharmacother. 2017;51(10):890–907. | ||
Yaghoubi M, Mansell K, Vatanparastc H, Steeves M, Zeng W, Farag M. Effects of pharmacy-based interventions on the control and management of diabetes in adults: a systematic review and meta-analysis. Can J Diabetes. 2017;41(6):628–641. | ||
Quan H, Sundararajan V, Halfon P, et al. Coding algorithms for defining comorbidities in ICD-9-CM and ICD-10 administrative data. Med Care. 2005;43(11):1130–1139. | ||
Austin PC. Balance diagnostics for comparing the distribution of baseline covariates between treatment groups in propensity-score matched samples. Stat Med. 2009;28(25):3083–3107. | ||
Cameron AC, Trivedi PK. Microeconometrics Using Stata. Stata Press; 2008. College Station, Texas. | ||
Romanelli RJ, Leahy A, Jukes T, Ishisaka DY. Pharmacist-led medication management program within a patient-centered medical home. Am J Health Syst Pharm. 2015;72(6):453–459. | ||
Scott DM, Boyd ST, Stephan M, Augustine SC, Reardon TP. Outcomes of pharmacist-managed diabetes care services in a community health center. Am J Health Syst Pharm. 2006;63(21):2116–2122. | ||
Taveira TH, Friedmann PD, Cohen LB, et al. Pharmacist-led group medical appointment model in type 2 diabetes. Diabetes Educ. 2010;36(1):109–117. | ||
Cohen LB, Taveira TH, Khatana SA, Dooley AG, Pirraglia PA, Wu WC. Pharmacist-led shared medical appointments for multiple cardiovascular risk reduction in patients with type 2 diabetes. Diabetes Educ. 2011;37(6):801–812. | ||
Ko JJ, Lu J, Rascati K, et al. Analysis of glycemic control of a pharmacist-led medication management program in patients with type 2 diabetes. J Manag Care Spec Pharm. 2016;22(1):32–37. | ||
Santschi V, Chiolero A, Paradis G, Colosimo AL, Burnand B. Pharmacist interventions to improve cardiovascular disease risk factors in diabetes: a systematic review and meta-analysis of randomized controlled trials. Diabetes Care. 2012;35(12):2706–2717. | ||
Lipska KJ, Ross JS, Miao Y, Shah ND, Lee SJ, Steinman MA. Potential overtreatment of diabetes mellitus in older adults with tight glycemic control. JAMA Intern Med. 2015;175(3):356–362. | ||
Rodríguez-Gutiérrez R, Montori VM. Glycemic control for patients with type 2 diabetes mellitus: our evolving faith in the face of evidence. Circ Cardiovasc Qual Outcomes. 2016;9(5):504–512. | ||
Jones LK, Greskovic G, Grassi DM, et al. Medication therapy disease management: Geisinger’s approach to population health management. Am J Health Syst Pharm. 2017;74(18):1422–1435. |
Supplementary materials
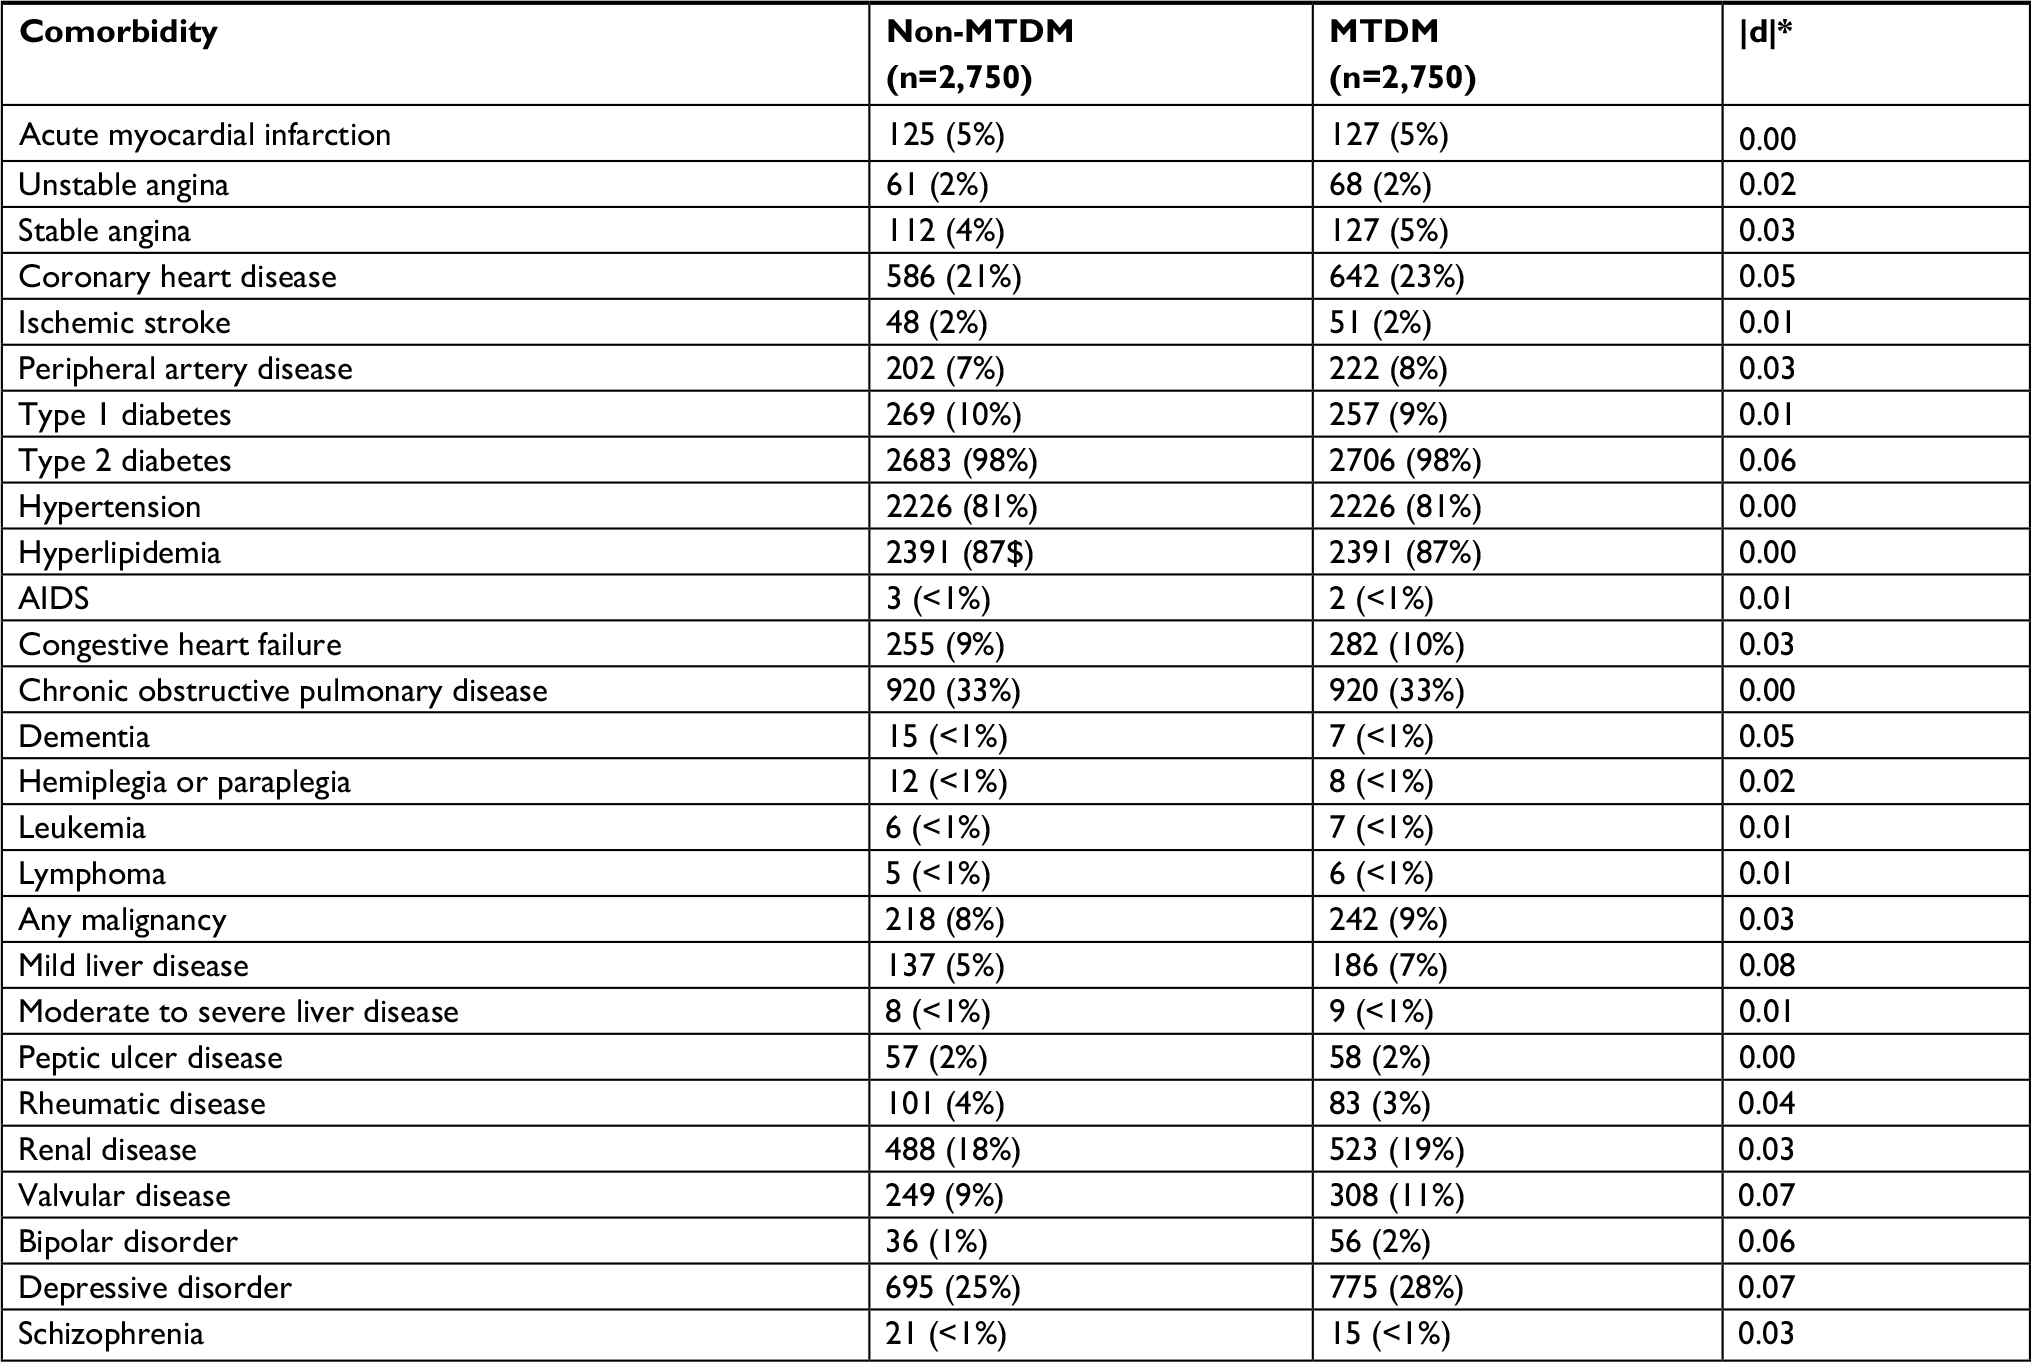 | Table S1 Baseline comorbidities/medical history of the two cohorts Note: *|d| denotes standardized difference in means or percentages. Abbreviation: MTDM, medication therapy disease management. |
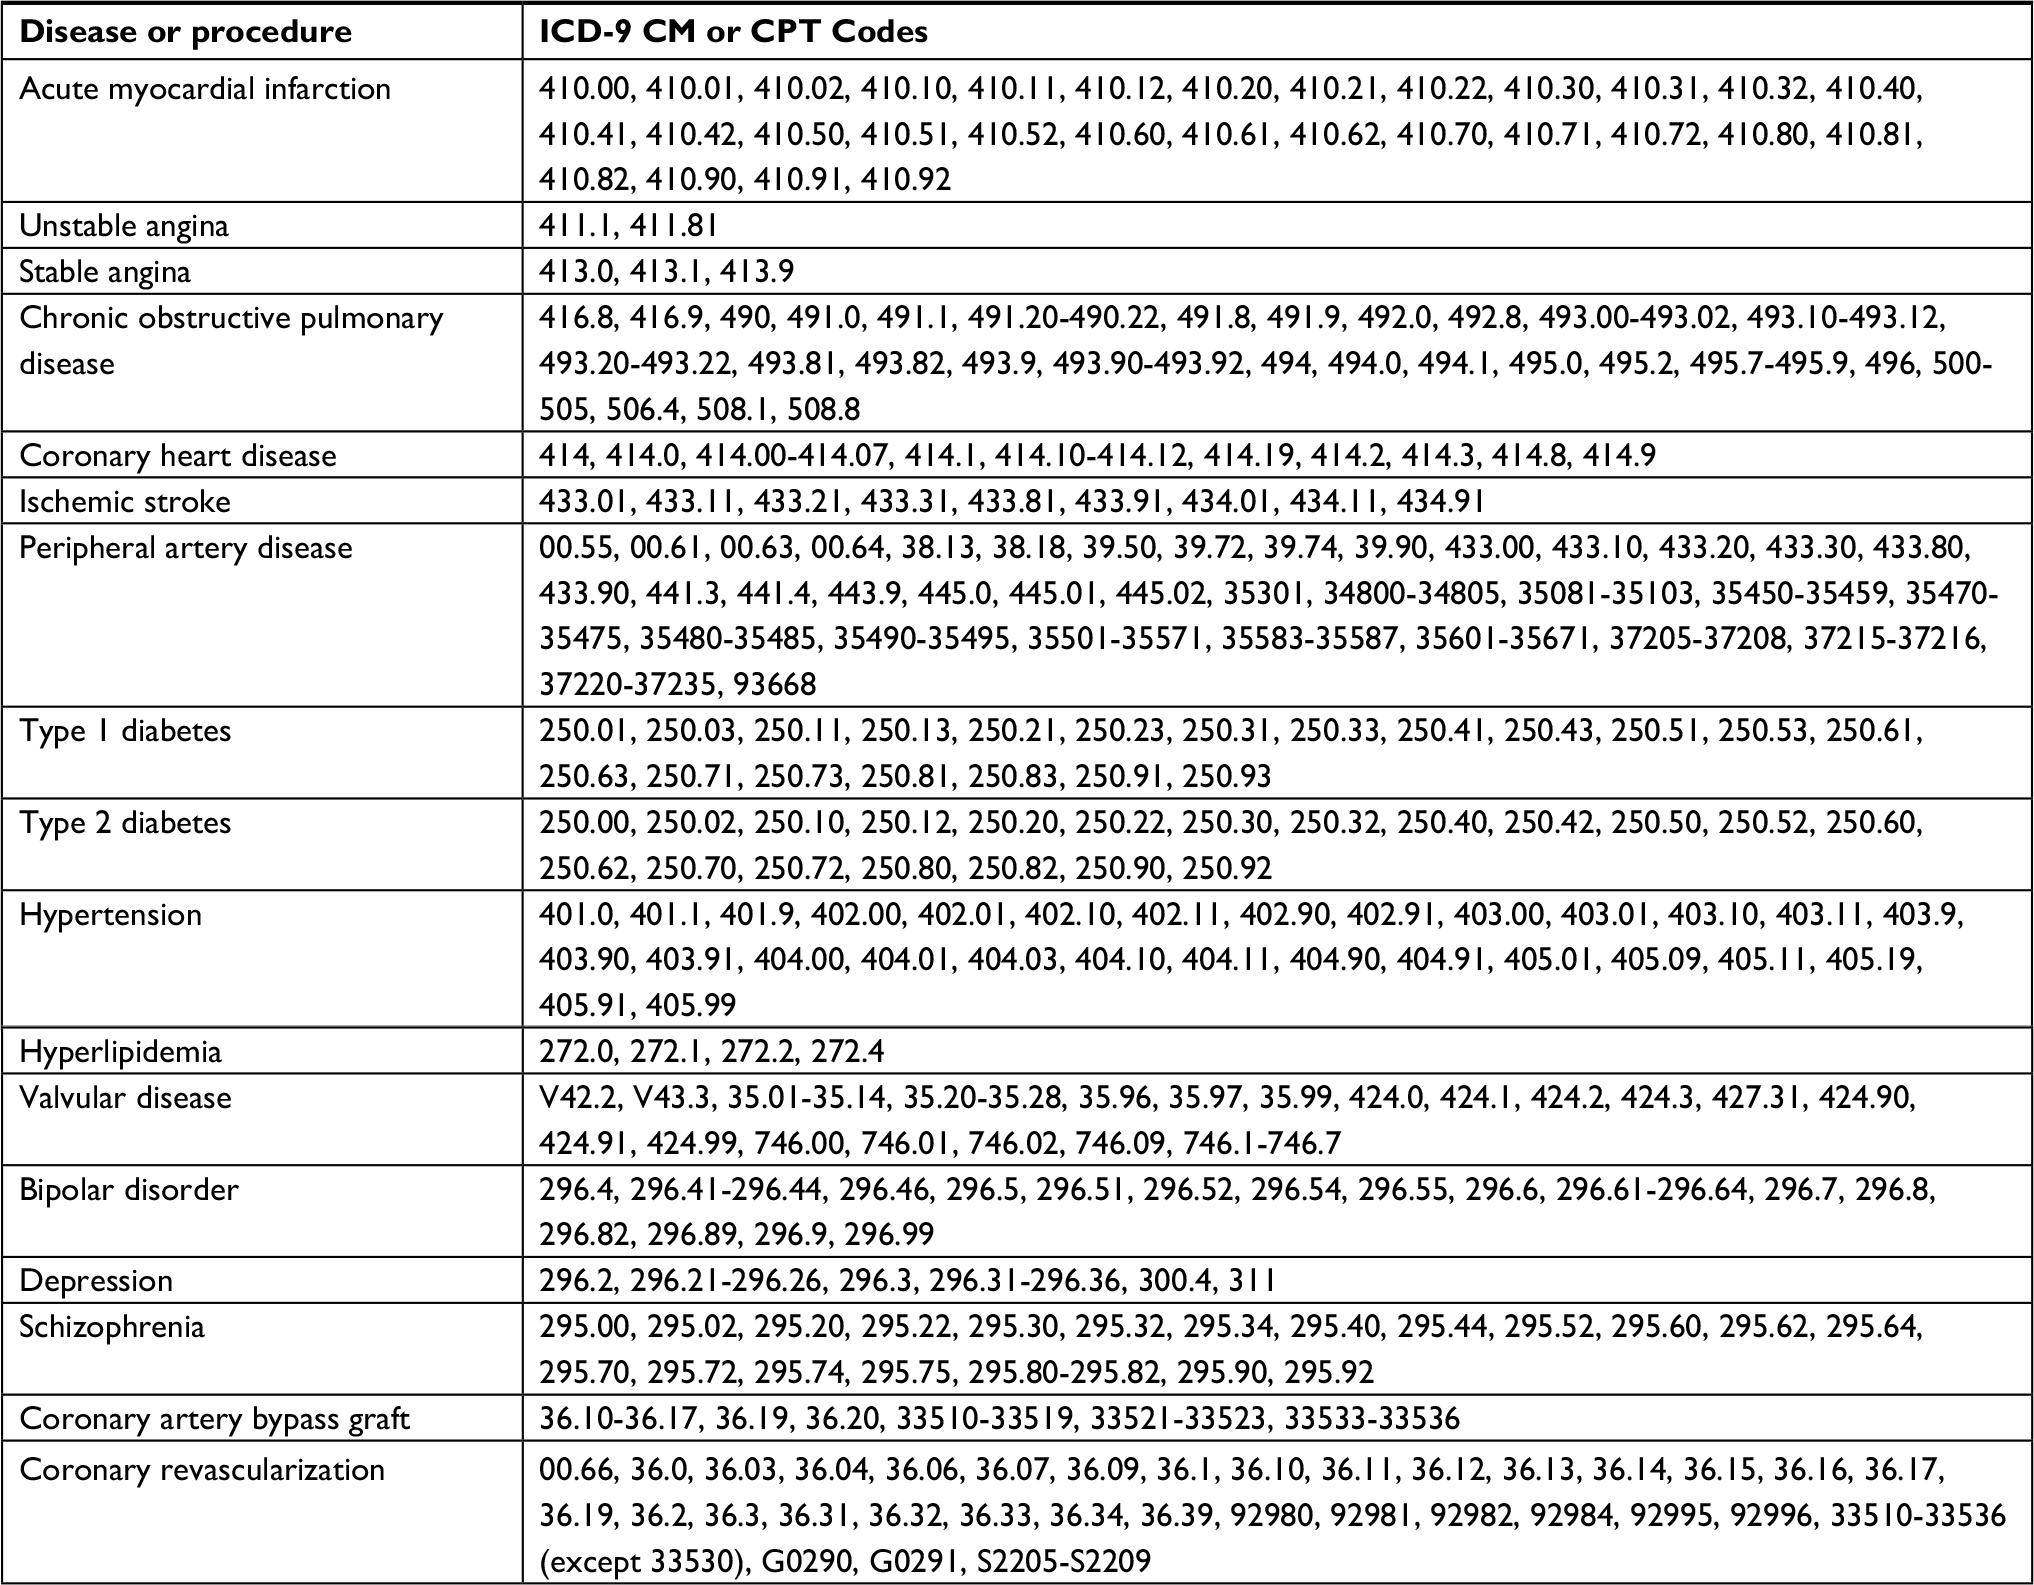 | Table S2 Codes used for identification of comorbid conditions |
 © 2018 The Author(s). This work is published and licensed by Dove Medical Press Limited. The full terms of this license are available at https://www.dovepress.com/terms.php and incorporate the Creative Commons Attribution - Non Commercial (unported, v3.0) License.
By accessing the work you hereby accept the Terms. Non-commercial uses of the work are permitted without any further permission from Dove Medical Press Limited, provided the work is properly attributed. For permission for commercial use of this work, please see paragraphs 4.2 and 5 of our Terms.
© 2018 The Author(s). This work is published and licensed by Dove Medical Press Limited. The full terms of this license are available at https://www.dovepress.com/terms.php and incorporate the Creative Commons Attribution - Non Commercial (unported, v3.0) License.
By accessing the work you hereby accept the Terms. Non-commercial uses of the work are permitted without any further permission from Dove Medical Press Limited, provided the work is properly attributed. For permission for commercial use of this work, please see paragraphs 4.2 and 5 of our Terms.