")
Back to Journals » International Journal of Chronic Obstructive Pulmonary Disease » Volume 16
Immune Characteristics Analysis and Transcriptional Regulation Prediction Based on Gene Signatures of Chronic Obstructive Pulmonary Disease
Authors Yu H, Guo W, Liu Y, Wang Y
Received 21 June 2021
Accepted for publication 27 September 2021
Published 5 November 2021 Volume 2021:16 Pages 3027—3039
DOI https://doi.org/10.2147/COPD.S325328
Checked for plagiarism Yes
Review by Single anonymous peer review
Peer reviewer comments 2
Editor who approved publication: Dr Richard Russell
Hui Yu,1 Weikang Guo,2 Yunduo Liu,2 Yaoxian Wang2
1Cardiopulmonary Function Department, Harbin Medical University Cancer Hospital, Harbin, Heilongjiang, 150081, People’s Republic of China; 2Gynecological Department, Harbin Medical University Cancer Hospital, Harbin, Heilongjiang, 150081, People’s Republic of China
Correspondence: Yaoxian Wang
Gynecological Department, Harbin Medical University Cancer Hospital, No. 150 Haping Road, Nangang District, Harbin, Heilongjiang, 150081, People’s Republic of China
Tel +86-0451-86298578
Email [email protected]
Purpose: The variation in inflammation in chronic obstructive pulmonary disease (COPD) between individuals is genetically determined. This study aimed to identify gene signatures of COPD through bioinformatics analysis based on multiple gene sets and explore their immune characteristics and transcriptional regulation mechanisms.
Methods: Data from four microarrays were downloaded from the Gene Expression Omnibus database to screen differentially expressed genes (DEGs) between COPD patients and controls. Weighted gene co-expression network analysis was applied to identify trait-related modules and then select key module-related DEGs. The optimized gene set of signatures was obtained using the least absolute shrinkage and selection operator (LASSO) regression analysis. The CIBERSORT algorithm and Pearson correlation test were used to analyze the relationship between gene signatures and immune cells. Finally, public databases were used to predict the transcription factors (TFs) and upstream miRNAs.
Results: A total of 127 DEGs in COPD were identified from the combined dataset. By considering the intersection of DEGs and genes in two trait-related modules, 83 key module-related DEGs were identified, which were mainly enriched in interleukin-related pathways. Seven-gene signatures, including MTHFD2, KANK3, GFPT2, PHLDA1, HS3ST2, FGG, and RPS4Y1, were further selected using the LASSO algorithm. These gene signatures showed the predictive potential for COPD risks and were significantly correlated with 18 types of immune cells. Finally, nine miRNAs and three TFs were predicted to target MTHFD2, GFPT2, PHLDA1, and FGG.
Conclusion: We proposed the seven-gene-signature to predict COPD risk and explored its potential immune characteristics and regulatory mechanisms.
Keywords: COPD, gene signatures, immune infiltration, transcriptional regulation
Highlights
1. Key module-related DEGs in COPD were found to involve in interleukin-related pathways.
2. An optimized gene set, including seven-gene signatures, was identified using LASSO analysis.
3. The seven-gene signature was significantly correlated with 18 types of immune cells in COPD.
4. The upstream miRNAs and TFs of gene signatures were predicted.
Introduction
Chronic obstructive pulmonary disease (COPD) is a complex heterogeneous disease characterized by persistent respiratory symptoms and airflow limitation because of respiratory and/or alveolar abnormalities.1,2 A forced expiratory volume in 1s (FEV1)/forced vital capacity (FVC) less than 0.70 after using bronchodilators is a necessary condition for the diagnosis of COPD.3 It is estimated to cause more than three million deaths worldwide annually, affecting about one in 10 adults aged over 45.4,5 Although smoking is the leading cause of COPD, the unsatisfactory prevalence of COPD in non-smokers suggests that chronic inflammation in patients may be caused by different cellular and pathophysiological changes in different genetic backgrounds.6 Some studies believe that genetic risk factors contribute to the development of airflow restriction, and the huge variation in lung inflammation between individuals is also genetically determined.7 Therefore, effective biomarkers are needed to predict risk and guide personalized treatment of patients with COPD.
Biomarkers are of great significance in the diagnosis, prognosis, and treatment of diseases. In recent years, many clinically relevant COPD biomarkers, including plasma fibrinogen, CRP, IL-6, IL-8, total bilirubin, SAA, SP-D, CCSP-16, MMP-8, and MMP-9, have been developed using the candidate gene approach.8–12 However, the influence of a single biomarker is often limited in predicting the disease. It has been reported that multiple biomarkers are more powerful than a single biomarker, and their combination with clinical variables can better predict disease progression.13 Based on shared data from high-throughput sequencing and microarray technology, it is possible to observe changes in the expression of numerous genes in different samples at one time.14 Moreover, bioinformatics methods that integrate multiple datasets can help identify reliable and repeatable genetic signatures associated with disease development.15 Therefore, data from four microarrays were used to analyze differentially expressed genes (DEGs) in this study. Then, a weighted gene co-expression network analysis (WGCNA) and the least absolute shrinkage and selection operator (LASSO) regression analysis were performed to obtain the optimized gene set from the trait-related module, which was also shown to have a great predictive ability among COPD patients.
Additionally, inflammation in the lungs of patients with COPD is associated with abnormal immune responses, and both the innate and adaptive immune systems are involved, linked by the activation of dendritic cells.16 Furthermore, an increase in the number of macrophages, neutrophils, and T and B lymphocytes has also been observed in the COPD process, and they are recruited in the immune cycle. They can secrete proinflammatory factors, such as cytokines, chemokines, growth factors, and lipid mediators.17,18 Considering the key roles of these immune cells, we attempted to identify the changes in the immune microenvironment defined by the gene signatures selected above and explain the molecular regulation mechanisms of upstream transcription factors (TFs) and miRNAs. A flowchart of this study is presented in Figure S1.
Methods
Data Acquisition and Process
All data were downloaded from the Gene Expression Omnibus database (GEO, http://www.ncbi.nlm.nih.gov/geo/). Using COPD, lung, and smokers as keywords, the relevant data of humans in the last five years were searched, and a total of four microarrays were obtained, including GSE37768, GSE106986, GSE103174, and GSE76925. Among them, GSE37768 included 18 lung tissue samples from COPD patients and nine healthy smokers and non-smokers, which were detected by GPL570 [HG-U133_Plus_2] Affymetrix Human Genome U133 Plus 2.0 Array; GSE106986 included 14 lung tissue samples from COPD patients and five healthy non-smoker samples, which were detected by GPL13497 Agilent-026652 Whole Human Genome Microarray 4×44K v2; GSE103174 included 37 lung tissue samples from COPD patients and 10 healthy non-smoker samples which were detected by GPL13667 [HG-U219] Affymetrix Human Genome U219 Array; GSE76925 included 111 COPD samples and 40 smoker control samples which were detected by GPL10558 Illumina HumanHT-12 V4.0 expression beadchip. Among them, GSE76925 was used for the external validation. The detailed clinical information of the samples from these four datasets is summarized in Table S1.
Data Pre-Processing
The standardized probe expression value matrices of the above datasets were downloaded from GEO, and annotation files were downloaded from the corresponding platforms. Probes that did not match the gene symbol were removed, and when different probes were mapped to the same gene, the mean value of the probes was taken. Based on GSE37768, GSE106986, and GSE103174, the ComBat function in R sva (version 3.34.0, http://www.bioconductor.org/packages/release/bioc/html/sva.html)19,20 was used to remove the batch effect, and a combined dataset was obtained for further analysis.
DEGs Analysis
To analyze the expression differences between COPD samples and controls in the combined dataset, the Limma package (version 3.10.3, http://www.bioconductor.org/packages/release/bioc/html/limma.html)21 was used. The p-value obtained after the t-test was corrected by multiple tests using the Benjamini & Hochberg (BH) method, and the results were then evaluated in terms of difference multiples and significance. Adjusted p-value < 0.05, and |log fold change (FC)| > 0.585 were set as standards to select DEGs.
WGCNA
Genes with an absolute deviation of median expression in the top 2000 were selected for the WGCNA algorithm (version 1.61, https://cran.r-project.org/web/packages/WGCNA/).22 WGCNA defined the correlation matrix of gene co-expression and the power exponential linkage function of the gene network, and the power value was captured when the square value of the correlation coefficient reached 0.9 for the first time. Then, a hierarchical clustering tree was constructed by calculating the dissimilitude degree of different nodes. The module was screened with a minimum number of genes in each gene network set to 30 and a pruning cut height of 0.3. Finally, the trait-related module was identified by analyzing the correlation between the module and disease phenotype with standards of p < 0.05 and |r| > 0.3. By considering the intersection of DEGs and genes in trait-related modules, key module-related DEGs were screened out using the R package VennDiagram (version 1.6.20, https://CRAN.R-project.org/package=VennDiagram).23
Enrichment Analysis
Based on the key module-related DEGs obtained above, over-representation analysis in the functional profiling module of gprofiler online tools (https://biit.cs.ut.ee/gprofiler/convert)24 was performed for gene ontology (GO) functions25 and pathways26 enrichment analyses. GO functions included biological process (BP), cellular component (CC), and molecular function (MF), whereas pathways were enriched in the Kyoto Encyclopedia of Genes and Genomes (KEGG) and Reactome databases. BH adjusted p < 0.05 was considered statistically significant.
Screening and Validation of Gene Signatures
The key module-related DEGs were then incorporated into the LASSO regression model using the glmnet package (version 4.0–2, https://cran.r-project.org/web/packages/glmnet/index.html),27 and the gene signatures were obtained with 20-fold cross-validation. Gene signatures were further verified on the combined datasets and GSE76925 by constructing a support vector machine (SVM) model using the e1071 SVM package (version 1.7–4, https://CRAN.R-project.org/package=e1071).28 Receiver operator characteristic (ROC) curves were also created to verify the accuracy of the model.
Immune Cell Infiltration Analysis
The CIBERSORT deconvolution algorithm (https://cibersort.stanford.edu/index.php)29 was used to estimate the infiltration abundance of 22 types of immune cells in each sample of the combined datasets, with the parameters set as perm = 100 and QN = F. Then, the Wilcoxon test was used to analyze the differences in the abundance of immune cell infiltration between the COPD and control groups, and a violin plot was created using the vioplot in R package (version 0.3.5, https://github.com/TomKellyGenetics/vioplot).30 Finally, the Pearson correlation coefficient of gene signatures and immune cell infiltration abundance was calculated, and relation pairs (p < 0.05) were selected.
Predicting Upstream TFs and miRNA of Gene Signatures
The relationships between miRNA and gene signatures were predicted using miRWalk 3.0 (http://zmf.umm.uni-heidelberg.de/apps/zmf/mirwalk3.html).31 The relationship pairs appearing in both miRDB (http://www.mirdb.org/miRDB/download.html)32 and miRTarBase (http://mirtarbase.cuhk.edu.cn/php/index.php)33 databases with scores over 0.9 were selected to construct a miRNA regulatory network. The TH-mRNA relations were predicted in the TRRUST database (https://www.grnpedia.org/trrust/),34 and the TF-mRNA and miRNA-mRNA relation pairs were integrated into a TF-mRNA-miRNA network.
Results
Screening of DEGs Between COPD and Healthy Controls
To remove the batch effect between GSE37768, GSE106986, and GSE103174, a principal component analysis was performed, and a combined dataset was obtained with thresholds of |logFC| > 0.585 and adjusted p < 0.05. A total of 127 DEGs between COPD and control samples in the combined dataset were screened out, as shown in Figure 1A. Detailed information on these DEGs is presented in Table S2. Among them, 104 DEGs were up-regulated, and 23 DEGs were down-regulated (Figure 1B).
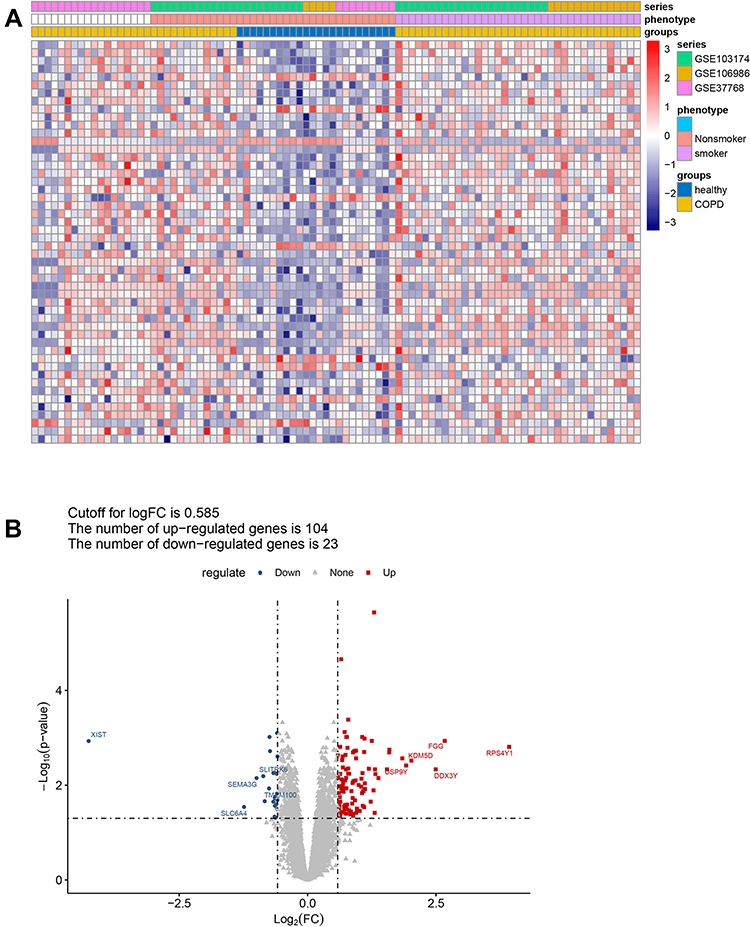 |
Figure 1 Screening of DEGs between COPD and healthy controls. (A) The heatmap shows the DEGs between COPD and control samples from the combined dataset of GSE37768, GSE106986, and GSE103174, with thresholds of |logFC| > 0.585 and adjusted p < 0.05. (B) Volcano plot showing up-regulated (red) and down-regulated (blue) DEGs. The top five up-regulated and down-regulated DEGs ranked by |logFC| are labeled in red and blue, respectively. Abbreviations: COPD, chronic obstructive pulmonary disease; FC, fold change. |
WGCNA to Identify Trait-Related Modules and Key Genes
The WGCNA algorithm was then used to select trait-related modules and key genes. To satisfy the premise of a scale-free network distribution, the value of the power (weight parameter) of the adjacency matrix was explored. The selection range of network construction parameters was first set, then the scale-free distribution topology matrix was calculated, and the graph was created as shown in Figure 2A. When the square value of the correlation coefficient reaches 0.9 for the first time, the value of power is 6. A systematic cluster tree was obtained by calculating the coefficient of dissimilarity between genes. Then, the dynamic mixing cutting method was used to divide the modules, and finally, eight disease-related modules were obtained and labeled with different colors (Figure 2B). The genes involved in each module are listed in Table S3. Thereafter, the correlation between modules and disease traits was evaluated by calculating the correlation coefficient between the gene significance of each module and the diseased trait. The results (Figure 2C) suggested that module turquoise and module yellow had the highest correlation with disease traits, and these two modules were also identified as trait-related modules. By considering the intersection of genes in trait-related modules and DEGs obtained above, a total of 83 common genes were identified as key module-related DEGs (Figure 2D, Table S4). Among them, 16 DEGs in module yellow were down-regulated, and 67 DEGs in module turquoise were up-regulated.
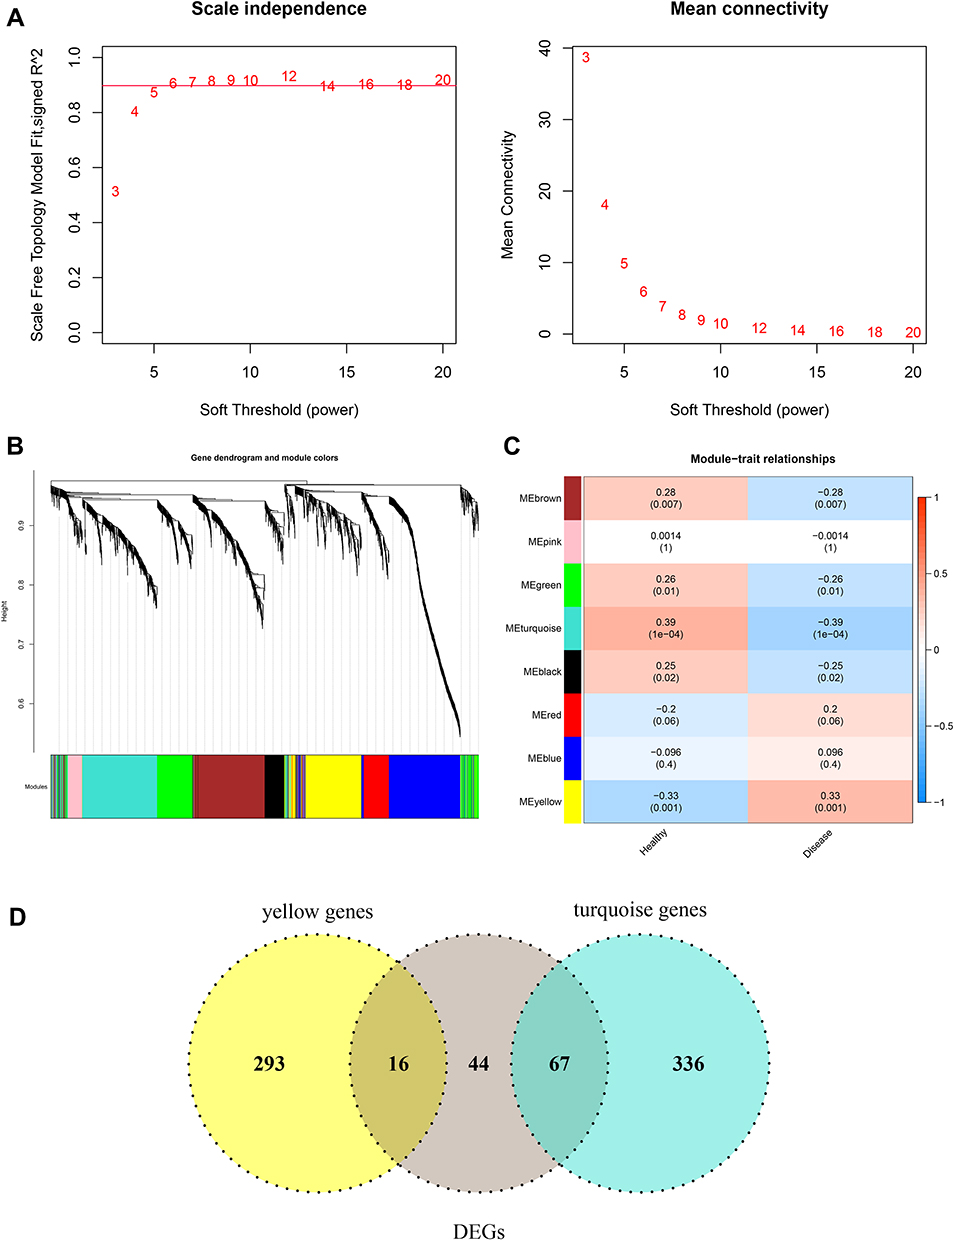 |
Figure 2 WGCNA algorithm was conducted to identify trait-related modules and genes. (A) Selection of power, weight parameter of the adjacency matrix. The x-axis represents the soft threshold (power), whereas the y-axis represents the square of the correlation coefficient between log2k and log2p(k) in the network. The red line represents the standard line, where the square value of the correlation coefficient reaches 0.9. (B) Module partition tree. The upper diagram represents the systematic cluster tree, and the different colors in the lower dynamic tree cut represent different gene modules. (C) Correlation between each module and disease traits. Statistical significance was set at p < 0.05. (D) The Venn plot shows the key module-related DEGs by taking the intersection of genes in trait modules and DEGs in COPD. Abbreviation: DEG, differential expressed gene. |
Functions and Pathways Enrichment Analyses
Based on the key module-related DEGs, enrichment analyses were performed to investigate their functions and pathways they may be involved in. As a result, 626 GO-BP, 13 GO-MF, 22 KEGG pathways, and 12 Reactome pathways were enriched. The top five results of each term ranking by p-value are shown in Figure 3A and B. It can be observed that these key module-related DEGs were mainly enriched in GO-BP of the response of cytokine and cellular response to cytokine stimulus; GO-MF of cytokine and chemokine activities; KEGG pathways of IL-17 and TNF signaling pathways; and Reactome pathways of IL-4, IL-13, and IL-10 signaling pathways. The genes involved in these key functions and pathways are listed in Table S5.
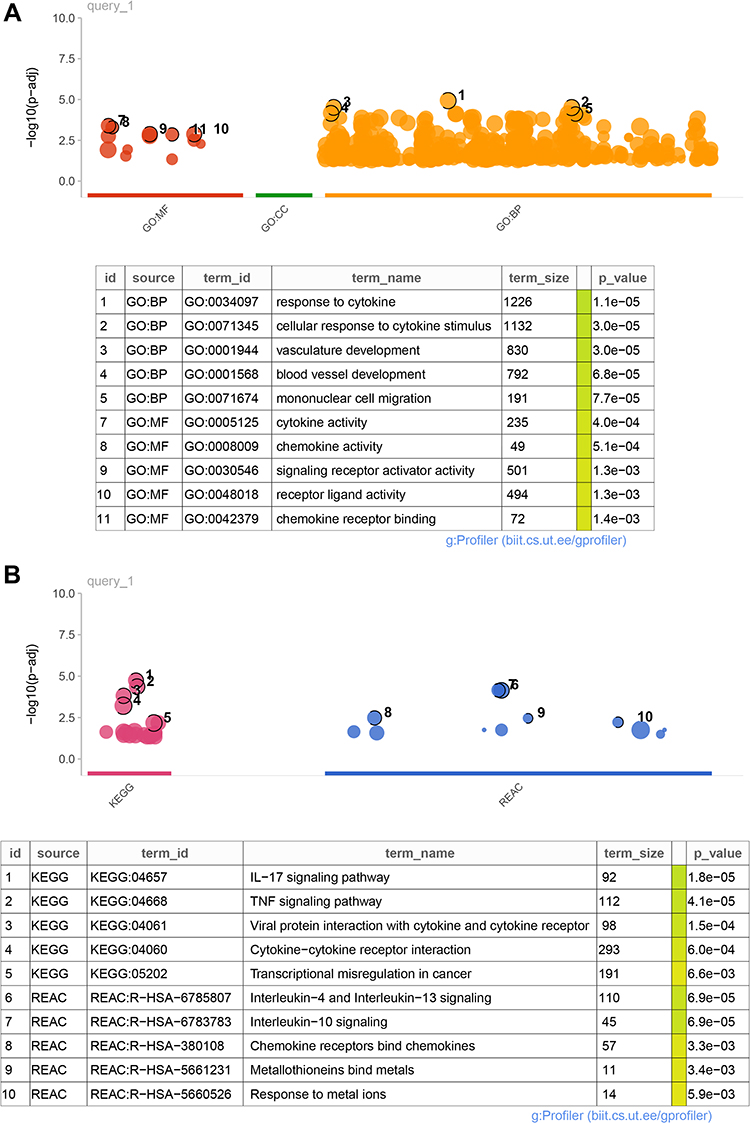 |
Figure 3 Functions and pathways enrichment analyses. (A) Top5 GO functions enriched in BP and MF. (B) Top5 KEGG pathways and Reactome pathways were enriched. The results of each term were sorted using p-values. Abbreviations: GO, gene ontology; MF, molecular function; CC, cellular component; BP, biological process; KEGG, Kyoto Encyclopedia of Genes and Genomes; REAC, Reactome; IL, interleukin; TNF, tumor necrosis factor. |
Identification of Gene Signatures
LASSO regression analysis was further performed to select the optimized gene set, and the parameters of the LASSO model are shown in Figure 4A. As a result, MTHFD2, KANK3, GFPT2, PHLDA1, HS3ST2, FGG, and RPS4Y1 were included in the optimized gene set when the lambda value was close to lambda.1se, and were thus identified as gene signatures. The expression of these gene signatures was then validated in the combined dataset (Figure 4B), and the results suggested that they were all significantly differentially expressed between COPD and healthy samples. ROC curves were also created to evaluate the efficacy of the seven-gene-signature in predicting COPD, as shown in Figure 4C and D. The results suggested that the area under the curve (AUC) created for the combined dataset was 0.795, whereas the AUCs of GSE37768, GSE106986, GSE103174, and GSE76925 were all over 0.700, thereby indicating a good predictive ability of gene signatures in COPD.
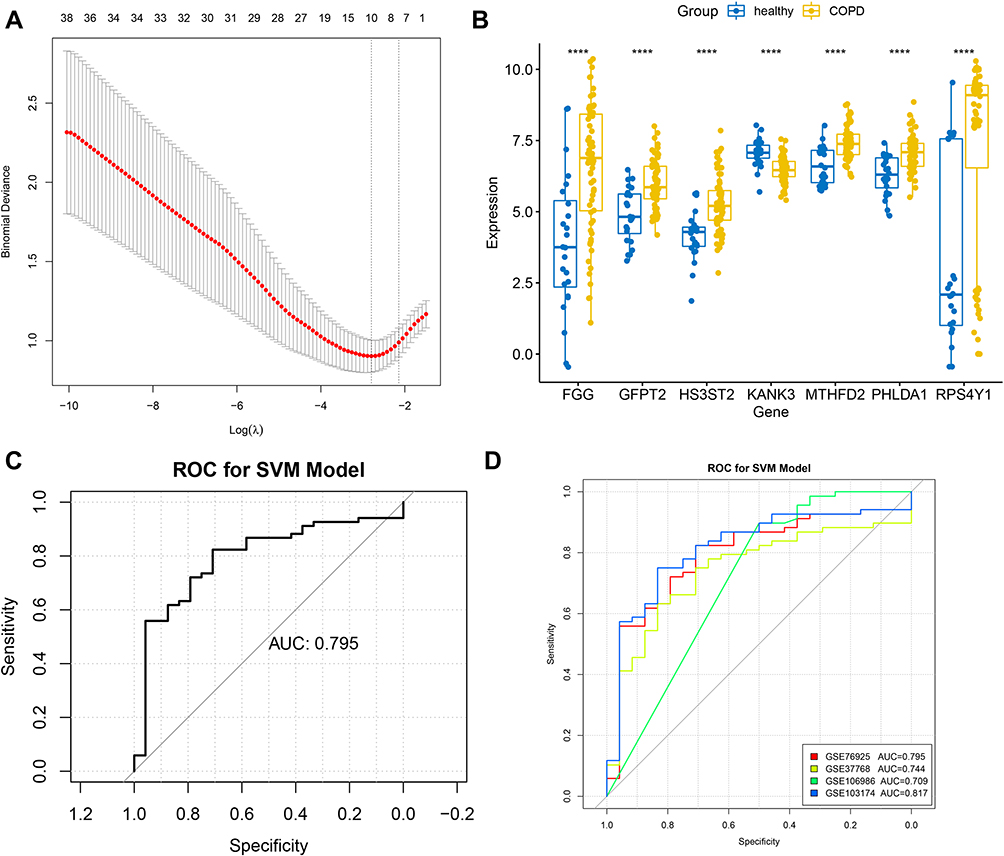 |
Figure 4 Identification of gene signatures using LASSO regression analysis. (A) The optimized gene set with seven DEGs was selected as the gene signature when the lambda value was close to lambda.1se. (B) Validation of gene signatures in the combined dataset. ****p < 0.0001. (C) ROC curve created for the combined dataset. (D) The ROC curves of GSE37768, GSE106986, GSE103174, and GSE76925. Abbreviations: ROC, receiver operator characteristic; SVM, support vector machine; AUC, area under the curve. |
Correlation Analysis of Gene Signatures and Immune Cell Infiltration Abundance
As described in the Methods section, the infiltration abundances of 22 types of immune cells were calculated for each sample. The differences in infiltration abundance between the COPD and control samples were analyzed, as shown in Figure 5A. The results suggested that fractions of plasma cells, CD8 T cells, resting NK cells, activated dendritic cells, and activated mast cells were significantly different between the two groups (p < 0.05). Thereafter, the correlation coefficients between gene signatures and immune cells were calculated, and relationships with p < 0.05 were considered statistically significant. As shown in Figure 5B and Table 1, FGG, GFPT2, HS3ST2, KANK3, MTHFD2, PHLDA1, and RPS4Y1 were significantly correlated with six, eight, eight, six, eleven, ten, and four types of immune cells. In these 53 gene-cell relationships, plasma cells were significantly related to MTHFD2, GFPT2, PHLDA1, HS3ST2, and RPS4Y1; CD8 T cells were significantly related to six gene signatures except PHLDA1; resting NK cells were significantly related to six gene signatures except RPS4Y1; activated dendritic cells were significantly related to FGG and PHLDA1; and activated mast cells were significantly related to five gene signatures except KANK3 and RPS4Y1.
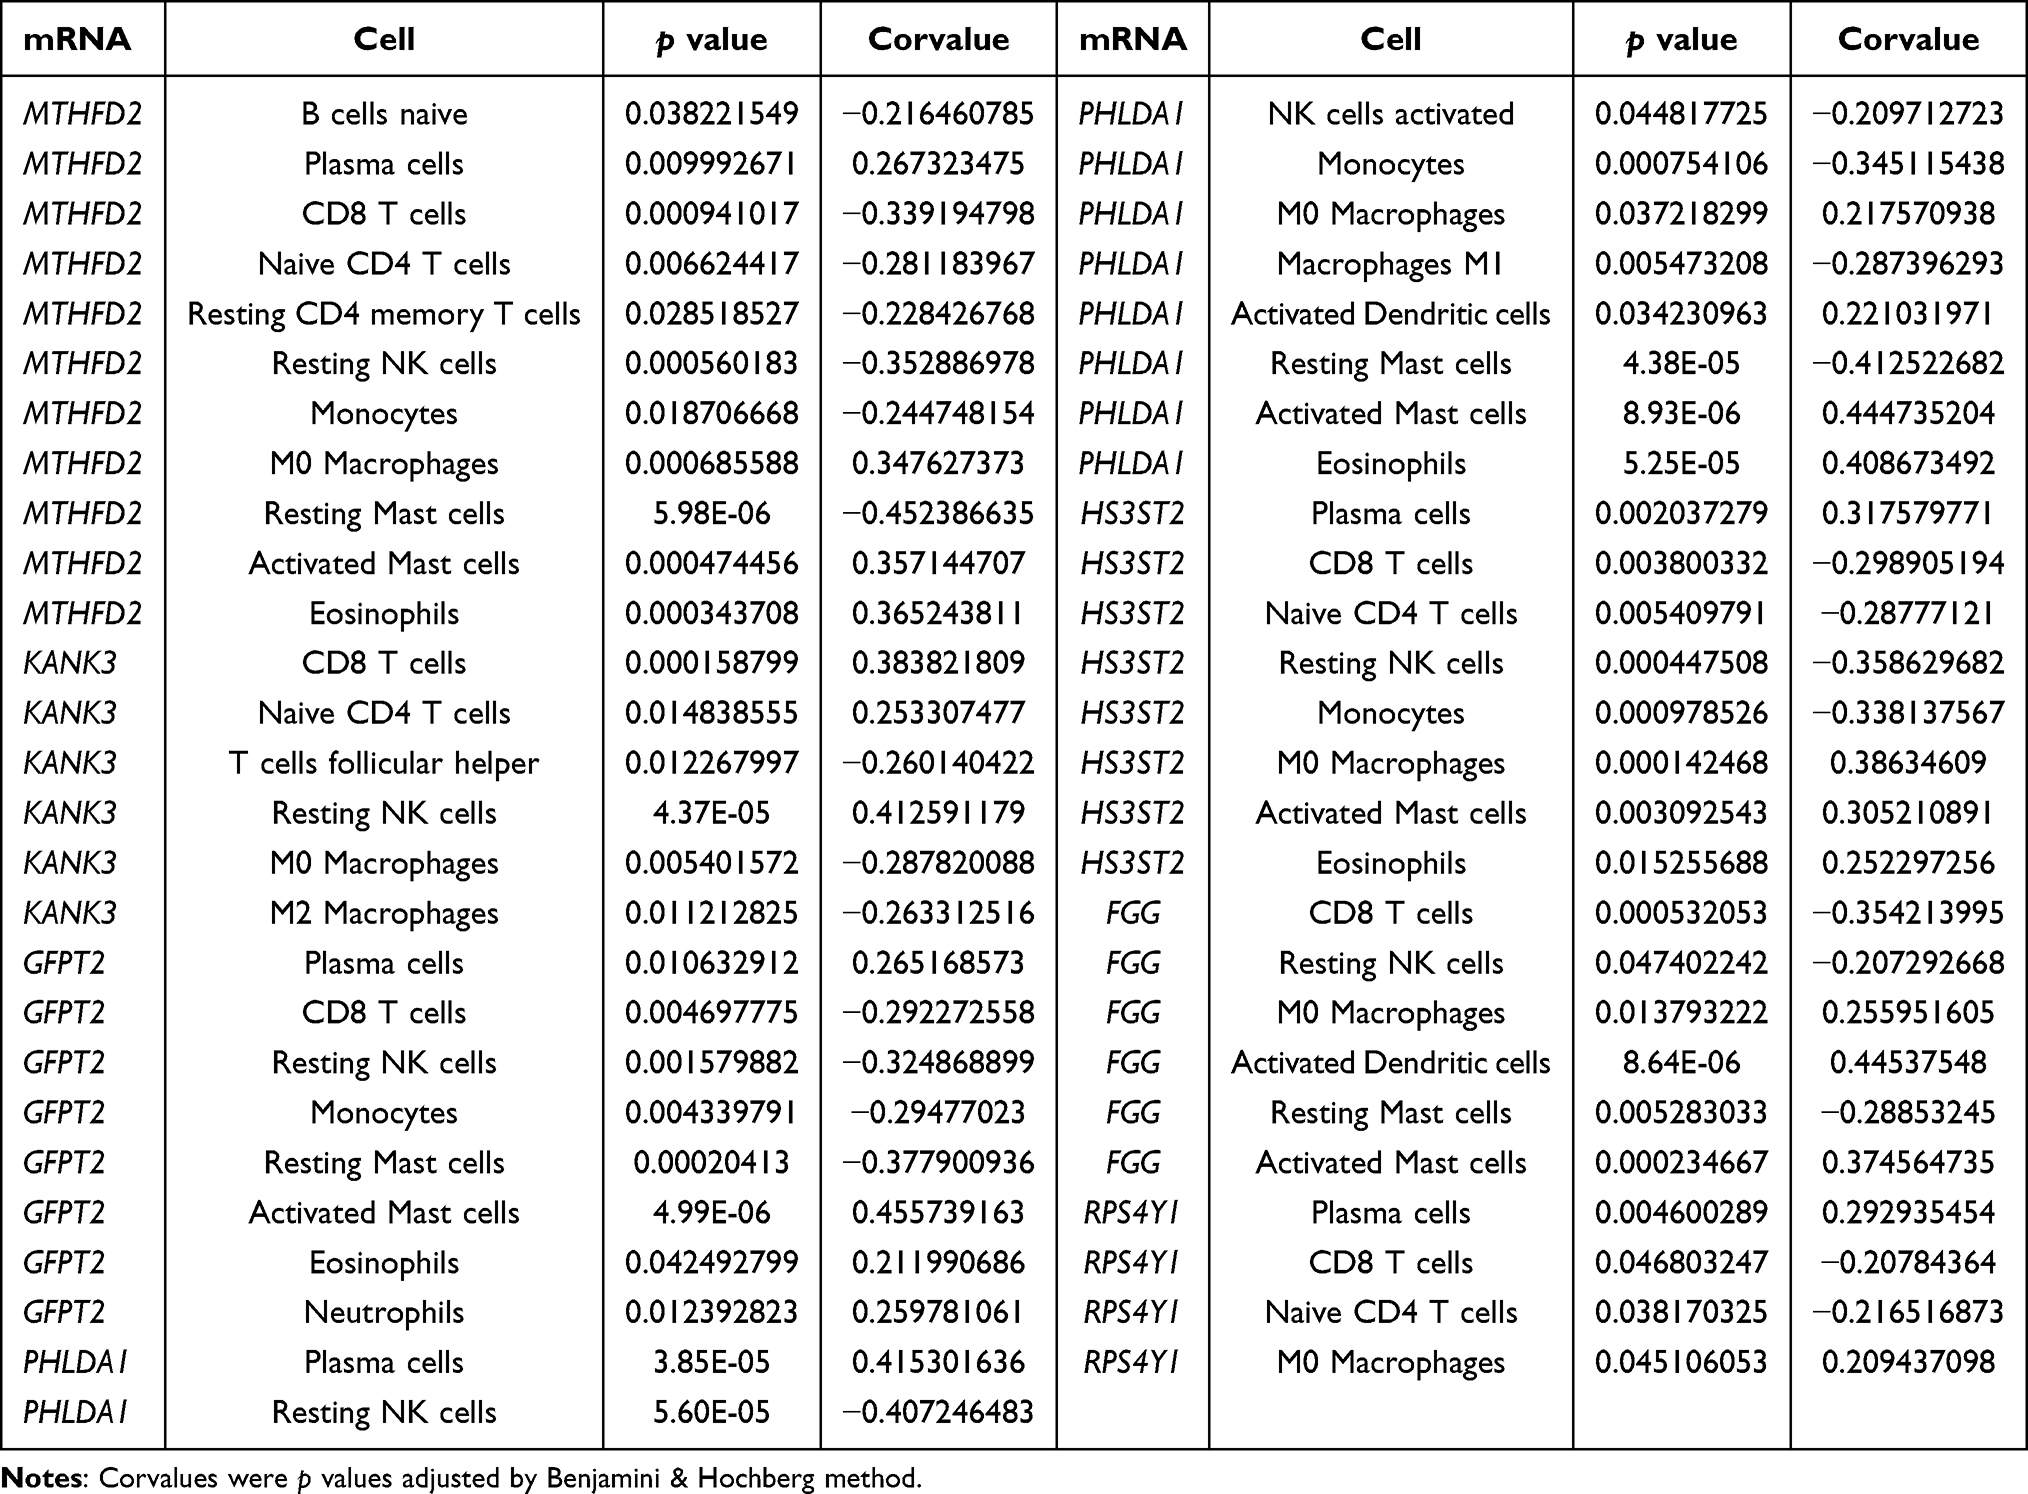 |
Table 1 Correlations Between Gene Signatures and Immune Cells |
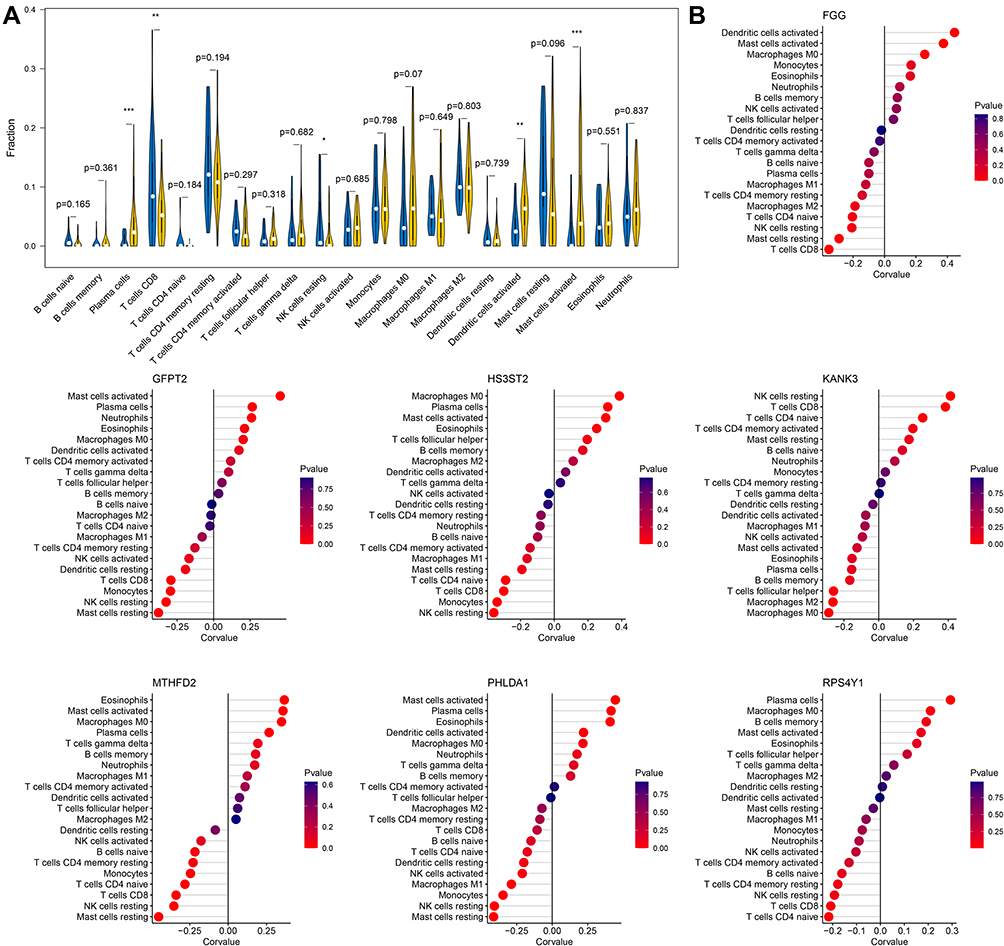 |
Figure 5 Correlation analysis of gene signatures and immune cells. (A) The violin plot shows differences in immune cell fractions between COPD and control samples. Yellow and blue bars represent the cases and controls, respectively. *0.01<p < 0.05; **0.001<p < 0.01; ***p < 0.001. (B) Correlation analysis of seven-gene signatures and 21 types of immune cells. Statistical significance was set at p < 0.05. |
Construction of a miRNA-mRNA-TF Network
In the miRWalk database, a total of nine upstream miRNAs were predicted to target with three gene signatures, including GFPT2, MTHFD2, and PHLDA1, and nine miRNA-mRNA relation pairs were obtained. Furthermore, two TFs were predicted to target PHLDA1 and FGG, and three mRNA-TF relation pairs were obtained. By integrating miRNA-mRNA and mRNA-TF relations, a miRNA-mRNA-TF network comprising 16 nodes and 12 regulatory axes was established, as shown in Figure 6. Notably, all mRNAs in this network were up-regulated DEGs in the turquoise module. Among them, PHLDA1 was identified as the hub gene that interacts with the miRNA (miR4316) and the TFs (FLI1 and EWSR1).
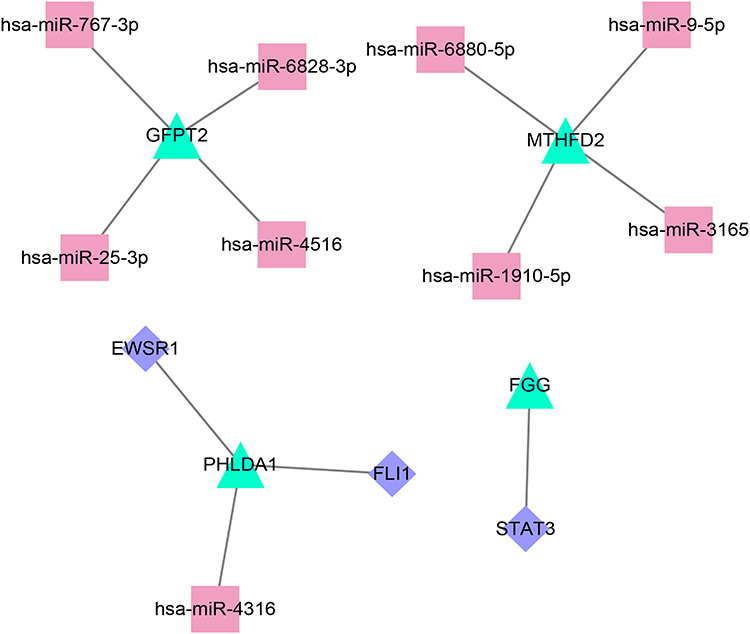 |
Figure 6 Construction of a miRNA-mRNA-TF network by integrating miRNA-mRNA and mRNA-TF relations. The turquoise, red, and purple dots represent mRNA, miRNA, and TFs, respectively. |
Discussion
In this study, we first screened out 127 DEGs between COPD and control samples from the combined dataset of GSE37768, GSE106986, and GSE103174. By considering the intersection of 127 DEGs and genes in trait-related modules, 83 key module-related DEGs were identified, which were mainly enriched in interleukin-related pathways. Then, an optimized gene set, including MTHFD2, KANK3, GFPT2, PHLDA1, HS3ST2, FGG, and RPS4Y1, was obtained using the LASSO regression analysis, and it showed great potential in predicting COPD risks in the combined dataset with an AUC of 0.795.
The effect of the seven-gene-signature on COPD has been limited. Among them, MTHFD2 is associated with the expression of cell cycle-related genes in non-small cell lung cancer (NSCLC) and has clinical significance in the diagnosis, pathological stage, and prognosis of the disease.35,36 During tumor development, MTHFD2 interacts with a series of nucleoproteins involved in RNA metabolism and translation.37 In predicting upstream miRNAs in this study, we found that MTHFD2 may have potential regulatory axes with miR-9-5p, miR-6880-5p, miR-1910-5p, and miR-3165, of which the expression relationship between MTHFD2 and miR-9 has been confirmed in breast cancer.38 Therefore, we hypothesized that the miRNA-MTHFD2 regulatory axis might affect cell carcinogenesis in COPD patients by regulating the expression of cell cycle-related genes. PHLDA1 plays an important role in cell proliferation and apoptosis and is involved in lung contusion and subsequent inflammatory responses.39 In this study, it was found that PHLDA1 was significantly highly expressed in patients with COPD, and the expression of PHLDA1 was also shown to be significantly correlated with the prognosis of NSCLC,40 indicating a significant contribution of PHLDA1 in the process of NSCLC from COPD. Although we have proposed that candidate genes may be involved in the progression of COPD to NSCLC, whether these genes affect the severity of COPD remains unclear. This study also predicted the potential transcriptional regulation of PHLDA1 with FLI1 and EWSR1, whereas Boro et al supported our prediction and stated that the expression of PHLDA1 might be inhibited by EWS/FLI1.41
By comparing the differences in infiltration abundance of immune cells between COPD and controls, we found that the fractions of plasma cells, CD8 T cells, resting NK cells, activated dendritic cells, and activated mast cells were significantly different between two groups. Studies have confirmed the interactions between mast cells, airway structure cells, and other inflammatory cells in COPD development.42 In addition, perivascular mast cell density is positively correlated with airway angiogenesis in COPD, which contributes to airway remodeling.43 Furthermore, mast cells were found to accumulate abnormally in COPD and may increase the expression of IL-17.44 Interestingly, the key module-related genes obtained in this study were also enriched in IL-17 related signaling pathways. The infiltration of dendritic cells was significantly increased in patients with COPD in the current study. Van et al agreed with this finding and stated that in patients with COPD, especially in severe disease, dendritic cells were activated and increased in number.45 Van et al also proposed that the number of Langerhans-type dendritic cells increases with COPD severity.46 It has been reported that immature dendritic cells in the respiratory tract promote Th2 differentiation.47 Moreover, the epithelial cells of asthmatic patients can attract Th2 cells into the airway by releasing chemokines through dendritic cells.48 By studying the relationship between gene signatures and dendritic cells, we found that PHLDA1 and FGG were positively correlated with dendritic cells, and PHLDA1 and FGG were highly expressed in COPD patients. These results suggest that PHLDA1 and FGG are up-regulated in COPD mediated by TFs and may be involved in the immune regulation mechanism associated with dendritic cells, thereby influencing the progression of COPD.
It is undeniable that the integration of mRNA and non-coding RNA research techniques provides a more comprehensive biological perspective for exploring the pathogenesis of diseases. However, the relationship between gene signatures and miRNAs was only investigated at a predictive level in this study. The lack of exploration of the expression correlation and regulation mechanism between them is one of the limitations of this study. Additionally, the COPD severity stratification is unavailable in this study because of the lack of clinical features. Therefore, in the follow-up study, we will collect clinical solid tumor samples and further include information on disease severity to explore the role of genetic markers in COPD progression. Further functional experiments will be conducted to confirm the regulatory relationship between miRNA-mRNA and TF-mRNA regulatory axes.
Conclusion
To conclude, this study proposed seven-gene signatures of COPD, including MTHFD2, KANK3, GFPT2, PHLDA1, HS3ST2, FGG, and RPS4Y1, based on difference analysis and trait module analysis. These genes can be used as potential diagnostic markers to predict the onset risk of COPD. The seven-gene signature was enriched in interleukin-related signaling pathways and was also associated with immune cells. Additionally, the miRNAs and TFs of gene signatures were analyzed to help understand upstream regulatory mechanisms. This study provides valuable biomarkers for patients with COPD to customize personalized treatments.
Funding
This study was supported by the Beijing Medical Award Foundation (No. YXJL-2020-0417-0043, YXJL-2020-0510-0044),the Key Project of the Petrel Foundation of HarbinMedical University Cancer Hospital (No. JJZD2020-07), and the Cancer Prevention and Diagnosis and Treatment Scientific Research Foundation of Beijing Cancer Prevention and Treatment Society (No. 2020-1012).
Disclosure
The authors declare that they have no conflicts of interest.
References
1. Gonçalves I, Guimarães MJ, van Zeller M, et al. Clinical and molecular markers in copd. Pulmonology. 2018;24(4):250–259. doi:10.1016/j.pulmoe.2018.02.005
2. Mirza S, Clay RD, Koslow MA, Scanlon PD. Copd guidelines: a review of the 2018 gold report. Mayo Clinic Proc. 2018;93(10):1488–1502. doi:10.1016/j.mayocp.2018.05.026
3. Labaki WW, Rosenberg SR. Chronic obstructive pulmonary disease. Ann Intern Med. 2020;173(3):Itc17–itc32. doi:10.7326/AITC202008040
4. Rabe KF, Watz H. Chronic obstructive pulmonary disease. Lancet. 2017;389(10082):1931–1940. doi:10.1016/S0140-6736(17)31222-9
5. Agustí A, Vogelmeier C, Faner R. Copd 2020: changes and challenges. Am J Physiol. 2020;319(5):L879–l883.
6. López-Campos JL, Tan W, Soriano JB. Global burden of copd. Respirology. 2016;21(1):14–23. doi:10.1111/resp.12660
7. Duffy SP, Criner GJ. Chronic obstructive pulmonary disease: evaluation and management. Med Clin North Am. 2019;103(3):453–461.
8. Agusti A, Sin DD. Biomarkers in copd. Clin Chest Med. 2014;35(1):131–141. doi:10.1016/j.ccm.2013.09.006
9. Vestbo J, Edwards LD, Scanlon PD, et al. Changes in forced expiratory volume in 1 second over time in copd. N Engl J Med. 2011;365(13):1184–1192. doi:10.1056/NEJMoa1105482
10. Duvoix A, Dickens J, Haq I, et al. Blood fibrinogen as a biomarker of chronic obstructive pulmonary disease. Thorax. 2013;68(7):670–676. doi:10.1136/thoraxjnl-2012-201871
11. Jing Z, Chun C, Ning S, et al. Systemic inflammatory marker crp was better predictor of readmission for aecopd than sputum inflammatory markers. Arch Bronconeumol. 2016;52(3):138–144. doi:10.1016/j.arbr.2015.05.029
12. Moy ML, Teylan M, Weston NA, et al. Daily step count is associated with plasma c-reactive protein and il-6 in a us cohort with copd. Chest. 2014;145(3):542–550. doi:10.1378/chest.13-1052
13. Zemans RL, Jacobson S, Keene J, et al. Multiple biomarkers predict disease severity, progression and mortality in copd. Respir Res. 2017;18(1):117. doi:10.1186/s12931-017-0597-7
14. Zhang L, Chen J, Yang H, et al. Multiple microarray analyses identify key genes associated with the development of non-small cell lung cancer from chronic obstructive pulmonary disease. J Cancer. 2021;12(4):996–1010. doi:10.7150/jca.51264
15. Shan S, Chen W, Jia JD. Transcriptome analysis revealed a highly connected gene module associated with cirrhosis to hepatocellular carcinoma development. Front Genet. 2019;10:305. doi:10.3389/fgene.2019.00305
16. Barnes PJ. Cellular and molecular mechanisms of asthma and copd. Clin sci. 2017;131(13):1541–1558. doi:10.1042/CS20160487
17. Barnes PJ. Inflammatory mechanisms in patients with chronic obstructive pulmonary disease. J Allergy Clin Immunol. 2016;138(1):16–27. doi:10.1016/j.jaci.2016.05.011
18. Barnes PJ. Inflammatory endotypes in copd. Allergy. 2019;74(7):1249–1256.
19. Leek JT, Storey JD. A general framework for multiple testing dependence. Proc Natl Acad Sci U S A. 2008;105(48):18718–18723. doi:10.1073/pnas.0808709105
20. Johnson WE, Li C, Rabinovic A. Adjusting batch effects in microarray expression data using empirical Bayes methods. Biostatistics. 2007;8(1):118–127. doi:10.1093/biostatistics/kxj037
21. Ritchie ME, Phipson B, Wu D, et al. Limma powers differential expression analyses for rna-sequencing and microarray studies. Nucleic Acids Res. 2015;43(7):e47. doi:10.1093/nar/gkv007
22. Langfelder P, Horvath S. Wgcna: an r package for weighted correlation network analysis. BMC Bioinform. 2008;9:559. doi:10.1186/1471-2105-9-559
23. Chen H, Boutros PC. Venndiagram: a package for the generation of highly-customizable venn and Euler diagrams in r. BMC Bioinform. 2011;12:35. doi:10.1186/1471-2105-12-35
24. Raudvere U, Kolberg L, Kuzmin I, et al. G:Profiler: a web server for functional enrichment analysis and conversions of gene lists (2019 update). Nucleic Acids Res. 2019;47(W1):W191–w198. doi:10.1093/nar/gkz369
25. Ashburner M, Ball CA, Blake JA, et al. Gene ontology: tool for the unification of biology. The gene ontology consortium. Nat Genet. 2000;25(1):25–29. doi:10.1038/75556
26. Kanehisa M, Sato Y. Kegg mapper for inferring cellular functions from protein sequences. Protein Sci. 2020;29(1):28–35. doi:10.1002/pro.3711
27. Jiang B, Sun P, Tang J, Luo B. Glmnet: graph learning-matching networks for feature matching. arXiv preprint arXiv. 2019;2:587.
28. Dimitriadou E, Hornik K, Leisch F, Meyer D, Weingessel A. E1071: misc functions of the department of statistics (e1071). arXiv preprint arXiv. 2011;1:548.
29. Newman AM, Liu CL, Green MR. Robust enumeration of cell subsets from tissue expression profiles. Nature Methods. 2015;12(5):453–457.
30. Winter N, Nichols A. Vioplot: stata module to produce violin plots with current graphics. Statistical Software Components. 2012;1:548.
31. Dweep H, Gretz N. Mirwalk2.0: a comprehensive atlas of microrna-target interactions. Nat Methods. 2015;12(8):697. doi:10.1038/nmeth.3485
32. Chen Y, Wang X. Mirdb: an online database for prediction of functional microrna targets. Nucleic Acids Res. 2020;48(D1):D127–d131. doi:10.1093/nar/gkz757
33. Chou CH, Shrestha S, Yang CD, et al. Mirtarbase update 2018: a resource for experimentally validated microrna-target interactions. Nucleic Acids Res. 2018;46(D1):D296–d302. doi:10.1093/nar/gkx1067
34. Wen D, Zou W, Wen X, et al. Urban-rural disparity in colorectal cancer incidence and increasing trend in relation to socioeconomic development and urbanization in China. J Int Med Res. 2018;46(10):4181–4196. doi:10.1177/0300060518791090
35. Yu C, Yang L, Cai M, et al. Down-regulation of mthfd2 inhibits nsclc progression by suppressing cycle-related genes. J Cell Mol Med. 2020;24(2):1568–1577. doi:10.1111/jcmm.14844
36. Geng QQ, Wu QF, Zhang Y, et al. Clinical significance of circ-mthfd2 in diagnosis, pathological staging and prognosis of nsclc. Eur Rev Med Pharmacol Sci. 2020;24(18):9473–9479.
37. Koufaris C, Nilsson R. Protein interaction and functional data indicate mthfd2 involvement in rna processing and translation. Cancer & Metabolism. 2018;6:12. doi:10.1186/s40170-018-0185-4
38. Selcuklu SD, Donoghue MT, Rehmet K, et al. Microrna-9 inhibition of cell proliferation and identification of novel mir-9 targets by transcriptome profiling in breast cancer cells. J Biol Chem. 2012;287(35):29516–29528. doi:10.1074/jbc.M111.335943
39. Wang S, Zhang H, Wang A, et al. Phlda1 promotes lung contusion by regulating the toll-like receptor 2 signaling pathway. Cell Phys Biochem. 2016;40(5):1198–1206. doi:10.1159/000453173
40. Baldavira CM, Machado-Rugolo J, Prieto TG, et al. The expression patterns and prognostic significance of pleckstrin homology-like domain family a (phlda) in lung cancer and malignant mesothelioma. J Thorac Dis. 2021;13(2):689–707. doi:10.21037/jtd-20-2909
41. Boro A, Prêtre K, Rechfeld F, et al. Small-molecule screen identifies modulators of ews/fli1 target gene expression and cell survival in ewing’s sarcoma. Int j Cancer. 2012;131(9):2153–2164. doi:10.1002/ijc.27472
42. Virk H, Arthur G, Bradding P. Mast cells and their activation in lung disease. Trans Res. 2016;174:60–76. doi:10.1016/j.trsl.2016.01.005
43. Li H, Yang T, Ning Q, et al. Cigarette smoke extract-treated mast cells promote alveolar macrophage infiltration and polarization in experimental chronic obstructive pulmonary disease. Inhal Toxicol. 2015;27(14):822–831. doi:10.3109/08958378.2015.1116644
44. Roos AB, Mori M, Gura HK, et al. Increased il-17ra and il-17rc in end-stage copd and the contribution to mast cell secretion of fgf-2 and vegf. Respir Res. 2017;18(1):48. doi:10.1186/s12931-017-0534-9
45. Van Pottelberge GR, Bracke KR, Demedts IK, et al. Selective accumulation of langerhans-type dendritic cells in small airways of patients with copd. Respir Res. 2010;11(1):35. doi:10.1186/1465-9921-11-35
46. Van Pottelberge GR, Bracke KR, Joos GF, Brusselle GG. The role of dendritic cells in the pathogenesis of copd: liaison officers in the front line. Copd. 2009;6(4):284–290. doi:10.1080/15412550903049124
47. Upham JW, Xi Y. Dendritic cells in human lung disease: recent advances. Chest. 2017;151(3):668–673. doi:10.1016/j.chest.2016.09.030
48. Hammad H, Lambrecht BN. Barrier epithelial cells and the control of type 2 immunity. Immunity. 2015;43(1):29–40. doi:10.1016/j.immuni.2015.07.007
 © 2021 The Author(s). This work is published and licensed by Dove Medical Press Limited. The full terms of this license are available at https://www.dovepress.com/terms.php and incorporate the Creative Commons Attribution - Non Commercial (unported, v3.0) License.
By accessing the work you hereby accept the Terms. Non-commercial uses of the work are permitted without any further permission from Dove Medical Press Limited, provided the work is properly attributed. For permission for commercial use of this work, please see paragraphs 4.2 and 5 of our Terms.
© 2021 The Author(s). This work is published and licensed by Dove Medical Press Limited. The full terms of this license are available at https://www.dovepress.com/terms.php and incorporate the Creative Commons Attribution - Non Commercial (unported, v3.0) License.
By accessing the work you hereby accept the Terms. Non-commercial uses of the work are permitted without any further permission from Dove Medical Press Limited, provided the work is properly attributed. For permission for commercial use of this work, please see paragraphs 4.2 and 5 of our Terms.