")
Back to Journals » International Journal of General Medicine » Volume 14
Imbalance of T Lymphocyte Subsets in Adult Immune Thrombocytopenia
Authors Lin X, Xu A, Zhou L , Zhao N, Zhang X, Xu J, Feng S, Zheng C
Received 30 December 2020
Accepted for publication 8 February 2021
Published 18 March 2021 Volume 2021:14 Pages 937—947
DOI https://doi.org/10.2147/IJGM.S298888
Checked for plagiarism Yes
Review by Single anonymous peer review
Peer reviewer comments 2
Editor who approved publication: Dr Scott Fraser
Xiuxiu Lin,1 Anhui Xu,1 Li Zhou,1 Na Zhao,1 Xinhui Zhang,2 Jin Xu,3 Shanglong Feng,2 Changcheng Zheng1
1Department of Hematology, The First Affiliated Hospital of USTC, Division of Life Sciences and Medicine, University of Science and Technology of China, Hefei, People’s Republic of China; 2Department of Hematology, Anhui Provincial Hospital, Anhui Medical University, Hefei, People’s Republic of China; 3Wannan Medical College, Wuhu, People’s Republic of China
Correspondence: Changcheng Zheng
Department of Hematology, The First Affiliated Hospital of USTC, Division of Life Sciences and Medicine, University of Science and Technology of China, Hefei, People’s Republic of China
Tel/ Fax +86-551-62284476
Email [email protected]
Background: Primary immune thrombocytopenia (ITP) is defined as an acquired autoimmune disease characterized by isolated thrombocytopenia. This work is to further clarify the relationship between T cell immune dysfunction and the pathogenesis of ITP.
Methods: 37 adult patients with ITP were selected and were classified into newly diagnosed ITP (nITP, n = 13), persistent ITP (pITP, n = 6) and chronic ITP (cITP n = 18). The frequency of cytotoxic T lymphocytes (Tc1, Tc2, and Tc17) and helper T cells (Th1, Th2, and Th17), Tregs, and the expression of chemokine receptors and PD-1 on CD4+ T cells were investigated by flow cytometry. Plasma levels of T cell-related cytokines (IL-2, IL-4, IL-6, IL-10, TNF-α, IFN-γ, IL-17) were measured by cytometric beads array (CBA).
Results: The percentage of Tc1 in cITP was greatly higher than nITP and healthy controls (p < 0.05, p < 0.01). The percentage of Treg in nITP and cITP groups was remarkably lower than those in healthy control group (p < 0.05, p < 0.001); and according to platelet count analysis (PLT< 50x109/L or PLT> 50x109/L), Treg cells in ITP group were significantly lower than those in healthy control group (p < 0.001, p < 0.05). The percentage of CD4+CXCR3+ of cITP was significantly higher than healthy controls and nITP (p < 0.01, p < 0.05). The percentage of CD4+CCR6+ in cITP was significantly higher than healthy controls and nITP (p < 0.001, p < 0.05). The expression of PD-1 in cITP patients was higher than healthy control (p < 0.05), but there was no significant difference among nITP, pITP and cITP (p = 0.25). The levels of IL-2, IFN-γ and TNFα in nITP group and cITP group were significantly higher than those in healthy control group (p < 0.01, p < 0.05; p < 0.01, p < 0.05; p < 0.05, p < 0.05), and the level of IL-10 in nITP group was significantly higher than that in pITP group (p < 0.05).
Conclusion: Our results suggest that T lymphocyte immune dysfunction does exist in adult ITP patients and plays an important role in the pathogenesis of ITP.
Keywords: primary immune thrombocytopenia, T helper cells, cytotoxic T lymphocyte, regulatory T cells
Introduction
Primary immune thrombocytopenia (ITP) is an acquired autoimmune hemorrhagic disease characterized by isolated peripheral blood thrombocytopenia without explicit inducement.1–3 The classic pathogenesis of ITP is that platelet surface glycoprotein and antiplatelet antibody combine to form an immune complex, and Fc receptor of monocyte macrophage system combines with Fc segment of autoantibody, which mediates macrophage phagocytosis and destruction of platelets, leading to peripheral thrombocytopenia.4–8 However, the above humoral immune mechanism cannot fully explain all the clinical manifestations of ITP.
CD4+ and CD8+ T cells are important components of T lymphocytes, and the CD4+/CD8+T cell ratio is associated with autoimmune diseases.9,10 However, the impact of cytotoxic T lymphocytes dysfunction on the severity of the different courses of ITP remains unclear. CD8+ T cells may play a major role in the protection of individual autoimmunity.11,12 CD8+ T cells can directly dissolve platelets, and increased platelet destruction was observed in ITP patients.13–16 In addition, helper T cell (Th) subsets coordinate different immune responses and mediate the production of different cytokines, and abnormal Th cell activity may lead to chronic inflammation and autoimmune diseases, and recent studies have shown that normalization of T regulatory cells (Tregs) can also significantly increase platelet count.17–19
The migration and differentiation of Th1, Th2 and Th17 subsets are affected by chemokine receptors. Chemokine receptors are dynamically regulated during the activation and differentiation of naive CD4+T cells.20 Some studies have found that CCR6+CD4+T cells in ITP patients have the properties of activated memory, which can be used to monitor disease activity and treatment response.21 Overexpression of CCR6 + Th cells and their marker cytokines is associated with persistent inflammation and autoimmune diseases. Some studies indicated that the expression of CXCR3 in ITP patients was increased when comparing with healthy control.22,23 CCR4 was mainly expressed on Th2, NK and immature dendritic cells, skin-homing T cells and Treg cells.24 In ITP patients, the expression of CCR4 on CD4+T cells has not been studied. It has been reported that the PD-1/PD-L1 signaling pathway plays a negative regulatory role in many autoimmune diseases.25–29 We speculate that loss of PD-1 inhibition regulation and the continuous activation of T cells may lead to excessive immunity, and eventually lead to ITP immune dysfunction.
In this study, we intend to further clarify the relationship between T-cell immune dysfunction and the pathogenesis of ITP.
Patients and Methods
Patients
37 adult patients with ITP were selected from the First Affiliated Hospital of the University of Science and Technology of China. The criteria of definitions and classifications of ITP were according to the report from ITP international working group. Secondary thrombocytopenia should be excluded, such as tumor infiltration, chronic liver diseases, hypersplenism, common variant immunodeficiency disease (CVID), infection, and vaccination, etc. There were 10 males with a median age of 62 years (27–88) and 27 females with a median age of 48 years (25–89). According to the course of disease, 37 patients with ITP were classified into newly diagnosed ITP (nITP, patients within 3 months after diagnosis, n = 13), persistent ITP (pITP, patients with continuous thrombocytopenia for 3–12 months) (n = 6) and chronic ITP (cITP, patients with continuous thrombocytopenia for more than 12 months, n = 18). According to platelet counts, these patients were divided into PLT< 50x109/L (n = 21) group and PLT ≥ 50x109/L group (n = 16). A control group consisted of 20 adult healthy volunteers (8 males and 12 females; median age, 54 years; range, 26–87 years).
There was no significant difference in gender (p=0.11) and age (p=0.19) among nITP, pITP and cITP. Moreover, there was no significant difference between our studied groups as regard to hemoglobin (HGB) (p=0.11), white blood cells (WBC) (p=0.82), lymphocytes (p=0.52) and last platelet count (p=0.15). All these patients were treated according to the American Society of Hematology 2011 evidence-based practice guideline for ITP. This study was approved by the medical ethics committee of the First Affiliated Hospital of the University of Science and Technology of China, and informed consent was obtained from all the participants. This study was conducted in accordance with the Declaration of Helsinki. The detailed clinical characteristics of the selected patients are indicated in Table 1.
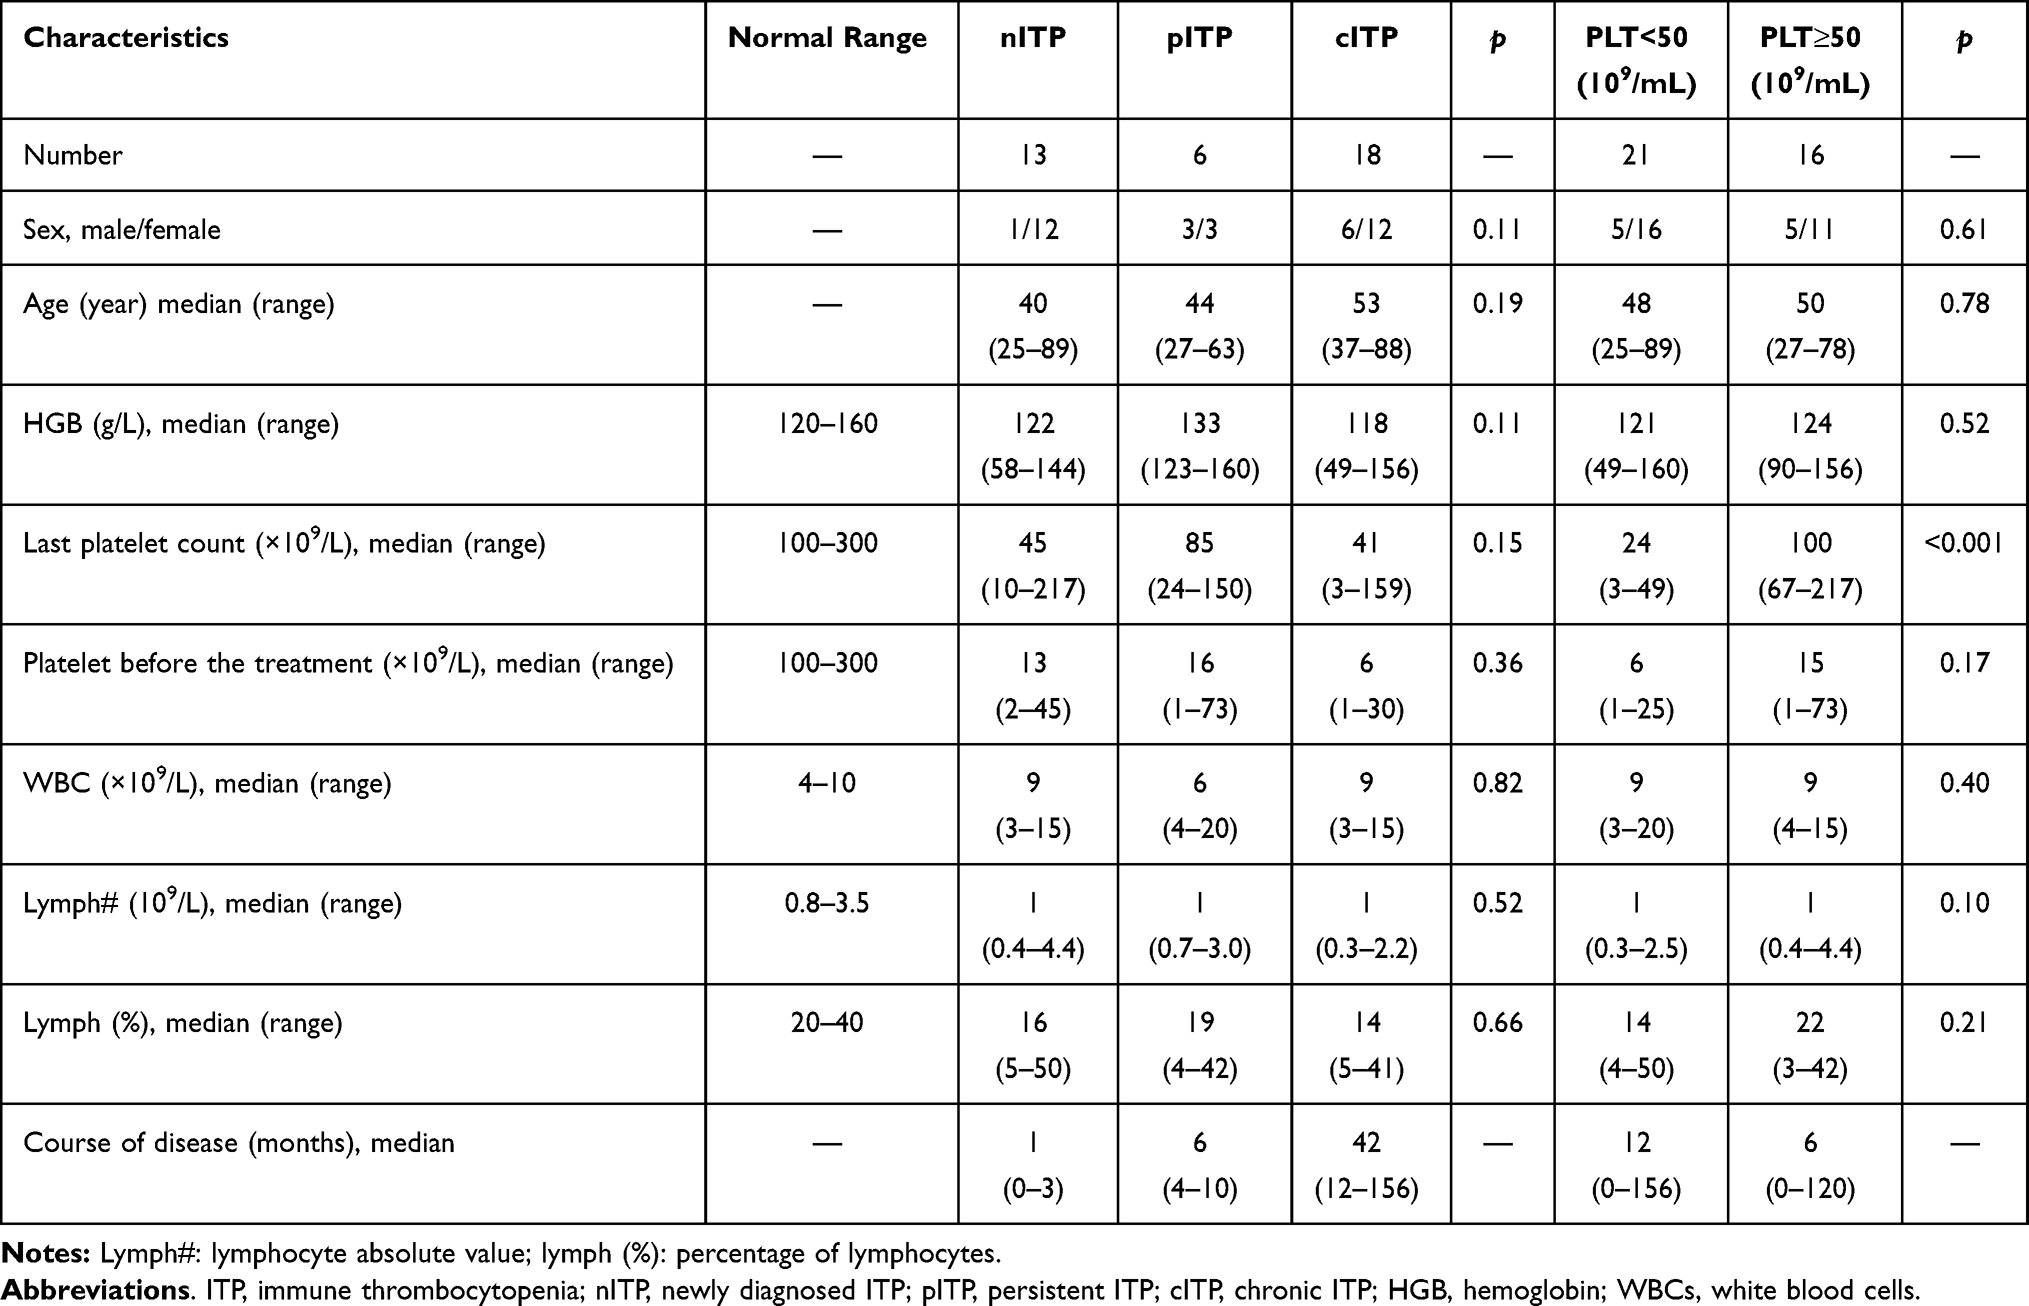 |
Table 1 Clinical Characteristics of Adult ITP |
Antibodies and Reagents
The following antibodies were used for flow cytometric analysis of lymphocyte subsets and intracellular cytokines: Anti-CD3-APC-H7 (BD Biosciences). Anti-CD4-Brilliant Violet 421, Anti-CD8a-Percp-cyanine 5.5, Anti-CXCR3-Percp-cyanine 5.5, Anti-CCR4-PE, Anti-CCR6-APC, Anti-PD-1- PE (Biolegend), Anti-CD45-FITC, anti-IFNγ-eFluor®450, Anti-IL4-APC, Anti-IL17-PE (eBioscience), FcR Blocking reagent (Miltenyi Biotec MACS). Fixable viability stain 510, Leukocyte Activation cocktail, with BD Golgiplu (BD Biosciences). Red Blood Cell Lysis Buffer (Solarbio Life Science). Human Lymphocyte Separation Medium (TBD Science). Cytometric Bead Array (BD Biosciences). RPMI1640 (Hyclone).
Preparation of Plasma and Cells
4 mL venous blood was collected from ITP and normal control by heparin sodium tube and then centrifuged for 5 min at 1000 rpm. Plasma was separated and stored at −80°C until used. The peripheral blood mononuclear cells (PBMC) were prepared by Ficoll-Paque plus density gradient centrifugation according to the standard procedure.
Cell Stimulation and CD8+ and CD8- T Cell Cytokine Production
After washing for three times, the mononuclear cells were resuspended in RPMI1640 complete medium, and the cell density was adjusted to 1×10⁶/mL. Leucocyte activation cocktail (with BD GolgiPlug) was added to 1 mL of complete medium and the cells were incubated in 5% CO2 incubator at 37 °C for 5 hours. Before antibody staining, human FCR blocking agent was added to all tubes to reduce nonspecific binding, and the fixed active staining agent (Bv510) was added to remove dead cells. Then, CD45-FITC, CD3-APC-H7, CD8-PerCP-Cy5.5 were added and incubated for 30 min at 4 °C in the dark. Cells were then washed, fixed, and permeabilized, followed by intracellular cytokines stained with anti-IFN-γ-e Fluor 450, anti-IL4 APC, anti-IL17 PE at 4 °C in the dark for 30 min. After washing three times, cells were resuspended with 200μL PBS. Data were collected by Beckman CytoFLEX flow cytometric and analyzed by FlowJo version 10 software. Cell subset are defined as follows: Tc1: CD3+CD8+IFN-γ+; Tc2: CD3+CD8+IL-4+; Tc17: CD3+CD8+IL-17+, Th1 CD3+CD8−IFN-γ+; Th2: CD3+CD8−IL-4+; Th17: CD3+CD8−IL-17+.
Detection of Tregs, Chemokine Receptor and PD-1 Expression by Flow Cytometry
The following antibody to human cell surface antigens were used: 100 μ l blood was added to each tube and then 2 μ L CD45-FITC, CD3-APC-H7, CD4-BV421, CD127-PE and CD25-APC, CXCR3-APC, CCR4-PE, CCR6-APC, PD-1-PE, respectively, reagents were added in turn.
After the antibody was added, it was incubated at 4 °C in the dark for 30 min, and then 1mL of red blood cell lysate was added. After shaking, red blood cells were dissolved at room temperature away from light for 10 min. The supernatant was centrifuged and washed with phosphate buffer (PBS + 1% FBS). Cells were resuspended with 200 μ l PBS. FCM was used to detect the number of lymphocytes and the expression of subsets (200,000 cells).
Detection of T Cell Related Cytokines in Serum by CBA
CBA detection: the required reagents and instruments are mainly BD CBA human Th1/Th2/Th17 cytokine kit and Fortessa analytical flow cytometric (BD). The serum was taken from the −80 °C ultra-low temperature refrigerator for standby. It was placed at room temperature for 2 h, and then, the relevant experimental operation was carried out according to the CBA kit instructions and the detection was performed on the flow cytometric analysis within 3 hours. According to the test data, the standard curve was drawn automatically by using software mELISA, and the cytokine content in the sample was calculated automatically according to the standard curve.
Statistical Analysis
Statistical analysis was performed using prism software (GraphPad prism) by t-test (or unpaired). One-way ANOVA was performed for data comparison among multiple groups. The chi-square test was used to analyze the gender differences between different disease courses of ITP. The data were expressed as mean ± standard error of mean (SEM) or standard deviation (SD). p < 0.05 was considered significant.
Results
Increased Percentage of Tc in Chronic ITP
The flow gating strategy of CD8+T lymphocytes and Tc cell subsets according to representative plots of flow cytometry analysis are shown in Figure 1A-B. The rate of CD4+/CD8+ in healthy control was similar to different course of ITP (p=0.38, Figure 1C) and there was no significant difference between PLT<50x109/L and PLT>50x109/L group (p = 0.88, Figure 1D). We found that the percentage of Tc1 in cITP was greatly higher than nITP and healthy controls (p < 0.05, p < 0.01, Figure 1E); however, the difference was not statistically significant in PLT<50x109/L and PLT>50x109/L group (p = 0.52, Figure 1F). The percentage of Tc2 was no significant difference in nITP, pITP and cITP(p = 0.34, Figure 1G); furthermore, the difference was not statistically significant in PLT<50x109/L and PLT>50x109/L group (p = 0.33, Figure 1H). The percentage of Tc17 was no significant difference in nITP, pITP and cITP (p = 0.21, Figure 1I), and the difference was not statistically significant in PLT<50x109/L and PLT>50x109/L group as well (p = 0.14, Figure 1J).
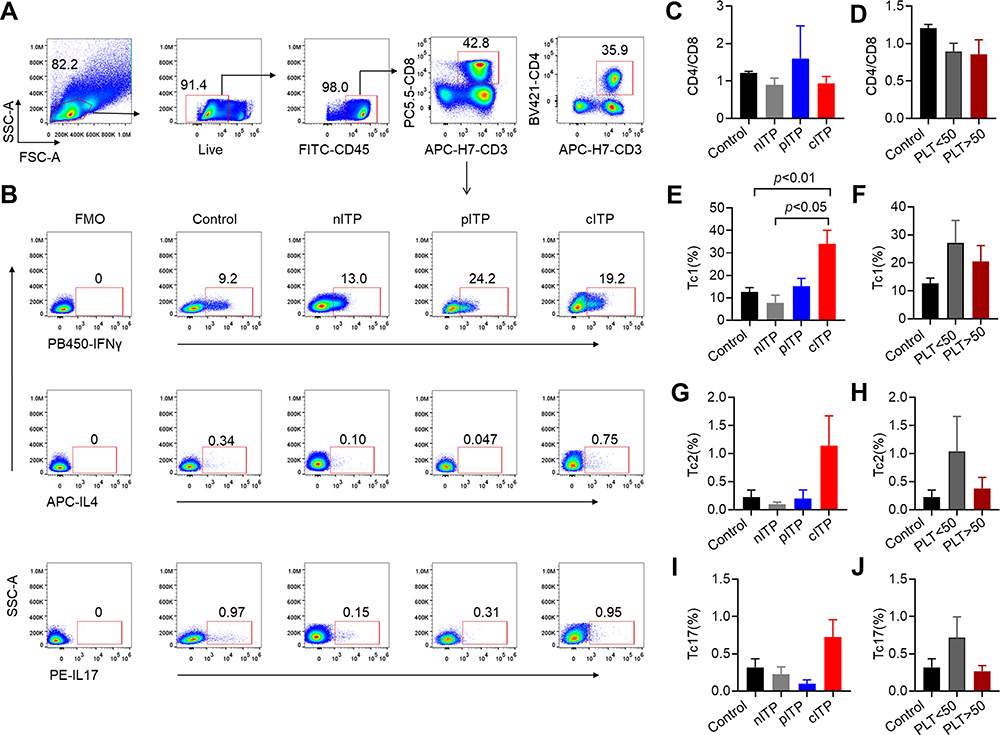 |
Figure 1 The percentage of Tc increased in chronic ITP. Notes: (A–B) In the flow gating strategy, lymphocytes were first gated by forward scattering FSC and side scattering SSC, and then cells were stained for live cells, lymphocytes were gated by CD45, T lymphocytes were circled by CD3 and CD8 simultaneously in (A). Representative of IFN-γ, IL-4 and IL-17 expression on CD3+CD8+ T subsets was shown in (B). Cells are defined as follows: Tc1: CD3+CD8+IFNγ+, Tc2:CD3+CD8+IL4+, Tc17: CD3+CD8+IL17+. (C) The rate of CD4+/CD8+ in healthy control and different course (1.20±0.10 control vs 0.89±0.37 nITP,1.60±1.23 pITP and 0.94±0.51 cITP, respectively, p = 0.38). (D) The rate of CD4+/CD8+ was no significant difference between PLT<50x109/L and PLT>50x109/L group (0.89±0.27 vs 0.85±0.55, p=0.88). (E) The percentage of Tc1 in cITP was greatly higher than nITP and healthy controls (33.98 ± 17.17 vs 7.76 ± 6.81, p < 0.05; 33.98 ± 17.17 vs 12.61 ± 5.14, p < 0.01). (F) There was no significant difference in Tc1 between PLT<50x109/L and PLT>50x109/L group (27.08 ± 21.32 vs 20.26±13.95, p = 0.52). (G–J) The percentage of Tc2 (G, H), and Tc17 (I, J) was no significant difference in nITP, pITP and cITP (0.10±0.07, 0.20±0.22 and 1.14±1.51, respectively, p=0.34 for Tc2; 0.22±0.20, 0.10±0.08 and 0.72±0.66, respectively, p=0.21 for Tc17) or platelet count (1.04 ± 1.65 vs 0.34 ± 0.49, p = 0.33 for Tc2; 0.72 ± 0.73 vs 0.25 ± 0.19, p = 0.14 for Tc17).Bars represent means ± SEM. p < 0.05 was considered significant. |
The Percentage of Th Cell Subsets in ITP
Th cell subsets according to representative plots of flow cytometric analysis are shown in Figure 2A. The percentage of Th1 (p = 0.35, p = 0.98, Figure 2B and C), Th2 (p = 0.30, p = 0.52, Figure 2D and E) and Th17 (p = 0.73, p = 0.87, Figure 2F and G) was no significant difference in different course of ITP or platelet counts (PLT<50x109/L and PLT>50x109/L).
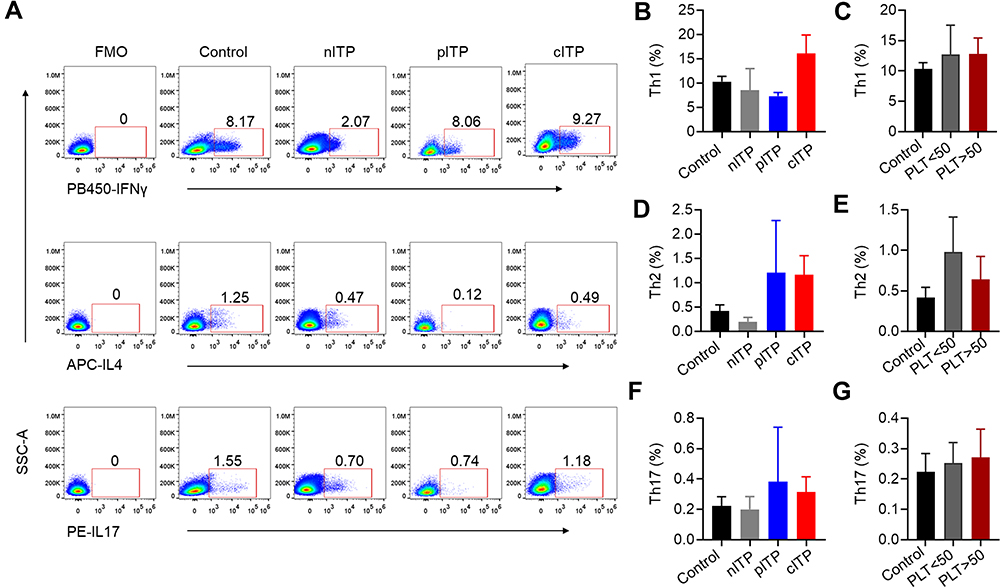 |
Figure 2 The percentage of helper cell T cells in ITP. Note: (A) Representative IFN-γ+, IL-4+ and IL-17+ expression on CD3+CD8–T subsets (CD4+ T subsets) was shown. Cells are defined as follows: Th1:CD3+CD8−IFNγ+, Th2: CD3+CD8−IL4+, and Th17: CD3+CD8−IL17+. (B–G) The percentage of Th1 (B, C), Th2 (D, E) and Th17 (F, G) was no significant difference in nITP, pITP and cITP (8.56±8.84, 7.33±1.03 and 16.09±10.79, respectively, p = 0.35 for Th1; 0.20±0.17, 1.20±1.53 and 1.16±1.11, respectively, p = 0.30 for Th2; 0.20±0.17, 0.38±0.51 and 0.32±0.28, respectively, p = 0.73 for Th17) or platelet count (12.70±12.81 vs 12.82±7.42, p = 0.98 for Th1; 0.98 ± 1.15 vs 0.64 ± 0.81, p = 0.52 for Th2; 0.25±0.18 vs 0.27±0.26, p = 0.87 for Th17). Bars represent means ± standard error of mean. p < 0.05 was considered significant. |
Decreased Levels of Treg Cells in nITP and cITP
The flow gating strategy of CD4+T lymphocytes and the representative dot-plots of flow cytometric analysis of Treg cells are shown in Figure 3A. According to platelet count analysis (PLT<50x109/L or PLT>50x109/L), we found that Treg cells in ITP group were significantly lower than those in healthy control group (p < 0.001, p < 0.05, Figure 3B). Treg cells in PLT>50x109/L group were slightly increased compared to PLT<50x109/L group without statistically significant (p = 0.22, Figure 3B). According to the course of disease, the percentage of Treg in nITP and cITP groups was remarkably lower than those in healthy control group (p < 0.05, p < 0.001, Figure 3C); however, there was no significant difference among nITP, pITP and cITP (p = 0.27, Figure 3C).
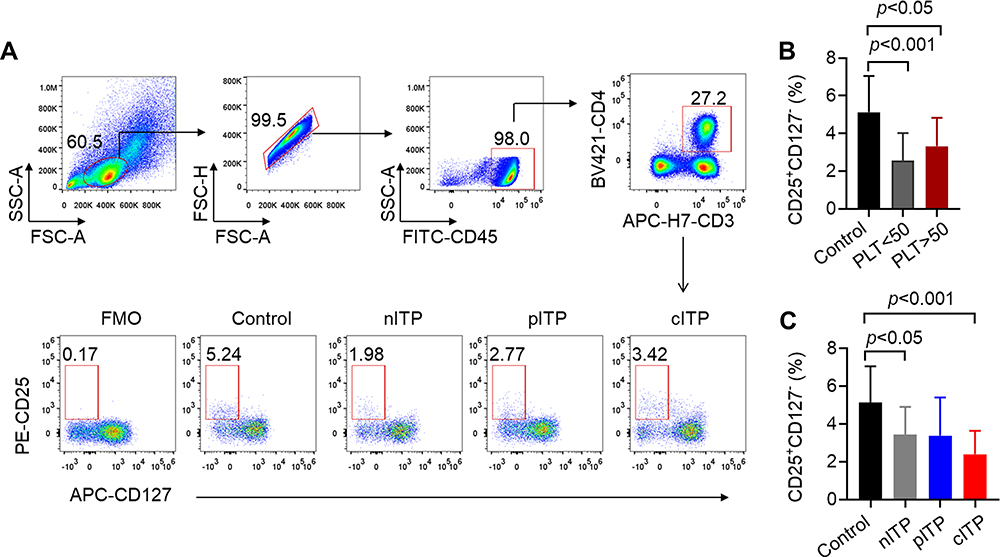 |
Figure 3 The percentage of Treg decreased in ITP patients. Notes: (A) In the flow gating strategy, lymphocytes were first gated by forward scattering FSC and side scattering SSC, and then lymphocytes were circled by CD45. T lymphocytes were circled by CD3 and CD4 simultaneously. Treg cell was defined as CD4+CD127−CD25+. (B) PLT < 50x109/L and PLT > 50x109/L groups were lower than healthy control group (2.55 ± 1.47 vs 5.13 ± 1.92, p < 0.001; 3.32 ± 1.51 vs 5.13± 1.92, p < 0.05). Treg cells in PLT>50x109/L group were slightly increased compared to PLT<50x109/L group without statistically significant (3.32 ±1.51 vs 2.55 ± 1.47, p=0.22). (C) Compared with healthy control group, Treg in nITP, pITP and cITP was decreased (3.43 ± 1.47 vs 5.13 ± 1.92, p < 0.05; 3.38 ± 2.03 vs 5.13 ± 1.92, p = 0.09; 2.40 ± 1.24 vs 5.13 ± 1.92, p< 0.001). However, there was no significant difference among nITP, pITP and cITP (3.43 ± 1.47 vs 3.38 ± 2.03 vs 2.19 ± 1.04, respectively, p = 0.27). Bars represent means ± SEM. p < 0.05 was considered significant. |
Elevated Levels of CD4+CXCR3+, CD4+CCR6+ and CD4+PD-1+ T Cells in ITP
In order to research the role of CD4+T cells in the pathogenesis of ITP, we analyzed the expression of chemokine receptor and PD-1 on CD4+T lymphocytes, and the representative histograms of flow cytometric analysis are shown in Figure 4A. The percentage of CD4+CXCR3+ of cITP was significantly higher than healthy controls and nITP (p < 0.01, p < 0.05, Figure 4B). The percentage of CD4+CXCR3+ in patients with pITP was obviously increased in comparison with healthy controls (p < 0.05, Figure 4B). Compared with healthy control, the expression level of CD4+CXCR3+ was dramatically increased in PLT>50x109/L group (p < 0.05, Figure 4C). Nevertheless, there was no significant difference of the expression CD4+CCR4+ in different disease course (p= 0.46, Figure 4D) and different platelet count (p= 0.88, Figure 4E).The percentage of CD4+CCR6+ in cITP was significantly higher than healthy controls and nITP (p < 0.001, p < 0.05; Figure 4F). The percentage of CD4+CCR6+ in the PLT<50x109/L group and PLT>50x109/L group was prominently higher than healthy control group (p < 0.01, p < 0.05 Figure 4G). The percentage of CD4+CCR6+ was slightly increased in PLT<50x109/L group compared with PLT>50x109/L, however, this elevation is statistically insignificant (p = 0.32, Figure 4G). Next, we detected the expression of PD-1 on CD4+ T cells. We found that the expression of PD-1 in cITP patients was higher than that in healthy control (p < 0.05, Figure 4H), but there was no significant difference among nITP, pITP and cITP (p = 0.25, Figure 4H). The data of PD-1 in PLT<50x109/L have no statistically significant difference when compared with PLT<50x109/L group (p=0.35, Figure 4I).
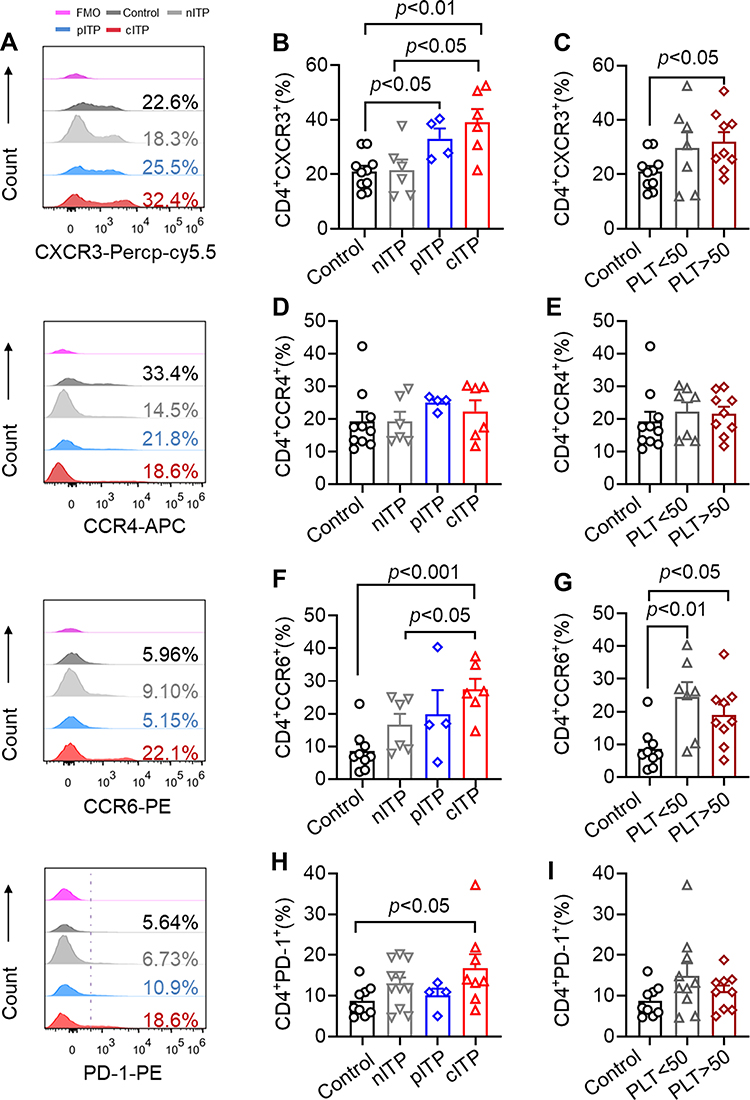 |
Figure 4 The expression of CXCR3, CCR6 and PD1 on CD4+ T cells increased in ITP patients. Notes: (A) Representative histograms of the expression of CXCR3, CCR4, CCR6 and PD-1 on the surface of CD4+ T cells were detected by flow cytometry. (B) Compared with healthy controls, CXCR3 was significantly increased in the pITP and cITP groups (33.05 ± 7.49 vs 21.03 ± 6.52, p < 0.05; 39.10 ± 11.86 vs 21.03 ± 6.52, p < 0.01). There was no significant difference between nITP and healthy controls (21.45 ± 9.70 vs 21.03 ± 6.52, p = 0.92). Compared with nITP, CXCR3 in cITP increased significantly (39.10 ± 11.86 vs 21.45 ± 9.70, p < 0.05). (C) Compared with healthy controls, CD4+CXCR3+ was significantly increased in PLT>50x109/L groups (31.23 ± 11.22 vs 21.03 ± 6.52, p < 0.05). (D) There was no significant difference in CCR4 expression among nITP, pITP, cITP patients (19.23 ± 7.16 vs 24.95 ± 2.16 vs 22.25 ± 8.47, respectively, p= 0.46). (E) There was no significant difference in CD4+CCR4+ between PLT<50x109/L and PLT>50x109/L groups (21.33 ± 8.35 vs 20.60 ± 6.21, p = 0.88). (F) The expression of CD4+CCR6+ in cITP was significantly higher than that of healthy controls and nITP (27.33 ± 8.24 vs 8.59 ± 6.24, p < 0.001; 27.33 ± 8.24 vs 16.56 ± 8.30, p < 0.05). (G) Compared with healthy controls, CD4+CCR6+ was significantly increased in the PLT<50x109/L and PLT>50x109/L groups (21.86 ± 10.57 vs 8.59 ± 6.24, p < 0.01; 18.99 ± 9.55 vs 8.59 ± 6.24, p < 0.05). The percentage of CD4+CCR6+ was increased in PLT<50x109/L group compared with PLT>50x109/L, however, this elevation is statistically insignificant (21.86 ± 10.57 vs 17.58 ± 5.76, p = 0.32). (H) Compared with healthy controls, the expression of CD4+PD-1+ in cITP was significantly increased (17.01 ± 9.49 vs 8.70 ± 3.79, p < 0.05), but here was no significant difference of the expression CD4+PD-1+ among nITP, pITP and cITP (12.02±6.25 vs 10.00±3.51 vs 17.01±9.49, respectively, p = 0.25, Figure 4H). (I) There was no significant difference between PLT< 50x109/L and PLT > 50x109/L (15.24 ± 9.56 vs 11.98 ± 5.07, p = 0.35). Bars represent means ± SEM. p < 0.05 was considered significant. |
Increased Serum Levels of IL-2, IFN-γ and TNF-α in ITP
The serum levels of IFN-γ, IL-2, TNF-α and IL-4, IL-6, IL-10, IL-17 in ITP patients and healthy controls were detected by CBA technology. According to different course of disease analysis, IL-2, IFN-γ and TNFα in nITP group and cITP group were significantly higher than those in healthy control group (p < 0.01, p < 0.05, Figure 5A; p < 0.01, p < 0.05, Figure 5B; p < 0.05, p < 0.05, Figure 5C). The level of IL-10 in nITP group was significantly higher than that in pITP group (p < 0.05, Figure 5D). The levels of IL-4, IL-6 and IL-17 were no significant differences among different disease duration and healthy controls (p = 0.69, p = 0.35, p = 0.53, Supplement Figure 1A-C). According to the platelet count analysis, the levels of IL-2 and IFN-γ in ITP patients with PLT<50x109/L and PLT>50x109/L were higher than those in healthy control group (p < 0.05, p < 0.05 Figure 5E; p < 0.05, p < 0.05 Figure 5F). Compared with the healthy control, the ITP patients of PLT<50x109/L had significantly higher TNF-α levels (p < 0.05, Figure 5G). Nevertheless, there was no significant difference in IL-10 (p =0.16, Figure 5H), IL-4, IL-6 and IL-17 (p = 0.54, p = 0.16, p = 0.85, Supplement Figure 1D-F) between PLT<50x109/L and PLT>50x109/L.
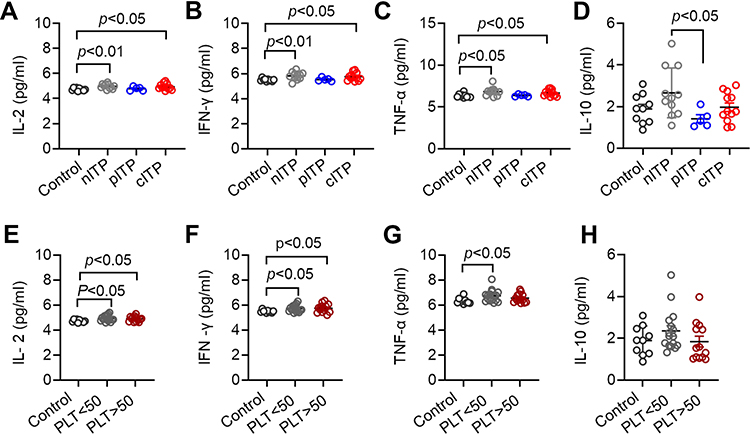 |
Figure 5 Serum levels of IL-2, IFN-γ, TNF-α in ITP patients were increased. Notes: (A–C) The levels of IL-2, IFN-γ and TNF-α in nITP group and cITP group were significantly higher than those in healthy control group (A: 4.96 ± 0.22 vs 4.73 ± 0.11, p < 0.01, 4.93 ± 0.25 vs 4.73 ± 0.11, p < 0.05; (B) 6.16 ± 1.25 vs 5.49 ± 0.11, p < 0.01, 5.74 ± 0.30 vs 5.49 ± 0.11, p < 0.05; (C) 6.71 ± 0.53 vs 6.33 ± 0.24, p < 0.05, 6.65 ± 0.38 vs 6.33 ± 0.24, p < 0.05). (D) Compared with pITP, the secretion of IL-10 in nITP was increased, and the difference was statistically significant (2.61 ± 1.27 vs 1.75 ± 1.30, p <0.05). (E, F) The levels of IL2 and IFN-γ in ITP group (PLT<50x109/L and PLT> 50x109/L) were significantly increased compared with healthy controls (E: 4.94 ± 0.24 vs 4.73 ± 0.11, p < 0.05, 4.89 ± 0.21 vs 4.73 ± 0.11, p < 0.05; (F) 5.72 ± 0.27 vs 5.49 ± 0.11, p < 0.05, 5.74 ± 0.35 vs 5.49 ± 0.11, p < 0.05). (G) TNFα level in PLT < 50x109/L group was significantly higher than that in healthy control group (6.74 ± 0.48 vs 6.33 ± 0.24, p < 0.05). The difference of TNF-α was not statistically significant in PLT< 50x109/L and PLT > 50x109/L group (6.74 ± 0.48 vs 6.57 ± 0.37, p = 0.29). (H) The levels of IL-10 was not significantly different among different platelet counts (2.35±0.99vs1.83±0.92, p = 0.16). Bars represent means ± SD. p < 0.05 was considered significant. |
Discussion
The main pathogenesis of ITP is characterized by the platelet autoimmune as a result of loss of immune tolerance, which leads to abnormal activation of humoral and cellular immunity. They jointly mediate the acceleration of platelet destruction and the production of platelet insufficiency by megakaryocytes.30 However, the pathophysiological mechanism of ITP is very complex and needs further study. In the immune pathogenesis of ITP, T cells are still in the central stage and play an important role in initiation, transmission and maintenance of antiplatelet autoimmunity.31 The imbalance of immune response and the loss of immune tolerance, such as Th1/Th2/Th17, play an important role in the pathogenesis of ITP.32–34
In this study, we found that helper T cells did not differ significantly about different stages of the disease and platelet count. CD4+T cells may play a major role by secreting some related cytokines. Platelet self-reactivity T cells were activated and IL-2 and IFN-γ cytokine imbalance increased in ITP patients.35,36 Recently, it has been reported that IL-17 cytokines increase in ITP patients, suggesting that IL-17 may play a role in ITP immunopathology.37–39 This cytokines may lead to the activation of B cells and be related to the activation of macrophages.40 Panitsas et al showed that serum level of IFN-γ was markedly elevated in patients with cITP.41 We found that IFN-γ and IL-2 in nITP and cITP patients were significantly increased in relation to healthy controls, with maximum elevation in cITP patients. Andersson et al suggest that patients with active disease may have a Th1-cytokine activation pattern.42 We also found that the levels of TNF-α in the serum of nITP and cITP patients were significantly higher than the healthy controls. These results support the evidence that the increase of TNF-α induces the activation of macrophages.43,44
In addition, the polarization of CD8+ T lymphocytes in ITP patients is not completely clear. Platelets are susceptible to CD8+ T cell immunomonitoring. When CD8+ T cells recognize the homologous peptide presented by MHCI, it will degranulate the target cells and induce apoptosis.45 We found that there was a significant increase in Tc1, compared with healthy control group, with maximum elevation in cITP patients. It strongly supported the cytotoxicity mediated by cytotoxic T lymphocytes, which may be one of the main mechanisms of ITP. Therefore, it is speculated that Tc1 cells may affect the development and function of other lymphocytes in specific microenvironment. In addition, we also found that the expression of Tc1 in cITP was greatly higher than that in nITP, indicating that cytotoxic T lymphocyte may directly affect the duration of ITP.
It has been found that the functional defects of CD4+CD25+regulatory T cells lead to the destruction of ITP tolerance.46 Treg cells inhibit the activation and proliferation of CD4+ T cells or CD8+ T cells mainly through the direct intercellular interaction and the production of IL-10 and TGF-β cytokines. In our study, we found that Treg cells in patients of nITP, pITP and cITP were decreased when compared with healthy control group. We assumed that Treg may be involved in the pathogenesis of ITP by regulating immune function, and the disorder may become more serious with the prolongation of the disease course.
Chemokine and chemokine receptors play an important role in autoimmune diseases.47 However, its role in immune thrombocytopenia (ITP) is unclear. Chemokine receptors are essential for the migration and differentiation of T lymphocyte subsets. In this study, CXCR3, CCR4 and CCR6 expressed on CD4+ T cells were analyzed. Interestingly, in our study, we found that the percentages of CXCR3+CD4+ T cells and CCR6+CD4+ T cells increased significantly, with maximum elevation in cITP patients. CCR6+Th cell population is heterogeneous and can be divided into several subgroups, including interleukin (IL)-17, IL-22 and IFN - γ - secreting cells.48 Therefore, we speculate that CXCR3 and CCR6 may induce helper T cell (CD4+T cell) to generate inflammatory factor storm in ITP through chemotaxis and play an important role in cell-mediated immunity.
PD-1 was reported to be decreased in cITP patients, which suggested the important role of the PD-1 pathway in the pathogenesis of ITP.49 However, we found that the PD-1 expression level was significantly increased in cITP in comparison with healthy control. Wan and others found a high level of sPD-1 in the serum of patients with rheumatoid arthritis, and its expression level was closely related to clinical immune detection indexes, which suggested that sPD-1 may be an important factor to maintain the balance between PD-1 and PDL-1.50 It can be seen that PD-1/PDL-1 signaling pathway is not enough to explain the mechanism of ITP. PD-1 pathway in the pathogenesis of ITP needs further study.
Conclusions
Taken together, this study suggested that T cell immune dysfunction plays an important role in the pathogenesis of ITP. However, there were shortcomings in the current study; for example, the sample of pITP patients is too small, leading to no significant differences between some test indicators in the course of the disease. In addition, the above data need to be studied in a longitudinal study.
Acknowledgments
The authors thank the patients, their families, and all doctors who treated the patients.
Disclosure
The authors of this manuscript have no conflicts of interest to disclose.
References
1. Moulis G, Palmaro A, Montastruc J-L, et al. Epidemiology of incident immune thrombocytopenia: a nationwide population-based study in France. Blood. 2014;124(22):3308–3315. doi:10.1182/blood-2014-05-578336.
2. JY LJ L, Lee H, Kang B, et al. Epidemiology and management of primary immune thrombocytopenia: a nationwide population-based study in Korea. Thromb Res. 2017;155:86–91. doi:10.1016/j.thromres.2017.05.010.
3. Gernsheimer T. Chronic idiopathic thrombocytopenic purpura: mechanisms of pathogenesis. Oncologist. 2009;14(1):12–21. doi:10.1634/theoncologist.2008-0132.
4. Portielje JEWR, Kluin-Nelemans HC, Brand A. Morbidity and mortality in adults with idiopathic thrombocytopenic purpura. Blood. 2001;97(9):2549–2554. doi:10.1182/blood.v97.9.2549.
5. Cines DB, Bussel JB. How I treat idiopathic thrombocytopenic purpura (ITP). Blood. 2005;106(7):2244–2251. doi:10.1182/blood-2004-12-4598.
6. Elalfy MS, Nugent D. Viruses, anti-viral therapy, and viral vaccines in children with immune thrombocytopenia. Semin Hematol. 2016;53(Suppl 1):S70–2. doi:10.1053/j.seminhematol.2016.04.021.
7. Chen YXY, Ruan M, Shi J. The levels of T lymphocyte subsets in immune thrombocytopenia associated with anti-GPIIb/IIIa- and/or anti-gpibα-mediated responses are differentially sensitive to dexamethasone. Acta Haematol. 2018;140(1):60–66. doi:10.1159/000491977.
8. XG MS L, Sun JZ, Ren J, et al. High-dose dexamethasone shifts the balance of stimulatory and inhibitory Fcgamma receptors on monocytes in patients with primary immune thrombocytopenia. Blood. 2011;117(6):2061–2069. doi:10.1182/blood-2010-07-295477.
9. Dong C. TH17 cells in development: an updated view of their molecular identity and genetic programming. Nat Rev Immunol. 2008;8(5):337–348. doi:10.1038/nri2295.
10. Korn T, Bettelli E, Oukka M, Kuchroo,VK. IL-17 and Th17 Cells. Annu Rev Immunol. 2009;27(1):485–517. doi:10.1146/annurev.immunol.021908.132710.
11. Aslam R, Hu Y, Gebremeskel S, et al. Thymic retention of CD4+CD25+FoxP3+ T regulatory cells is associated with their peripheral deficiency and thrombocytopenia in a murine model of immune thrombocytopenia. Blood. 2012;120(10):2127–2132. doi:10.1182/blood-2012-02-413526.
12. Li X, Zhong H, Bao W, et al. Defective regulatory B-cell compartment in patients with immune thrombocytopenia. Blood. 2012;120(16):3318–3325. doi:10.1182/blood-2012-05-432575.
13. Olsson BAP, Jernås M, Jacobsson S, et al. T-cell-mediated cytotoxicity toward platelets in chronic idiopathic thrombocytopenic purpura. Nat Med. 2003;9(9):1123–1124. doi:10.1038/nm921.
14. Nugent DMR, Nichol JL, Slichter SJ. Pathogenesis of chronic immune thrombocytopenia: increased platelet destruction and/or decreased platelet production. Br J Haematol. 2009;146(6):585–596. doi:10.1111/j.1365-2141.2009.07717.x
15. Chow LAR, Speck ER, Kim M, et al. A murine model of severe immune thrombocytopenia is induced by antibody- and CD8+ T cell-mediated responses that are differentially sensitive to therapy. Blood. 2010;115(6):1247–1253. doi:10.1182/blood-2009-09-244772.
16. Colantonio LRH, Sinigaglia F, D’Ambrosio D. Modulation of chemokine receptor expression and chemotactic responsiveness during differentiation of human naive T cells into Th1 or Th2 cells. Eur J Immunol. 2002;32(5):1264–1273. doi:10.1002/1521-4141(200205)32:5<264::aid-immu1264>3.0.CO;2-S.
17. Zhang J, Ma D, Zhu X, et al. Elevated profile of Th17, Th1 and Tc1 cells in patients with immune thrombocytopenic purpura. Haematologica. 2009;94(9):1326–1329. doi:10.3324/haematol.2009.007823.
18. Lyu M, Li Y, Hao Y, et al. CCR6 defines a subset of activated memory T cells of Th17 potential in immune thrombocytopenia. Clin Exp Immunol. 2019;195(3):345–357. doi:10.1111/cei.13233.
19. Paust HJRJ, Krebs CF, Turner JE. et al. CXCR3+ regulatory T cells control TH1 responses in crescentic GN. J Am Soc Nephrol. 2016;27(7):1933–1942. doi:10.1681/ASN.2015020203.
20. Ngwenyama N, Salvador AM, Velázquez F, et al. CXCR3 regulates CD4+ T cell cardiotropism in pressure overload-induced cardiac dysfunction. JCI Insight. 2019;4(7):e125527. doi:10.1172/jci.insight.125527.
21. Yoshie O, Matsushima K. CCR4 and its ligands: from bench to bedside. Int Immunol. 2015;27(1):11–20. doi:10.1093/intimm/dxu079.
22. Audia S, Samson M, Guy J, et al. Immunologic effects of rituximab on the human spleen in immune thrombocytopenia. Blood. 2011;118(16):4394–4400. doi:10.1182/blood-2011-03-344051.
23. Olsson BRB, Carlsson L, Jacobsson S, et al. Recruitment of T cells into bone marrow of ITP patients possibly due to elevated expression of VLA-4 and CX3CR1. Blood. 2008;112(4):1078–1084. doi:10.1182/blood-2008-02-139402.
24. S WL L, Zhao C, Li L, et al. CD8+ T cells suppress autologous megakaryocyte apoptosis in idiopathic thrombocytopenic purpura. Br J Haematol. 2007;139(4):605–611. doi:10.1111/j.1365-2141.2007.06737.x.
25. Jiao Q, Liu C, Yang Z, et al. Upregulated PD-1 expression is associated with the development of systemic lupus erythematosus, but not the PD-1.1 allele of the PDCD1 gene. Int J Genomics. 2014;2014:950903. doi:10.1155/2014/950903
26. Reynolds J, Sando GS, Marsh OB, et al. Stimulation of the PD-1/PDL-1 T-cell co-inhibitory pathway is effective in treatment of experimental autoimmune glomerulonephritis. Nephrol Dial Transplant. 2012;27(4):1343–1350. doi:doi.org/10.1093/ndt/gfr529
27. Salama AD, Chitnis T, Imitola J, et al. Critical role of the programmed death-1 (PD-1) pathway in regulation of experimental autoimmune encephalomyelitis. J Exp Med. 2003;198(1):71–78. doi:doi.org/10.1084/jem.20022119
28. Peled M, Strazza M, Azoulay-Alfaguter I, et al. Analysis of programmed death-1 in patients with psoriatic arthritis. Inflammation. 2015;38(4):1573–1579. doi:doi.org/10.1007/s10753-015-0165-6
29. Kim JW, Lee J, Hong SM, et al. Circulating CCR7loPD-1hi Follicular Helper T cells indicate disease activity and glandular inflammation in patients with primary Sjögren’s syndrome. Immune Netw. 2019;19(4):e26. doi:10.4110/in.2019.19.e26.
30. Zufferey A, Kapur R, Semple JW. Pathogenesis and therapeutic mechanisms in immune thrombocytopenia (ITP). J Clin Med. 2017;6(2):16. doi:10.3390/jcm6020016.
31. Semple JW, Provan D. The immunopathogenesis of immune thrombocytopenia: T cells still take center-stage. Curr Opin Hematol. 2012;19(5):357–362. doi:10.1097/MOH.0b013e3283567541.
32. Alkebsi L, Kasamatsu T, Minato Y, et al. The cytokine polymorphisms affecting Th1/Th2 increase the susceptibility to, and severity of, chronic ITP. BMC Immunol. 2017;18(1):26. doi:10.1186/s12865-017-0210-3.
33. Ebbo M, Audonnet S, Grados A, et al. NK cell compartment in the peripheral blood and spleen in adult patients with primary immune thrombocytopenia. Clin Immunol. 2017;177:18–28. doi:10.1016/j.clim.2015.11.005.
34. Fang J, Lin L, Lin D, et al. The imbalance between regulatory memory B cells reveals possible pathogenesis involvement in pediatric immune thrombocytopenia. Hematology. 2019;24(1):473–479. doi:10.1080/16078454.2019.1622292.
35. Takahashi NST, Gotoh N, Nitta Y, et al. The cytokine polymorphisms affecting Th1/Th2 increase the susceptibility to, and severity of, chronic ITP. BMC Immunol. 2017;18(1):26. doi:10.1186/s12865-017-0210-3.
36. Rocha AMSC, Rocha GA, de Melo FF, et al. The levels of IL-17A and of the cytokines involved in Th17 cell commitment are increased in patients with chronic immune thrombocytopenia. Haematologica. 2011;96(10):1560–1564. doi:10.3324/haematol.2011.046417.
37. Xu R, Zheng Z, Ma Y, et al. Elevated NKT cell levels in adults with severe chronic immune thrombocytopenia. Exp Ther Med. 2014;7(1):149–154. doi:10.3892/etm.2013.1386.
38. Wang JDCT, Lin HK, Huang FL, et al. Reduced expression of transforming growth factor-β1 and correlated elevation of interleukin-17 and interferon-γ in pediatric patients with chronic primary immune thrombocytopenia (ITP). Pediatr Blood Cancer. 2011;57(4):636–640. doi:10.1002/pbc.22984.
39. Cines DB, McMillan R. Pathogenesis of chronic immune thrombocytopenic purpura. Curr Opin Hematol. 2007;14(5):511–514. doi:10.1097/MOH.0b013e3282ba5552.
40. Chapman LMAA, Field DJ, Srivastava K, et al. Platelets present antigen in the context of MHC class I. J Immunol. 2012;189(2):916–923. doi:10.4049/jimmunol.
41. Panitsas FP, Theodoropoulou M, Kouraklis A, et al. Adult chronic idiopathic thrombocytopenic purpura (ITP) is the manifestation of a type-1 polarized immune response. Blood. 2004;103(7):2645–2647. doi:10.1182/blood-2003-07-2268.
42. Munschauer FE, Hartrich LA, Stewart CC, et al. Circulating natural killer cells but not cytotoxic T lymphocytes are reduced in patients with active relapsing multiple sclerosis and little clinical disability as compared to controls. J Neuroimmunol. 1995;62(2):177–181. doi:10.1016/0165-5728(95)00115-9.
43. La Cava A. Tregs are regulated by cytokines: implications for autoimmunity. Autoimmun Rev. 2008;8(1):83–87. doi:10.1016/j.autrev.2008.08.002.
44. Malinowska I, Obitko-Płudowska A, Buescher ES, et al. Release of cytokines and soluble cytokine receptors after intravenous anti-D treatment in children with chronic thrombocytopenic purpura. Hematol J. 2001;2(4):242–249. doi:10.1038/sj.thj.6200106.
45. Yu J, Heck S, Patel V, et al. Defective circulating CD25 regulatory T cells in patients with chronic immune thrombocytopenic purpura. Blood. 2008;112(4):1325–1328. doi:10.1182/blood-2008-01-135335.
46. Liu Z, Wang M, Zhou S, et al. Pulsed high-dose dexamethasone modulates Th1-/Th2-chemokine imbalance in immune thrombocytopenia. J Transl Med. 2016;14(1):301. doi:10.1186/s12967-016-1064-9.
47. Birtas Atesoglu E, Tarkun P, Demirsoy ET, et al. Soluble Programmed Death 1 (PD-1) is decreased in patients with immune thrombocytopenia (ITP): potential involvement of PD-1 pathway in ITP immunopathogenesis. Clin Appl Thromb Hemost. 2016;22(3):248–251. doi:10.1177/1076029614562952.
48. Paulissen SM, van Hamburg JP, Dankers W, et al. The role and modulation of CCR25+ Th17 cell populations in rheumatoid arthritis. Cytokine. 2015;74(1):43–53. doi:10.1016/j.cyto.2015.02.002.
49. Zhong J, Chen S, Xu L, et al. Lower expression of PD-1 and PD-L1 in peripheral blood from patients with chronic ITP. Hematology. 2016;21(9):
50. Wan BNH, Liu A, Feng G, et al. Aberrant regulation of synovial T cell activation by soluble costimulatory molecules in rheumatoid arthritis. J Immunol. 2006;177(12):8844–8850. doi:10.4049/jimmunol.177.12.8844.
 © 2021 The Author(s). This work is published and licensed by Dove Medical Press Limited. The full terms of this license are available at https://www.dovepress.com/terms.php and incorporate the Creative Commons Attribution - Non Commercial (unported, v3.0) License.
By accessing the work you hereby accept the Terms. Non-commercial uses of the work are permitted without any further permission from Dove Medical Press Limited, provided the work is properly attributed. For permission for commercial use of this work, please see paragraphs 4.2 and 5 of our Terms.
© 2021 The Author(s). This work is published and licensed by Dove Medical Press Limited. The full terms of this license are available at https://www.dovepress.com/terms.php and incorporate the Creative Commons Attribution - Non Commercial (unported, v3.0) License.
By accessing the work you hereby accept the Terms. Non-commercial uses of the work are permitted without any further permission from Dove Medical Press Limited, provided the work is properly attributed. For permission for commercial use of this work, please see paragraphs 4.2 and 5 of our Terms.