")
Back to Journals » International Journal of Nanomedicine » Volume 13
Imaging and kinetics of the bimolecular complex formed by the tumor suppressor p53 with ubiquitin ligase COP1 as studied by atomic force microscopy and surface plasmon resonance
Authors Moscetti I, Bizzarri AR, Cannistraro S
Received 21 September 2017
Accepted for publication 28 November 2017
Published 4 January 2018 Volume 2018:13 Pages 251—259
DOI https://doi.org/10.2147/IJN.S152214
Checked for plagiarism Yes
Review by Single anonymous peer review
Peer reviewer comments 3
Editor who approved publication: Dr Thomas Webster
Ilaria Moscetti, Anna Rita Bizzarri, Salvatore Cannistraro
Biophysics and Nanoscience Centre, Department of Ecology and Biology, Università della Tuscia, Viterbo, Italy
Abstract: p53 plays an important role in the safeguard of the genome but it is frequently downregulated mainly by E3 ubiquitin ligases among which COP1 plays an important role. The overexpression of COP1 has been reported to occur in several tumors and may be indicative of its overall oncogenic effect, which in turn might be originated by a direct interaction of COP1 with p53. Such an interaction may constitute a rewarding target for anticancer drug design strategies; therefore, a deeper understanding of its underlying molecular mechanism and kinetics is needed. The formation of a single p53–COP1 bimolecular complex was visualized by atomic force microscopy imaging on a mica substrate. The kinetic characterization of the complex, performed by atomic force spectroscopy and surface plasmon resonance, provided a KD value of ~10-8 M and a relative long lifetime in the order of minutes, both at the single-molecule level and in bulk solution. The surprisingly high affinity value and low dissociation rate of the p53–COP1 bimolecular complex, which is even stronger than the p53–MDM2 complex, should be considered a benchmark for designing, development and optimization of suitable drugs able to antagonize the complex formation with the aim of preventing the inhibitory effect of COP1 on the p53 oncosuppressive function.
Keywords: p53, COP1, AFM, AFS, SPR, protein–protein interaction
Introduction
The tumor suppressor p53 is a critical hub that controls the cell cycle and maintains the integrity of the human genome.1 The inactivation of p53, through either direct mutations or aberrations in one of its many regulatory pathways, is found in almost every tumor.2 The activity of p53 is downregulated mainly by E3 ubiquitin ligases, which selectively and dominantly target p53, leading to its proteasome-dependent degradation.3,4 Among them an important role is played by constitutive photomorphogenesis protein 1 (COP1), a RING finger protein which targets p53 and drives its ubiquitination, with subsequent proteasome degradation.5 On the other hand, COP1 is also an E3 ubiquitin ligase for c-Jun, a proto-oncogene involved in breast cancer.6–8 COP1 has been moreover found to be responsible for p53 destabilization in several tumors, including glioma, hepatocarcinoma, breast and ovarian cancer, where COP1 is overexpressed causing a suppression of p53 transcription regulatory functions.9–11 The oncogenic role of COP1 is also indicated by the correlation of its overexpression with a poor prognosis in gastric and bladder cancers and witnessed by the anticancer effect observed for the p28 peptide able to antagonize the interaction of COP1 with p53.12–15 Therefore, the physical interaction between COP1 and p53 can be an interesting target for anticancer therapeutic strategies. This, however, requires a deeper understanding of the molecular mechanism and interaction kinetics underlying the binding process, which are so far unknown. In this context, we report a comprehensive study of the COP1 interaction with p53 in vitro, at the single-molecule level, by using atomic force microscopy (AFM) and atomic force spectroscopy (AFS) and also in bulk solution by using surface plasmon resonance (SPR). AFM represents an emerging nanotechnological tool operating at the single-molecule nanoscale, without labeling, under near physiological conditions, and requiring a very little amount of interacting species. It is particularly suited to investigate the topographical biomolecular details and, more interestingly, the unbinding kinetics of specific biocomplexes, by exploiting its ability to sense very small molecular forces involving partner biorecognition.16,17 On the other hand, SPR is a powerful technique able to provide the kinetic and equilibrium characterization of binding processes occurring between a sensor chip-immobilized ligand and its partner free in solution.18 These combined techniques, which have been previously exploited by some of the authors to study complexes involving p53 inhibitors,19–23 allowed us to visualize the formation of a single p53–COP1 complex on a mica substrate and to kinetically characterize it as a specific and high affinity complex, both at the single-molecule level and in bulk solution. Their binding kinetics is discussed in connection with complexes belonging to the same functional network and involving other p53 inhibitors such as mouse double minute 2 (MDM2) and mouse double minute 4 (MDM4). Interestingly, the newly acquired information on the complex could provide additional insights for designing and/or improving anticancer drugs able to antagonize the COP1 interaction with p53.
Materials and methods
Materials
Recombinant human full-length p53 (43.6 kDa) (hereafter p53) was purchased from Genscript (Piscataway, NJ, USA) by using the BacPower™ Guaranteed Bacterial Protein Expression Service.
Recombinant human COP1 protein MYC/DDK-tagged (77.5 kDa) (hereafter COP1), also known as RING finger and WD repeat domain 2, was purchased from Creative Biomart (Shirley, NY, USA). Glutathione S-transferase (GST) (26 kDa) was purchased from GE Healthcare UK Ltd (Little Chalfont, UK). Phosphate-buffered saline solution 50 mM, pH 7.4 (hereafter PBS buffer), was prepared by using reagents from Sigma–Aldrich Co. (St Louis, MO, USA).
AFM imaging
Topographic images were carried out in tapping mode (TM) by using the Nanoscope IIIa/Multimode AFM (Veeco Instruments, Plainview, NY, USA) in air. A total of 20 μL COP1 (1 μg/mL, diluted in Milli-Q water) or p53 (1 μg/mL, diluted in Milli-Q water) solution was incubated over a freshly cleaved mica substrate for 5 min. Then, the substrate was rinsed with water and dried with a stream of nitrogen. p53–COP1 sample was prepared by incubating p53 (200 μg/mL in PBS buffer) with COP1 (200 μg/mL in PBS buffer) for 10 min prior to dilution in Milli-Q water until a final concentration of 1 μg/mL each. Then, 20 μL of the diluted solution was electrostatically immobilized over the mica substrate as described earlier for the single proteins. Imaging was carried out by using bare tips (RTESPA300; Bruker Corporation, Billerica, MA, USA) with a nominal spring constant, knom, of ~40 N/m and a resonant frequency of ~300 kHz. All the images were analyzed by using the software WSxM (NanotecElectrónica S.L., Madrid, Spain).24
AFS experiments
Silicon nitride AFM tips (cantilever B, MSNL-10; Bruker Corporation), with a nominal spring constant, knom, of 0.02 N/m, were functionalized by covalently linking p53 (5 μM in PBS buffer) according to the procedure previously reported (Figure 1A).19 Briefly, tips were cleaned in acetone for 10 min, dried with nitrogen and then ultraviolet irradiated for 30 min. Then, they were incubated with a solution of 2% (v/v) 3-mercatopropyl-trimethoxysilane (Sigma–Aldrich Co.) in toluene (99.5%; Sigma–Aldrich Co.) for 2 h at room temperature and extensively washed with toluene. Subsequently, the silanized tips were incubated with a solution of 1 mM N-hydroxysuccinimide–polyethyleneglycol–maleimide (NHS-PEG-MAL, molecular weight 3,400 Da, N=24, hereafter PEG) (Thermo Fisher Scientific, Waltham, MA, USA) in dimethyl sulfoxide (DMSO) (99.9%, Sigma–Aldrich Co.) for 3 h at room temperature. This PEG spacer contains a thiol-reactive group (MAL) at one end, to link silane molecules, and an amino-reactive group (NHS) at the other end, to couple −NH2 groups of lysines exposed on the protein surface. Tips were rinsed in DMSO to remove the unbound PEG. Successively, they were incubated with 10 μL of p53 (5 μM, Creative Biomart) in PBS buffer overnight at 4°C, and they were gently rinsed with 10 mM PBS buffer and Milli-Q water.
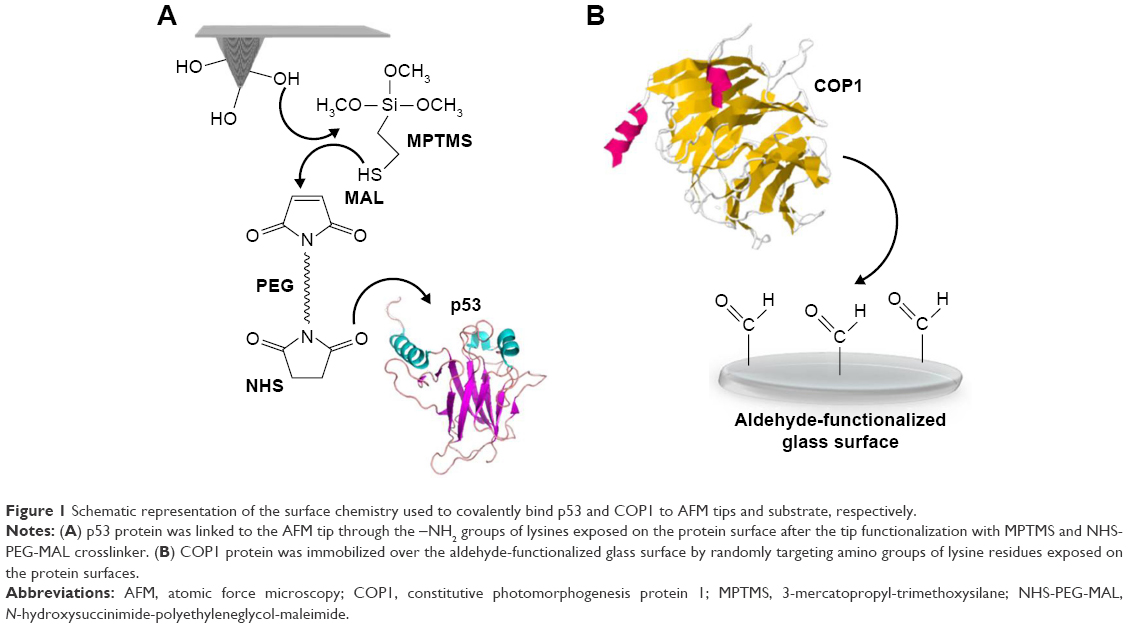 | Figure 1 Schematic representation of the surface chemistry used to covalently bind p53 and COP1 to AFM tips and substrate, respectively. |
2D-Aldehyde-functionalized glass surfaces, 1 cm2 (PolyAn GmbH, Berlin, Germany), characterized by a thin silane layer able to covalently bind proteins via their exposed amino groups, were incubated with 20 μL of COP1 (2.5 μM) in PBS buffer overnight at 4°C as described in Figure 1B.22 Then, the substrate was rinsed with PBS buffer and Milli-Q water. Finally, to passivate unreacted groups, both tips and substrates were incubated with 1 M ethanolamine hydrochloride, pH 8.5 (GE Healthcare), in Milli-Q water for 30 min at room temperature and then gently rinsed with PBS buffer and Milli-Q water. The samples were then stored in PBS buffer at 4°C. Force measurements were performed at room temperature with a commercial AFM (Nanoscope IIIa/Multimode AFM) in PBS buffer. Force curves were acquired by using tips functionalized with p53, as previously described. A ramp size of 150 nm and an encounter time of 100 ms were set up. A relative trigger of 35 nm was used to limit at 0.7 nN the maximum contact force applied by the tip on the protein-functionalized substrate. Figure 2 shows an approach–retraction cycle: at the beginning, the p53-functionalized tip is moved toward the COP1-functionalized substrate (point 1). The biomolecules jump to contact at point 2. Further pressure of the tip onto the substrate yields an upward deflection of the cantilever, as due to the electronic repulsion arising from the molecular orbital overlapping. Once the preset maximum contact force value is reached, the approaching phase (black curve) of the cantilever is stopped (point 3), and the cantilever is retracted from the substrate. During this retraction phase (red curve), adhesion forces and/or bonds formed in the contact phase cause the tip to bend downward, adhering to the substrate up to some distance beyond the initial contact point (point 4). As retraction continues, the spring force overcomes the interacting force and the cantilever jumps off, sharply returning to a noncontact position (point 5). Force curves were collected by approaching the functionalized tip to different points of the substrate at a constant velocity of 50 nm/s. The retraction velocity was varied from 50 to 4,200 nm/s to match the selected values for the nominal loading rates, defined as the product of the cantilever knom by the tip pulling velocity and set in the range of 1–84 nN/s. The effective loading rates were then calculated from the product between the pulling velocity, v, and the spring constant of the entire system, ksyst; this, in turn, being determined from the slope of the retraction trace of the force curves immediately prior to the jump-off of an unbinding event, to take into account the effect of the molecules tied to the tip.25 To obtain a reliable quantitative information with statistical significance, thousands of force curves were acquired at each loading rate. The exerted force, able to break the complex, called the unbinding force, F, was calculated by multiplying the cantilever deflection at the jump-off by its effective spring constant (keff), which was, in turn, determined by the nondestructive thermal noise method.26 The force curves registered during the measurements showed different shapes. Therefore, we selected curves corresponding to specific unbinding events, being characterized in the retraction phase by sharp peaks, starting and ending points at zero deflection line, and by a nonlinear curved shape before the jump-off, which was related to the stretching features of the PEG linker (Figure 2).17 Additionally, the specificity of somewhat ambiguous unbinding events was also checked by using the 1/f noise approach.27,28 A further check of the interaction specificity was performed by incubating the p53-functionalized tip with 10 μL of COP1 (5 μM) in PBS buffer overnight at 4°C and by repeating the AFS experiments over the same COP1-functionalized substrate (hereafter referred to as blocking experiments).
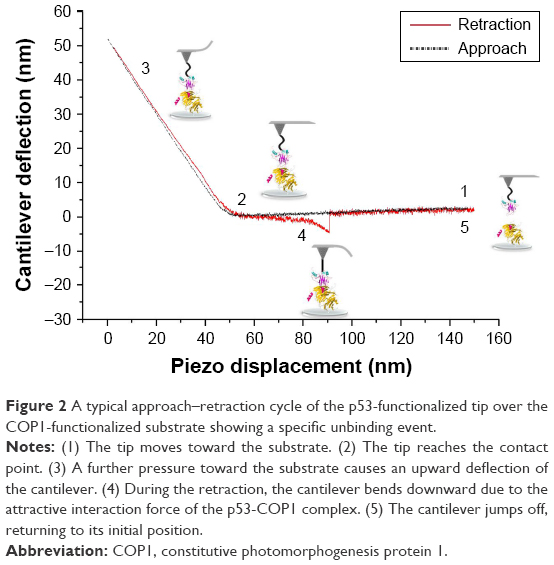 | Figure 2 A typical approach–retraction cycle of the p53-functionalized tip over the COP1-functionalized substrate showing a specific unbinding event. |
SPR experiments
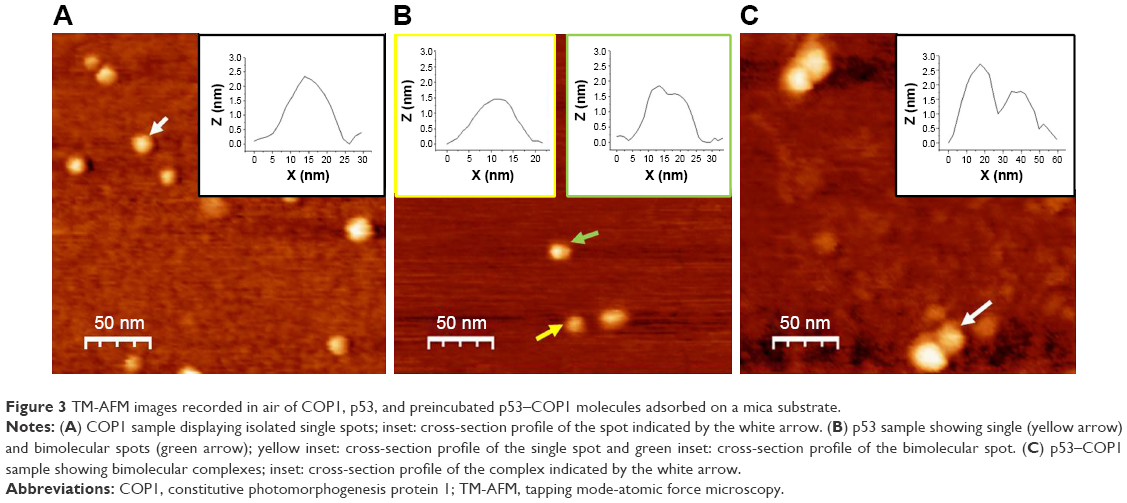
SPR measurements were performed at 25°C by using a Biacore X100 instrument (GE Healthcare). The ligand, COP1, was immobilized onto the flow cell 2 (Fc2) of a CM5 sensor chip surface (GE Healthcare) by using the Amine Coupling kit (GE Healthcare) and a running buffer containing PBS buffer added with 0.005% surfactant P20 (GE Healthcare). Briefly, the carboxymethyl dextran surface of the CM5 sensor chip was first activated by a 7-min injection of a 1:1 mixture of 0.4 M N-ethyl-N-(3-diethylaminopropyl) carbodiimide and 0.1 M N-hydroxysuccinimide (NHS) at a flow rate of 10 μL/min to give reactive succinimide esters.29 Then, a solution of COP1 (2 μg/mL) in immobilization buffer (10 mM sodium acetate, pH 5.0; GE Healthcare) was fluxed over the reactive matrix at a flow rate of 10 μL/min, with the NHS esters of the substrate spontaneously reacting with the protein amines to form covalent links. We immobilized ~120 resonance units (RU), R, of COP1 corresponding to a theoretical analyte binding capacity, Rmax, of ~70 RU in the Fc2. Rmax was calculated by using the following expression:
|
|
where the analyte molecular weight (MW) and the ligand MW are those of p53 and of COP1, respectively. To saturate the remaining active sites on the surface of the Fc2, GST (5 μg/mL) in immobilization buffer (10 mM sodium acetate, pH 4.0; GE Healthcare) was injected for 250 s at 10 μL/min. The reference flow cell 1 (Fc1) of the CM5 sensor chip surface was functionalized with GST by using the same amine coupling strategy. GST (5 μg/mL) in immobilization buffer (10 mM sodium acetate, pH 4.0; GE Healthcare) was injected for 250 s at 10 μL/min. Finally, 1 M ethanolamine hydrochloride, pH 8.5 (GE Healthcare), was injected for 7 min with a flow rate of 10 μL/min over both Fc1 and Fc2, to block the remaining unreacted sites.
SPR measurements were performed by using a single-cycle kinetics (SCK) which consists in sequential injections of increasing concentrations of the analyte over a functionalized sensor chip surface, without regeneration steps between each sample injection.30 Five sequential increasing concentrations of p53 solution (1.5–20 nM) in running buffer were fluxed over the sensor chip surface for 160 s by using a flow rate of 30 μL/min, followed by a 160 s dissociation with running buffer and a final dissociation of 400 s with the same buffer, without intermediate regeneration. Analytical cycles were programmed by means of a wizard template, and the entire analysis was completely automated. BiaEvaluation software 2.1 (GE Healthcare) was used to extract kinetic parameters from SPR data. The reference surface, Fc1, was used to correct for systematic noise and instrument drift. The binding assay also included three start-up cycles using buffer to equilibrate the surface, as well as a zero concentration cycle of analyte in order to have a blank response usable for double reference subtraction.31 The SPR response as a function of time, namely the sensorgram, was then fitted globally or at the steady state by using a 1:1 binding model. Goodness of the fits was evaluated by χ2 value and residual plots.
Results and discussion
AFM imaging of p53, COP1, and p53–COP1 complex
Figure 3A shows a representative TM-AFM image in air of COP1 molecules adsorbed on mica. We noted spots with an almost spherical shape, a higher number of these spots was found upon increasing the COP1 concentration. A representative cross-section profile of one spot (the white arrow) is shown in the inset of Figure 3A. From a statistical analysis of these spots, we found an average height of about (2.5±0.4) nm; such a value, which is consistent with those of similar protein samples,32 indicates that the observed spots very likely correspond to single COP1 molecules.
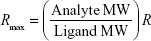
 | Figure 3 TM-AFM images recorded in air of COP1, p53, and preincubated p53–COP1 molecules adsorbed on a mica substrate. |
Figure 3B shows a representative TM-AFM image in air of the p53 sample on a mica substrate. Two different populations of spots have been visualized, both of them being characterized by an average height of (1.5±0.4) nm. Single spherically shaped spots, such as that indicated by the left arrow (with the corresponding cross-section profile shown in the left inset of Figure 3B), can be ascribed to isolated p53 molecules. While bimolecular spots (the right arrow), whose representative cross-section profile is shown in the right inset (Figure 3B), likely correspond to dimers of p53, in agreement with literature data that reported the presence of p53 dimers at similar concentrations.33 The height of the p53 images is significantly lower than that obtained for COP1 molecules, according to the lower MW of p53 protein with respect to COP1.
Finally, Figure 3C shows a representative TM-AFM image of the preincubated p53–COP1 sample adsorbed on mica. We note close spots, reminiscent of bimolecular complexes with the partners laterally placed, interacting with each other and with the substrate; a representative complex is indicated by a white arrow. The cross-section profile analysis (the inset of Figure 3C) is consistent with the presence of two different contacting molecules, one with a higher height (~2.6 nm) and a lower one (~1.8 nm). These height values are closely reminiscent of those of COP1 and of p53, respectively; therefore, the images shown in Figure 3C witness the formation of the p53–COP1 complex.
AFS unbinding results of the p53–COP1 complex
The kinetics and energy landscape of the interaction between p53 and COP1 were investigated at the single-molecule level by using AFS. Approach–retraction cycles were performed at five increasing loading rates by using a p53-functionalized tip and a COP1-conjugated substrate, prepared as described in the “Materials and methods” section. Specific force curves were collected, and the unbinding forces were evaluated and cast into a histogram for each loading rate; in all the cases, the most probable unbinding force (F*) was extracted from the maximum of the peak of the corresponding histogram (Figure 4A). We found that the recorded F* increased as far as higher loading rate values were applied. The unbinding frequency, calculated as the ratio of the number of events corresponding to specific unbinding processes over the total recorded events, was ~13%. Blocking experiments provided a significant reduction (40%) of the unbinding events witnessing the specificity of the interaction (data not shown). Since the molecular dissociation measured by AFS takes place under the application of an external force, the system is far from the thermodynamic equilibrium with an alteration of the energy profile. Therefore, to extract the kinetic and energy landscape parameters at the equilibrium, we used the model developed by Bell34 and Evans and Ritchie,35 which predicts a linear dependence of the F* on the natural logarithm of the loading rate, r, as given by the following relationship:
|
|
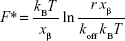
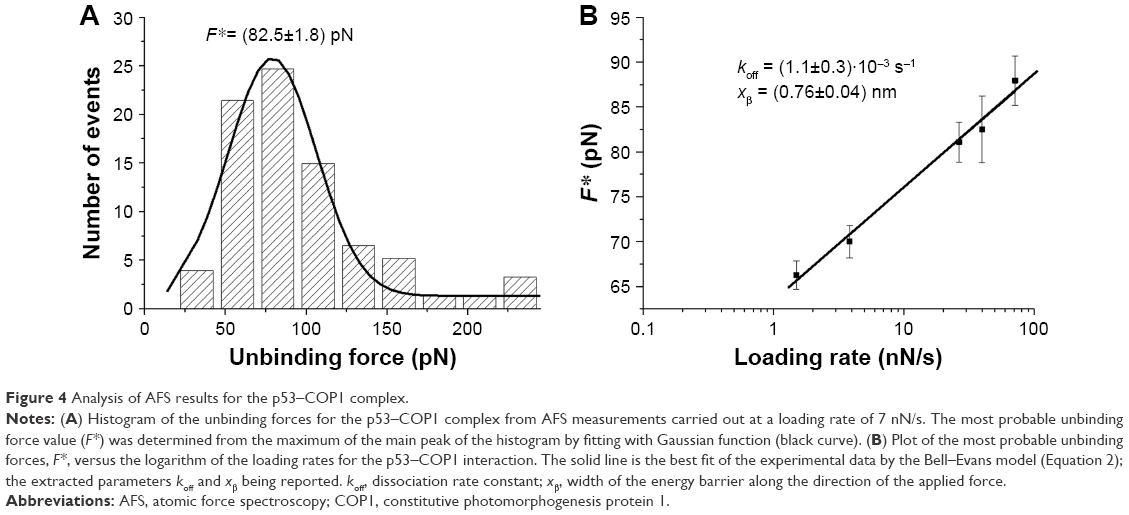 | Figure 4 Analysis of AFS results for the p53–COP1 complex. |
where kB is the Boltzmann constant, T is the absolute temperature, koff is the dissociation rate constant, and xβ is the width of the energy barrier along the direction of the applied force. By plotting F* versus the logarithm of the effective loading rate r, we observed a single linear trend indicative of a single energy barrier and a unique transition state of the reaction. Moreover, by fitting these data with Equation 2, we found a koff of (1.1±0.3)·10−3 s−1 and a xβ of (0.76±0.04) nm (Figure 4B), with these values being typical of specific biological complexes.36 Interestingly, the koff of the p53–COP1 complex is lower than those reported for some complexes belonging to the same functional network, such as p53–MDM2 and MDM2–MDM4, again at the single-molecule level,19,21 indicating a more specific interaction in the former case. Indeed, for the p53–COP1 complex, we calculated a lifetime τ (τ=1/koff) of ~17 min, which is much longer than those calculated for p53–MDM2 and MDM2–MDM4 complexes, whose lifetimes are in the range of a few seconds.19,21 To complete the kinetic characterization of the p53–COP1 complex at the single-molecule level, we estimated the association rate constant (kon) according to the expression kon = NA Veff/t0.5, where NA is the Avogadro’s number, Veff is the effective volume of a half-sphere with radius reff around the tip and t0.5 is the time for the half-maximal binding probability, given by t0.5=2reff/v, where v is the pulling velocity.37,38 Accordingly, a kon of ~105 M−1 s−1 was obtained. The calculation of both the dissociation and association rate constants allowed us to determine an equilibrium dissociation constant KD = koff/kon, of ~10−8 M for the p53–COP1 complex. This value indicates a strong affinity between these two biological partners. Such a value is also higher than those previously reported, by using a similar approach, for the p53–MDM2 and MDM2–MDM4 complexes, but it is quite close to that shown for the complex between p53 and the oncogenic mutant p53R175H.20–22
SPR kinetic results of p53–COP1 interaction
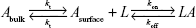
The interaction kinetics of the complex between p53 and COP1 was studied also in bulk solution using an SCK SPR approach in which the p53 analyte and the buffer were alternately injected into the flow cell where the COP1 ligand has been previously immobilized.30 Figure 5A shows the sensorgram obtained from successive injection of p53 at five progressively higher concentrations, ranging from 1.5 to 20 nM. The response signal increased after every injection and reached a steady-state value before the end of each injection, indicating the formation of the p53–COP1 complex. Subsequently, the buffer was flowed over the ligand and the response signal decreased, indicating the dissociation of p53. To extract the kinetic parameters of the p53–COP1 interaction, the SPR data were analyzed in the framework of the Langmuir 1:1 binding model, which assumes a simple reversible bimolecular reaction between the ligand and the analyte.39,40 The model was modified to take into account for the mass transport effect by assuming that the analyte was driven toward the sensor chip surface (Asurface) or back again to the bulk solution (Abulk) with the same mass transfer coefficient (kt).41 When the analyte reaches the sensor chip surface, it binds to the ligand resulting in the formation of the ligand–analyte (LA) complex, characterized by the association rate constants (kon) and the dissociation rate constant (koff):
|
|
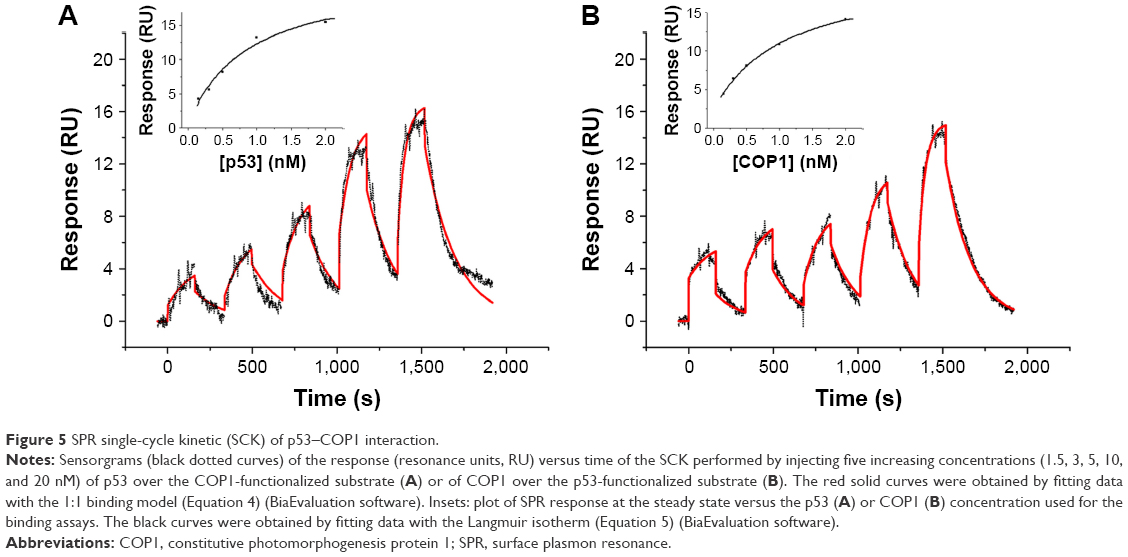 | Figure 5 SPR single-cycle kinetic (SCK) of p53–COP1 interaction. |
Accordingly, the variation of Asurface, L, and LA concentrations with time can be described by the following set of differential equations:42
|
|
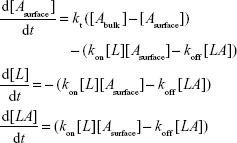
We fitted the sensorgram according to a nonlinear least square analysis and numerical integration of Equation 4 using the BiaEvaluation software and we extracted the kinetic parameters kon and koff. Figure 5A shows the curve obtained from the fitting procedure (red solid curve) overlaid on the experimental data (black dotted curve). Accordingly, we obtained a kon of (8.6±0.2) 105 M−1 s−1, a koff of (5.6±0.1) 10−3 1/s, and a KD of (6.5±0.2) 10−9 M (Rmax =18.2 RU; reduced χ2=0.59). We also performed a steady-state affinity analysis on the same experimental data (BiaEvaluation software). The inset of Figure 5A shows the plot of the response at equilibrium (Req), calculated at 5 s before the end of each injection, versus the corresponding concentration of p53 [p53]. Data were fitted by using the Langmuir isotherm (Equation 5), including a term for the bulk refractive index (RI) contribution, which is assumed to be the same for all samples and which is used as the response-axis offset.39,40
|
|
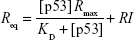
From this fitting procedure (continuous line, inset of Figure 5A), we obtained a KD almost identical to that obtained by the global fitting procedures described earlier, but showing a somewhat higher uncertainty. To take into account for possible artifacts such as an effect of the random ligand immobilization on the binding and an error of estimating the active concentration of analyte, we have calculated the kinetic parameters by reversing the immobilization of the partners.43 Accordingly, we immobilized p53 over the CM5 sensor chip surface and fluxed COP1 as an analyte with the same procedure and concentrations. In this case, the sensorgram (Figure 5B) shows a trend similar to that of the previous configuration (Figure 5A) and the fitting procedure provided very close kinetic parameters (kon = (9.1±0.1) 105 M−1 s−1; koff = (6.5±0.1) 10−3 s−1; KD = (7.2±0.1) 10−9 M, Rmax =16.8 RU, reduced χ2=0.19) (Figure 5B). Moreover, the steady-state affinity analysis (BiaEvaluation software) provided a slightly lower KD value (KD = (1.1±0.2) 10−9 M, Rmax =18.0 RU, reduced χ2=0.04) (inset of Figure 5B).
Interestingly, the KD value of the p53–COP1 complex obtained in bulk by SPR is of the same order of that found at the single-molecule level. A slight discrepancy is instead observed in the lifetime (τ=1/koff) between the bulk (3 min) and the single-molecule (17 min) experiments.
The high affinity value of the p53–COP1 complex, as confirmed by both SPR and AFS, is remarkably close to those usually found for strong protein–protein interactions and for antigen–antibody pairs.32,44 Additionally, we would note that the affinity of p53-COP1 complex is significantly higher than those of p53-MDM2, p53-MDM4 and also MDM2-MDM4 complexes.20,21,45 In this connection, the interaction of COP1 with p53 appears stronger than other inhibitors, such as MDM2 and MDM4, with this possibly indicating a novel facet of the molecular mechanism of COP1 in p53 downregulation. Furthermore, the lifetime in the order of minutes of the p53–COP1 complex indicates a high stability and could give novel intriguing information on its biological function by comparing with related complexes. Indeed, the p53–COP1 complex, possessing a longer lifetime than the p53–MDM2 complex, might play an important role in p53 downregulation. In light of these results, the p53–COP1 complex could represent a realistic target for anticancer drugs aimed at preventing p53 proteasome degradation, especially in tumors displaying COP1 overexpression.9–13
Conclusion
The bimolecular complex formed by the tumor suppressor p53 and the ubiquitin ligase COP1, topographically visualized on a mica substrate, is characterized by a surprisingly high specificity and affinity, both at the single-molecule level and in bulk solution. We note that the p53–COP1 interaction is characterized by a higher affinity and by a longer lifetime with respect to the complex formed by p53 and its major ubiquitin ligase, MDM2, strengthening the importance of COP1 in p53 downregulation. Collectively, our results point out that the p53–COP1 complex could be a remarkable target for anticancer drug design strategies aimed at protecting p53 from proteasome degradation as induced by COP1, with this being particularly true for COP1-overexpressing tumors. More interestingly, koff and KD values of the p53–COP1 complex should undoubtedly constitute a reference to take into consideration when designing and optimizing small molecules or peptides able to bind to p53 or COP1, possibly exerting a direct or an allosteric antagonism on the COP1 inhibitory activity and consequently increasing post translational levels of p53.
Acknowledgments
This work was supported by the Italian Association for Cancer Research (AIRC): Grant IG15866 to SC. We thank Dr Michela Delfino for preliminary AFS measurements.
Disclosure
The authors report no conflicts of interest in this work.
References
Muller PAJ, Vousden KH. Mutant p53 in cancer: new functions and therapeutic opportunities. Cancer Cell. 2014;25(3):304–317. | ||
Joerger AC, Fersht AR. The p53 pathway: origins, inactivation in cancer, and emerging therapeutic approaches. Annu Rev Biochem. 2016;85(1):375–404. | ||
Jain AK, Barton MC. Making sense of ubiquitin ligases that regulate p53. Cancer Biol Ther. 2010;10(7):665–672. | ||
Sane S, Rezvani K. Essential roles of E3 ubiquitin ligases in p53 regulation. Int J Mol Sci. 2017;18(2):442. | ||
Dornan D, Wertz I, Shimizu H, et al. The ubiquitin ligase COP1 is a critical negative regulator of p53. Nature. 2004;429(6987):86–92. | ||
Bianchi E, Denti S, Catena R, et al. Characterization of human constitutive photomorphogenesis protein 1, a RING finger ubiquitin ligase that interacts with Jun transcription factors and modulates their transcriptional activity. J Biol Chem. 2003;278(22):19682–19690. | ||
Shao J, Teng Y, Padia R, et al. COP1 and GSK3β cooperate to promote c-Jun degradation and inhibit breast cancer cell tumorigenesis. Neoplasia. 2013;15(9):1075–1085. | ||
Migliorini D, Bogaerts S, Defever D, et al. COP1 constitutively regulates c-Jun protein stability and functions as a tumor suppressor in mice. J Clin Invest. 2011;121(4):1329–1343. | ||
Dornan D, Bheddah S, Newton K, et al. COP1, the negative regulator of p53, is overexpressed in breast and ovarian adenocarcinomas. Cancer Res. 2004;64(20):7226–7230. | ||
Lee Y-H, Andersen JB, Song H-T, et al. Definition of ubiquitination modulator COP1 as a novel therapeutic target in human hepatocellular carcinoma. Cancer Res. 2010;70(21):8264–8269. | ||
Zou S, Zhu Y, Wang B, et al. The ubiquitin ligase COP1 promotes glioma cell proliferation by preferentially downregulating tumor suppressor p53. Mol Neurobiol. 2017;54(7):5008–5016. | ||
Li J, Wang L, Xiao R, Pan Q, Huang H, Kuang R. High expression of constitutive photomorphogenic 1 (COP1) is associated with poor prognosis in bladder cancer. Tumour Biol. 2016;37(7):8917–8922. | ||
Li Y, Wang D, Zhao B, et al. High level of COP1 expression is associated with poor prognosis in primary gastric cancer. Int J Biol Sci. 2012;8(8):1168–1177. | ||
Yamada T, Das Gupta TK, Beattie CW. p28, an anionic cell-penetrating peptide, increases the activity of wild type and mutated p53 without altering its conformation. Mol Pharm. 2013;10(9):3375–3383. | ||
Yamada T, Christov K, Shilkaitis A, et al. p28, a first in class peptide inhibitor of cop1 binding to p53. Br J Cancer. 2013;108(12):2495–2504. | ||
Bizzarri AR, Cannistraro S. The application of atomic force spectroscopy to the study of biological complexes undergoing a biorecognition process. Chem Soc Rev. 2010;39(2):734–749. | ||
Kienberger F, Ebner A, Gruber HJ, Hinterdorfer P. Molecular recognition imaging and force spectroscopy of single biomolecules. Acc Chem Res. 2006;39(1):29–36. | ||
Cooper MA. Optical biosensors in drug discovery. Nat Rev Drug Discov. 2002;1(7):515–528. | ||
Funari G, Domenici F, Nardinocchi L, et al. Interaction of p53 with MDM2 and azurin as studied by atomic force spectroscopy. J Mol Recognit. 2010;23(4):343–351. | ||
Domenici F, Frasconi M, Mazzei F, D’Orazi G, Bizzarri AR, Cannistraro S. Azurin modulates the association of MDM2 with p53: SPR evidence from interaction of the full-length proteins. J Mol Recognit. 2011;24(4):707–714. | ||
Moscetti I, Teveroni E, Moretti F, Bizzarri AR, Cannistraro S. MDM2-MDM4 molecular interaction investigated by atomic force spectroscopy and surface plasmon resonance. Int J Nanomedicine. 2016;11:4221–4229. | ||
Moscetti I, Bizzarri AR, Cannistraro S. Binding kinetics of mutant p53R175H with wild type p53 and p63: a surface plasmon resonance and atomic force spectroscopy study. Biophys Chem. 2017;228:55–61. | ||
Santini S, Di Agostino S, Coppari E, Bizzarri AR, Blandino G, Cannistraro S. Interaction of mutant p53 with p73: a surface plasmon resonance and atomic force spectroscopy study. Biochim Biophys Acta. 2014;1840(6):1958–1964. | ||
Horcas I, Fernández R, Gómez-Rodríguez JM, Colchero J, Gómez-Herrero J, Baro AM. WSXM: a software for scanning probe microscopy and a tool for nanotechnology. Rev Sci Instrum. 2007;78(1):013705. | ||
Friedsam C, Wehle AK, Kühner F, Gaub HE. Dynamic single-molecule force spectroscopy: bond rupture analysis with variable spacer length. J Phys Condens Matter. 2003;15(18):S1709. | ||
Bechhoefer HJ. Calibration of atomic-force microscope tips. Rev Sci Instrum. 1993;64(7):1868–1873. | ||
Bizzarri AR, Cannistraro S. Antigen–antibody biorecognition events as discriminated by noise analysis of force spectroscopy curves. Nanotechnology. 2014;25(33):335102. | ||
Bizzarri AR, Cannistraro S. 1/f α noise in the dynamic force spectroscopy curves signals the occurrence of biorecognition. Phys Rev Lett. 2013;110(4):048104. | ||
Johnsson B, Löfås S, Lindquist G. Immobilization of proteins to a carboxymethyldextran-modified gold surface for biospecific interaction analysis in surface plasmon resonance sensors. Anal Biochem. 1991;198(2):268–277. | ||
Karlsson R, Katsamba PS, Nordin H, Pol E, Myszka DG. Analyzing a kinetic titration series using affinity biosensors. Anal Biochem. 2006;349(1):136–147. | ||
Myszka DG. Kinetic analysis of macromolecular interactions using surface plasmon resonance biosensors. Curr Opin Biotechnol. 1997;8(1):50–57. | ||
Coppari E, Santini S, Bizzarri AR, Cannistraro S. Kinetics and binding geometries of the complex between β2-microglobulin and its antibody: an AFM and SPR study. Biophys Chem. 2016;211:19–27. | ||
Nuttall P, Lee K, Ciccarella P, et al. Single-molecule studies of unlabeled full-length p53 protein binding to DNA. J Phys Chem B. 2016;120(9):2106–2114. | ||
Bell GI. Models for the specific adhesion of cells to cells. Science. 1978;200(4342):618–627. | ||
Evans E, Ritchie K. Dynamic strength of molecular adhesion bonds. Biophys J. 1997;72(4):1541–1555. | ||
Bizzarri AR, Cannistraro S. Atomic force spectroscopy in biological complex formation: strategies and perspectives. J Phys Chem B. 2009;113(52):16449–16464. | ||
Bizzarri AR, Santini S, Coppari E, et al. Interaction of an anticancer peptide fragment of azurin with p53 and its isolated domains studied by atomic force spectroscopy. Int J Nanomedicine. 2011;6:3011–3019. | ||
Taranta M, Bizzarri AR, Cannistraro S. Probing the interaction between p53 and the bacterial protein azurin by single molecule force spectroscopy. J Mol Recognit. 2008;21(1):63–70. | ||
Björquist P, Boström S. Determination of the kinetic constants of tissue factor/factor VII/factor VIIA and antithrombin/heparin using surface plasmon resonance. Thromb Res. 1997;85(3):225–236. | ||
O’Shannessy DJ, Brigham-Burke M, Soneson KK, Hensley P, Brooks I. Determination of rate and equilibrium binding constants for macromolecular interactions using surface plasmon resonance: use of nonlinear least squares analysis methods. Anal Biochem. 1993;212(2):457–468. | ||
Glaser RW. Antigen-antibody binding and mass transport by convection and diffusion to a surface: a two-dimensional computer model of binding and dissociation kinetics. Anal Biochem. 1993;213(1):152–161. | ||
Morton TA, Myszka DG, Chaiken IM. Interpreting complex binding kinetics from optical biosensors: a comparison of analysis by linearization, the integrated rate equation, and numerical integration. Anal Biochem. 1995;227(1):176–185. | ||
Van Der Merwe PA. Surface Plasmon Resonance. Oxford: Oxford University Press; 2001. | ||
Nooren IMA, Thornton JM. Structural characterisation and functional significance of transient protein-protein interactions. J Mol Biol. 2003;325(5):991–1018. | ||
Bista M, Petrovich M, Fersht AR. MDMX contains an autoinhibitory sequence element. Proc Natl Acad Sci U S A. 2013;110(44):17814–17819. |
 © 2018 The Author(s). This work is published and licensed by Dove Medical Press Limited. The full terms of this license are available at https://www.dovepress.com/terms.php and incorporate the Creative Commons Attribution - Non Commercial (unported, v3.0) License.
By accessing the work you hereby accept the Terms. Non-commercial uses of the work are permitted without any further permission from Dove Medical Press Limited, provided the work is properly attributed. For permission for commercial use of this work, please see paragraphs 4.2 and 5 of our Terms.
© 2018 The Author(s). This work is published and licensed by Dove Medical Press Limited. The full terms of this license are available at https://www.dovepress.com/terms.php and incorporate the Creative Commons Attribution - Non Commercial (unported, v3.0) License.
By accessing the work you hereby accept the Terms. Non-commercial uses of the work are permitted without any further permission from Dove Medical Press Limited, provided the work is properly attributed. For permission for commercial use of this work, please see paragraphs 4.2 and 5 of our Terms.