")
Back to Journals » Diabetes, Metabolic Syndrome and Obesity » Volume 12
IL6R inhibits viability and apoptosis of pancreatic beta-cells in type 2 diabetes mellitus via regulation by miR-22 of the JAK/STAT signaling pathway
Authors Wu X, Yu T, Ji N, Huang Y, Gao L, Shi W, Yan Y, Li H, Ma L, Wu K, Wu Z
Received 9 April 2019
Accepted for publication 10 July 2019
Published 29 August 2019 Volume 2019:12 Pages 1645—1657
DOI https://doi.org/10.2147/DMSO.S211700
Checked for plagiarism Yes
Review by Single anonymous peer review
Peer reviewer comments 2
Editor who approved publication: Prof. Dr. Antonio Brunetti
Xinhua Wu,1 Tao Yu,1 Ning Ji,1 Yujie Huang,1 Lingcheng Gao,1 Wen Shi,1 Yan Yan,1 Hang Li,1 Liming Ma,1 Kede Wu,2 Zhen Wu3
1Department of Endocrinology, Huaian Hospital of Huaian District, Huaian, Jiangsu 223200, People’s Republic of China; 2Clinical Medicine, Medical College of Yangzhou University, Yangzhou, Jiangsu 225009, People’s Republic of China; 3Electric Engineering, China University of Mining and Technology, Xuzhou, Jiangsu 221116, People’s Republic of China
Correspondence: Xinhua Wu
Department of Endocrinology, Huaian Hospital of Huaian District, 50 Meters North of Huaihe Road, Huaian 223200, People’s Republic of China
Tel +865 178 593 9208
Email [email protected]
Background and aim: Type 2 diabetes mellitus (T2DM) is a common disease of harming to people’s health. MicroRNAs have recently been considered as key regulators of many biological processes, such as cell proliferation, migration and apoptosis. However, the effect of miR-22 expression by targeting IL6 receptor (IL6R) in T2DM and potential molecular mechanism involved remains to be elucidated. The present study aimed to explore the regulatory mechanism of miR-22 by targeting IL6R in pancreatic beta-cells viability and apoptosis of T2DM.
Methods: The expressions of miR-22, IL6R and apolipoprotein (apoA1, apoB and apoE) were examined by reverse transcription-quantitative PCR (qRT-PCR). Pancreatic beta-cells were transiently transfected with a miR-22 mimic or si-IL6R plasmid which validated with qRT-PCR to analyze the expression of miR-22 or IL6R. Cell viability, apoptosis and protein expression levels were determined by CCK-8, flow cytometry and Western blotting, respectively.
Results: The proportion of INS-1E cell apoptosis was increased in islets of diabetic rats. Furthermore, miR-22 was downregulated and IL6R was upregulated in both diabetic serum and glucose-induced INS-1E cells. miR-22 overexpression or IL6R inhibition significantly strengthened cell viability and reduced the expression of apoptosis-related proteins to suppress cell apoptosis. IL6R was demonstrated as a target gene of miR-22 which could negatively regulate IL6R expression. Moreover, phosphorylation of JAK/STAT signaling pathway was activated by miR-22 overexpression or IL6R inhibition to strengthen the viability and suppress apoptosis of INS-1E cells.
Conclusion: This study indicated that miR-22 strengthened the viability and suppressed apoptosis of INS-1E cells, partly by down-regulation of IL6R through the activation of JAK/STAT signaling pathway.
Keywords: IL6R, pancreatic beta-cells, type 2 diabetes mellitus, JAK/STAT signaling pathway, miR-22
Introduction
Diabetes is a common chronic disease caused by endocrine hormone and glucose metabolism dysfunction, which can result in systemic metabolic disorders. According to the WHO, approximately 422 million people worldwide had developed diabetes in 2016, of which over 90% were type 2 diabetes mellitus (T2DM) cases.1 T2DM is characterized by hyperglycemia and was formerly termed non-insulin dependent diabetes mellitus due to insulin insensitivity.2–4 Pancreatic beta-cells are the main cells capable of secreting insulin. This hormone along with glucagon which is secreted by the pancreatic alpha-cells regulate blood glucose levels. Pancreatic beta-cells failure, insufficient insulin secretion and insulin resistance can cause increased blood glucose levels, which can trigger the onset of T2DM.5–7 Apoptosis is a key factor for the pancreatic beta-cell dysfunction which is the main cause of insulin secretion deficiency. Pancreatic beta-cells failure is considered as a necessary condition for the development of T2DM.8 Therefore, one of the main targeting strategies to treat T2DM is the inhibition of the pancreatic beta-cells apoptosis.
IL6 is a pleiotropic cytokine secreted by various cells, including lymphocyte, endothelial cell, fibroblast, skeletal muscle cell and adipocyte. By combining with the IL6 receptor (IL6R) on the surface of target cells, IL6 induces a series of biological reactions in different target cells to participate in glucose and lipid metabolism.9,10 In Hubei Han Population, D358A gene polymorphism of IL6R was related to T2DM. Furthermore, D358A gene reduced the occurrence of T2DM by reducing IL6R signal transduction and signal transduction of other cytokines regulated by IL6R.11 IL6 is also involved in the development and immune changes of T2DM.12,13 Study indicated that IL6/IL6R complex levels in serum were significantly increased in T2DM patients.14 Animal experiment has shown that IL6 can induce an increase in the release of glucagon in mice, thereby stimulating the release of liver glycogen and leading to an increase in blood glucose.15 Low IL6 concentration promotes insulin secretion, while high IL6 concentration inhibits insulin secretion. With the increase of IL6, function of pancreatic islet may be impaired leading to the inhibition of insulin secretion, which accelerates the process of diabetes.16 IL6R is partly homologous with the signal transduction of leptin receptor. Leptin is a fat-regulating hormone synthesized and secreted by adipocytes. Under physiological conditions, it can specifically and powerfully weaken the effect of insulin. IL6 can compete with leptin for the binding site of leptin receptor, making leptin unable to play its role in inhibiting insulin, which results in hyperinsulinemia and insulin resistance syndrome.17 Hence, IL6 is closely related to the occurrence and development of diabetes and IL6 activity is regulated by the IL6R complex system. IL6 can only induce signal transduction by binding to its receptor to form IL6R/IL6 complex.18 However, the effect of IL6R on T2DM and specific mechanism involved is still unknown.
MicroRNAs (miRNAs) are small non-coding RNAs of approximately 19–25 nucleotides.19 miR-22 was down-regulated in several cancers, such as breast cancer, liver cancer, colorectal cancer and tongue squamous cell carcinoma.20–23 miR-22 was decreased in clear cell renal cell carcinoma and miR-22 overexpression could suppress cell growth, migration and invasion targeting PTEN gene.24 However, the role of miR-22 in regulating the INS-1E cells in T2DM, as well as its underlying mechanism is still unknown.
In the present study, the aim was to investigate the effect of IL6R on the viability and apoptosis of INS-1E cells regulated by miR-22 in T2DM and the underlying mechanism involved.
Materials and methods
Study population
A total of 60 subjects were recruited including 30 patients with T2DM and 30 age- and sex-matched control individuals. The T2DM subjects were recruited from the outpatient and inpatient groups of the Endocrinology department of the Huai’an Hospital (Jiangsu, China) between June 2017 and May 2018. The study protocol was approved by the Ethics committee of the Huai’an Hospital. The informed consents to participate in this experiment were written by participants. This study was conducted in accordance with the Declaration of Helsinki.
Blood sample collection
Following overnight fasting of the participants, 2 mL of intravenous blood were collected from each participant into a vacuum blood collection tube. The whole blood specimens were centrifuged at 3000 r/min at 4°C for 5 mins and serum was stored separately in an −80°C refrigerator for subsequent experiment.
Cell culture and glucose induction
The rat INS-1E cells (AddexBio, San Diego, CA, USA) were cultured in RPMI 1640 medium supplemented with 11 mM glucose, 5% FBS, 10 mM HEPES, 50 μM β-mercaptoethanol and 2 mM glutamine in a humidified atmosphere at 37°C with 5% CO2. INS-1E cells in control group were cultured with 11 mM glucose while INS-1E cells in model group were cultured with 25 mM glucose.
Diabetic rat model
Animal experiments were conducted following the “Principles of Laboratory Animal Care” (NIH publication 86-23, revised 1986) and the local regulations. Furthermore, all experiments were approved by the Animal Care and Use Committee and the Animal Ethics Committee at Huai’an Hospital. Twelve male Sprague-Dawley rats (SPF grade, 6 weeks, weighing 180–220 g) were obtained from Shanghai Jiesijie Experimental Animal Co. Ltd (Shanghai, China). All 12 rats were raised in ventilated plastic cages with free access to water and standard food in an environmentally controlled room (22°C±2°C, 12 hrs light–12 hrs dark cycle) for 3 days to acclimatize to their new environment. A total of 12 rats were divided into 2 groups (n=6, model group and control group). Then, six rats in the treatment group were fed with high-fat. Fasted for 12 hrs before the experiment, six rats were treated with 55 mg/kg streptozocin (STZ) by the intraperitoneal injection for 5 days. The blood was collected from the rat tail tip three times randomly for the determination of the blood glucose levels. The diabetic rat model was successfully established based on the measurement that blood glucose levels were higher than 16.7 mmol/L. The control group was raised under normal conditions.
si-IL6R transfection
At 24 hrs prior to transfection, INS-1E cells (106 cells per well) were reseeded into 12-well plates and grown at 37°C in a humidified atmosphere with 5% CO2. Lipofectamine® 2000 was applied to transfect the two types of plasmids (si-IL6R and blank plasmid) into the INS-1E cells. A total of 1 μg of plasmid and 2 μL of Lipofectamine® 2000 reagent were added into each well containing INS-1E cells. The experimental groups were divided into 4 groups as follows: si-IL6R-1 group, si-IL6R-2 group, blank plasmid (negative control, NC) group and control group. The transfection efficiency was evaluated by reverse transcription-quantitative PCR (RT-qPCR) by assessing the levels of IL-6R.
miR-22 mimic transfection
INS-1E cells (106 cells per well) were reseeded into 12-well plates and continuously cultured in serum-free DMEM culture medium at 37°C with 5% CO2. Next, miR-22 mimic and mimic control (NC) (Suzhou Gemma Co. Ltd., Suzhou, China) were transfected into the INS-1E cells using Lipofectamine® 2000 reagent (Invitrogen; Thermo Fisher Scientific, Inc., Waltham, MA, USA) according to the manufacturer’s protocol. No treatment was applied to INS-1E cells in the control group.
Hematoxylin-eosin (H&E) staining
The pancreatic tissues were immersed in 10% paraformaldehyde for 4 hrs, followed by transfer to 70% ethanol. The pancreatic tissues were dehydrated through a serial alcohol gradient, vitrified by xylene and embedded by paraffin. Prior to immunostaining, embedded paraffin wax blocks were cut into 5-μm-thick pancreatic tissue sections consecutively, which were then dewaxed in xylene, rehydrated in alcohol and washed in PBS. Subsequently, the pancreatic tissue sections were stained with H&E and dehydrated with progressive treatment of alcohol and xylene. Finally, the stained pancreatic tissue sections were observed with a microscope and photographed with a digital camera.
TUNEL staining
The paraffin sections were dewaxed with xylene for 10 mins and treated for a further 10 mins with fresh xylene. The sections were finally dehydrated by a serial alcohol gradient. DNase-free protease K (20 µg/mL) was added into the tissue slides and incubated at 20–37°C for 15–30 mins, followed by PBS washing for 3 times. Subsequently, 50 µL of TUNEL solution was added into the tissue slides and incubated at 37°C for 60 mins in the dark. Following washing with PBS for 3 times, the tissue slides were treated with an anti-fluorescence quenching agent and observed by fluorescence microscopy.
Immunohistochemistry
The paraffin sections were dewaxed, hydrated, and incubated with 3% H2O2 for 10 mins to inactivate the endogenous peroxidase activity. Subsequently, the tissue slides were washed with water and PBS for 3 times. Goat serum (10%) was used to block the nonspecific binding of the primary antibody to the tissue slides, which were subsequently incubated for 10 mins at room temperature, followed by an additional incubation with antibodies against IL6R (item no. 373708; Santa Cruz Biotech, Inc., TX, USA) at 37°C for 2 hrs. The tissue slides were washed with PBS for 3 times, followed by incubation with the secondary HRP-conjugated antibody (Santa Cruz Biotech, Inc., TX, USA) at 37°C for 30 mins. The tissue slides were stained with DAB substrate chromogen solution (Histolab Products AB, Goteborg, Sweden), washed with water, counterstained with hematoxylin, dehydrated, vitrified and laminated. A microscope (Carl Zeiss, Jena, Germany) was applied for the observation of the tissue slides and the images were acquired using a digital camera (Carl Zeiss, Jena, Germany).
RT-qPCR analysis
Total RNA was extracted from the serum of diabetic patients serum and from INS-1E cells with the TRIzol reagent (Invitrogen, Carlsbad, CA, USA), followed by treatment of the samples with DNaseI (Promega Corporation, Madison, WI, USA). Total RNA (0.5 μg) was reversely transcribed with Taqman MicroRNA Reverse Transcription Kit (Applied Biosystems, Foster City, CA, USA) and real-time PCR was conducted for the assessment of miR-22 expression levels using the Taqman Universal Master Mix II (Applied Biosystems). In order to measure the expression levels of IL6R and of specific apolipoprotein (apoA1, apoB and apoE), RNA PCR Kit (AMV) Ver.3.0 (TaKaRa, Dalian, China) was used for reverse transcription and SYBR®Premix Ex TaqTM II (TaKaRa) was used for quantitative PCR. The amplification conditions were as follows: 95°C for 10 mins, followed by 38 cycles of 95°C for 10 s and 58°C for 60 s. miR-22 expression was normalized to U6 and mRNA expression of IL6R and apolipoprotein (apoA1, apoB and apoE) were normalized to GAPDH. The primer sequences for qPCR were as follows: U6 forward, 5ʹ-CTCGCTTCGGCAGCACA-3ʹ, and reverse, 5ʹ-AACGCTTCACGAATTTGCGT-3ʹ; miR-22 forward, 5ʹ-GGGGGATCCCTGGGGCAGGACCCT-3ʹ, and reverse, 5ʹ-GGGGAATTCAACGTATCATCCACCC-3ʹ; GAPDH forward, 5ʹ-GAAGGTGAAGGTCGGAGTC-3ʹ, and reverse, 5ʹ-GAAGATGGTGATGGGATTTC-3ʹ; apoA1 forward, 5ʹ-GAACAAGGACCTGGAGAATG-3ʹ, and reverse, 5ʹ-CTGGCCTTGGTATGATACTCʹ; apoB forward, 5ʹ-CACTTTGAGTTGCCCACCAT-3ʹ, and reverse, 5ʹ-TATTGAGGTGCGCTTTTCCT-3ʹ; apoE forward, 5ʹ-GAGCAGGCCCTGAACCGCTT-3ʹ, and reverse, 5ʹ-AGCCTGGCCCGTGTCTCCTC-3ʹ; IL6R forward, 5ʹ-CCCCTCAGCAATGTTGTTTGT-3ʹ and reverse, 5ʹ-CTCCGGGACTGCTAACTGG-3ʹ. The results were presented as fold changes relative to U6 or GAPDH and calculated using the 2−ΔΔCq method.
CCK-8 assay
Following transfection, transfected cells were seeded into 96-well plates (5000 cells per well) and cultured at 37°C in a humidified atmosphere containing 5% CO2. Following cell culture for 48 hrs, the cells were treated with CCK-8 solution. Finally, the absorbance value was read on a microplate spectrophotometer (Model 680; Bio-Rad, Hercules, CA, USA) at 490nm. All experiments were repeated in triplicate.
Western blot analysis
Total cell protein from INS-1E cells was extracted using RIPA buffer (Thermo Scientific, Rockford, IL, USA). Protein concentration was quantified by the BCA Protein Assay Kit (Pierce, Rockford, IL, USA). A total of 30 μg of protein was loaded and separated by PAGE using gradient 10% gels (Invitrogen; Thermo Fisher Scientific, Inc., Waltham, MA, USA) that were transferred to polyvinylidene difluoride membranes (Millipore, Billerica, MA, USA). Following blocking with 5% dry nonfat milk in PBST for 1 hrs, the membranes were incubated with primary antibodies against Bcl-2 (cat no. 4223; Cell Signaling Technology, Inc., Waltham, MA, USA; dilution, 1:1000), Bax (cat no. 5023; Cell Signaling Technology, Inc.; dilution, 1:1000), caspase-3 (cat no. 9662; Cell Signaling Technology, Inc.; dilution, 1:1000), JAK (cat no. 3332; Cell Signaling Technology, Inc.; dilution, 1:1000), p-JAK (cat no. 66245; Cell Signaling Technology, Inc.; dilution, 1:1000), STAT (cat no. 9172; Cell Signaling Technology, Inc.; dilution, 1:1000), p-STAT (cat no. 7649; Cell Signaling Technology, Inc.; dilution, 1:1000) and GAPDH (cat no. 5174; Cell Signaling Technology, Inc.; dilution, 1:1000) overnight at 4°C. The membranes were subsequently incubated with horseradish peroxidase-conjugated goat anti-rabbit secondary antibody (Santa Cruz Biotechnology, Santa Cruz, CA, USA) for 1 hr at 37°C. Finally, the membranes were washed with PBST and the protein bands were detected using ECL reagents (Amersham Biosciences, Shanghai, China).
Flow cytometry analysis
Briefly, INS-1E cells were digested with trypsin, washed once with PBS, resuspended in 500 µL of buffer solution and subsequently stained with 5 µL of FITC-Annexin-V (BD Biosciences, San Jose, CA, USA) for 15 mins and 5 µL of propidium iodide (BD Biosciences) for 5 mins in the dark at room temperature. Finally, the process was terminated by the addition of ending buffer and the samples were analyzed by a FACS Calibur flow cytometer (BD Biosciences) within 1 hrs.
Dual-luciferase reporter assay
Using the TargetScan software, IL6R was predicted as a potential target of miR-22. The dual-luciferase reporter assay system (Promega Corporation) was used to verify this prediction. Briefly, the 3ʹ-untranslated region (3ʹ-UTR) mutant type (MT) of IL6R lacking the binding sites for the miR-22 sequence was constructed using a QuickChange Site-Directed Mutagenesis kit (Stratagene, La Jolla, CA, USA). The 3ʹ-UTR wild type (WT) or MT of IL6R was cloned in a pMIR-GLOTM vector (Promega Corporation) containing the firefly luciferase coding region. INS-1E cells were co-transfected with the pGL3-IL6R 3ʹ-UTR luciferase plasmid (containing MT IL6R 3ʹ-UTR or WT IL6R 3ʹ-UTR) and miR-22 mimic or mimic control (NC) vector using Lipofectamine® 2000 reagent according to the manufacturer’s protocol.
Statistical analysis
SPSS 22.0 (SPSS Inc., Chicago, IL, USA) was used to perform statistical analyses. All data were presented as the mean ± standard error. Indepedent sample t-test or one-way ANOVA was applied to analyze the differences between groups. Pearson correlation analysis was used for the correlation analysis between the two variables. P<0.05 was considered statistically significant.
Results
Expression of IL6R, apoA1, apoB and apoE in the serum of diabetic patients
The RT-qPCR was applied to the determination of expression levels of IL6R, apoA1, apoB and apoE in the serum. ApoA1 is the main component of high-density lipoprotein. ApoB is the main apolipoprotein of low-density lipoprotein. ApoE is an important component of plasma lipoprotein. There is a close relationship between apolipoprotein and T2DM.25 RT-qPCR was applied for the determination of the expression levels of IL6R, apoA1, apoB and apoE in the serum. The results demonstrated that IL6R expression levels were significantly higher in the serum of the diabetic subjects, while the expression levels of apoA1, apoB and apoE were apparently lower compared with those of the normal patients (Figure 1). The results of the correlation analysis of the IL-6R expression with the clinical characteristics of the diabetic patients are shown in Tables 1 and 2. The expression levels of IL-6R were negatively associated with the levels of ApoA1, ApoB and ApoE, which indicated significant differences compared with those of the control samples. The levels of IL-6R were positively associated with the levels of the glycosylated hemoglobin and with the incidence of microalbuminuria, which indicated significant differences (P<0.05). However, the differences among the levels of IL-6R with age or gender were non-significant (P>0.05).
 |
Table 1 Correlation analysis of IL-6R and clinical characteristics of diabetic patients |
 |
Table 2 IL-6R difference in different genders |
 |
Figure 1 Expression of IL6R, apoA1, apoB and apoE in the serum of diabetic patients. **P<0.01 and ***P<0.001 vs normal group.Abbreviations: apoA1, apolipoprotein A1; apoB, apolipoprotein B; apoE, apolipoprotein E; IL6R, IL6 receptor. |
Changes in the body weight and glucose of rat after STZ induction
Following STZ treatment to diabetic rats, their body weight was gradually decreased compared with the control rats exhibiting gradually increased body weight. The latter was apparently lower in diabetic rats on the 4th and 5th day compared with that of the control rats (Figure S1A and B). The blood glucose levels of the diabetic rats exhibited a sharp rise on the first day, which was subsequently maintained over the next 4 days (Figure S1C and D).
Pancreatic beta-cell count and IL6R expression levels in the diabetic rat pancreas tissues
H&E and TUNEL staining were applied to the analysis of the pancreatic beta-cell count and of the pancreatic beta-cell apoptosis, respectively. The number of pancreatic beta cells was decreased and the percentage of pancreatic beta-cell apoptosis was increased in the diabetic rat pancreatic tissues compared with those of the control animals (Figure 2A and B). Immunohistochemistry was used for the determination of IL6R expression levels. The expression levels of IL6R were increased in the diabetic rat pancreatic tissues compared with those of the control samples (Figure 2C). These results indicated that pancreatic beta cells and IL6R may be involved in diabetes progression.
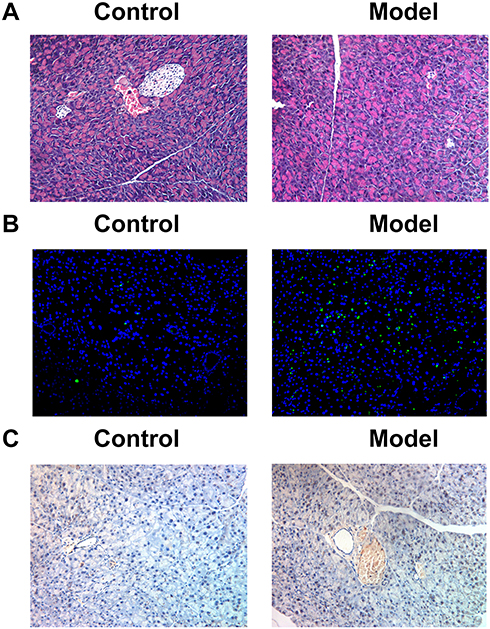 |
Figure 2 Pancreatic beta-cell count and IL6R expression in the diabetic rat pancreas tissues. (A) The number of pancreatic beta-cell observed by hematoxylin-eosin staining. (B) The apoptosis of pancreatic beta-cell observed by TUNEL staining. (C) IL6R expression observed by immunohistochemistry. Abbreviation: IL6R, IL6 receptor. |
Expression levels of IL6R in the glucose-induced INS-1E cells
To determine the expression levels of IL6R in glucose-treated INS-1E cells, RT-qPCR was performed. The results indicated that the IL6R expression levels were apparently higher in glucose-treated INS-1E cells compared with those of the control cells (Figure 3A). Subsequently, the effects of IL6R on glucose-induced INS-1E cells were examined in the presence of the si-IL6R-1 and in the presence of the NC inhibitor, respectively. The efficiency of transfection was verified by RT-qPCR. As expected, IL6R expression was downregulated in glucose-treated INS-1E cells following transfection with the compared with that noted in the control and the NC groups (Figure 3B).
 |
Figure 3 Effect of IL6R on the viability and apoptosis of glucose-induced INS-1E cells. (A) IL6R expression in the glucose-induced INS-1E cells. (B) IL6R expression in different groups, as detected by reverse transcription-quantitative PCR. (C) Cell viability represented as OD values in different groups. (D) Apoptosis of INS-1E cells in different groups and proportion of apoptotic cells. **P<0.01 and ***P<0.001 vs control group. #P<0.05 and ##P<0.01 and P<0.001 vs NC group.Abbreviations: NC, negative control inhibitor; IL6R, IL6 receptor. |
Effect of IL6R on the viability and apoptosis of glucose-treated INS-1E cells
The viability of glucose-treated INS-1E cells was increased over time and IL6R inhibition was shown to promote this process compared with the viability of the control and the NC groups (Figure 3C). Flow cytometry analysis indicated that the percentage of cell apoptosis was notably lower in the group compared with that of the control and the NC groups (Figure 3D). These results demonstrated that IL6R inhibition promoted the viability and inhibited the apoptosis of glucose-treated INS-1E cells.
miR-22 directly targets IL6R
Bioinformatic analysis was conducted with miRcode tool to predict the potential targets of miR-22, and the findings revealed that IL6R was one of the target genes of this miRNA. In addition, the TargetScan tool was used to predict the binding sites of miR-22 and IL6R (Figure 4A). To confirm whether IL6R was directly targeted and regulated by miR-22 in glucose-treated INS-1E cells, luciferase reporter genes with 3′-UTR IL6R and the mutant counterpart for the miR-22 binding regions were co-transfected with miR-22 mimic or NC mimic into these cells. Luciferase reporter assay indicated that miR-22 overexpression significantly inhibited the luciferase activity of IL6R with the WT 3′-UTR, whereas this was not noted in the presence of the mutant 3′-UTR gene (Figure 4B). And, miR-22 overexpression could obviously down-regulate the expression of IL6R compared with the control group and NC group (Figure 4C). As a result, miR-22 directly targets IL6R.
 |
Figure 4 miR-22-3p directly targeting IL-6R and effect of miR-22 on the viability and apoptosis of glucose-induced INS-1E cells. (A) Interaction between miR-22-3p and 3ʹ-UTR of IL-6R was predicted by TargetScan. (B) Luciferase activity of a reporter containing IL-6R 3ʹ-UTR-WT or 3ʹ-UTR-MUT (with a mutation in the miR-22-3p binding site). (C) IL-6R expression affected by the changes of miR-22 expression. (D) miR-22 expression in people of different groups. (E) miR-22 expression in INS-1E cells of different groups. (F) miR-22 expression in different groups, as detected by reverse transcription-quantitative PCR. (G) Cell viability represented as OD values in different groups. (H and I) Apoptosis of INS-1E cells in different groups and proportion of apoptotic cells. **P<0.01 and ***P<0.001 vs control group. #P<0.05 and ##P<0.01 vs NC group.Abbreviations: NC, negative control mimic; UTR, untranslated region; WT, wild type; MUT, mutated; IL6R, IL6 receptor. |
miR-22 expression levels in the serum of diabetic patients and glucose-treated INS-1E cells
To determine the expression levels of miR-22 in the serum of diabetic patients and glucose-treated INS-1E cells, RT-qPCR was used. The results indicated that miR-22 expression levels were significantly higher in the model group compared with those of the control group (Figure 4D and E). These effects were noted both in patients and in the cell line model used in the present study (Figure 4D and E). The results demonstrated that miR-22 may be involved in the progress of diabetes.
Effect of miR-22 on the viability and apoptosis of glucose-treated INS-1E cells
To investigate the role of miR-22 in glucose-treated INS-1E cells, the cells were transfected with miR-22 mimic and NC mimic, respectively. The efficiency of transfection was verified by RT-qPCR. As shown in Figure 4F, miR-22 was upregulated in glucose-treated INS-1E cells by transfection with miR-22 mimic compared with the corresponding expression of miR-22 in the control and the NC groups.
To investigate the effects of miR-22 on the viability and apoptosis of glucose-treated INS-1E cells, CCK-8 assay and flow cytometry analysis were performed. The viability of glucose-induced INS-1E cells was increased over time and miR-22 overexpression further increased their viability compared with that of the control and the NC groups (Figure 4G). The rate of cell apoptosis was significantly decreased in the miR-22 mimic group compared with the control group. However, no significant differences were observed between the control and the NC groups (Figure 4H and I).
miR-22/IL-6R inhibits INS-1E cell apoptosis by downregulating the expression of the apoptotic proteins
To determine the expression levels of the apoptosis-related proteins (Bcl-2, Bax and caspase-3), Western blot analysis was used. MiR-22 overexpression or IL-6R inhibition inhibited the expression levels of Bax and caspase-3 while it increased the expression levels of Bcl-2 (Figures 5 and 6). These results indicated that miR-22 inhibited the expression levels of Bax and caspase-3 and induced the expression of Bcl-2, while IL-6R exhibited the opposite effects and inhibited the apoptotic rate of glucose-treated INS-1E cells.
 |
Figure 5 miR-22 overexpression inhibits INS-1E cells apoptosis through downregulation of protein expression. *P<0.05 and ***P<0.001 vs control group. #P<0.05 and ##P<0.01 vs NC group.Abbreviation: NC, negative control mimic. |
 |
Figure 6 IL-6R inhibition inhibits INS-1E cells apoptosis through downregulation of protein expression. *P<0.05 and **P<0.01 and ***P<0.001 vs control group. #P<0.05 and ##P<0.01 and P<0.001 vs NC group.Abbreviations: NC, negative control inhibitor; IL6R, IL6 receptor. |
miR-22/IL-6R promotes viability and inhibits apoptosis of INS-1E cells via the JAK/STAT signaling pathway
To determine the expression levels of JAK, p-JAK, STAT and p-STAT, Western blot analysis was performed. Overexpression of miR-22 or IL-6R inhibition promoted the expression of p-JAK and p-STAT, while no significant differences were noted in the presence of NC mimics or NC inhibitor compared with those noted in the control group (Figures 7 and 8). These results suggested that miR-22 promoted the activation of the JAK/STAT signaling pathway, while IL-6R suppressed the viability and inhibited the apoptotic rate of glucose-treated INS-1E cells.
 |
Figure 7 MiR-22 overexpression promotes the viability and inhibits apoptosis of INS-1E cells through JAK/STAT signaling pathway. **P<0.01 vs control group. ##P<0.01 vs NC group.Abbreviation: NC, negative control mimic. |
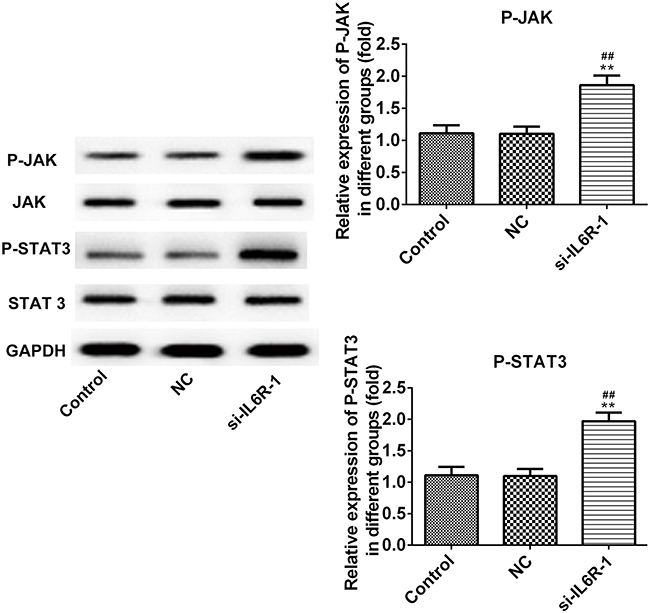 |
Figure 8 IL-6R inhibition promotes the viability and inhibits apoptosis of INS-1E cells through JAK/STAT signaling pathway. **P<0.01 vs control group. ##P<0.01 vs NC group.Abbreviations: NC, negative control inhibitor; IL6R, IL6 receptor. |
Discussion
In the present study, we investigated the effects of miR-22/IL6R on the regulation of the viability and apoptosis of INS-1E cells. In addition, the data indicated that these processes were mediated via the JAK/STAT signaling pathway. The expression levels of IL6R were increased in the serum of patients, in diabetic rat pancreatic tissues and in glucose-treated INS-1E cells, while the expression levels of miR-22 were decreased in the serum of patients and in glucose-treated INS-1E cells. CCK-8 assays and flow cytometry analysis were performed to evaluate the viability and the induction of apoptosis of glucose-treated INS-1E cells, respectively. The results indicated that downregulation of IL6R promoted the viability and inhibited apoptosis of glucose-treated INS-1E cells, suggesting that miR-22 may regulate cell viability and apoptosis at least partly via the regulation of IL6R. To our knowledge, this is the first study demonstrating that miR-22 regulated viability and apoptosis of glucose-treated INS-1E cells via the downregulation of IL6R and the regulation of the JAK/STAT signaling pathway.
It was reported that IL6R was associated with the STAT3 signaling pathway in hepatocellular carcinoma and that it played significant roles in the regulation of cell growth and invasion.26 The protein levels of IL6R were decreased by miR-22 overexpression in order to induce cell proliferation and to inhibit cell apoptosis in osteosarcoma cells.27 However, the role of IL6R in glucose-treated INS-1E cells remained unknown. Therefore, the expression levels of IL6R were we suppressed in glucose-treated INS-1E cells using specific siRNAs in order to identify the potential role of IL6R in this cell line model. The data further demonstrated that IL6R inhibition increased the expression levels of Bcl-2, while the levels of Bax and caspase-3 were decreased leading to a suppression of apoptosis in glucose-treated INS-1E cells. Moreover, it was shown that IL6R inhibition increased the expression levels of p-JAK and p-STAT leading to an increase in cell viability and to the inhibition of apoptosis of glucose-treated INS-1E cells. Taken collectively, the data suggested that IL6R inhibition promoted the viability and suppressed apoptosis of glucose-treated INS-1E cells.
miRNAs have been demonstrated to mediate post-transcriptional regulation of gene expression by binding the specific site of 3′-UTR of genes from plants to mammals.28 MiR-122 overexpression significantly upregulated the expression of Bcl-x and downregulated the expression of caspase-3 to increase the viability and inhibit the apoptosis of cardiomyocyte.29 Xia et al demonstrated that the expression levels of miR-125b-1 were decreased in human glioma cells and that its overexpression significantly promoted human glioma cell viability by inhibiting the early and late stages of apoptosis after transfection with miR-125b-1.30 Similarly, the expression of miR-374b in human gastrointestinal stromal tumor (GIST) cells was decreased and highly expressed miR-374b promoted proliferation and inhibited apoptosis of human GIST cells.31 The expression level of miR-22 was increased in type 1 diabetes mellitus compared to the controls.32 The miR-22 overexpression could inhibit neuronal apoptosis and play a protective role for neurons.33 These results indicated that miR-22 was related to the viability and apoptosis of cells. In the present study, we observed that the expression levels of miR-22 were significantly decreased in the serum of patients and in glucose-treated INS-1E cells. Subsequently, a miR-22 overexpression cell line model was established in order to unravel the underlying mechanism of apoptosis regulation in glucose-treated INS-1E cells. The data demonstrated that IL6R was a direct target of miR-22 and that miR-22 overexpression increased the expression levels of Bcl-2 and decreased the expression levels of Bax and caspase-3, leading to the inhibition of glucose-treated INS-1E cell apoptosis. In addition, miR-22 overexpression increased the expression levels of p-JAK, p-STAT, enhanced cell viability and suppressed apoptosis of glucose-treated INS-1E cells. These results were all reversed when IL6R was expressed. Therefore, the present study demonstrated that miR-22 may promote the viability and suppress apoptosis of glucose-treated INS-1E cells by downregulation of the expression of IL6R.
Conclusion
In conclusion, the data of the current study demonstrated that the low expression of miR-22 and high expression of IL6R in the serum of patients and glucose-induced INS-1E cells. In addition, miR-22 overexpression promoted the viability and inhibited apoptosis of glucose-induced INS-1E cells partially through its down-regulation of IL6R. Furthermore, miR-22 overexpression or IL6R inhibition promoted the activation of JAK/STAT signaling pathway to regulate the viability and apoptosis of glucose-induced INS-1E cells. With the identification of IL6R as a target for miR-22 in glucose-induced INS-1E cells, molecular mechanisms of miR-22 regulated the viability and apoptosis of glucose-induced INS-1E cells were understood, which may be used for the future clinical applications. However, there are still existing some limitations in this study. How the free IL-6/bound IL6 in this study reflect concentrations found during active inflammatory events in an actual inflammatory response-mediated pathophysiology is not studied. The current animal model is more suitable for a hyperglycemic model, that is not the sole criteria in the pathophysiology of T2DM and the role of CD8+ T-cell response would have been more accurate and appropriate. We will consider those limitations in further study.
Ethics approval and consent
The study was approved by the Ethics committee of Huai’an Hospital. The participants provided written informed consent to participate in the study and consent for publication was obtained from all participants.
Data sharing statement
The datasets used and/or analyzed during the current study are available from the corresponding author on reasonable request.
Disclosure
The authors report no conflicts of interest in this work.
References
1. Organization WH. Global report on diabetes. Working Papers. 2016.
2. Harris MI. Reduction in the incidence of type 2 diabetes with lifestyle intervention or metformin. N Engl J Med. 2002;346 (6):393-403.
3. Defronzo RA. Pharmacologic therapy for type 2 diabetes mellitus. Ann Intern Med. 2000;133(1):73–74. doi:10.7326/0003-4819-133-1-200007040-00016
4. Roy T. Insulin resistance and type 2 diabetes. Diabetes. 2012;61(4):778–779. doi:10.2337/db12-0073
5. Heller RS. The comparative anatomy of Islets. In: Islam MS, editor. Islets of Langerhans.
6. Satin L, Butler P, Ha J, Sherman A. Pulsatile insulin secretion, impaired glucose tolerance and type 2 diabetes. Mol Asp Med. 2015;42:62–67. doi:10.1016/j.mam.2015.01.003
7. Arcidiacono B, Iiritano S, Chiefari E, et al. Cooperation between HMGA1, PDX-1, and MafA is essential for glucose-induced insulin transcription in pancreatic beta cells. Front Endocrinol (Lausanne). 2015;5:237. doi:10.3389/fendo.2014.00237
8. Cusi K. Lessons learned from studying families genetically predisposed to type 2 diabetes mellitus. Curr Diab Rep. 2009;9(3):200–207.
9. Fried Dab Susank, Greenberg Andrews. Omental and subcutaneous adipose tissues of obese subjects release interleukin-6 depot difference and regulation by glucocorticoid. J Clin Endocrinol Metab. 1999;83:847–850.
10. Mohamed-Ali V. JP, and SW Coppack. Adipose tissue as an endocrine and paracrine organ. Int J Obes Relat Metab Disord. 1998;22:1145–1158.
11. Zhang SSL. Association of the D358A polymorphism of IL6R gene with type 2 diabetes in Hubei Han Chinese. Prog Mod Biomed. 2009;9(1):80–83.
12. Pickup JC, Mattock MB, Chusney GD, Burt D. NIDDM as a disease of the innate immune system: association of acute-phase reactants and interleukin-6 with metabolic syndrome X. Diabetologia. 1997;40(11):1286. doi:10.1007/s001250050836
13. Pickup JC, Crook MA. Is type II diabetes mellitus a disease of the innate immune system? Diabetologia. 1998;41(10):1241–1248. doi:10.1007/s001250051058
14. Nagata SKN. Circulating levels of interleukin-6, its soluble receptor and interleukin-6/interleukin-6 receptor complexes in patients with type 2 diabetes mellitus. Acta Diabetol. 1999;36(1–2):67–72.
15. Pedersen BK, Steensberg A, Schjerling P. Muscle-derived interleukin-6: possible biological effects. J Physiol. 2010;536(2):329–337. doi:10.1111/j.1469-7793.2001.0329c.xd
16. Sandler S, Bendtzen K, Eizirik DL, Welsh M. Interleukin-6 affects insulin secretion and glucose metabolism of rat pancreatic islets in vitro. Endocrinology. 1990;126(2):1288–1294. doi:10.1210/endo-126-2-1288
17. Saad MF, Khan A, Sharma A, et al. Physiological insulinemia acutely modulates plasma leptin. Diabetes. 1998;47(4):544–549. doi:10.2337/diabetes.47.4.544
18. Vermes C, Jacobs JJ, Zhang J, Firneisz G, Roebuck KA, Glant TT. Shedding of the interleukin-6 (IL-6) receptor (gp80) determines the ability of IL-6 to induce gp130 phosphorylation in human osteoblasts. J Biol Chem. 2002;277(19):16879–16887. doi:10.1074/jbc.M200546200
19. Ambros V. The functions of animal microRNAs. Nature. 2004;431(7006):350–355. doi:10.1038/nature02871
20. Damavandi Z, Torkashvand S, Vasei M, Soltani BM, Tavallaei M, Mowla SJ. Aberrant expression of breast development-related MicroRNAs, miR-22, miR-132, and miR-212, in breast tumor tissues. J Breast Cancer. 2016;19(2):148–155. doi:10.4048/jbc.2016.19.2.148
21. Qiao DD, Yang J, Lei XF, et al. Expression of microRNA-122 and microRNA-22 in HBV-related liver cancer and the correlation with clinical features. Eur Rev Med Pharmacol Sci. 2017;21(4):742–747.
22. Xia SS, Zhang GJ, Liu ZL, et al. MicroRNA-22 suppresses the growth, migration and invasion of colorectal cancer cells through a Sp1 negative feedback loop. Oncotarget. 2017;8(22):36266–36278. doi:10.18632/oncotarget.16742
23. Qiu K, Huang Z, Huang Z, He Z, You S. miR-22 regulates cell invasion, migration and proliferation in vitro through inhibiting CD147 expression in tongue squamous cell carcinoma. Arch Oral Biol. 2016;66:92–97. doi:10.1016/j.archoralbio.2016.02.013
24. Fan W, Huang J, Xiao H, Liang Z. MicroRNA-22 is downregulated in clear cell renal cell carcinoma, and inhibits cell growth, migration and invasion by targeting PTEN. Mol Med Rep. 2016;13(6):4800–4806. doi:10.3892/mmr.2016.5101
25. Yuan Wang QW, Shi R. Meta analysis of association of ApoE gene polymorphisms with diabetic nephropathy. J Shanghai Jiaotong Univ. 2011;31(05):625–631.
26. Liu X, Zhang A, Xiang J, Lv Y, Zhang X. miR-451 acts as a suppressor of angiogenesis in hepatocellular carcinoma by targeting the IL-6R-STAT3 pathway. Oncol Rep. 2016;36(3):1385–1392. doi:10.3892/or.2016.4971
27. Deng N, Li L, Gao J, et al. Hsa_circ_0009910 promotes carcinogenesis by promoting the expression of miR-449a target IL6R in osteosarcoma. Biochem Biophys Res Commun. 2018;495(1):189–196. doi:10.1016/j.bbrc.2017.11.028
28. Tüfekci KU, Meuwissen RLJ, Genç S. The Role of MicroRNAs in Biological Processes. Humana Press; 2014.
29. Zhang XQ, Jing WL. Upregulation of miR-122 is associated with cardiomyocyte apoptosis in atrial fibrillation. Mol Med Rep. 2018;18(2):1745–1751. doi:10.3892/mmr.2018.9124
30. Xia HF, He TZ, Liu CM, et al. MiR-125b expression affects the proliferation and apoptosis of human glioma cells by targeting Bmf. Cel Physiol Biochem. 2009;23(4–6):347–358. doi:10.1159/000218181
31. Long ZW, Wu JH, Cai H, Wang YN, Zhou Y. MiR-374b promotes proliferation and inhibits apoptosis of human GIST cells by inhibiting PTEN through activation of the PI3K/Akt pathway. Mol Cells. 2018;41(6):532–544. doi:10.14348/molcells.2018.2211
32. Estrella S, Garciadiaz DF, Codner E, Camachoguillén P, Pérezbravo F. Expression of miR-22 and miR-150 in type 1 diabetes mellitus: possible relationship with autoimmunity and clinical characteristics. Medicina Clínica. 2016;147:6. doi:10.1016/j.medcli.2016.05.016
33. Jovicic A, Zaldivar Jolissaint JF, Moser R, Silva Santos Mde F, Luthi-Carter R. MicroRNA-22 (miR-22) overexpression is neuroprotective via general anti-apoptotic effects and may also target specific Huntington’s disease-related mechanisms. PLoS One. 2013;8(1):e54222. doi:10.1371/journal.pone.0054222
 © 2019 The Author(s). This work is published and licensed by Dove Medical Press Limited. The full terms of this license are available at https://www.dovepress.com/terms.php and incorporate the Creative Commons Attribution - Non Commercial (unported, v3.0) License.
By accessing the work you hereby accept the Terms. Non-commercial uses of the work are permitted without any further permission from Dove Medical Press Limited, provided the work is properly attributed. For permission for commercial use of this work, please see paragraphs 4.2 and 5 of our Terms.
© 2019 The Author(s). This work is published and licensed by Dove Medical Press Limited. The full terms of this license are available at https://www.dovepress.com/terms.php and incorporate the Creative Commons Attribution - Non Commercial (unported, v3.0) License.
By accessing the work you hereby accept the Terms. Non-commercial uses of the work are permitted without any further permission from Dove Medical Press Limited, provided the work is properly attributed. For permission for commercial use of this work, please see paragraphs 4.2 and 5 of our Terms.