")
Back to Journals » Cancer Management and Research » Volume 10
IL-8 and thrombospondin-1 as prognostic markers in patients with metastatic colorectal cancer receiving bevacizumab
Authors Marisi G , Scarpi E , Passardi A , Nanni O , Pagan F, Valgiusti M, Casadei Gardini A , Neri LM, Frassineti GL, Amadori D, Ulivi P
Received 26 July 2018
Accepted for publication 6 October 2018
Published 14 November 2018 Volume 2018:10 Pages 5659—5666
DOI https://doi.org/10.2147/CMAR.S181570
Checked for plagiarism Yes
Review by Single anonymous peer review
Peer reviewer comments 2
Editor who approved publication: Dr Antonella D'Anneo
Giorgia Marisi,1 Emanuela Scarpi,2 Alessandro Passardi,3 Oriana Nanni,2 Flavia Pagan,2 Martina Valgiusti,3 Andrea Casadei Gardini,3 Luca Maria Neri,4 Giovanni Luca Frassineti,3 Dino Amadori,3 Paola Ulivi1
1Biosciences Laboratory, Istituto Scientifico Romagnolo per lo Studio e la Cura dei Tumori (IRST) IRCCS, Meldola 47014, Italy; 2Unit of Biostatistics and Clinical Trials, Istituto Scientifico Romagnolo per lo Studio e la Cura dei Tumori (IRST) IRCCS, Meldola 47014, Italy; 3Department of Medical Oncology, Istituto Scientifico Romagnolo per lo Studio e la Cura dei Tumori (IRST) IRCCS, Meldola 47014, Italy; 4Department of Morphology, Surgery and Experimental Medicine, University of Ferrara, Ferrara 44100, Italy
Purpose: Bevacizumab (B) plus chemotherapy (CT) is a common choice for first-line treatment of metastatic colorectal cancer. Molecular predictors of B efficacy have still not been identified. We analyzed the role of 22 angiogenesis-associated proteins in patient outcome.
Patients and methods: Serum samples collected at baseline and at the first clinical evaluation were available for 58 patients enrolled in the randomized multicenter ITACa trial and who received CT+ B. Serum protein levels were determined using multiplex ELISA.
Results: Patients with baseline ≥145 pg/mL IL-8 showed shorter median progression-free survival and overall survival (OS) than those with lower levels (6.5 vs 6. 12.6 months; HR 7.39, P<0.0001 and 8.7 vs 28.8 months, HR 7.68, P<0.001, respectively). Moreover, patients with baseline thrombospondin-1 levels ≥12,000 ng/mL had a better median OS than those with lower levels (34.5 vs 13.1 months, HR 0.43, P=0.007). Patients with a ≥20% reduction in IL-8 levels from baseline to first clinical evaluation showed a better progression-free survival and OS than the others (HR 0.41, P=0.005 and HR 0.43, P=0.007, respectively).
Conclusion: Baseline IL-8 and thrombospondin-1 levels and reduced IL-8 during B treatment could represent potential prognostic markers in metastatic colorectal cancer.
Keywords: serum biomarkers, targeted therapy, IL-8, angiogenesis, chemotherapy
Introduction
Over the last few years, the management of metastatic colorectal cancer (mCRC) has changed substantially thanks to the availability of two classes of biological drugs: antiangiogenic drugs, such as bevacizumab, aflibercet, and regorafenib, and anti-epidermal growth factor receptor inhibitors, such as cetuximab and panitumumab.1 Although RAS mutations have consistently been associated with reduced overall survival (OS), progression-free survival (PFS), and higher treatment failure rates among mCRC patients treated with anti-epidermal growth factor receptor antibodies,2 no genetic or molecular markers for anti-angiogenic drugs have been found as yet. The discovery of such markers to predict or monitor the efficacy of B would help to identify patients who are more likely to benefit from therapy.
Bevacizumab (B) is a humanized monoclonal antibody targeting vascular endothelial growth factor (VEGF), a critical angiogenic factor involved in both physiological and pathological conditions. Preclinical studies suggest that the alternation of proangiogenic factors may modulate sensitivity to anti-VEGF therapy and allow regrowth of tumor-associated vasculature.3 Previous studies assessed circulating levels of pro- and antiangiogenic factors at baseline and during therapy in relation to the B response in different types of tumors, with conflicting results. Baseline plasma levels of the soluble VEGF receptor 1 (sVEGFR-1), VEGF, placental-derived growth factor (PlGF), and IL-6 during treatment showed a significant correlation with outcome in patients with locally advanced rectal carcinoma.4 Basic fibroblast growth factor, PlGF, hepatocyte growth factor (HGF), stromal cell-derived factor 1 (SDF-1), and monocyte-chemotactic protein 3 were shown to increase prior to disease progression in mCRC patients.5,6 sVEGFR-2, thrombospondin-1 (TSP-1),6 and VEGF-D7 were also higher in progressive disease in this patient setting.
In contrast, high baseline epidermal growth factor (EGF) and macrophage-derived chemokine (MDC) expression but low levels of IL-6, IL-8, and IL-10 were observed in mCRC patients responding to therapy.8 Furthermore, Wallyn demonstrated that a significant decrease in the expression of a small proteoglycan, endocan was a good prognosis marker in patients with stage IIIB–IV non-small-cell lung cancer treated with B.9 In patients with ovarian cancer treated with B, high levels of angiopoietin-1 (Ang-1) and low levels of the angiopoietin receptor Tie2 were associated with better PFS.10 In advanced renal cell carcinoma, serum Ang-2 and hypoxia-inducible factor 1-alpha (HIF-1α) tumor levels were important markers of the efficacy of sunitinib, another antiangiogenic drug.11 However, none of these results has been consistently replicated across different studies and cancer types.12,13
In an attempt to overcome some of the limitations of earlier investigations, we simultaneously assessed a series of cytokines and angiogenic factors with a multiplex ELISA in mCRC patients treated with B. We measured the levels of 22 angiogenesis-associated proteins (FGF-basic, HGF, sTIE-2, sVEGFR-1, sVEGFR-2, Ang-2, EGF, IL-6, IL-8, PlGF, VEGF-A, VEGF-C, VEGF-D, PDGF-bb, Ang-1, SDF-1α, MDC, galectin-1, TSP1, endocan, eNOS, and HIF-1α) at baseline and during treatment to investigate whether changes in their levels might be correlated with therapeutic efficacy and disease outcome.
Patients and methods
Patient selection and treatment
This study included patients enrolled in the ITACa clinical trial (NCT01878422).14 Of the 376, we taken in consideration 58 patients receiving first-line chemotherapy (CT) (FOLFOX4 or FOLFIRI) plus B for which peripheral blood samples were available. Additional details about the treatment regimen and clinical outcomes for ITACa trial have previously been reported.14 Written informed consent was obtained from each patient regarding the use of serum for this correlative analysis. All patients underwent evaluation of RAS, BRAF, and microsatellite instability (MSI) status during their routine molecular diagnostic characterization.
Patients were evaluated for response according to RECIST criteria version 1.1. Tumor responses were assessed every 8 weeks by imaging tools such as computed tomography. Responders included complete response and partial response. Nonresponders included stable disease and disease progression.
All subjects gave their informed consent for inclusion before they participated in the study. The study was conducted in accordance with the Declaration of Helsinki, and the protocol was approved by Local Ethics Committee (Ethics Committee Area Vasta Romagna and IRST).
Plasma collection, handling, and storage
Venous blood was drawn into EDTA vacutainer tubes and immediately processed for serum at baseline and at the first evaluation (about 2 months after the start of treatment). The tubes were centrifuged at 2,500× g for 15 minutes. The top layer of serum was aliquoted into 2 mL fresh tubes and stored at –80°C until use. Blood samples were available for analysis at baseline for 58 patients and at the first clinical evaluation for 55 patients (95%). All data were collected in accordance with good clinical practice guidelines.
Biomarker assessments and methodology
Levels of all serum proteins were determined using a Bio-Plex 200 array reader based on Luminex X-Map Technology (Bio-Rad Laboratories Inc., Hercules, CA, USA). Angiogenesis-associated protein concentrations were assessed in duplicate using a 5-plex ELISA assay of FGFb, HGF, sTie2s, VEGFR-1, and sVEGFR-2, an 8-plex assay of Ang-2, EGF, IL-6, IL-8, PlGF, VEGFA, VEGFC, and VEGFD, a 2-duplex assay of Ang-1 and PDGFbb and SDF-1α/CXCL12 and MDC/CCL22, and 5 singleplex ELISA assays of galectin-1, TSP-1, endocan, eNOS, and HIF-1α.
The protein concentrations (expressed as pg/mL or ng/mL) were calculated through a standard curve using the software provided by the manufacturer (Bio-Plex Manager Software v.6.1).
The assays were performed blinded to the study endpoint by Bioclarma Research and Molecular Diagnostics (Turin, Italy).
Statistical analyses
The primary aim of the ITACa study was PFS, while secondary endpoints were OS and objective response rate (ORR). In the present work, we aimed to examine the association between 22 angiogenesis-associated proteins and PFS, OS, and ORR in the ITACa population and to investigate their variation during B treatment. The relationship between baseline serum proteins and clinical characteristics was analyzed using a nonparametric ranking statistic (median test). Logistic regression models and their 95% CIs, adjusted for baseline characteristics (gender, age, RAS status, tumor localization, and CT regimen) were used to evaluate the association between serum protein baseline levels and ORR (complete response + partial response). Covariate selection was based on a list of probable prognostic factors from the ITACa study.14 PFS was calculated as the time elapsed between the date of randomization and the date of first observation of progressive disease or the date of last tumor evaluation or the date of death in the absence of disease progression. OS was calculated as the time elapsed between the date of randomization and the date of death from any cause or the date of last follow-up. PFS and OS were estimated using the Kaplan–Meier method and were compared with the logrank test. 95% CIs were calculated by nonparametric methods. The Cox regression model was used to estimate HRs and their 95% CIs, adjusting for baseline characteristics. Baseline levels of serum proteins were dichotomized using the best cutoff determined by receiver-operating characteristic analysis at a median PFS. The median value of variation in the serum proteins from baseline to the first clinical evaluation was chosen as the cutoff point (20%). We conducted a landmark analysis to reduce potential confounding by time on treatment by assessing the impact of change in serum proteins form baseline to the first tumor evaluation (about 2 months after the start of treatment) on survival outcome. Patients who were still alive and had not been lost to follow-up at the landmark time were divided into two categories on the basis of whether they had progressed or not by that time. PFS and OS after the landmark time were computed with Kaplan–Meier curves. All P-values were based on two-sided testing, and statistical analyses were carried out using SAS statistical software version 9.4 (SAS Institute, Cary, NC, USA). Adjustments for multiple comparisons were not made, given the exploratory nature of the study.
Results
Patient characteristics
The clinical pathological characteristics of patients are shown in Table 1. Median age was 65 (37–83) years. Median PFS and OS were 12.1 months (95% CI 9.2–14.7) and 25.2 months (95% CI 17.8–34.5), respectively. Median follow-up was 64 months (range 2–79). A total of 31 (53%) patients were RAS mutated, while 7 (15%) were BRAF mutated. Twenty-eight patients had microsatellite stable tumors, one had a low MSI tumor and only four had high MSI disease.
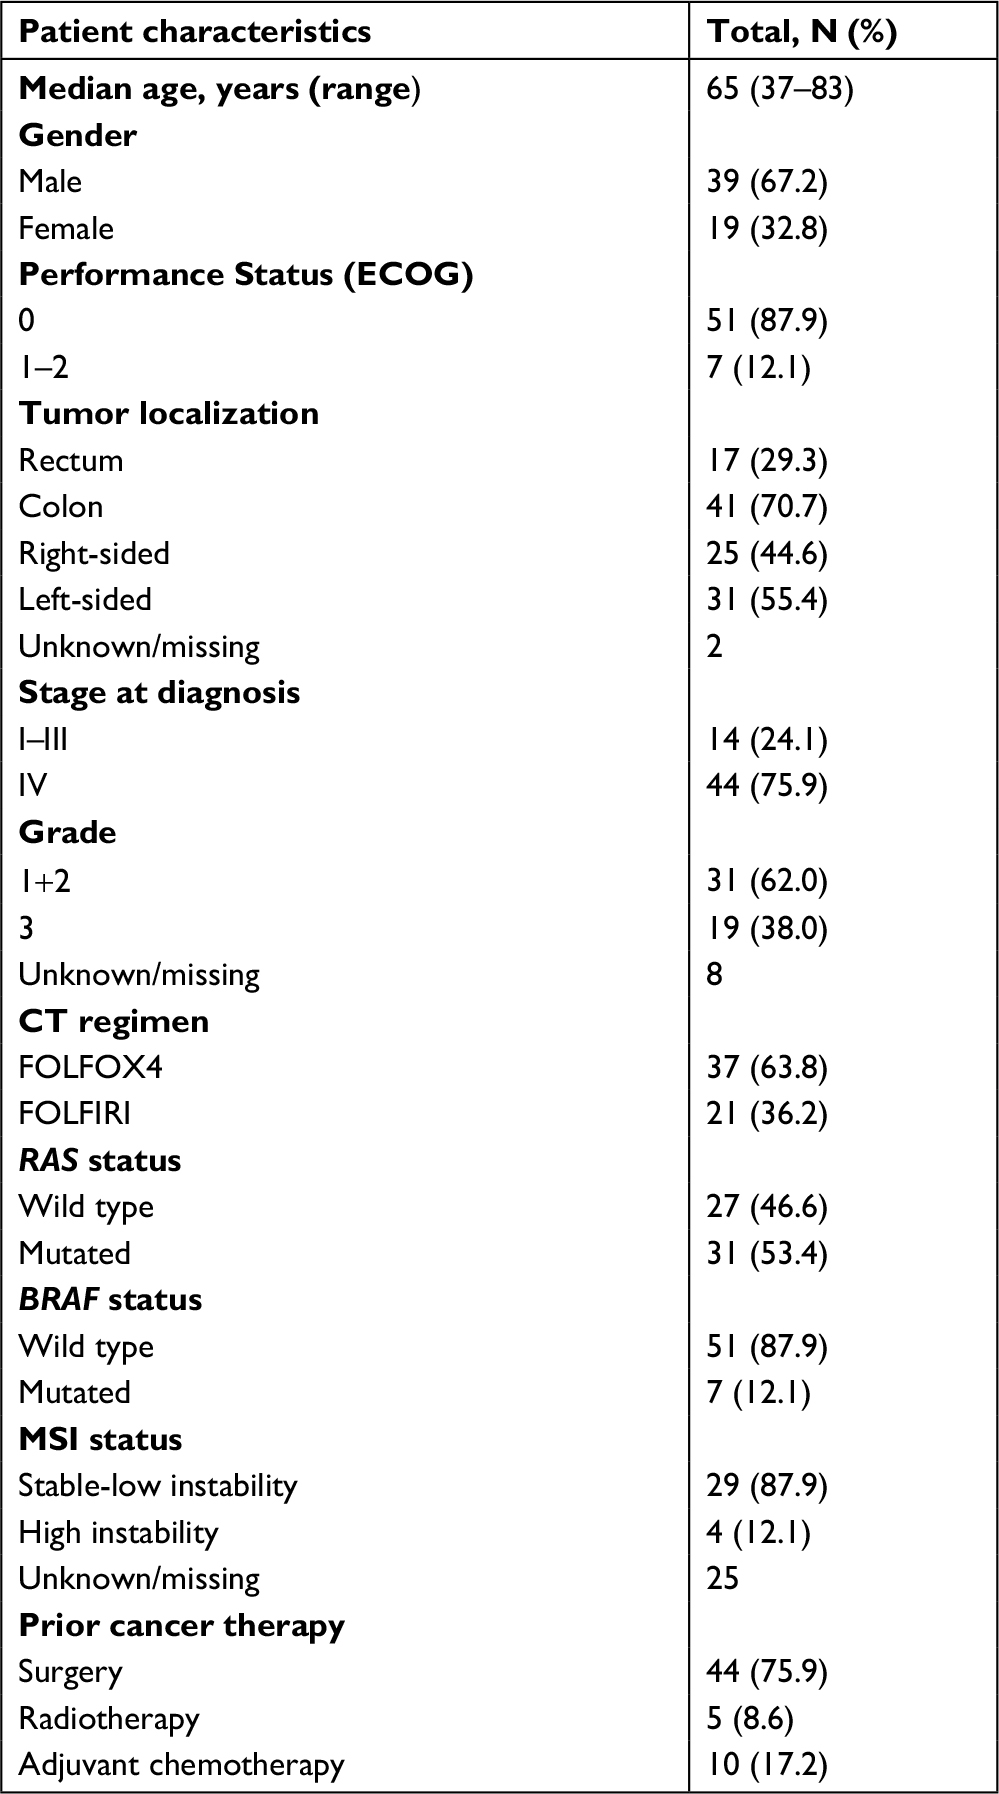 | Table 1 Patient characteristics (N=58) Abbreviations: CT, chemotherapy; ECOG, Eastern Cooperative Oncology Group; FOLFIRI, folinic acid, fluorouracil and irinotecan; FOLFOX, folinic acid fluorouracil and oxaliplatin; MSI, microsatellite instability. |
Serum proteins at baseline
We evaluated the correlation between the main clinical pathological characteristics of patients and median baseline biomarker levels, observing a higher median baseline FGF level in right-sided tumors than in left-sided ones (92.98 pg/mL [range 38.55–199.07] and 60.84 pg/mL [range 17.43–93.76], respectively) (P=0.002). No significant differences were observed between median baseline biomarker levels and RAS and BRAF status (data not shown). Moreover, although there were no significant correlations between MSI status and serum protein levels (data not shown), a higher frequency of MSI tumors was observed in patients with low levels of IL-8 and Ang-2.
Objective response rate
There were a total of 38 patients responders and 20 nonresponders. We observed a significant difference in median baseline biomarker levels between responders and nonresponders, in particular for VEGF-C, MDC, and EGF (2,311 pg/mL [range 1,107–3468] vs 1,871 pg/mL [range 1,871–2,825] [P=0.001]; 645 pg/mL [range 161–1,154] vs 424 pg/mL [range 136–1,170] [P=0.033] and 196 pg/mL [range 49–511] vs 132 pg/mL [range 40–388] [P=0.018], respectively). Higher response rates were seen in patients with baseline VEGF-C, MDC, and EGF levels higher than the median value (adjusted odds ratio [OR]=13.05, 95% CI 2.73–62.22 [P=0.001]; OR=3.63, 95% CI 1.08–13.33 [P=0.031]; and OR=4.68, 95% CI 1.24–17.66 [P=0.023], respectively) (Table 2). No significant differences were observed between other baseline biomarkers and ORR (data not shown).
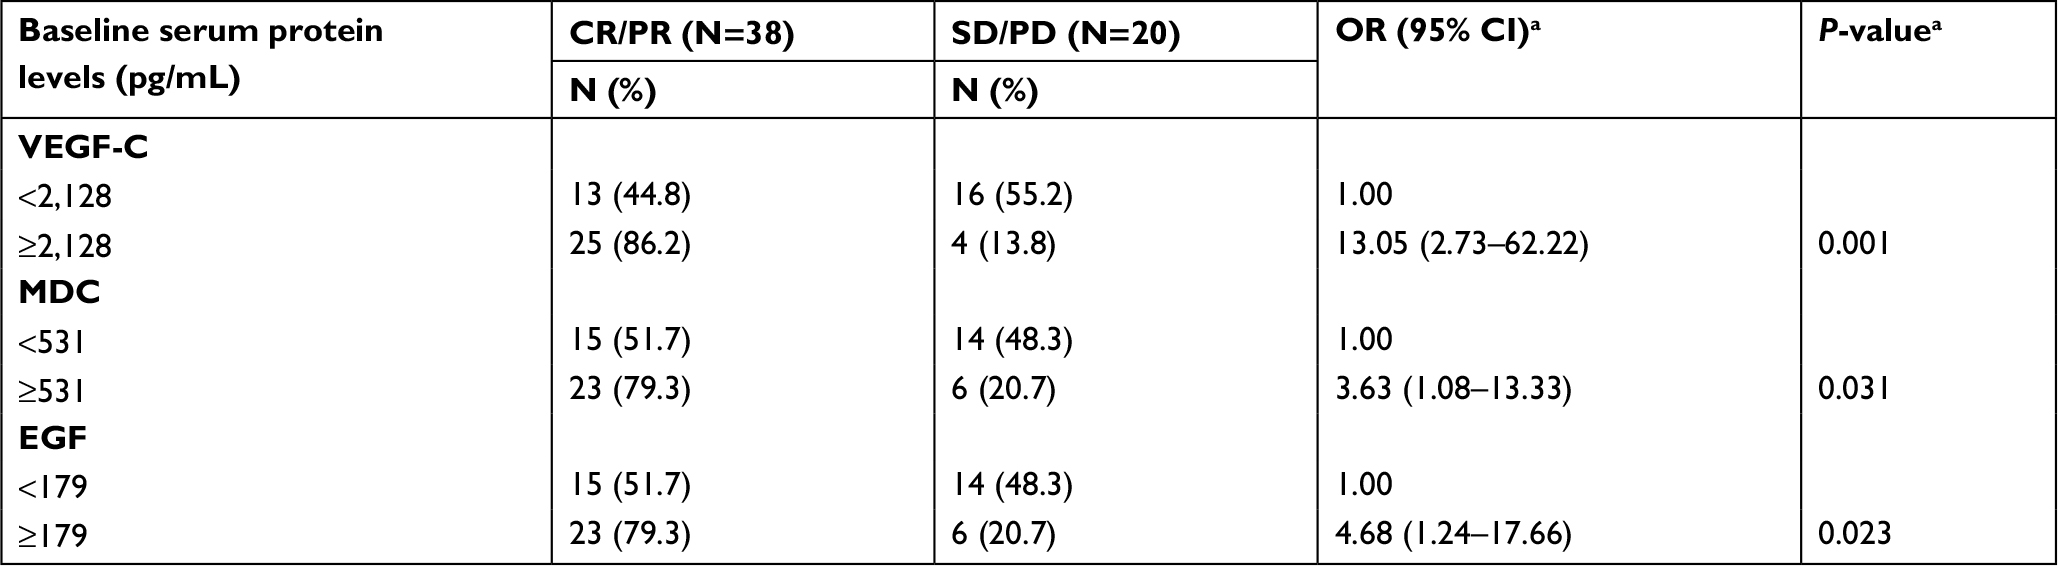 | Table 2 Correlation between serum proteins and overall response rate Notes: aAdjusted for chemotherapy regimen, gender, age, RAS status, and tumor localization. Abbreviations: CR, complete response; EGF, epidermal growth factor; MDC, macrophage-derived chemokine; PD, progressive disease; PR, partial response; SD, stable disease; VEGF, vascular endothelial growth factor. |
PFS and OS
Baseline IL-8 levels were correlated with PFS and OS; in particular, patients with ≥145 pg/mL IL-8 showed a shorter median PFS and OS than those with lower levels (6.5 vs 12.6 months, HR 7.39, 95% CI 2.76–19.83 [P<0.0001] and 8.7 vs 28.8 months, HR 7.68, 95% CI 2.59–22.77 [P<0.001], respectively) (Figure 1 and Table 3). Moreover, patients with ≥12,000 ng/mL TSP-1 levels showed a better median OS than those with lower levels (34.5 vs 13.1 months, HR 0.41, 95% CI 0.20–0.85 [P=0.016]) (Figure 1 and Table 3). Baseline Ang-2 levels showed borderline significance with PFS and OS. Patients with ≥1,740 pg/mL Ang-2 levels showed a shorter median PFS and OS than those with lower levels (9.0 vs 12.5 months, HR 1.99, 95% CI 0.89–4.45 [P=0.096] and 14.4 vs 28.8 months, HR 2.56, 95% CI 1.07–6.12 [P=0.035], respectively). No significant differences were observed between other biomarkers at baseline and PFS and OS (data not shown).
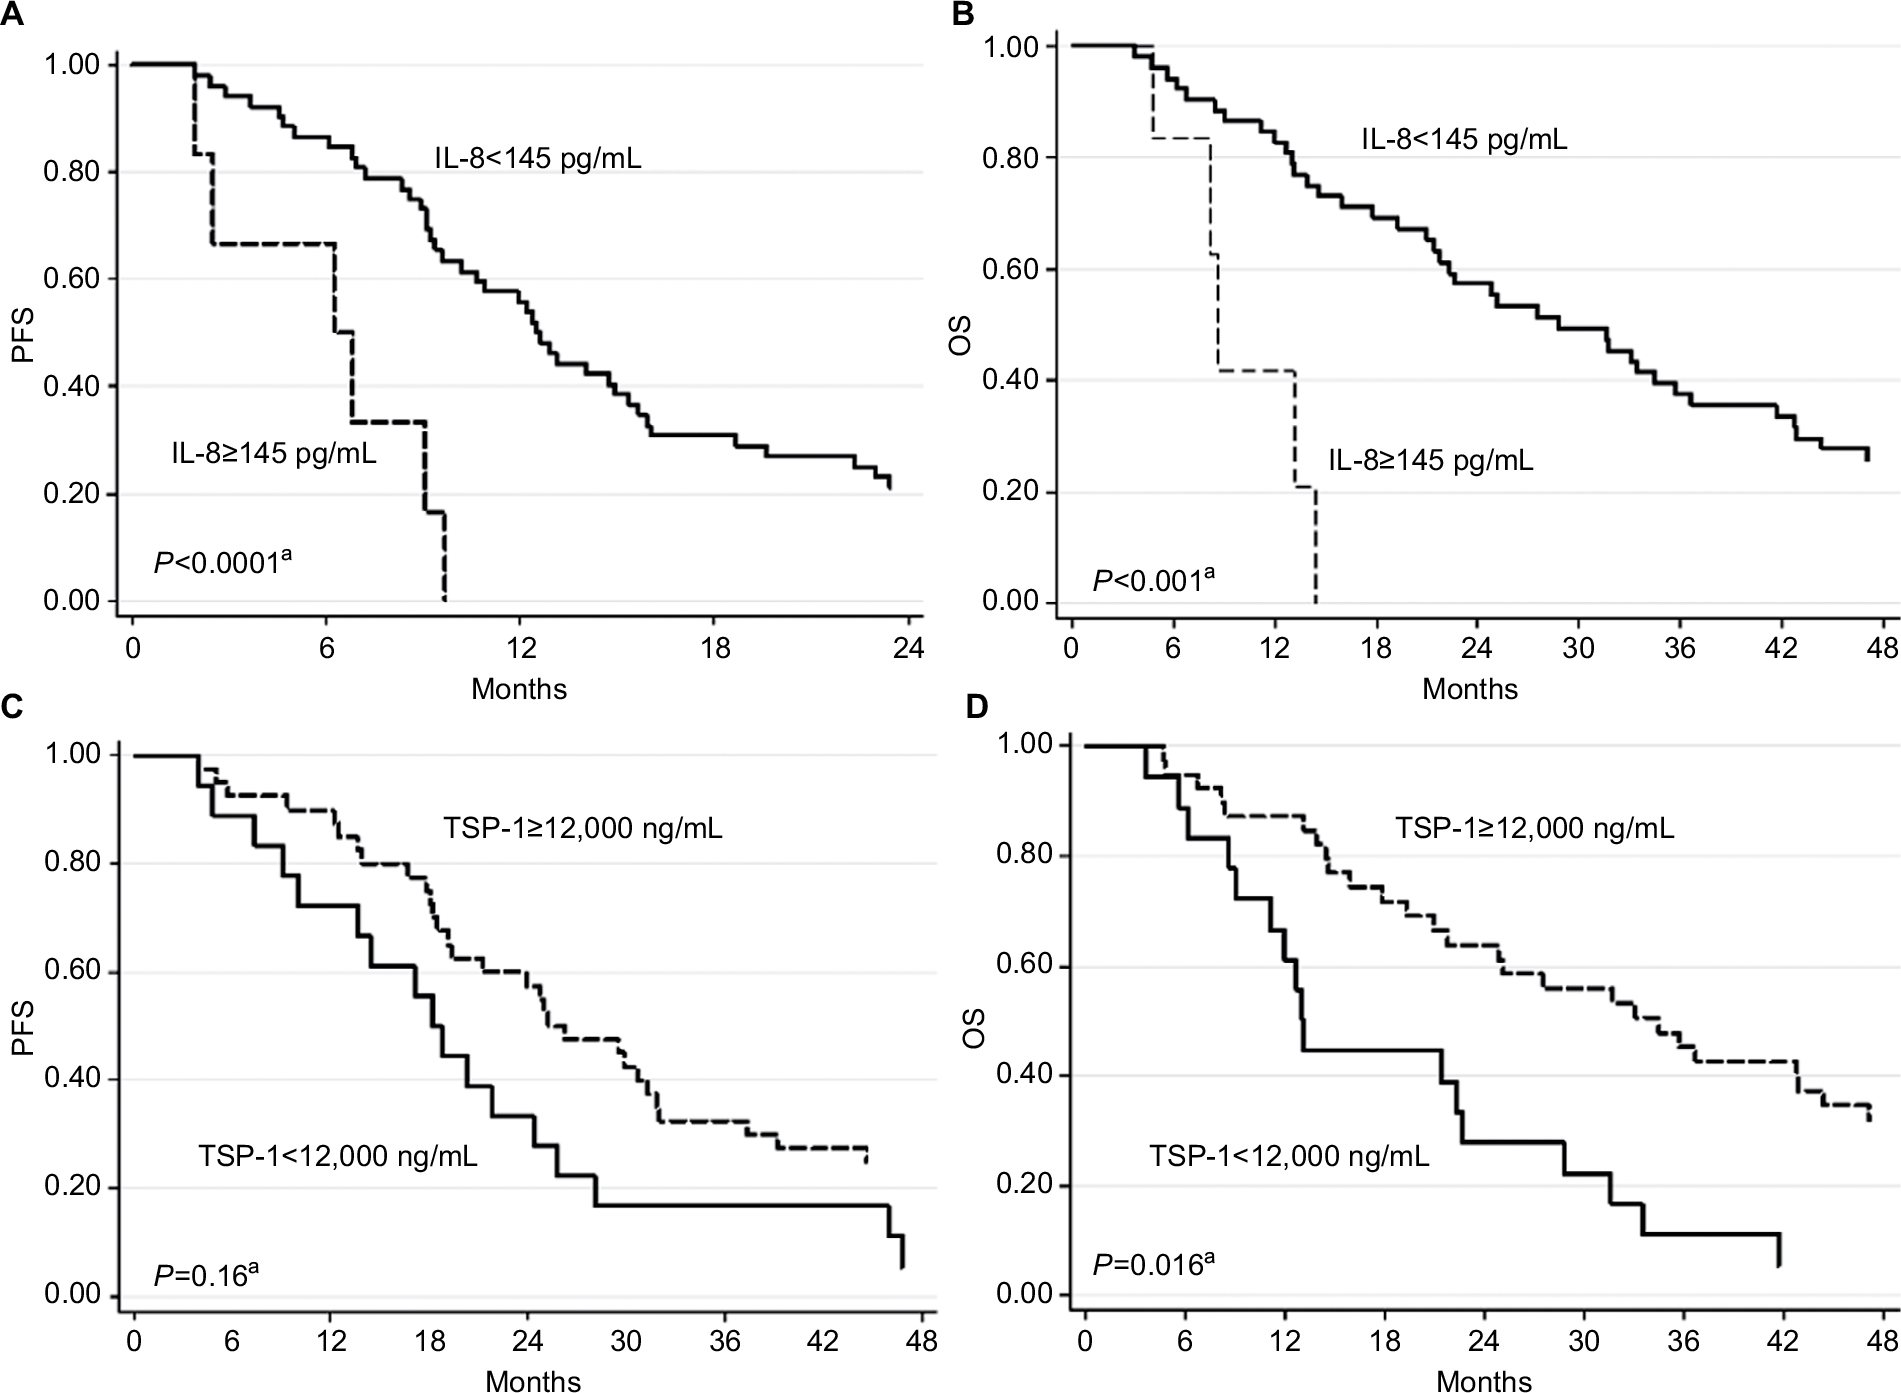 | Figure 1 Progression-free survival (PFS) and overall survival (OS) with respect to baseline IL-8 (A and B, respectively) and TSP-1 levels (C and D, respectively). Notes: aAdjusted for chemotherapy regimen, gender, age, RAS status, and tumor localization. Abbreviation: TSP-1, thrombospondin-1. |
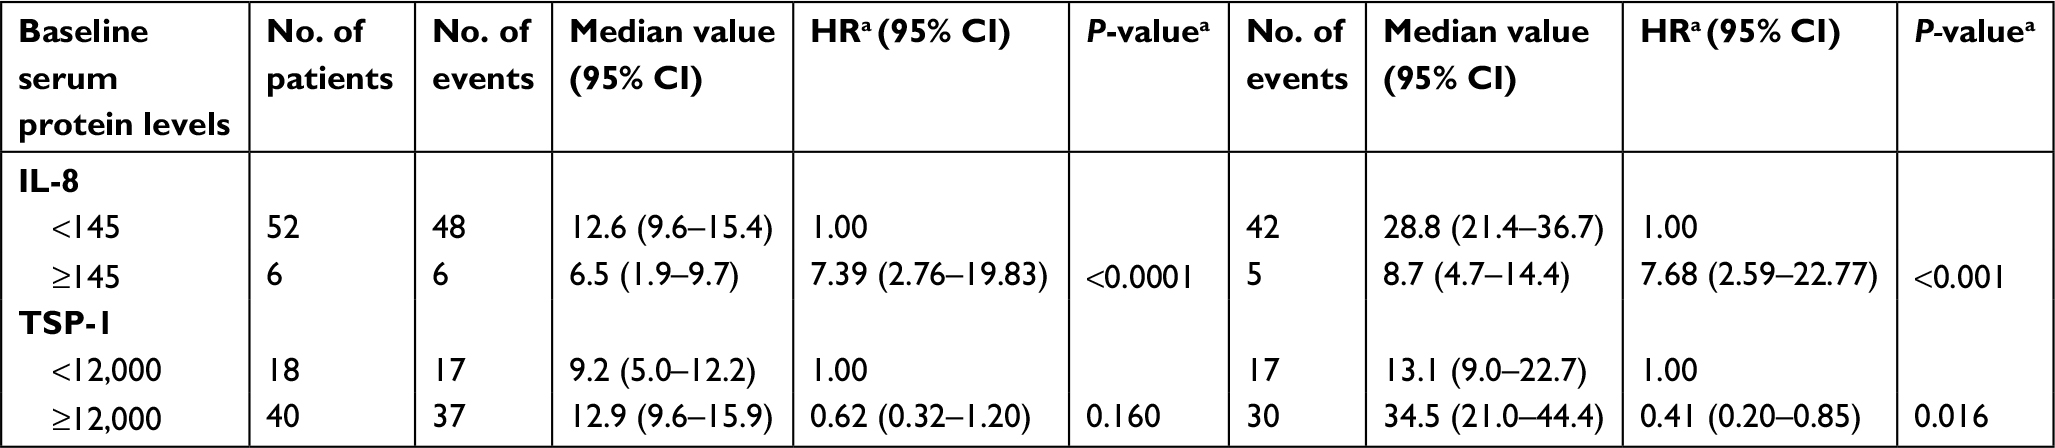 | Table 3 Progression-free and overall survival with respect to baseline serum protein levels Notes: IL-8 measured in pg/mL; TSP-1 measured in ng/mL; aAdjusted for chemotherapy regimen, gender, age, RAS status, and tumor localization. Abbreviation: TSP, thrombospondin. |
Serum protein modulation during therapy
We analyzed the variation in serum proteins from baseline to the first clinical evaluation. With regard to ORR, it was seen that patients with ≥20% reduction in Ang-2 levels had a higher ORR than those with a lower reduction (adjusted OR=4.29, 95% CI 1.13–16.31, P=0.003). A borderline significance was also observed for IL-8 modulation; in particular, patients with ≥20% reduction in IL-8 levels showed a higher ORR than those showing a lower reduction (adjusted OR=2.89, 95% CI 0.91–9.2, P=0.073).
We also evaluated PFS and OS in relation to serum biomarker changes observed between baseline and the first clinical evaluation. Patients with a ≥20% reduction (N=36) in IL-8 levels showed a better median PFS and OS than those with a <20% reduction (N=10) or an increase (N=9) (12.8 vs 9.1 months, HR 0.41, 95% CI 0.22–0.77, P=0.005 and 31.7 vs 19.3 months, HR 0.43, 95% CI 0.23–0.79, P=0.007, respectively). Figure 2 shows the Kaplan–Meier curves for PFS and OS with respect to the reduction in IL-8 level between baseline and the first clinical evaluation. Patients with a ≥20% reduction in IL-6 levels had a better median PFS than those with <20% reduction or an increase (14.0 months, 95% CI 9.0–25.1 vs 10.1 months, 95% CI 6.8–13.1, HR 0.56, 95% CI 0.32–0.99) (P=0.046). Moreover, patients with a ≥50% reduction in VEGF-C levels between baseline and the first clinical evaluation showed a shorter PFS compared with those with <50% reduction (6.9 months, 95% CI 2.9–9.2 vs 12.5 months, 95% CI 9.6–14.9, HR 3.99, 95% CI 0.32–0.99) (P=0.046). There was no significant difference between the modulation of other biomarkers and clinical outcome (data not shown).
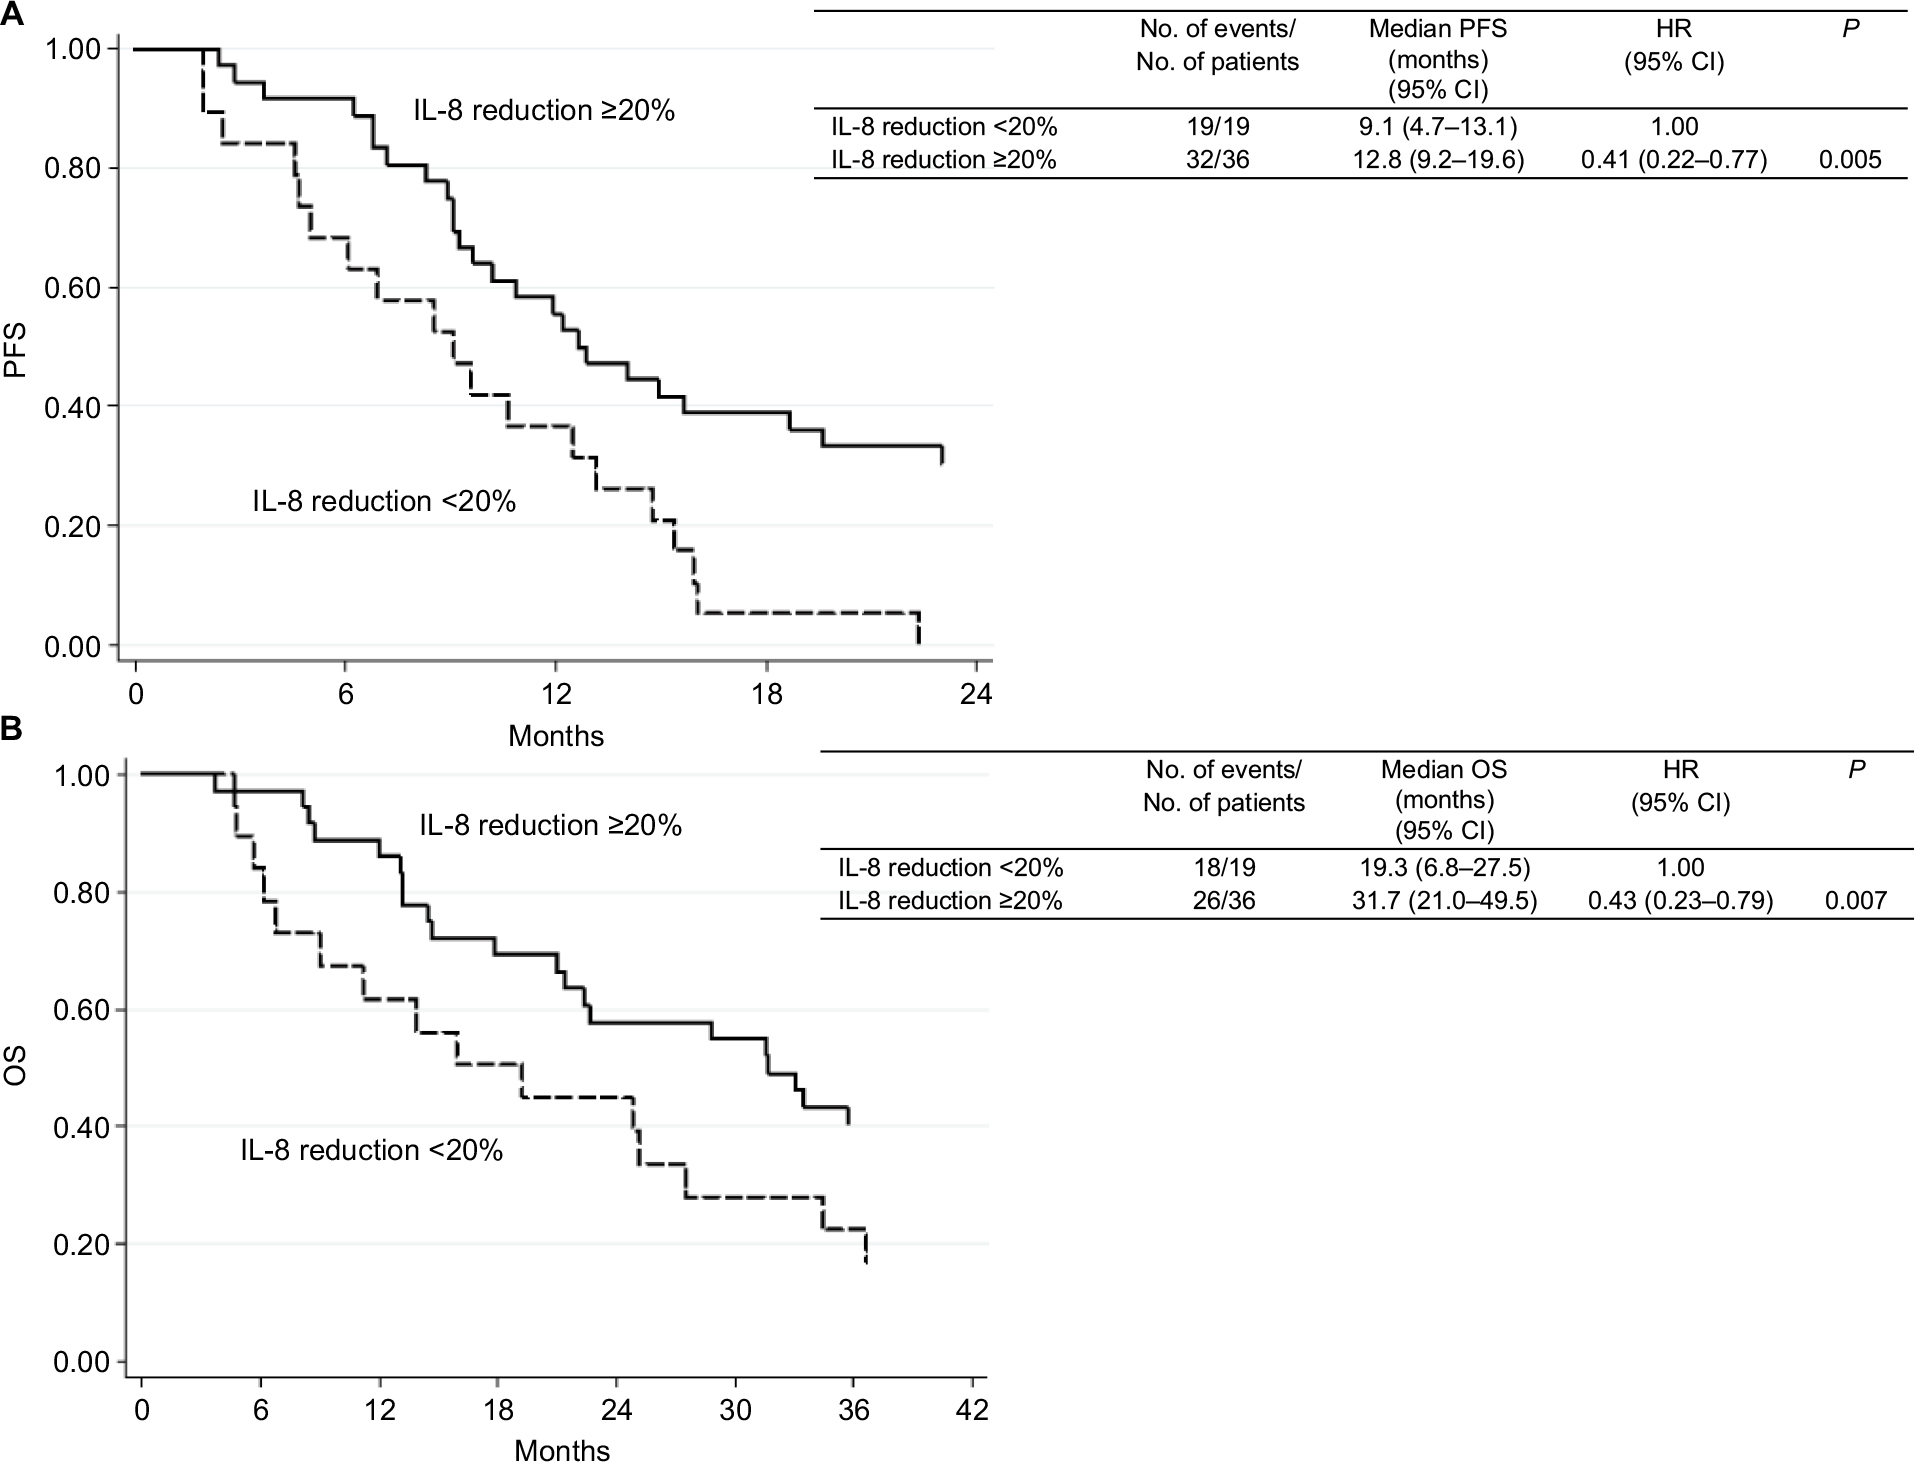 | Figure 2 Progression-free survival (PFS) (A) and overall survival (OS) (B) with respect to reduction in IL-8 levels observed between baseline and first clinical evaluation. |
Discussion
In the present study, we investigated the role of several angiogenesis-associated proteins and cytokines, evaluated at baseline and during B treatment, with respect to clinical outcome.
Our findings showed that low baseline IL-8 and high TSP-1 levels were associated with better clinical outcome, and that a >20% reduction in IL-8 levels between baseline and the first evaluation was associated with better PFS and OS. In agreement with our results, di Salvatore et al observed that B-treated mCRC patients with low rather than high IL-8 levels had significantly longer median PFS and OS.15 Of note, they also found that the IL-8 single-nucleotide polymorphism c.-251 “A” allele was associated with significantly shorter PFS and OS. Given that this allele would appear to be correlated with variations in promoter transcriptional activity and higher levels of circulating IL-8,16–18 their data support the hypothesis that patients carrying the A allele may benefit less from B because of higher IL-8 serum levels.
A number of authors have published similar results on the role of IL-8 in mCRC patients receiving B.5,8 Abajo et al reported a better clinical outcome when IL-8 baseline levels were lower,8 while Kopetz et al observed that elevated IL-8 at baseline was associated with a shorter PFS.5 We found that lower baseline IL-8 serum levels were associated with better PFS and OS. IL-8 is believed to promote migration, invasion, and in vivo angiogenesis by stimulating endothelial cell proliferation in response to hypoxia,19–22 suggesting a possible role in tumor resistance.
With regard to TSP-1 in CRC, high tissue levels have been shown to correlate with higher survival rates.23 Moreover, Loupakis et al evaluated plasma levels of several angiogenesis-related proteins at different time points in a cohort of 25 patients undergoing CT+ B, observing a significant increase in TSP-1 levels when the disease progressed.6 Within this context, Brostjan et al reported significant variations in TSP-1 plasma levels after treatment with B.24 Our data demonstrated that patients with higher baseline VEGF-C, MDC, and EGF levels also had a better clinical outcome.
In agreement with our results, Abajo et al reported that high serum levels of EGF and MDC were associated with higher response rates. MDC attracts and activates a variety of cell types and enhance the immune response.25 Accordingly, high baseline levels of MDC in our responding patients would seem to suggest a role in promoting an immune response by T-helper cell recruitment. Moreover, patients in our study showing a reduction in IL-6 levels had better PFS. Similarly, Abajo et al observed lower IL-6 levels in patients responding to therapy.
The better outcome observed in the subset of patients with lower IL-6 and IL-8 levels is in agreement with the role ascribed to these cytokines in colon cancer progression and angiogenesis.26,27 We also obtained interesting results for Ang-2; in particular, high baseline levels were associated with a poorer clinical outcome. Similar findings have been reported in the literature for other tumors, including CRC, treated with B-base therapy.28–32
We also assessed biomarker levels in relation to the main molecular features, RAS, BRAF, and MSI status, but no significant correlations were observed. However, all MSI-high patients (12%) showed low levels of IL-8 and Ang-2 at baseline. Pogue-Geile et al reported that CRC patients diagnosed with MSI-high tumors showed a significant survival benefit from the addition of bevacizumab compared with no benefit in patients without MSI.33 These results are in agreement with our own findings if we consider that lower levels of IL-6 and Ang2 were correlated with better survival.
Moreover, our previous study demonstrated a higher benefit from the addition of bevacizumab to CT in right-sided tumors,34 in agreement with the CALGB/SWOG 80405 trial.35 Venook et al showed that bevacizumab significantly improved survival parameters in patients with right-sided lesions, while treatment with cetuximab improved PFS and OS in those with left-sided KRAS wild-type disease.35 In this context, it would be interesting to study serum biomarkers of response to bevacizumab, as evaluated in our study.
A limitation of our study is that we did not analyze the control arm receiving CT only. Thus, a clear distinction could not be made between the prognostic and predictive role of the serum biomarkers in relation to survival. Moreover, given the exploratory nature of the study, adjustments for multiple comparisons were not made. Overall, although our study is somewhat limited by its small sample size, the results were obtained on a (prospectively enrolled) patient population treated homogeneously in a randomized, prospective Phase III multicenter study (ITACa trial).14 An independent prospective study is ongoing to validate our results.
Conclusion
Our results suggest that low baseline IL-8 levels and their reduction during B treatment and high baseline levels of TSP-1 may indicate better clinical outcome in mCRC patients treated with B. Our data, if confirmed in larger independent studies, would suggest a role of these angiogenic proteins in determining B efficacy.
Data sharing statement
As this was a retrospective biological study conducted on patients enrolled onto a randomized, prospective Phase III multicenter study, the data generated are not suitable for sharing beyond that contained within the report. Further information can be obtained from the corresponding author.
Acknowledgments
The authors would like to thank Drs Nadia Dani and Davide Barberio for their help with data analysis. This work was partially supported by Roche S.p.A. and by the Italian Medicines Agency (AIFA).
Author contributions
Conceived and designed the experiments: ES, AP, ON, DA and PU; data collection: AP, FP, MV, ACG, GLF; performed the experiments: GM; analyzed and interpreted the data: GM, ES, AP, ON and PU; and drafted the manuscript: GM, ES, AP, ON, LMN and PU. All authors contributed to data analysis, drafting or revising the article, gave final approval of the version to be published, and agree to be accountable for all aspects of the work.
Disclosure
The authors report no conflicts of interest in this work.
References
Labianca R, Beretta GD, Kildani B, et al. Colon cancer. Crit Rev Oncol Hematol. 2010;74(2):106–133. | ||
Dahabreh IJ, Terasawa T, Castaldi PJ, Trikalinos TA. Systematic review: anti-epidermal growth factor receptor treatment effect modification by KRAS mutations in advanced colorectal cancer. Ann Intern Med. 2011;154(1):37–49. | ||
Ellis LM, Hicklin DJ. Pathways mediating resistance to vascular endothelial growth factor-targeted therapy. Clin Cancer Res. 2008;14(20):6371–6375. | ||
Willett CG, Duda DG, di Tomaso E, et al. Efficacy, safety, and biomarkers of neoadjuvant bevacizumab, radiation therapy, and fluorouracil in rectal cancer: a multidisciplinary phase II study. J Clin Oncol. 2009;27(18):3020–3026. | ||
Kopetz S, Hoff PM, Morris JS, et al. Phase II trial of infusional fluorouracil, irinotecan, and bevacizumab for metastatic colorectal cancer: efficacy and circulating angiogenic biomarkers associated with therapeutic resistance. J Clin Oncol. 2010;28(3):453–459. | ||
Loupakis F, Cremolini C, Fioravanti A, et al. Pharmacodynamic and pharmacogenetic angiogenesis-related markers of first-line FOLFOXIRI plus bevacizumab schedule in metastatic colorectal cancer. Br J Cancer. 2011;104(8):1262–1269. | ||
Lieu CH, Tran H, Jiang ZQ, et al. The association of alternate VEGF ligands with resistance to anti-VEGF therapy in metastatic colorectal cancer. PLoS One. 2013;8(10):e77117. | ||
Abajo A, Boni V, Lopez I, et al. Identification of predictive circulating biomarkers of bevacizumab-containing regimen efficacy in pre-treated metastatic colorectal cancer patients. Br J Cancer. 2012;107(2):287–290. | ||
Wallyn F. A prospective study of innovative non-invasive tools to assess the response to anti-angiogenic therapies in non small cell lung cancer patients. IASLC. 2013. | ||
Backen A, Renehan AG, Clamp AR, et al. The combination of circulating Ang1 and Tie2 levels predicts progression-free survival advantage in bevacizumab-treated patients with ovarian cancer. Clin Cancer Res. 2014;20(17):4549–4558. | ||
Motzer RJ, Hutson TE, Hudes GR, et al. Investigation of novel circulating proteins, germ line single-nucleotide polymorphisms, and molecular tumor markers as potential efficacy biomarkers of first-line sunitinib therapy for advanced renal cell carcinoma. Cancer Chemother Pharmacol. 2014;74(4):739–750. | ||
van Cutsem E, Tabernero J, Lakomy R, et al. Addition of aflibercept to fluorouracil, leucovorin, and irinotecan improves survival in a phase III randomized trial in patients with metastatic colorectal cancer previously treated with an oxaliplatin-based regimen. J Clin Oncol. 2012;30(28):3499–3506. | ||
Jubb AM, Miller KD, Rugo HS, et al. Impact of exploratory biomarkers on the treatment effect of bevacizumab in metastatic breast cancer. Clin Cancer Res. 2011;17(2):372–381. | ||
Passardi A, Nanni O, Tassinari D, et al. Effectiveness of bevacizumab added to standard chemotherapy in metastatic colorectal cancer: final results for first-line treatment from the ITACa randomized clinical trial. Ann Oncol. 2015;26(6):1201–1207. | ||
di Salvatore M, Pietrantonio F, Orlandi A, et al. IL-8 and eNOS polymorphisms predict bevacizumab-based first line treatment outcomes in RAS mutant metastatic colorectal cancer patients. Oncotarget. 2017;8(10):16887–16898. | ||
Taguchi A, Ohmiya N, Shirai K, et al. Interleukin-8 promoter polymorphism increases the risk of atrophic gastritis and gastric cancer in Japan. Cancer Epidemiol Biomarkers Prev. 2005;14(11 Pt 1):2487–2493. | ||
Hildebrand F, Stuhrmann M, van Griensven M, et al. Association of IL-8-251A/T polymorphism with incidence of acute respiratory distress syndrome (ARDS) and IL-8 synthesis after multiple trauma. Cytokine. 2007;37(3):192–199. | ||
Hull J, Thomson A, Kwiatkowski D. Association of respiratory syncytial virus bronchiolitis with the interleukin 8 gene region in UK families. Thorax. 2000;55(12):1023–1027. | ||
Koch AE, Polverini PJ, Kunkel SL, et al. Interleukin-8 as a macrophage-derived mediator of angiogenesis. Science. 1992;258(5089):1798–1801. | ||
Varney ML, Olsen KJ, Mosley RL, Bucana CD, Talmadge JE, Singh RK. Monocyte/macrophage recruitment, activation and differentiation modulate interleukin-8 production: a paracrine role of tumor-associated macrophages in tumor angiogenesis. In Vivo. 2002;16(6):471–477. | ||
Raman D, Baugher PJ, Thu YM, Richmond A. Role of chemokines in tumor growth. Cancer Lett. 2007;256(2):137–165. | ||
Xie K. Interleukin-8 and human cancer biology. Cytokine Growth Factor Rev. 2001;12(4):375–391. | ||
Maeda K, Nishiguchi Y, Yashiro M, et al. Expression of vascular endothelial growth factor and thrombospondin-1 in colorectal carcinoma. Int J Mol Med. 2000;5(4):373–378. | ||
Brostjan C, Gebhardt K, Gruenberger B, et al. Neoadjuvant treatment of colorectal cancer with bevacizumab: the perioperative angiogenic balance is sensitive to systemic thrombospondin-1 levels. Clin Cancer Res. 2008;14(7):2065–2074. | ||
Godiska R, Chantry D, Raport CJ, et al. Human macrophage-derived chemokine (MDC), a novel chemoattractant for monocytes, monocyte-derived dendritic cells, and natural killer cells. J Exp Med. 1997;185(9):1595–1604. | ||
Li A, Dubey S, Varney ML, Dave BJ, Singh RK. IL-8 directly enhanced endothelial cell survival, proliferation, and matrix metalloproteinases production and regulated angiogenesis. J Immunol. 2003;170(6):3369–3376. | ||
Bünger S, Haug U, Kelly FM, et al. Toward standardized high-throughput serum diagnostics: multiplex-protein array identifies IL-8 and VEGF as serum markers for colon cancer. J Biomol Screen. 2011;16(9):1018–1026. | ||
Goede V, Coutelle O, Neuneier J, et al. Identification of serum angiopoietin-2 as a biomarker for clinical outcome of colorectal cancer patients treated with bevacizumab-containing therapy. Br J Cancer. 2010;103(9):1407–1414. | ||
Liu Y, Starr MD, Bulusu A, et al. Correlation of angiogenic biomarker signatures with clinical outcomes in metastatic colorectal cancer patients receiving capecitabine, oxaliplatin, and bevacizumab. Cancer Med. 2013;2(2):234–242. | ||
Kaseb AO, Garrett-Mayer E, Morris JS, et al. Efficacy of bevacizumab plus erlotinib for advanced hepatocellular carcinoma and predictors of outcome: final results of a phase II trial. Oncology. 2012;82(2):67–74. | ||
Labussière M, Cheneau C, Prahst C, et al. Angiopoietin-2 may be involved in the resistance to bevacizumab in recurrent glioblastoma. Cancer Invest. 2016;34(1):39–44. | ||
Lam SW, Nota NM, Jager A, et al. Angiogenesis- and hypoxia-associated proteins as early indicators of the outcome in patients with metastatic breast cancer given first-line bevacizumab-based therapy. Clin Cancer Res. 2016;22(7):1611–1620. | ||
Pogue-Geile K, Yothers G, Taniyama Y, et al. Defective mismatch repair and benefit from bevacizumab for colon cancer: findings from NSABP C-08. J Natl Cancer Inst. 2013;105(13):989–992. | ||
Ulivi P, Scarpi E, Chiadini E, et al. Right- vs. left-sided metastatic colorectal cancer: differences in tumor biology and bevacizumab efficacy. Int J Mol Sci. 2017;18(6):1240. | ||
Venook AP, Niedzwiecki D, Innocenti F, et al. Impact of primary (1º) tumor location on overall survival (OS) and progression-free survival (PFS) in patients (pts) with metastatic colorectal cancer (mCRC): analysis of CALGB/SWOG 80405 (alliance). J Clin Oncol. 2016; 34(15 Suppl):3504. |
 © 2018 The Author(s). This work is published and licensed by Dove Medical Press Limited. The full terms of this license are available at https://www.dovepress.com/terms.php and incorporate the Creative Commons Attribution - Non Commercial (unported, v3.0) License.
By accessing the work you hereby accept the Terms. Non-commercial uses of the work are permitted without any further permission from Dove Medical Press Limited, provided the work is properly attributed. For permission for commercial use of this work, please see paragraphs 4.2 and 5 of our Terms.
© 2018 The Author(s). This work is published and licensed by Dove Medical Press Limited. The full terms of this license are available at https://www.dovepress.com/terms.php and incorporate the Creative Commons Attribution - Non Commercial (unported, v3.0) License.
By accessing the work you hereby accept the Terms. Non-commercial uses of the work are permitted without any further permission from Dove Medical Press Limited, provided the work is properly attributed. For permission for commercial use of this work, please see paragraphs 4.2 and 5 of our Terms.