")
Back to Journals » Cancer Management and Research » Volume 11
IGF1R facilitates epithelial-mesenchymal transition and cancer stem cell properties in neuroblastoma via the STAT3/AKT axis
Authors Wang XH, Wu HY, Gao J, Wang XH, Gao TH, Zhang SF
Received 3 December 2018
Accepted for publication 16 May 2019
Published 12 June 2019 Volume 2019:11 Pages 5459—5472
DOI https://doi.org/10.2147/CMAR.S196862
Checked for plagiarism Yes
Review by Single anonymous peer review
Peer reviewer comments 3
Editor who approved publication: Dr Chien-Feng Li
Xiao-Hui Wang,1 Hai-Ying Wu,2 Jian Gao,1 Xu-Hui Wang,1 Tian-Hui Gao,3 Shu-Feng Zhang1
1Department of Pediatric Surgery, People’s Hospital of Zhengzhou University (Henan Provincial People’s Hospital), Zhengzhou 450003, People’s Republic of China; 2Department of Obstetrics, People’s Hospital of Zhengzhou University (Henan Provincial People’s Hospital), Zhengzhou 450003, People’s Republic of China; 3Department of Medical Oncology, People’s Hospital of Zhengzhou University (Henan Provincial People’s Hospital), Zhengzhou 450003, People’s Republic of China
Background: Neuroblastoma (NB) displays the most heterogeneity in clinical manifestation. The insulin-like growth factor 1 receptor (IGF1R) has long been recognized for its role in tumourigenesis and growth. The IGF/IGF1R pathway is important in maintaining cell survival. It is reported that IGF1R participates in the occurrence of NB, but the mechanism is still unclear.
Methods: Human NB cell lines IMR-32 and SH-SY5Y were recruited in this study. IGF1R was knocked down by transfection with short hairpin RNA. Signal transducer and activator of transcription 3 (STAT3) expression was inhibited by Cryptotanshinone treatment. Cell proliferation, migration, and invasion were determined by MTT assay, wound healing assay, and cell invasion assay, respectively. The cancer stem cell properties were characterized by tumour sphere formation assay and colony formation assay. The mRNA and protein expression levels of related proteins were detected by RT-PCR and Western blot, respectively.
Results: The knockdown of IGF1R inhibits NB cell tumourigenesis and the epithelial-mesenchymal transition (EMT) of NB cells. Additionally, IGF1R was found to stimulate cancer stem cell-like properties in NPC cells. The knockdown of IGF1R significantly reduced the phosphorylation of AKT, and STAT3, indicating that the activation of the AKT and STAT3 pathways was inhibited by IGF1R knockdown. Furthermore, IGF1R was demonstrated to stimulate cancer stem cell-like properties in NB cells via the regulation of the STAT3/AKT axis.
Conclusion: IGF1R promotes cancer stem cell properties to facilitate EMT in neuroblastoma via the STAT3/AKT axis.
Keywords: IGF1R, neuroblastoma, epithelial mesenchymal transition, stemness, STAT3, AKT
Introduction
As a tumour possibly arising when partial neural crest cells on the neuroepithelium of ectoblast are differentiated into adrenal medulla and sympathetic ganglionic cells, neuroblastoma (NB) normally consists of immature and relatively undifferentiated progenitors.1 The main clinical characteristics of NB include low age of onset, high transfer rate at treatment, and spontaneous regression tendency at the stage of infancy. Among children age 0–14 with confirmed diagnosis of malignant tumour, the incidence rate of NB accounts for approximately 7%, but its fatality rate is 15% among paediatric tumours.2 Death caused by tumour metastasis and recurrence accounts for 90% of the tumour-caused death rate.3 In over 50% of NB patients, especially those age <1 with N-myc gene amplification, widespread metastasis is present at diagnosis, which increases the treatment difficulty of NB.4
With deepened research on tumour invasion and metastasis, the “seed” theory, ie “seed” refers to a stem cell, has attracted wide attention.5 Cancer stem cells (CSC) are a small portion of tumour cells with the abilities of self-renewal and differentiation into multiple types of mature cells among the colony, and they are also referred to as the cancer-initiating cells.6 Currently, the function of this portion of cells has been discovered in many tumours with different heterogeneity, including neuroblastoma.7–9 Further studies found that CSC serves as the key cell in invasion and metastasis, thus playing an important role in tumour distant metastasis, tissue infiltration and lymphatic metastasis. Additionally, CSC also participates in tumour angiogenesis, chemotherapeutic drug resistance and post-operative tumour recurrence.10,11 Hence, many believe that CSCs are primarily responsible for relapse and poor survival in neuroblastoma.12 Study of the biological properties of stem cells has become an important direction for tumour invasion and metastasis.
The epithelial-mesenchymal transition (EMT) is the biological process of epithelial cell phenotypic transformation to mesenchyme.13 A great number of studies have shown that 90% of tumours display different degrees of EMT in their progression, and mesenchymal tumours are the results of EMT development.14–17 Under normal circumstances, epithelial cells are closely connected to each other to maintain epithelial cell polarity and tissue completeness, whereas mesenchymal and phenotypic cells have a relatively strong ability to metastasize. After occurrence of EMT, epithelial characteristics of tumour cells such as cell adhesion force and polarity disappear, and thus the cytoskeleton is reorganized and obtains the mesenchymal phenotype and ability of metastasis.18 Therefore, it is widely held that tumour-related EMT participates in the malignant transformation of tumour cells.19 Regulated and controlled by transcription factors such as Snail, Slug, Twist and ZEB1, the features of EMT lie in weakened intercellular cohesion force and downregulated expression of the epithelial markers E-cadherin and keratin, and mesenchymal cell markers such as fibronectin, N-cadherin and vimentin display upregulation in expression and obtain an invasive fibre phenotype.14,18 In NB cells, epithelial mesenchymal transformation has been observed, showing increased mobility, enhanced invasion and decreased cell connection.20
The mechanism of EMT occurrence involves multiple signal transduction pathways that influence one another and share a complex relationship. Specifically, it is believed that EMT serves as an important model of how tumour cells react to various stimuli in the tumour microenvironment. The tumour microenvironment refers to the complex effects of tumour cells on the surrounding matrix cells through various soluble factors such as insulin-like growth factor (IGF), vascular endothelial growth factor, platelet-derived growth factor and inflammatory factor; selected insoluble factors such as the extracellular matrix; or direct reaction among cells.21,22 Among these influences, the IGF signal pathway has been proven to promote the formation of gastric cancer and increase the potential of gastric tumour cell metastasis.22 As an important pathway for maintaining cell survival, the IGF/IGF1R pathway has become an important target for tumour treatment.23 It is reported that in NB, overexpression of GALNT2 could hinder the proliferation and metastasis of NB by hindering IGF1R, demonstrating that IGF1R participates in the occurrence of NB,24 but the mechanism remains to be further studied.
In the current study, the knockdown of IGF1R was found to inhibit the tumourigenesis and EMT of NB cells. We also found that IGF1R can influence the EMT and tumour stemness of NB by regulating the downstream STAT3/AKT axis, ultimately leading to the occurrence of neuroblastoma.
Material and methods
Patients and specimens
Cell culture
The human NB cell lines IMR-32, SH-SY5Y, SK-N-BE, SK-N-AS, SK-N-SH, and BE-2C (ATCC; USA) were cultured in Dulbecco’s modified Eagle’s medium (Sigma-Aldrich, USA) supplemented with 10% (v/v) foetal calf serum (Roche, USA) and incubated at 37 °C and 5% CO2. To inhibit STAT3 and AKT signalling, STAT3 inhibitor Cryptotanshinone at a concentration of 7 μM and AKT inhibitor LY294002 at 10 μM were applied to treat the NB cells for the indicated time.
Short hairpin RNA (shRNA) interference
The short hairpin RNA (shRNAs) (targeted sequences are listed in Table 1) targeting IGF1R and scrambled control shRNA that were inserted into the pGPU6/GFP/NEO construct were obtained from GenePharma (China). IMR-32 and SH-SY5Y cells were separately plated in 6-well plates and were transiently transfected with IGF1R or negative control shRNA, according to the manufacturer’s introduction, using RNAi-Mate transfection reagent (GenePharma, China). After 48 h transfection, the cells were applied in the indicated experiments.
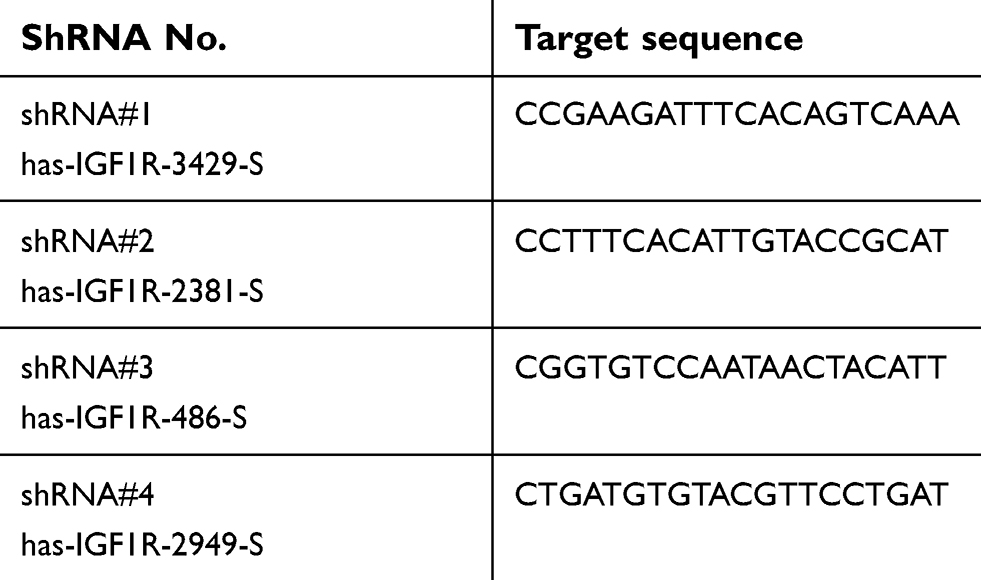 | Table 1 target sequence of IGF1R shRNA |
MTT assay
Cell proliferation of NB cells was detected using the MTT assay (Sigma, USA). The transfected cells were cultured in 96-well plates with 100 μL of growth medium. After culturing for different numbers of days (0, 12, 24, 48, or 72 h), the medium was replaced with fresh culture medium containing 10 μL of 5 mg/mL MTT dye. After 4 h incubation at 37 °C, the MTT solution was replaced with 150 μL of dimethyl sulfoxide (DMSO). The absorbance at 490 nm was detected with a microplate reader (BioTek, USA).
Wound healing assay
NB cells (5×10⁴) were seeded in 24-well plates and incubated at 37 °C. Confluent cells were scratched with a 200 µL pipette tip and transfected as described above. After 24 h incubation, the plates were washed with fresh medium to remove non-adherent cells and subsequently photographed. The wound area was determined using an inverted microscope (IX71; Olympus, Japan).
Cell invasion assay
The cell invasion assay was performed using a Transwell system (Corning, USA). The upper chamber of the Transwell was coated with extracellular matrix (BD Biosciences, USA). Cells were trypsinized, and 1×10⁵ cells were seeded into the upper chamber with serum free opti-MEM media. The lower chamber was filled with 800 µL medium containing 10% FBS as a chemoattractant. After incubation for 48 h, cells on the lower side of the filter were fixed in 3.8% formaldehyde for 20 min and stained with 0.1% crystal violet solution. The number of cells in five randomly selected fields was counted under a light microscope and statistically analysed.
Sphere formation assay
The transfected NB cells were cultured onto 96-well plates for 48 h, and the cells (1×10²) were seeded in 6-well ultra-low attachment microplates (Corning, USA) for 10 days. A DMEM/F12 serum-free medium (Invitrogen, USA) containing 5 μg/ml insulin, 20 ng/ml epidermal growth factor (EGF), 2% B27, and 20 ng/ml basic fibroblast growth factor (bFGF) was applied to culture the spheres. The numbers of tumour spheres were counted under a phase-contrast microscope (40x; Olympus, Japan).
Colony formation assay
The transfected NB cells were cultured onto 96-well plates for 24 h. Subsequently, 2×10² cells were plated in 6-well plates and cultured for 2 more weeks. The plates were washed twice with PBS, and the cells were fixed with methanol-acetic acid. Finally, the cells were stained with 0.5% crystal violet. The number of colonies was counted under a microscope (Olympus, Japan).
RNA extraction and qRT-PCR
RNA was isolated from NB cells with TRIzol reagent (Invitrogen, USA) and the RNeasy Plus Micro Kit (QIAGEN, USA), according to the manufacturer’s instructions. Reverse transcription was conducted to synthesize cDNA using the SuperScript® IV First-Strand Synthesis System (Invitrogen, USA). qRT-PCR was performed in an Applied Biosystems 7500 Real Time PCR System (Applied Biosystems, USA) using 20 ng template in a 25 µL reaction volume with 2 x Power SYBR® Green PCR Master Mix (Invitrogen, USA) and gene-specific primer pairs for E-cadherin, Vimentin, Snail, ZEB1, OCT4, SOX2, NANOG, Epcam, CD133, CD44 and GAPDH (see Table 1) in NB cells. The amplification conditions were set as follows: 95 °C for 10 min followed by 45 cycles consisting of 95 °C for 15 s, 58 °C for 30 s and 68 °C for 60 s. The gene expression levels for all samples were normalized to GAPDH expression using the comparative Ct method. All data are displayed as the mean ± SD of three independent experiments.
Western blot analysis
Cells were harvested and lysed in RIPA buffer (Sigma-Aldrich, USA). Protein concentrations were determined using the BCA protein assay kit (Thermo Fisher Scientific, USA). Proteins (30 μg) were separated by 10% SDS-PAGE and transferred onto a nitrocellulose membrane. After blocking with BSA, the membranes were incubated with primary antibodies, which were all purchased from Cell Signalling Technology (USA), against MMP3 (#14351), MMP9 (#13667), E-cadherin (#14472), Vimentin (#5741), Snail (#3879), ZEB1(#3396), IGF1R (#9750), p-IGF1R (#80732), FOXM1 (#5436), AKT (#9272), p-AKT (#4060), STAT3 (#9139), p-STAT3 (#9145), OCT4 (#2750), SOX2 (#3579), NANOG (#4903), EpCAM (#36746), CD44 (#37259), CD133 (#64326), and β-actin (#4970). β-actin was loaded as an internal reference. Bands were treated with goat anti-rabbit IgG-HRP secondary antibody (1:2000; Abcam, USA). Bands were developed using a chemiluminescence substance (Thermo Scientific, USA).
Statistical analysis
Data were analysed with Prism 6.0 software (GraphPad Software, USA). All experiments were performed in triplicate, and data were expressed in the form of mean ± standard deviation (SD). One-way analysis of variance (ANOVA) with multiple comparisons was applied followed by Tukey’s post hoc test for multiple comparison. P<0.05 was considered significantly different.
Results
IGF1R expression is upregulated in NB tissues and cell lines
The expression levels of IGF1R in NB tissues and NGD were analysed by qRT-PCR. As shown in Figure 1A, the expression level of IGF1R was significantly higher in the NB tissues than in NGD (P<0.01). More specifically, the expression levels of IGF1R in stage 3/4 (Figure 1B) and MYCN-amplified (Figure 1C) patients were dramatically higher than those in stage 1/2 and 4S and MYCN-amplified patients, respectively. In addition, the IGF1R expression levels were also detected in different NB cell lines (IMR-32, SH-SY5Y, SK-N-BE, SK-N-AS, SK-N-SH, and BE-2C) by Western blot analysis. Our results revealed that IGF1R was widely expressed in NB cell lines and relatively low-expressed in the BE-2C cell line (Figure 1D). IMR-32 and SH-SY5Y cell lines were recruited for the following studies.
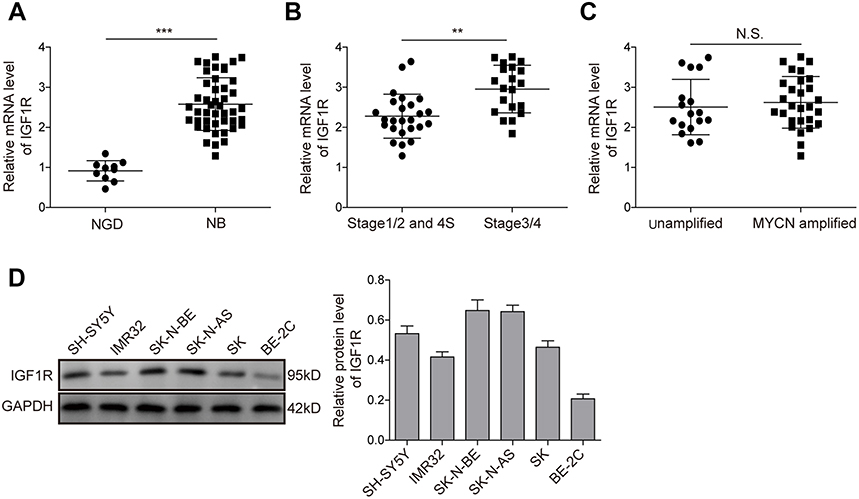 | Figure 1 IGF1R expression is upregulated in NB tissues and cell lines. (A) Expression levels of IGF1R in NB tissues and NGD detected by qRT-PCR. (B) Expression levels of IGF1R in samples from stage 3/4 and stage 1/2 and 4S patients detected by qRT-PCR. (C) Expression levels of IGF1R in the samples from MYCN-amplified and unamplified patients detected by qRT-PCR. (D) Protein expression levels of IGF1R in different NB cell lines by Western blot analysis. **P<0.01, ***P<0.001.Abbreviations: NB, neuroblastoma; IGF1R, insulin-like growth factor 1 receptor; N.S., not significant. |
Knockdown of IGF1R inhibits NB cell tumourigenesis
To investigate the role of IGF1R in NB tumourigenesis, IGF1R shRNA was used to knock down IGF1R expression in IMR-32 and SH-SY5Y cells. The knockdown efficiency of four IGF1R shRNAs from the shRNA Expression Vector Pack were determined after IMR-32 and SH-SY5Y cell transfections (Figure S1). The result showed that shIGF1R#3 exhibited the highest knockdown efficiency and was applied in the following knockdown studies. The IGF1R expressions were significantly reduced in both IMR-32 and SH-SY5Y cells when transfected with IGF1R shRNA (versus the shNC group; Figure 2A and B). The MTT assay was performed to identify the effect of IGF1R on cell proliferation. As shown in Figure 2C and D, the cell viability of both IMR-32 and SH-SY5Y cells was significantly decreased after incubation for 48 h and 72 h (P<0.05, versus the shNC group). The role of IGF1R in NB cell migration and invasion was further investigated. The Transwell assay showed that the cell invasion abilities of NB cells were decreased by IGF1R knockdown (Figure 2E–G). Consistently, the wound healing assay (Figure 2H and I) showed that the migration of NB cells was inhibited by IGF1R knockdown (P<0.01, versus the shNC group). All of these results indicate that IGF1R facilitates proliferation and migration in NB cells.
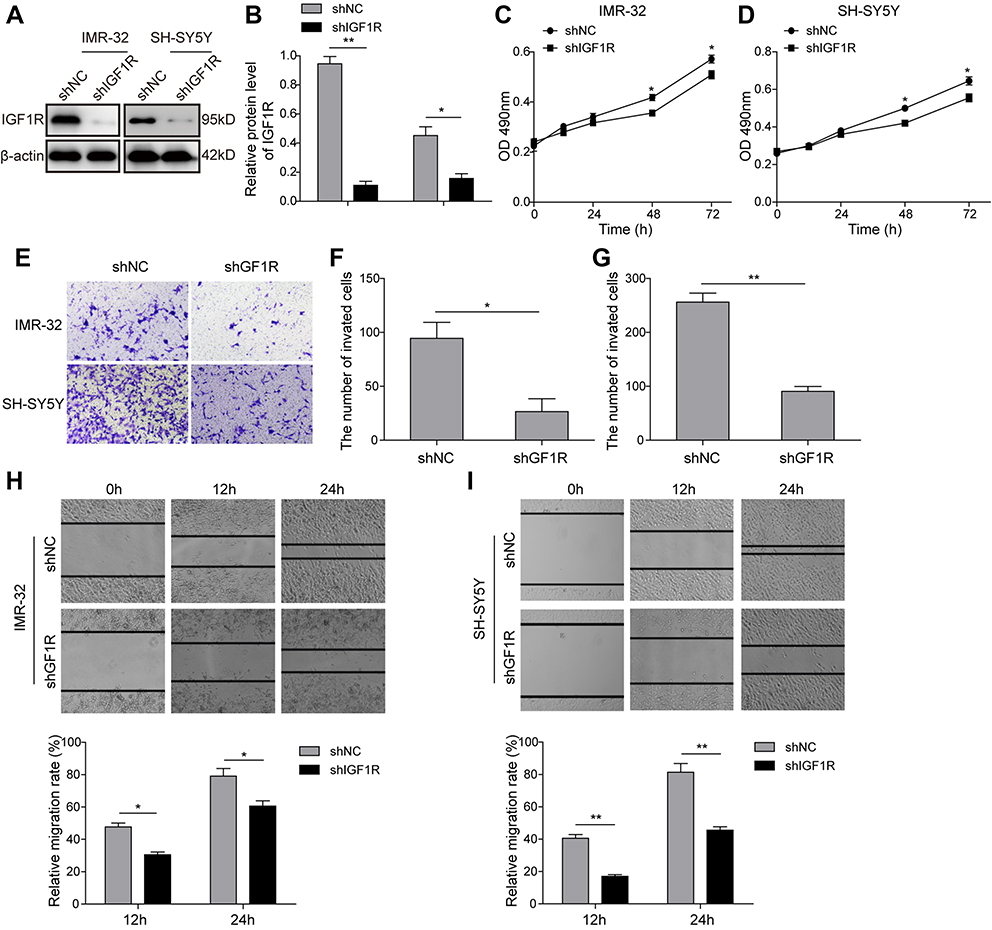 | Figure 2 Knockdown of IGF1R inhibits NB cell tumourigenesis. (A and B) IGF1R expression levels in IMR-32 (A) and SH-SY5Y (B) cells transfected with IGF1R shRNA and detected by Western blot. (C and D) Effect of IGF1R on IMR-32 (C) and SH-SY5Y (D) proliferation determined by MTT assay. (E–G) NB cell invasion determined by Transwell assay. (H and I) NB cell migration determined by wound healing assay. *P<0.05, **P<0.01 vs shNC group. All data are shown as the mean±SD based on three independent experiments. Abbreviations: NB, neuroblastoma; IGF1R, insulin-like growth factor 1 receptor. |
Knockdown of IGF1R inhibits EMT of NB cells
Given the critical role of EMT in tumourigenesis, we further investigated the role of IGF1R in the EMT of NB cells. The Western blot analysis (Figure 3A–H) showed that IGF1R knockdown significantly upregulated the expression of E-cadherin, whereas the expressions of Vimentin, Snail, and ZEB1, as well as MMP3 and MMP9, were dramatically downregulated (P<0.05, versus the shNC group). The EMT-related markers and transcription factors were also detected by qRT-PCR. The results showed that the E-cadherin was significantly upregulated by IGF1R knockdown in both IMR-32 and SH-SY5Y cells (P<0.01, versus the shNC group; Figure 3I and J), whereas Vimentin, Snail, and ZEB1 were significantly downregulated (P<0.01, P<0.05, versus the shNC group), results that are consistent with the trends of the protein profile. All of these results indicate that IGF1R can induce EMT of NB cells.
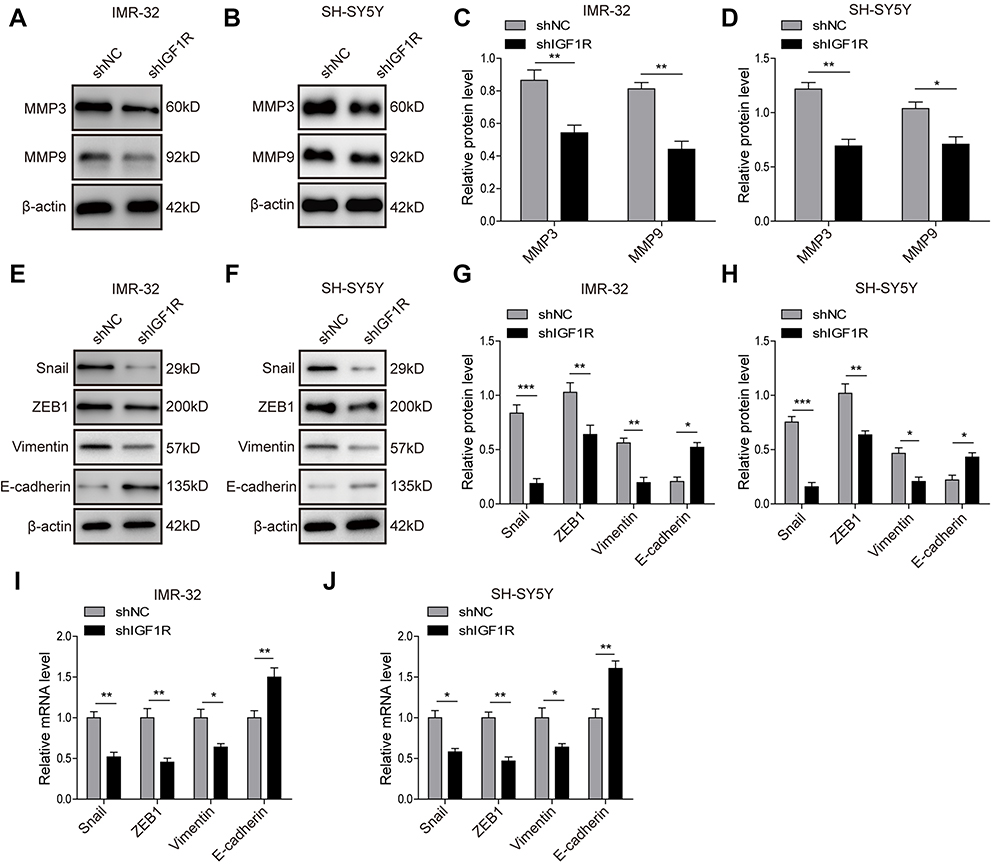 | Figure 3 Knockdown of IGF1R inhibits the EMT of NB cells. (A–D) Expression levels and semi-quantitative analysis of MMP3 and MMP9 in IMR-32 (A and C) and SH-SY5Y (B and D) cells determined by Western blot analysis. (E–H) Expression levels and semi-quantitative analysis of EMT related proteins, including Snail, ZEB1, Vimentin, and E-cadherin, in IMR-32 (E and G) and SH-SY5Y (F and H) cells determined by Western blot analysis. (I and J) mRNA expression of EMT-related proteins in IMR-32 (H) and SH-SY5Y (I) cells determined by RT-PCR. *P<0.05, **P<0.01, ***P<0.001 vs shNC group. All data are shown as the mean±SD based on three independent experiments.Abbreviations: NB, neuroblastoma; IGF1R, insulin-like growth factor 1 receptor; EMT, epithelial-mesenchymal transition. |
Knockdown of IGF1R inhibits activation of the AKT and STAT3 pathways
The STAT3/AKT axis has been reported as a typical downstream molecule of the IGF/IGF1R signal pathway. Therefore, activation of the AKT and STAT3 pathways in SH-SY5Y cells was further investigated. As shown in Figure 4, knockdown of IGF1R significantly reduced the phosphorylation of AKT and STAT3 (P<0.01, P<0.05, versus the shNC group), indicating that the activation of AKT and STAT3 pathways was inhibited by IGF1R knockdown.
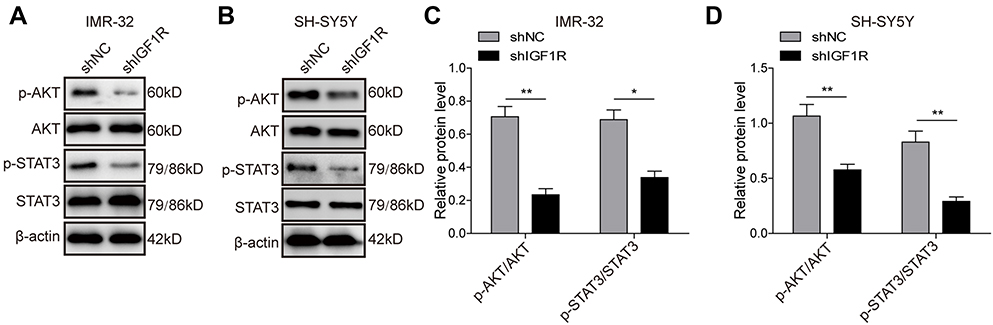 | Figure 4 Knockdown of IGF1R inhibits activation of the AKT and STAT3 pathways. Expression levels and semi-quantitative analysis of AKT, STAT3, p-AKT, and p-STAT3 in IMR-32 (A and C) and SH-SY5Y (B and D) cells detected by Western blot. *P<0.05, **P<0.01 vs shNC group. All data are shown as the mean±SD based on three independent experiments. Abbreviation: IGF1R, insulin-like growth factor 1 receptor. |
Knockdown of IGF1R attenuates cancer stem cell-like properties in NB cells
The role of IGF1R expression on the induction of NB cells to form spherical clonal colonies was further investigated. The tumour sphere formation assay showed that IGF1R shRNA transfection dramatically reduced the ability of SH-SY5Y (Figure 5A and B) and IMR-32 (Figure 5E and F) cells to form spheres compared with that of the shNC group after 10-day incubation (P<0.05). Consistently, in the colony formation assay, much fewer colonies were observed when IGF1R was knocked down in both SH-SY5Y (Figure 5C and D) and IMR-32 (Figure 5G and H) cells. All of these results indicate that IGF1R can stimulate the stem cell properties of NB cells.
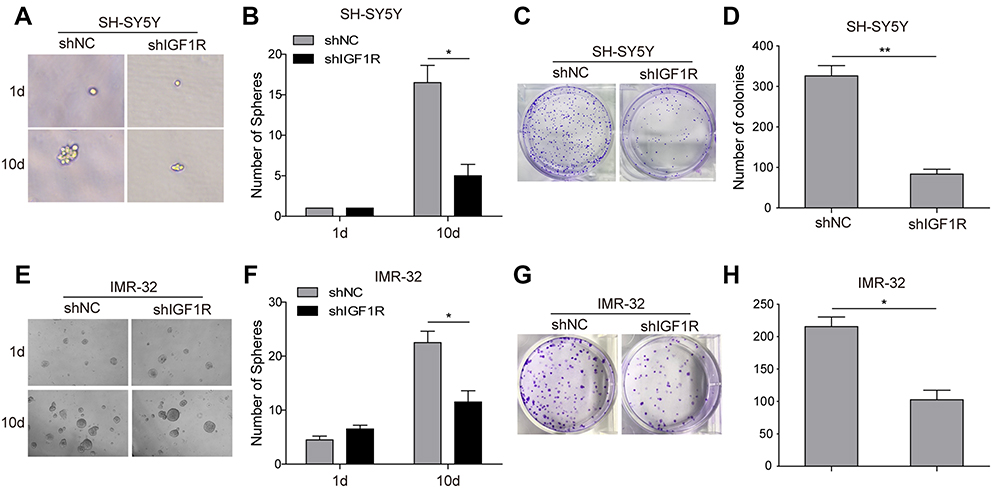 | Figure 5 Knockdown of IGF1R attenuates cancer stem cell-like properties in NB cells. The sphere formation assay showed that IGF1R shRNA transfection dramatically reduced the ability of SH-SY5Y (A and B) and IMR-32 (E and F) cells to form spheres compared with the shNC group after 10-day incubation. The colony formation assay showed that much fewer and smaller colonies were observed when IGF1R was knocked down in both SH-SY5Y (C and D) and IMR-32 (G and H) cells. *P<0.05, **P<0.01 vs shNC group. All data are shown as the mean±SD based on three independent experiments. Abbreviations: NB, neuroblastoma; IGF1R, insulin-like growth factor 1 receptor. |
Knockdown of IGF1R downregulates cancer stem cell markers in NB cells
To further confirm the effect of IGF1R on the stem cell properties of NB cells, the expressions of the stem cell-related transcription factors, including OCT4, SOX2, and NANOG and stem cell markers EpCAM, CD44, and CD133, were further studied by Western blot and RT-PCR in SH-SY5Y cells. As expected, the protein (Figure 6A and B; Figure 6D and E) and mRNA (Figure 6C and F) expression levels of the markers were downregulated after IGF1R shRNA transfection (P<0.001, P<0.01, P<0.05, versus the shNC group). These results further confirm that IGF1R maintains the stem cell properties of NB cells.
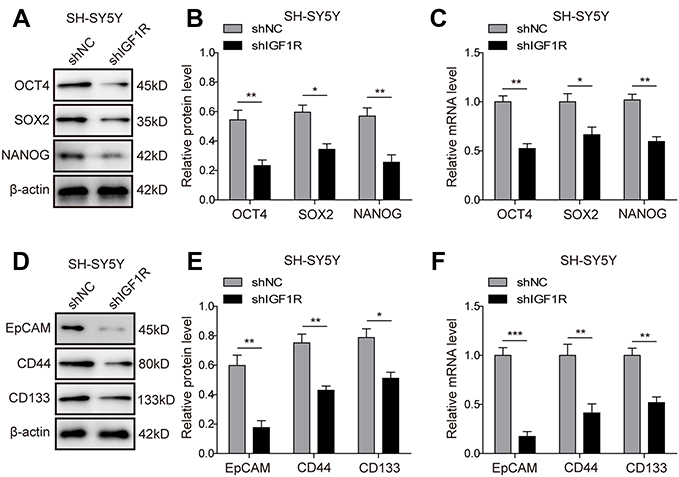 | Figure 6 Knockdown of IGF1R downregulates cancer stem cell markers in NB cells. (A–C) Expressions of the stem cell-related transcription factor in SH-SY5Y cells, including OCT4, SOX2, and NANOG detected by Western blot (A and B) and RT-PCR (C). (D–F) Expressions of the stem cell markers in SH-SY5Y cells, including Epcam, CD44, and CD133 detected by Western blot (D and E) and RT-PCR (F). *P<0.05, **P<0.01, ***P<0.001 vs shNC group. All data are shown as the mean±SD based on three independent experiments. Abbreviations: NB, neuroblastoma; IGF1R, insulin-like growth factor 1 receptor. |
STAT3/AKT axis is essential for cancer stem cell-like properties in NB cells
To further investigate the roles of the AKT and STAT3 pathways in regulation of the stem cell-like properties of NB cells, the STAT3 inhibitor Cryptotanshinone and AKT inhibitor LY294002 were applied, and the corresponding inhibition efficiency was validated. The result (Figure 7A and B) showed that Cryptotanshinone could significantly inhibit the phosphorylation of AKT and STAT3, and LY294002 could inhibit the phosphorylation of AKT and had a certain effect on the phosphorylation of STAT3, suggesting that crosstalk might exist between the two pathways. The tumour-sphere formation assay showed that the inhibitor treatments dramatically reduced the ability of SH-SY5Y (Figure 7C and D) and IMR-32 (Figure S2A and B) cells to form spheres compared with the control group after 10-day incubation (P<0.05). Consistently, in the colony formation assay, much fewer and smaller colonies were observed in inhibitor group in both SH-SY5Y (Figure 7E and F) and IMR-32 (Figure S2C and D) cells. Furthermore, the protein (Figure 7G and H; Figure S2E and F) and mRNA (Figure 7I; Figure S2G) expression levels of stem cell markers in SH-SY5Y and IMR-32 cells were downregulated after the inhibitor treatments, except for the protein level of SOX2 (P<0.01, P<0.05, versus the control group). All of these results indicate that the STAT3/AKT axis is essential for cancer stem cell-like properties in NB cells.
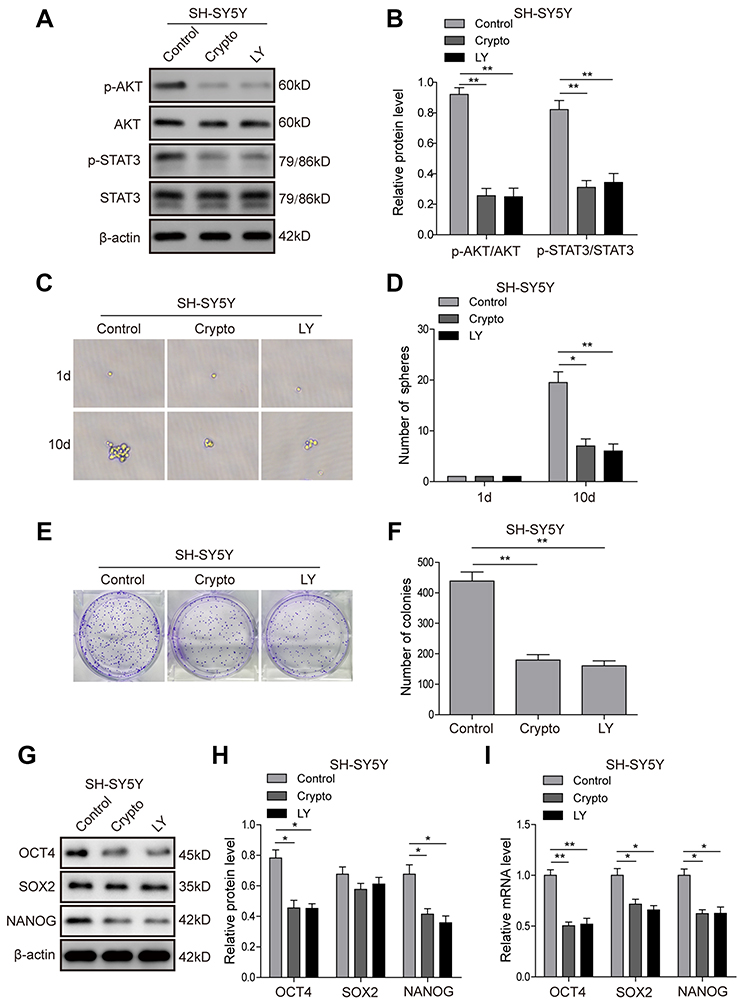 | Figure 7 STAT3/AKT pathways are essential for cancer stem cell-like properties in SH-SY5Y cells. (A and B) Inhibition efficiency of STAT3 inhibitor Cryptotanshinone and AKT inhibitor LY294002 validated by Western blot analysis. (C and D) The tumour-sphere formation assay showed that LY294002 or Crypto treatment dramatically reduced the ability of SH-SY5Y cells to form spheres compared with the control group after 10-day incubation. (E and F) The colony formation assay showed that much fewer and smaller colonies were observed when LY294002 or Crypto was used in SH-SY5Y cells. (G and H) Protein expression levels of stem cell-related transcription factor in SH-SY5Y cells detected by Western blot. (I) mRNA expression levels of stem cell-related transcription factor in SH-SY5Y cells detected by RT-PCR *P<0.05, **P<0.01 vs shNC group. All data are shown as the mean±SD based on three independent experiments. Abbreviations: NB, neuroblastoma; IGF1R, insulin-like growth factor 1 receptor; LY, LY294002. |
Discussion
In the current study, the knockdown of IGF1R was found to inhibit the tumourigenesis and EMT of NB cells. Additionally, IGF1R was demonstrated to stimulate cancer stem cell-like properties in NB cells via the regulation of the AKT and STAT3 pathways.
IGF1R has long been recognized for its role in tumourigenesis and growth, and more than ten IGF/IGF1R inhibitors have entered clinical trials.23 It is reported that in NB, the overexpression of GALNT2 could hinder the proliferation and metastasis of NB by hindering IGF1R, demonstrating that IGF1R participates in the occurrence of NB.24 However, the mechanism remains unclear. Upregulation of matrix metalloproteinase (MMPs) can promote tumour metastasis, and research shows that in many tumours, downregulation of MMP3 and MMP9 can be observed in both in vitro experiments and in vivo experiments.24–26 In this study, MMP3 and MMP9 were observed to be dramatically downregulated by IGF1R knockdown. These results might indicate that IGF1R can promote NB metastasis via upregulation of MMPs.
The IGF1R signal pathway has been proven to participate in regulating the proliferation and EMT of various cells.26,27 The EMT of tumour cells is related to their abilities of invasion and metastasis, or in other words, EMT serves as one of the preconditions for cell invasion and metastasis. Xu et al reported that IGF1/IGF1R signalling is involved in the EMT process induced by interferon-induced transmembrane protein 2 in gastric cancer, thus contributing to cancer growth and metastasis.28 Peake et al found that growth differentiation factor 15 can induce EMT and invasion of breast cancer through IGF1R signalling.29 Zhao et al also found that IGF1 can induce EMT via Stat5 in hepatocellular carcinoma.30 In our study, we demonstrated for the first time that IGF1R knockdown significantly inhibits EMT in neuroblastoma.
Another important aspect for tumour invasion and metastasis lies in the role of the stem cell property. Shan et al reported that IGF signalling participates in self-renewal of liver CSCs.31 Additionally, treatment of CRC cells with IGF-II resulted in an increased stem cell phenotype in colorectal cancer, which could be blocked by an IGF1R-specific inhibitor.32 Recently, Vaquero et al found that erlotinib-resistant cholangiocarcinoma cells displayed an upregulation of insulin receptor (IR) and IGF1R.33 IR/IGF1R inhibition was observed to reduce the EMT and CSC-like phenotype in the resistant cells. Consistently, in the current study, knockdown of IGF1R was found to attenuate the cancer stem cell-like properties and downregulate the cancer stem cell-like properties markers in NB cells. STAT3 and AKT are important pathways related to the poor prognosis of NB patients as well as the proliferation and metastasis of NB cells.34,35 In addition, STAT3 was reported to play a critical role in maintaining the stem cell phenotype and is used as a marker of CSCs.36 STAT3 has been reported in many studies in the literature as a typical downstream molecule of the IGF/IGF1R signal pathway.37 In our study, the knockdown of IGF1R inhibits the activation of STAT3/AKT axis and further attenuates the cancer stem cell-like properties in NB cells. In lung cancer cells, the activation of STAT3 was observed to restore the activation of Akt that was initially inhibited by gefitinib.38 In our study, we found that the phosphorylation of STAT3 can also be affected by the AKT inhibitor treatment. Therefore, determining whether IGF1R affects the AKT and STAT3 signalling pathways at the same time or affects the other by affecting one of them requires further exploration in future studies.
IGF1R regulates the cancer stem cell-like properties in NB cells through the STAT3/AKT axis, whereas the relationship between EMT and activation of STAT3 or AKT remains unclear in neuroblastoma. It was reported that cancer stemness markers including SOX-2 and NANOG are involved in promoting EMT progress.39,40 Therefore, we speculate that IGF1R might regulate EMT by regulating stem cell-like properties in NB cells. However, Song et al and Yu et al reported that STAT3/AKT can also directly promote EMT progress.41,42 These findings also suggest that the regulation of EMT by IGF1R might also be independent of its regulation of stemness.
Conclusions
Taking the above observations together, IGF1R was demonstrated to stimulate cancer stem cell-like properties in NB cells via the regulation of the AKT and STAT3 pathways. To further confirm our observation, an in vivo study will be conducted in our future work. The roles of IGF1R in regulating AKT and STAT3 pathways and maintaining the CSC properties of NB cells are highly complex, and EMT and CSC formation is a dynamic process triggered by multiple shared signalling pathways. This relationship will be further discussed in future studies. This finding might revive interest in using anti-IGF1R inhibitors as a potential treatment for NB patients.
Acknowledgments
The authors offer sincere gratitude to the reviewers for their constructive comments.
This work was supported by the Medical Science and Technology Breakthrough Plan General Project of Henan Province in 2017 (No. 201702168).
Author contributions
XHW designed the study, performed experimental studies, and prepared and edited the manuscript. HYW performed experimental studies and acquired data. JG conducted the literature research and analysed data. XHW and THG analysed data. SFZ designed the study, performed experimental studies, and reviewed the manuscript. All authors contributed to data analysis, drafting and revising the article, gave final approval of the version to be published, and agree to be accountable for all aspects of the work.
Disclosure
The authors report no conflicts of interest in this work.
References
1. Valter K, Zhivotovsky B, Gogvadze V. Cell death-based treatment of neuroblastoma. Cell Death Dis. 2018;9:113. doi:10.1038/s41419-018-1111-y
2. Mlakar V, Jurkovic Mlakar S, Lopez G, Maris JM, Ansari M, Gumy-Pause F. 11q deletion in neuroblastoma: a review of biological and clinical implications. Mol Cancer. 2017;16:114. doi:10.1186/s12943-017-0686-8
3. Seyfried TN, Huysentruyt LC. On the origin of cancer metastasis. Crit Rev Oncog. 2013;18:43–73.
4. Ahmed AA, Zhang L, Reddivalla N, Hetherington M. Neuroblastoma in children: update on clinicopathologic and genetic prognostic factors. Pediatr Hematol Oncol. 2017;34:165–185. doi:10.1080/08880018.2017.1330375
5. Liu Q, Zhang H, Jiang X, Qian C, Liu Z, Luo D. Factors involved in cancer metastasis: a better understanding to “seed and soil” hypothesis. Mol Cancer. 2017;16:176. doi:10.1186/s12943-017-0742-4
6. Huang R, Rofstad EK. Cancer stem cells (CSCs), cervical CSCs and targeted therapies. Oncotarget. 2017;8:35351–35367. doi:10.18632/oncotarget.10169
7. Boumahdi S, Driessens G, Lapouge G, et al. SOX2 controls tumour initiation and cancer stem-cell functions in squamous-cell carcinoma. Nature. 2014;511:246–250. doi:10.1038/nature13305
8. Batlle E, Clevers H. Cancer stem cells revisited. Nat Med. 2017;23:1124–1134. doi:10.1038/nm.4409
9. Alvarado AG, Thiagarajan PS, Mulkearns-Hubert EE, et al. Glioblastoma cancer stem cells evade innate immune suppression of self-renewal through reduced TLR4 expression. Cell Stem Cell. 2017;20:450–461 e454. doi:10.1016/j.stem.2016.12.001
10. Li S, Li Q. Cancer stem cells and tumor metastasis (Review). Int J Oncol. 2014;44:1806–1812. doi:10.3892/ijo.2014.2362
11. Chang JC. Cancer stem cells: role in tumor growth, recurrence, metastasis, and treatment resistance. Medicine (Baltimore). 2016;95:S20–S25. doi:10.1097/MD.0000000000004766
12. Garner EF, Beierle EA. Cancer stem cells and their interaction with the tumor microenvironment in neuroblastoma. Cancers (Basel). 2015;8:5. doi:10.3390/cancers8010005
13. Chen T, You Y, Jiang H, Wang ZZ. Epithelial-mesenchymal transition (EMT): a biological process in the development, stem cell differentiation, and tumorigenesis. J Cell Physiol. 2017;232:3261–3272. doi:10.1002/jcp.25797
14. Tsai JH, Yang J. Epithelial-mesenchymal plasticity in carcinoma metastasis. Genes Dev. 2013;27:2192–2206. doi:10.1101/gad.225334.113
15. Cao H, Xu E, Liu H, Wan L, Lai M. Epithelial-mesenchymal transition in colorectal cancer metastasis: a system review. Pathol Res Pract. 2015;211:557–569. doi:10.1016/j.prp.2015.05.010
16. Wang Y, Zhou BP. Epithelial-mesenchymal transition in breast cancer progression and metastasis. Chin J Cancer. 2011;30:603–611. doi:10.5732/cjc.011.10226
17. Beuran M, Negoi I, Paun S, et al. The epithelial to mesenchymal transition in pancreatic cancer: a systematic review. Pancreatology. 2015;15:217–225. doi:10.1016/j.pan.2015.02.011
18. Skovierova H, Okajcekova T, Strnadel J, Vidomanova E, Halasova E. Molecular regulation of epithelial-to-mesenchymal transition in tumorigenesis (Review). Int J Mol Med. 2018;41:1187–1200. doi:10.3892/ijmm.2017.3320
19. Nieto MA, Huang RY, Jackson RA, Thiery JP. Emt: 2016. Cell. 2016;166:21–45. doi:10.1016/j.cell.2016.06.028
20. Tian X, Zhou D, Chen L, et al. Polo-like kinase 4 mediates epithelial-mesenchymal transition in neuroblastoma via PI3K/Akt signaling pathway. Cell Death Dis. 2018;9:54. doi:10.1038/s41419-018-1111-y
21. Wang M, Zhao J, Zhang L, et al. Role of tumor microenvironment in tumorigenesis. J Cancer. 2017;8:761–773. doi:10.7150/jca.17648
22. Zhang X, Nie D, Chakrabarty S. Growth factors in tumor microenvironment. Front Biosci (Landmark Ed). 2010;15:151–165.
23. Chen HX, Sharon E. IGF-1R as an anti-cancer target–trials and tribulations. Chin J Cancer. 2013;32:242–252. doi:10.5732/cjc.012.10263
24. Ho WL, Chou CH, Jeng YM, et al. GALNT2 suppresses malignant phenotypes through IGF-1 receptor and predicts favorable prognosis in neuroblastoma. Oncotarget. 2014;5:12247–12259. doi:10.18632/oncotarget.2627
25. Cox OT, O’Shea S, Tresse E, Bustamante-Garrido M, Kiran-Deevi R, O’Connor R. IGF-1 receptor and adhesion signaling: an important axis in determining cancer cell phenotype and therapy resistance. Front Endocrinol (Lausanne). 2015;6:106. doi:10.3389/fendo.2015.00106
26. Vazquez-Martin A, Cufi S, Oliveras-Ferraros C, et al. IGF-1R/epithelial-to-mesenchymal transition (EMT) crosstalk suppresses the erlotinib-sensitizing effect of EGFR exon 19 deletion mutations. Sci Rep. 2013;3:2560. doi:10.1038/srep02560
27. Li H, Batth IS, Qu X, et al. IGF-IR signaling in epithelial to mesenchymal transition and targeting IGF-IR therapy: overview and new insights. Mol Cancer. 2017;16:6. doi:10.1186/s12943-016-0576-5
28. Xu L, Zhou R, Yuan L, et al. IGF1/IGF1R/STAT3 signaling-inducible IFITM2 promotes gastric cancer growth and metastasis. Cancer Lett. 2017;393:76–85. doi:10.1016/j.canlet.2017.02.014
29. Peake BF, Eze SM, Yang L, Castellino RC, Nahta R. Growth differentiation factor 15 mediates epithelial mesenchymal transition and invasion of breast cancers through IGF-1R-FoxM1 signaling. Oncotarget. 2017;8:94393–94406. doi:10.18632/oncotarget.21765
30. Zhao C, Wang Q, Wang B, et al. IGF-1 induces the epithelial-mesenchymal transition via Stat5 in hepatocellular carcinoma. Oncotarget. 2017;8:111922–111930. doi:10.18632/oncotarget.22952
31. Shan J, Shen J, Liu L, et al. Nanog regulates self-renewal of cancer stem cells through the insulin-like growth factor pathway in human hepatocellular carcinoma. Hepatology. 2012;56:1004–1014. doi:10.1002/hep.25745
32. Yao C, Su L, Shan J, et al. IGF/STAT3/NANOG/Slug signaling axis simultaneously controls epithelial-mesenchymal transition and stemness maintenance in colorectal cancer. Stem Cells. 2016;34:820–831. doi:10.1002/stem.2320
33. Vaquero J, Lobe C, Tahraoui S, et al. The IGF2/IR/IGF1R pathway in tumor cells and myofibroblasts mediates resistance to EGFR inhibition in cholangiocarcinoma. Clin Cancer Res. 2018;24:4282–4296. doi:10.1158/1078-0432.CCR-17-3725
34. Megison ML, Gillory LA, Beierle EA. Cell survival signaling in neuroblastoma. Anticancer Agents Med Chem. 2013;13:563–575.
35. Chai H, Luo AZ, Weerasinghe P, Brown RE. Sorafenib downregulates ERK/Akt and STAT3 survival pathways and induces apoptosis in a human neuroblastoma cell line. Int J Clin Exp Pathol. 2010;3:408–415.
36. Galoczova M, Coates P, Vojtesek B. STAT3, stem cells, cancer stem cells and p63. Cell Mol Biol Lett. 2018;23:12. doi:10.1186/s11658-018-0078-0
37. Subramani R, Lopez-Valdez R, Arumugam A, Nandy S, Boopalan T, Lakshmanaswamy R. Targeting insulin-like growth factor 1 receptor inhibits pancreatic cancer growth and metastasis. PLoS One. 2014;9:e97016. doi:10.1371/journal.pone.0097016
38. Wu K, Chang Q, Lu Y, et al. Gefitinib resistance resulted from STAT3-mediated Akt activation in lung cancer cells. Oncotarget. 2013;4:2430–2438. doi:10.18632/oncotarget.1431
39. Liu X, Qiao B, Zhao T, Hu F, Lam AK, Tao Q. Sox2 promotes tumor aggressiveness and epithelialmesenchymal transition in tongue squamous cell carcinoma. Int J Mol Med. 2018;42:1418–1426. doi:10.3892/ijmm.2018.3742
40. Pan Q, Meng L, Ye J, et al. Transcriptional repression of miR-200 family members by Nanog in colon cancer cells induces epithelial-mesenchymal transition (EMT). Cancer Lett. 2017;392:26–38. doi:10.1016/j.canlet.2017.01.039
41. Song X, Wang J, Zheng T, et al. LBH589 Inhibits proliferation and metastasis of hepatocellular carcinoma via inhibition of gankyrin/STAT3/Akt pathway. Mol Cancer. 2013;12:114. doi:10.1186/1476-4598-12-114
42. Yu M, Xue H, Wang Y, et al. miR-345 inhibits tumor metastasis and EMT by targeting IRF1-mediated mTOR/STAT3/AKT pathway in hepatocellular carcinoma. Int J Oncol. 2017;50:975–983. doi:10.3892/ijo.2017.3852
Supplementary materials
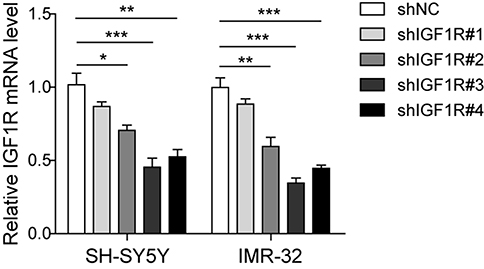 | Figure S1 Silencing potency of four shRNAs against IGF1R verified by qPCR.Abbreviation: IGF1R, insulin-like growth factor 1 receptor. *P<0.05, **P<0.01, ***P<0.001 |
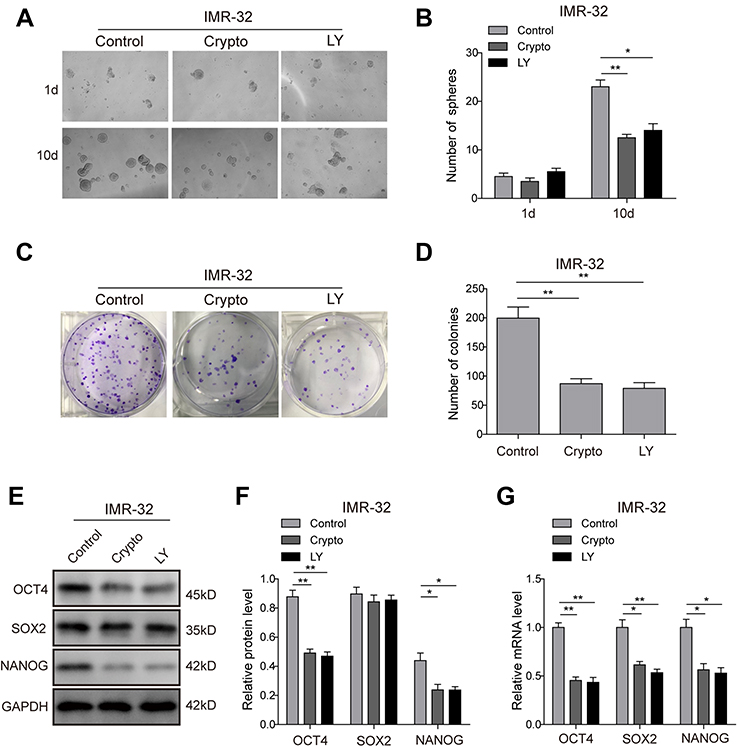 | Figure S2 STAT3/AKT pathways are essential for cancer stem cell-like properties in IMR-32 cells. (A and B) The tumour-sphere formation assay showed that the LY294002 or Crypto treatment dramatically reduced the ability of IMR-32 cells to form spheres compared with the control group after 10-day incubation. (C and D) The colony formation assay showed that much fewer and smaller colonies were observed when LY294002 or Crypto was used in IMR-32 cells. (E–G) Protein (E and F) and mRNA (G) expression levels of stem cell-related transcription factor in IMR-32 cells detected by Western blot and RT-PCR. *P<0.05, **P<0.01 vs shNC group. All data are shown as the mean±SD based on three independent experiments. Abbreviation: LY, LY294002. |
 © 2019 The Author(s). This work is published and licensed by Dove Medical Press Limited. The full terms of this license are available at https://www.dovepress.com/terms.php and incorporate the Creative Commons Attribution - Non Commercial (unported, v3.0) License.
By accessing the work you hereby accept the Terms. Non-commercial uses of the work are permitted without any further permission from Dove Medical Press Limited, provided the work is properly attributed. For permission for commercial use of this work, please see paragraphs 4.2 and 5 of our Terms.
© 2019 The Author(s). This work is published and licensed by Dove Medical Press Limited. The full terms of this license are available at https://www.dovepress.com/terms.php and incorporate the Creative Commons Attribution - Non Commercial (unported, v3.0) License.
By accessing the work you hereby accept the Terms. Non-commercial uses of the work are permitted without any further permission from Dove Medical Press Limited, provided the work is properly attributed. For permission for commercial use of this work, please see paragraphs 4.2 and 5 of our Terms.