")
Back to Journals » International Journal of General Medicine » Volume 15
Identifying Potential Effective Diagnostic and Prognostic Biomarkers in Sepsis by Bioinformatics Analysis and Validation
Authors Huang X, Tan J, Chen X, Zhao L
Received 31 March 2022
Accepted for publication 28 June 2022
Published 6 July 2022 Volume 2022:15 Pages 6055—6071
DOI https://doi.org/10.2147/IJGM.S368782
Checked for plagiarism Yes
Review by Single anonymous peer review
Peer reviewer comments 3
Editor who approved publication: Dr Scott Fraser
Xu Huang, Jixiang Tan, Xiaoying Chen, Lin Zhao
Department of Intensive Care Unit, The First Affiliated Hospital of Chongqing Medical University, Chongqing, People’s Republic of China
Correspondence: Lin Zhao, Department of Intensive Care Unit, The First Affiliated Hospital of Chongqing Medical University, No. 1 Youyi Road, Yuzhong District, Chongqing, People’s Republic of China, Tel/Fax +86 23 89011736, Email [email protected]
Purpose: Sepsis is a serious life-threatening condition characterised by multi-organ failure due to a disturbed immune response caused by severe infection. The pathogenesis of sepsis is unclear. The aim of this article is to identify potential diagnostic and prognostic biomarkers of sepsis to improve the survival of patients with sepsis.
Methods: We downloaded 7 datasets from Gene Expression Omnibus database and screened the immune-related differential genes (IRDEGs). The related functions of IRDEGs were analyzed through Gene Ontology (GO) and Kyoto Encyclopedia of Genes and Genomes (KEGG). CIBERSORT was used to evaluate the infiltration of the immune cells, and Pearson algorithm of R software was used to calculate the correlation between the immune cell content and gene expression to screen the genes most related to immune cells in sepsis group, which were intersected with IRDEGs to obtain common genes. Key genes were identified from common genes based on the area under the receiver operating characteristic curve (AUC) greater than 0.8 in the 6 datasets. We then analyzed the predictive value of key genes in sepsis survival. Finally, we verified the expression of key genes in patients with sepsis by PCR analysis.
Results: A total of 164 IRDEGs were obtained, which were associated mainly with inflammatory and immunometabolic responses. Ten key genes (IL1R2, LTB4R, S100A11, S100A12, SORT1, RASGRP1, CD3G, CD40LG, CD8A and PPP3CC) were identified with high diagnostic efficacy. Logistic regression analysis revealed that six of the key genes (LTB4R, S100A11, SORT1, RASGRP1, CD3G and CD8A) may affect the survival prognosis of sepsis. PCR analysis confirmed that the expression of seven key genes (IL1R2, S100A12, RASGRP1, CD3G, CD40LG, CD8A and PPP3CC) was consistent with microarray outcome.
Conclusion: This study explored the immune and metabolic response mechanisms associated with sepsis, and identified ten potential diagnostic and six prognostic genes.
Keywords: sepsis, diagnostic biomarker, prognostic biomarkers
Introduction
Sepsis is a common clinical emergency and critical illness, and is regarded as one of the life-threatening infectious diseases.1 There are approximately 48.9 million septic patients and 11 million septic patients die worldwide each year, accounting for 19.7% of all the global deaths.2
From the perspective of immunology, the essence of sepsis is life-threatening multiple organ dysfunction caused by immune response and regulation disorder caused by severe infection.3 In other terms, sepsis progresses from excessive immune activation to widespread immunosuppression.4 What is more, the main cause of sepsis death is important organ dysfunction, which is characterized by impaired vascular barrier function, disordered immune regulation, excessive coagulation, impaired vascular regulation and ischemia, which further leads to multiple organ failure and death.3 Growing evidence supports immunosuppression as a major cause of sepsis-related deaths,5 and the main reason of immunosuppression is the death of immune cells, especially the apoptosis of T and B lymphocytes.6–8
Sepsis is considered a medical emergency because it can rapidly develop into organ dysfunction and death even if active medical treatment is taken immediately.9 Although our understanding of the pathogenesis of sepsis has progressed, it is still a worldwide health challenge due to high morbidity and high mortality. In the last few years, many technologies have been developed to diagnose sepsis reliably and quickly, but none of them is widely used in clinical practice.10,11
Bioinformatics analysis helps people to explore the molecular mechanisms underlying disease development and provides a new and effective method for identifying potential diagnostic biomarkers, assessing prognosis and redirecting treatment. Therefore, to better improve early diagnosis techniques and optimise treatment of sepsis, we use bioinformatics to identify diagnostic and prognostic relevant biomarkers and potential therapeutic targets for sepsis.
Materials and Methods
Microarray Data
We downloaded data from the Gene Expression Omnibus (GEO) database, the largest and most complete public gene expression data resource in the world today.12 The array-based gene expression profile dataset GSE69528 included whole blood samples from 83 septic patients and 55 uninfected controls. The array-based gene expression profile dataset GSE13904 included whole blood samples from 52 septic children, 106 septic shock children and 18 normal children. The array-based gene expression profile dataset GSE25504 included whole blood samples from 25 sepsis-infected human neonates and 37 controls. The array-based gene expression profile dataset GSE26440 included whole blood samples from 98 septic shock children and 32 controls. The array-based gene expression profile dataset GSE28750 included whole blood samples from 10 septic patients and 20 controls. The array-based gene expression profile dataset GSE145227 included peripheral blood mononuclear cell samples from 10 septic children and 12 controls. The array-based gene expression profile dataset GSE54514 included whole blood samples from 26 septic survivors, 9 sepsis non-survivors and 18 controls.
Screening for Differentially Expressed Genes (DEGs) from Blood Microarray Datasets of Sepsis Patients
DEGs between sepsis patients and control individuals in GSE69528 were screened by the “limma” package13 and volcano plots of DEGs were plotted using the “ggplot2” package14 to show the differential expression. P < 0.05 and | log2FC |> 1 were considered statistically significant.
Screening of Immune-Related DEGs
From the Immunology Database and Analysis Portal (IMMPORT) database (https://www.immport.org/home), we downloaded totaling 2483 immune-related genes (IRGs). The overlapping genes between IRGs and DEG were identified as immune-related differential DEGs (IRDEGs) by Venn diagram analysis, and were analysed by R language and cluster analysis packages for subsequent Gene Ontology (GO), Kyoto Gene and Genome Encyclopedia (KEGG) pathway enrichment analysis.
Estimate the 22 Immune Cell Types in Sepsis and Screen the Genes Most Related to Immune Cells in the Sepsis Group
Cibersort R package was used for cellular immune infiltration analysis to obtain the immune cell content matrix.15 The Pearson algorithm of R software was applied to calculate the correlation between the cell content and gene expression in the sepsis group samples, and the genes with a correlation coefficient greater than 0.7 were further intersected with IRDEGs to obtain common genes.
Screening Key Genes According to Receiver Operating Characteristic Curve Analysis
We calculated the area under the receiver operating characteristic curve (AUC) for common genes by using the pROC package in R16 in the six datasets, and visualized the results by using ggplot2. We selected genes with an AUC greater than 0.8 in all six datasets as the key genes for subsequent analyses.
Expression of Key Genes
We used R software and the ComplexHeatmap package to calculate the expression difference of key genes between septic patients and controls in 6 datasets. Further, we used Spearman analysis and Circlize package in R to calculate the correlation between key genes and then visualized the results.
Correlation Analysis of Key Genes and Immune Infiltrating Cells
We performed Spearman correlation analysis of key genes and immune infiltrating cells using R software and the ggstatsplot package, and visualised the results using the ggplot2 package.
TF-miRNA-mRNA Interaction Analysis
We obtained miRNA-key gene interactions from TarBase17 and mirtarbase18 to identify regulatory miRNAs that affect key genes at the post-transcriptional level. Meanwhile, in order to determine the regulatory TF controlling miRNA, TF-miRNA interaction was obtained using Jaspar database.19 All of the above use NetworkAnalyst to analyze topology parameters (ie, degree and medium centrality).20 We further used Cytoscape software21 to integrate the miRNA-target gene network and the TF-miRNA network to construct a TF-miRNA-target network to discover major regulatory genes.
Associations Between Key Genes and Diseases
The Comparative Toxicogenomics Database (CTD; http://ctdbase.org/) is a public database describing gene–disease interactions and providing information on gene–disease interactions.22 Ten key genes are input into the gene search box of CTD database one by one, and the diseases associated with each key gene can be obtained respectively. We therefore use these data to identify and analyse associations between key genes and diseases, and to understand the diseases in which key genes primarily act.
Functional Enrichment in Key Gene
The AmiGO database (v2.0; http://AmiGO.geneontology.org/AmiGO/) is a web application that is primarily used to query, browse, visualize and download gene ontologies and annotations.23 We used this database to confirm the enrichment of key sepsis-related genes that have been identified in this study.
Predictive Value of Key Genes in Sepsis Death
Using the data of the dataset GSE54514, the selected 10 key genes, gender, age, Acute Physiology and Chronic Health Evaluation II (APACHE II) score, and neutral percentage were used to perform multivariate and univariate regression analysis on the prognosis of death. APACHE II is one of the ICU scoring systems, higher scores suggest an increased severity.
Patient Enrollment and Sample Collection
From March 23, 2022 to March 30, 2022, patients diagnosed with sepsis in the Department of critical medicine of the First Affiliated Hospital of Chongqing Medical University were included in the study. We collected samples at the first time of admission (generally within 1 hour after admission) of patients with sepsis before the use of antibiotics. The follow-up treatment was carried out according to the routine treatment scheme. This part of the study was approved by the ethics committee of the First Affiliated Hospital of Chongqing Medical University (ethic reference number: 2022-02). Written informed consent was obtained from all donors in accordance with the Declaration of Helsinki and under Institutional Review Board–approved protocols. The inclusion criteria were: (1) the patient met the diagnostic criteria of sepsis 3.0,24 (2) the patient was aged between 18 and 90 years, and (3) the patient was hospitalized for more than 24 hours. The following patients were excluded: (1) using drugs that affect immunity, (2) having malignant tumors, and (3) pregnancy or lactation.
Real-Time PCR Analysis
Total RNA was extracted from whole blood using trlzogen reagent (Tiangen biochemical technology (Beijing) Co., Ltd). We use high-capacity cDNA reverse transcription kit (TaKaRa TB Green Premix Ex Taq II, RR820A) and first-strand cDNA synthesis kit (TaKaRa PrimeScript RT reagent Kit, RR0474) for RNA reverse transcription and first-strand DNA synthesis. Specific PCR primer pairs are listed in Table 1. GAPDH was used for internal control, and 2–ΔΔCT method was used to calculate relative mRNA expression level.
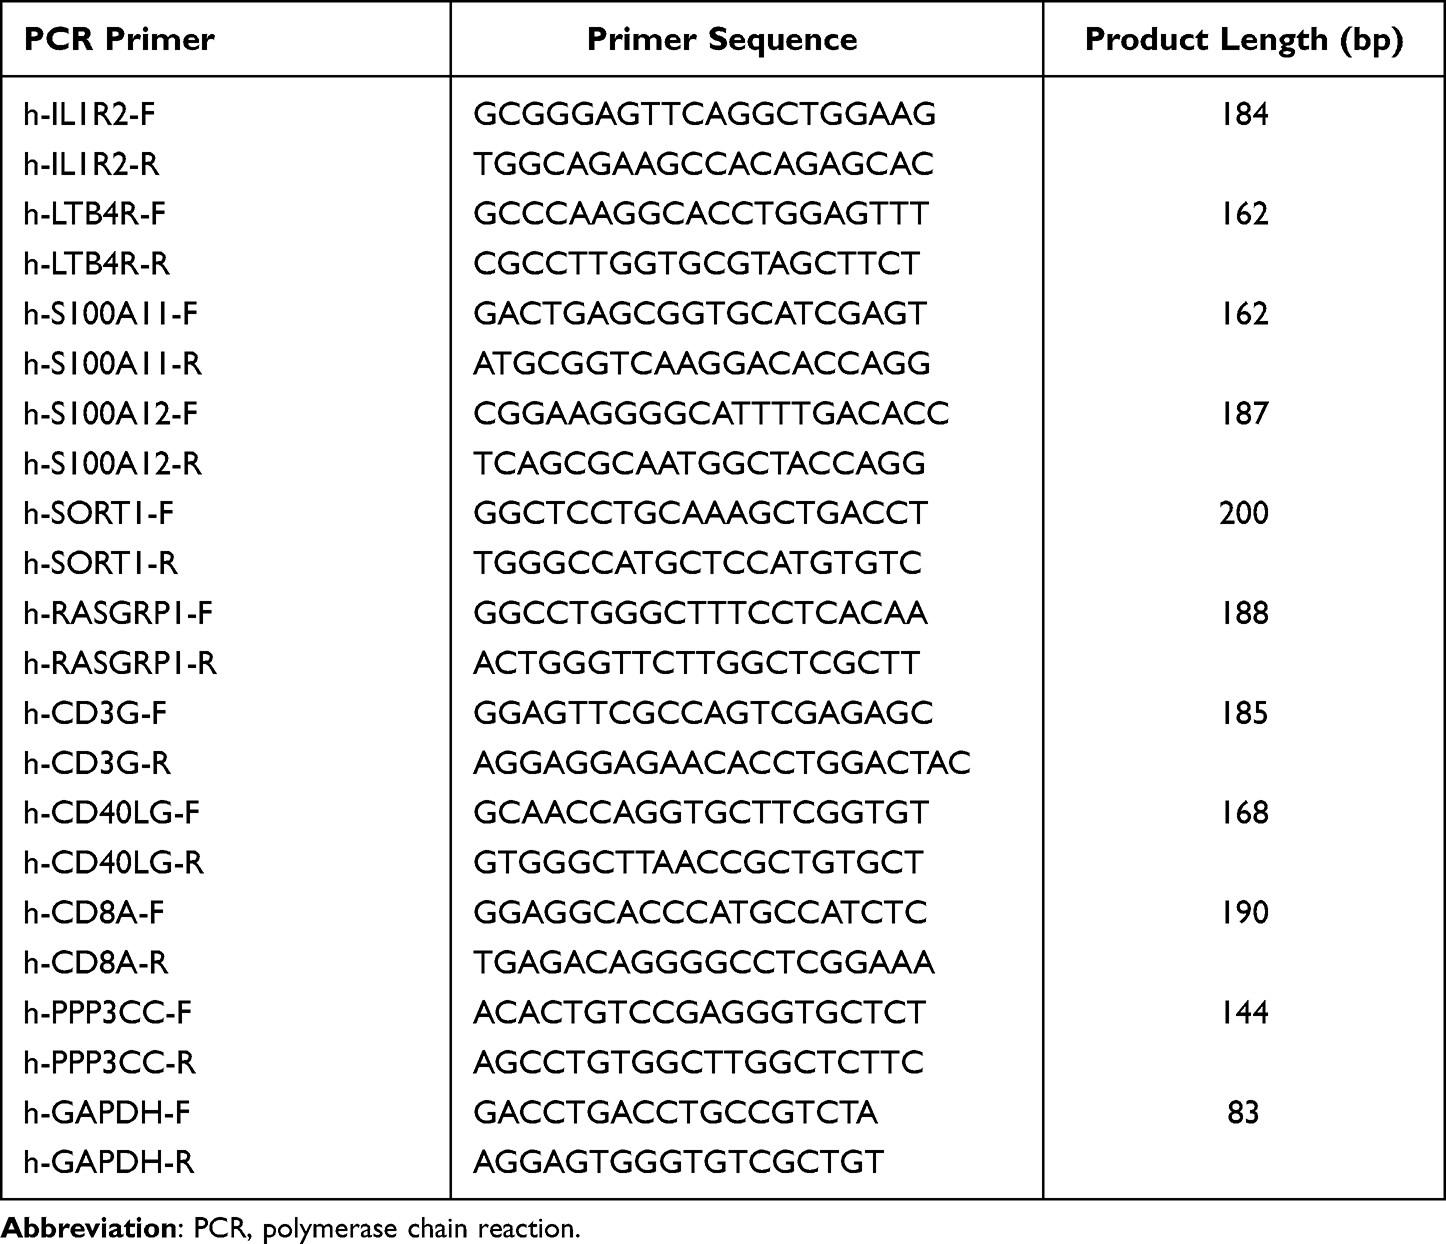 |
Table 1 Specific PCR Primer Pairs |
Statistical Analysis
Cox regression analysis was conducted at both univariate and multivariate levels to analyze independent factors affecting prognosis by using R software and Survival package. Statistical analysis and visualisation were performed using R3.6.3 and ggplot2. Statistical significance was calculated by Student’s t-test, Mann–Whitney U-test, chi-square test or Fisher’s exact test (as appropriate). Statistical tests were bilateral tests, and P values less than 0.05 were considered statistically significant.
Results
Identification of DEGs
The flow chart of this study is shown in Figure 1. In the dataset GSE69528, 1572 DEGs were screened between sepsis patients and controls in total, of which 755 were up-regulated genes and 807 were down-regulated genes (Figure 2A). There are 164 overlapping genes (IRDEGs) between IRGs and DEGs. The Venn diagram is shown in Figure 2B.
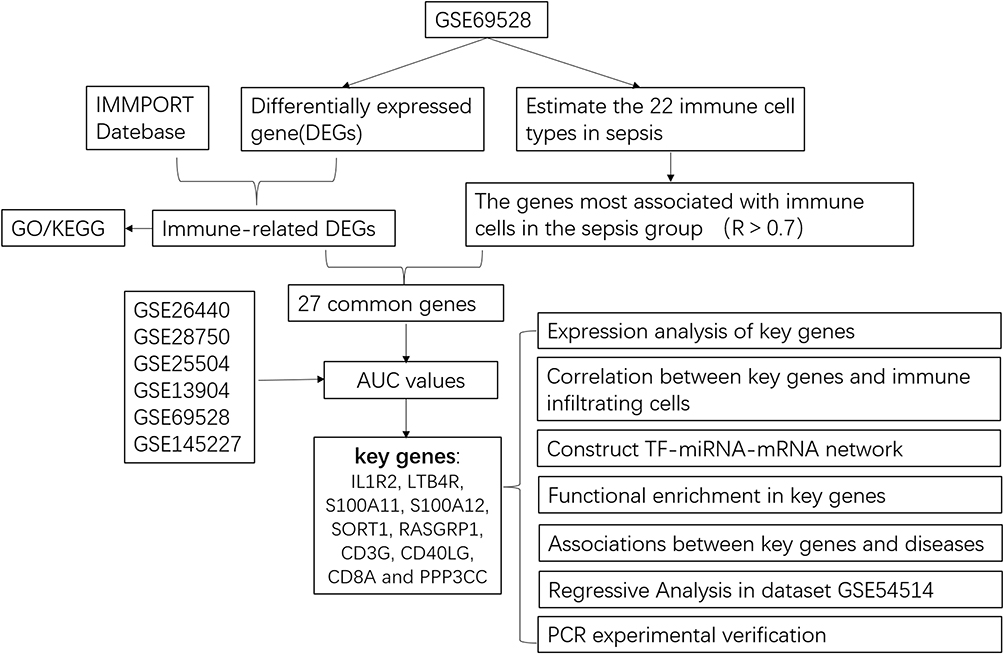 |
Figure 1 Flow chart of this study. |
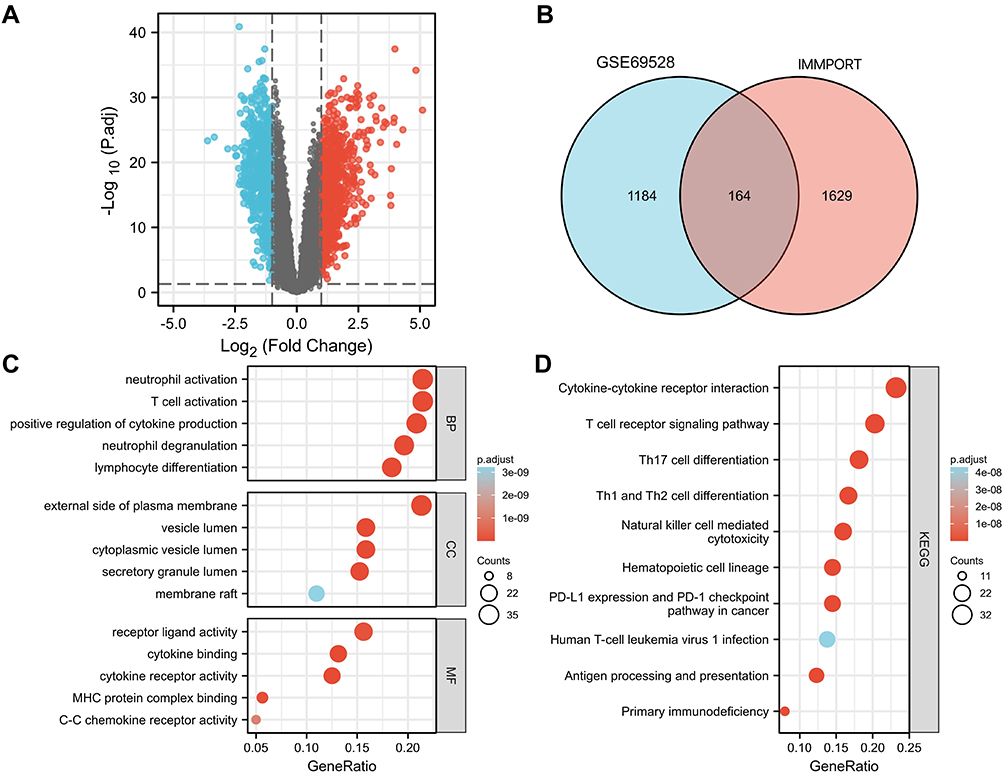 |
Figure 2 Identification and functional analysis of differentially expressed genes (A) volcano map, (B) Venn of GSE69528 and IMMPORT database, (C) BP, CC, MF analysis, (D) KEGG analysis). |
GO and KEGG Pathway Enrichment Analyses of IRDEGs
IRDEGs obtained in the previous step are used for GO and KEGG analysis. BP associated with GO terms were mainly enriched in T cell activation, neutrophil degranulation, neutrophil activation, lymphocyte differentiation. CC were primarily associated with vesicle lumen, external side of plasma membrane, cytoplasmic vesicle lumen, secretory granule lumen. MF were mainly involved in receptor-ligand activity, cytokine receptor activity, MHC protein complex binding (Figure 2C).
KEGG pathway enrichment analysis of IRDEGs was mainly enriched in T cell receptor signaling pathway, cytokine–cytokine receptor interaction, Th17 cell differentiation, natural killer cell mediated cytotoxicity, Th1 and Th2 cell differentiation and Primary immunodeficiency (Figure 2D).
Immune Infiltration Analysis
To estimate 22 immune cell types, we used the Cibersort R software package to reveal the infiltration of 22 immune cell subsets in sepsis by analyzing the GSE69528 dataset. The box plot of the immune cell difference showed that, compared with the control sample, innate immune cells (such as mast cells, macrophages and neutrophils) infiltrated more, while T cells (CD4, CD8), NK cells infiltrated less, as shown in Figure 3A. Figure 3B shows the patterns of 22 subpopulations of immune cells’ proportion in sepsis and control group. The heat map of immune cell infiltration between the septic group and the control group is shown in Figure 3C.
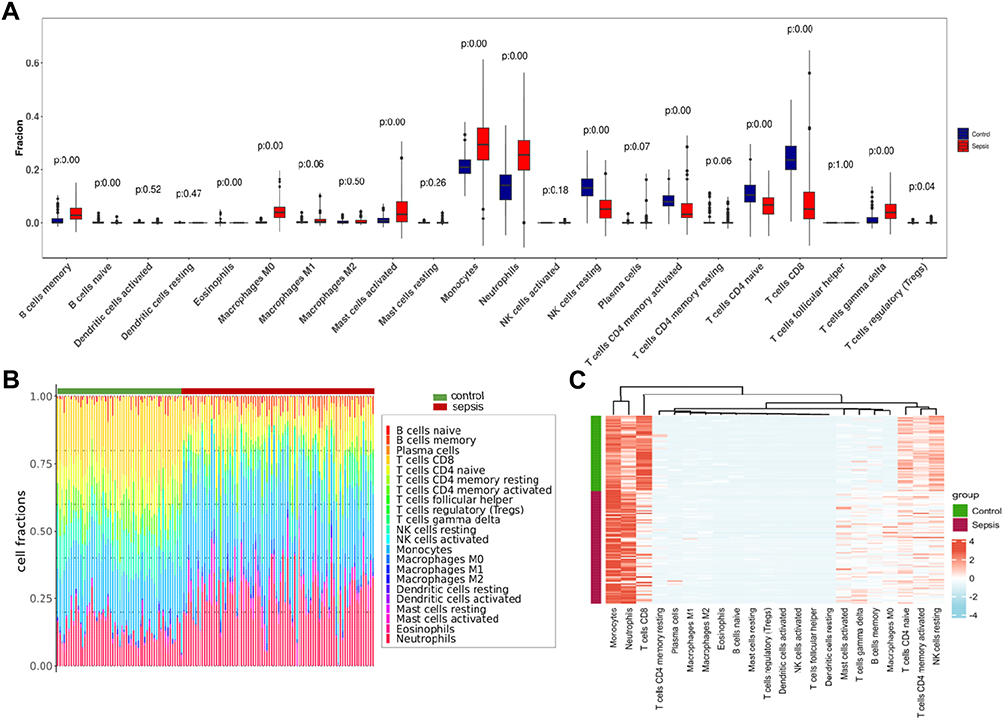 |
Figure 3 Immune infiltration analysis. (A) Proportional box plot of 22 kinds of infiltrating immune cells in the sample. (B) The proportion and distribution of infiltrating immune cells in different samples. (C) Proportional heat map of 22 kinds of infiltrating immune cells in the sample. |
To screen the most relevant genes of immune cells in sepsis group, the Pearson algorithm of R software was used to calculate the correlation between the content of immune cells and gene expression in the sepsis group samples. A total of 441 genes with a correlation coefficient greater than 0.7 were obtained, and a total of 27 common genes were obtained by further intersecting with IRGs and DEGs (Figure 4A).
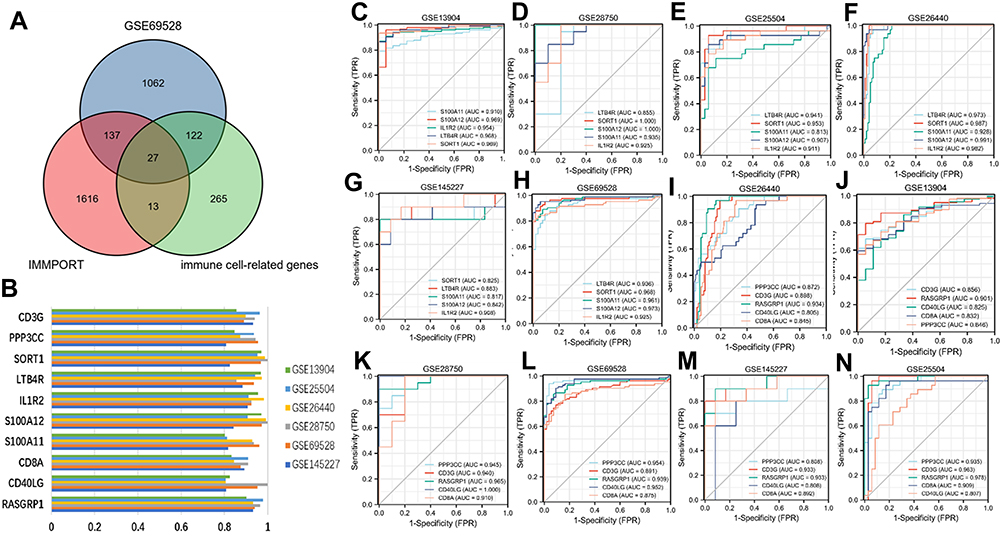 |
Figure 4 Identification of potential diagnostic genes for sepsis. (A) Venn diagram of GSE69528, IMMPORT database and immune infiltrating cell related genes. (B) AUC value histogram of 10 key genes in 6 datasets. (C–H) ROC values of up-regulated genes (IL1R2, LTB4R, S100A11, S100A12, SORT1). (I–N) ROC values of down regulated genes (RASGRP1, CD3G, CD40LG, CD8A, PPP3CC). |
Screening Key Genes According to the Diagnostic Value
To further screen the key genes with high diagnostic efficiency, we calculated the AUC values of 27 common genes in six datasets (GSE13904, GSE26440, GSE28750, GSE25504, GSE69528 and GSE145227). Finally, we identified ten genes with AUC values greater than 0.8 in six datasets and defined them as key genes (Figure 4B). Figure 4C–H shows the ROC curve of up-regulated genes (IL1R2, LTB4R, S100A11, S100A12 and SORT1); Figure 4I–N shows the ROC curve of down-regulated genes (RASGRP1, CD3G, CD40LG, CD8A and PPP3CC).
Subsequent Analysis of Key Genes: Expression, Regulation and Correlation with Immune Cells
In order to explore the expression in other data sets, upstream regulation mechanism and correlation with immune cells of these key genes, we made further analysis with R software. Among key genes, IL1R2, LTB4R, S100A11, S100A12 and SORT1 were up-regulated in sepsis, while RASGRP1, CD3G, CD40LG, CD8A and PPP3CC were down-regulated. Importantly, the differential expression patterns of these key genes were consistent in the above 6 datasets (Figure 5A). We studied TF-miRNA-mRNA interactions (Figure 5B) and detected central regulatory biomolecules (TFs and miRNAs) using topological parameters. Correlation analysis results show that there is a positive correlation between genes that are regulated in the same direction, and there is a significant negative correlation between up-regulated genes and down-regulated genes (Figure 5C). Correlation between key genes and immune infiltrating cells showed that the up-regulated genes were significantly positively correlated with macrophages, neutrophils and memory B cells, and negatively correlated with T cells (CD4/CD8) and NK cells, the results of down-regulated genes are just opposite to those of up-regulated genes (Figure 5D).
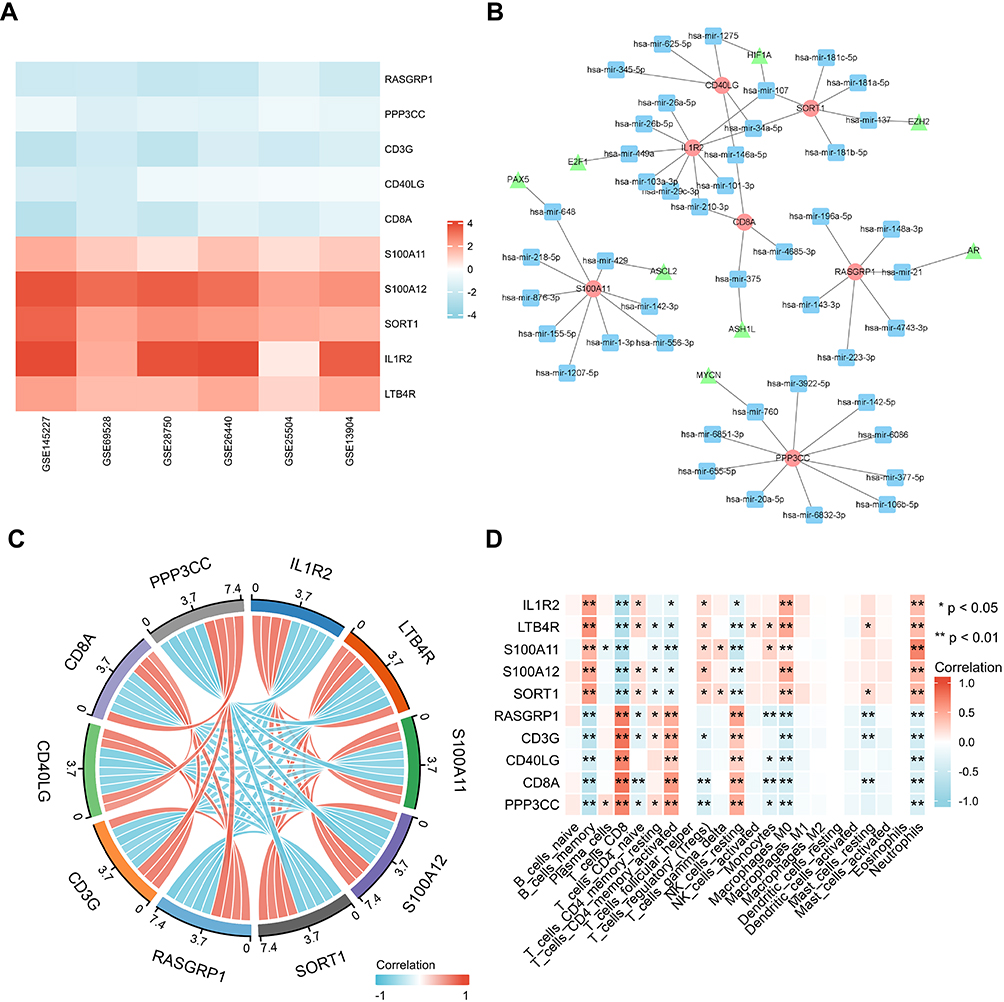 |
Figure 5 Expression and correlation analysis of 10 key genes. (A) Expression of 10 key genes in 6 datasets. (B) TF-miRNA-mRNA network construction (triangle: TF, square: miRNA, circle: mRNA). (C) Correlation analysis of 10 key genes. (D) Correlation between key genes and immune infiltrating cells, based on Pearson correlation analysis. Red nodes represent positive correlations, blue nodes represent negative correlations. *P < 0.05, **P < 0.01. |
Functional Enrichment in Key Genes
We used AmiGO database to confirm GO term enrichment for identified key genes involved in sepsis (Table 2). To analyze the association between key genes and disease and GO term enrichment for key genes, we used CTD and amigo database for further research. The CTD databases show that key genes are mainly targeted in inflammatory and immune-related diseases, including sepsis, acute kidney injury, acute lung injury and multiple organ dysfunction (Table 3).
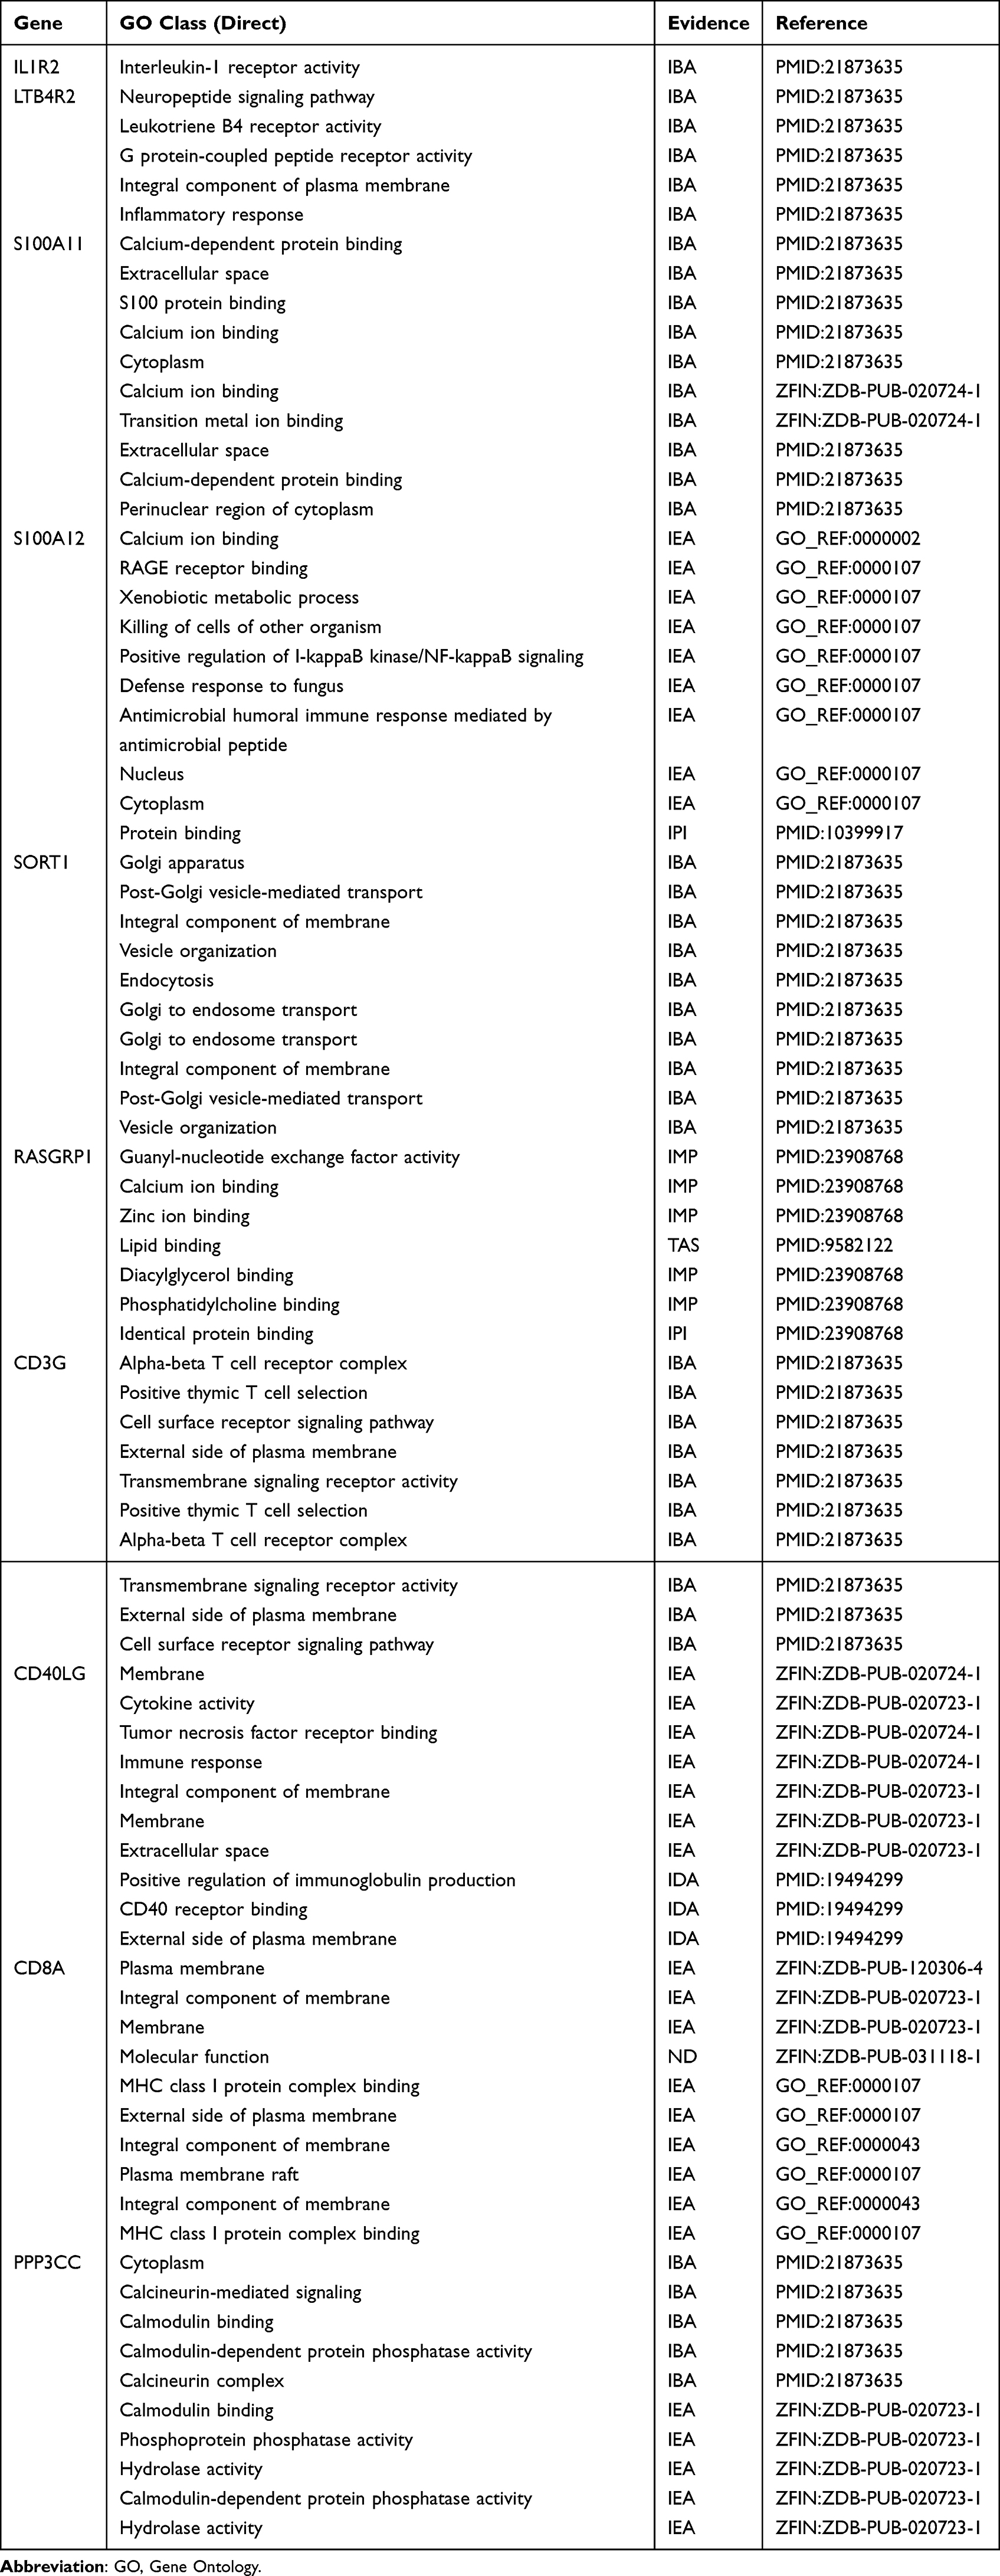 |
Table 2 Use the Amigo Database to Analyze the GO Terms of Keygenes |
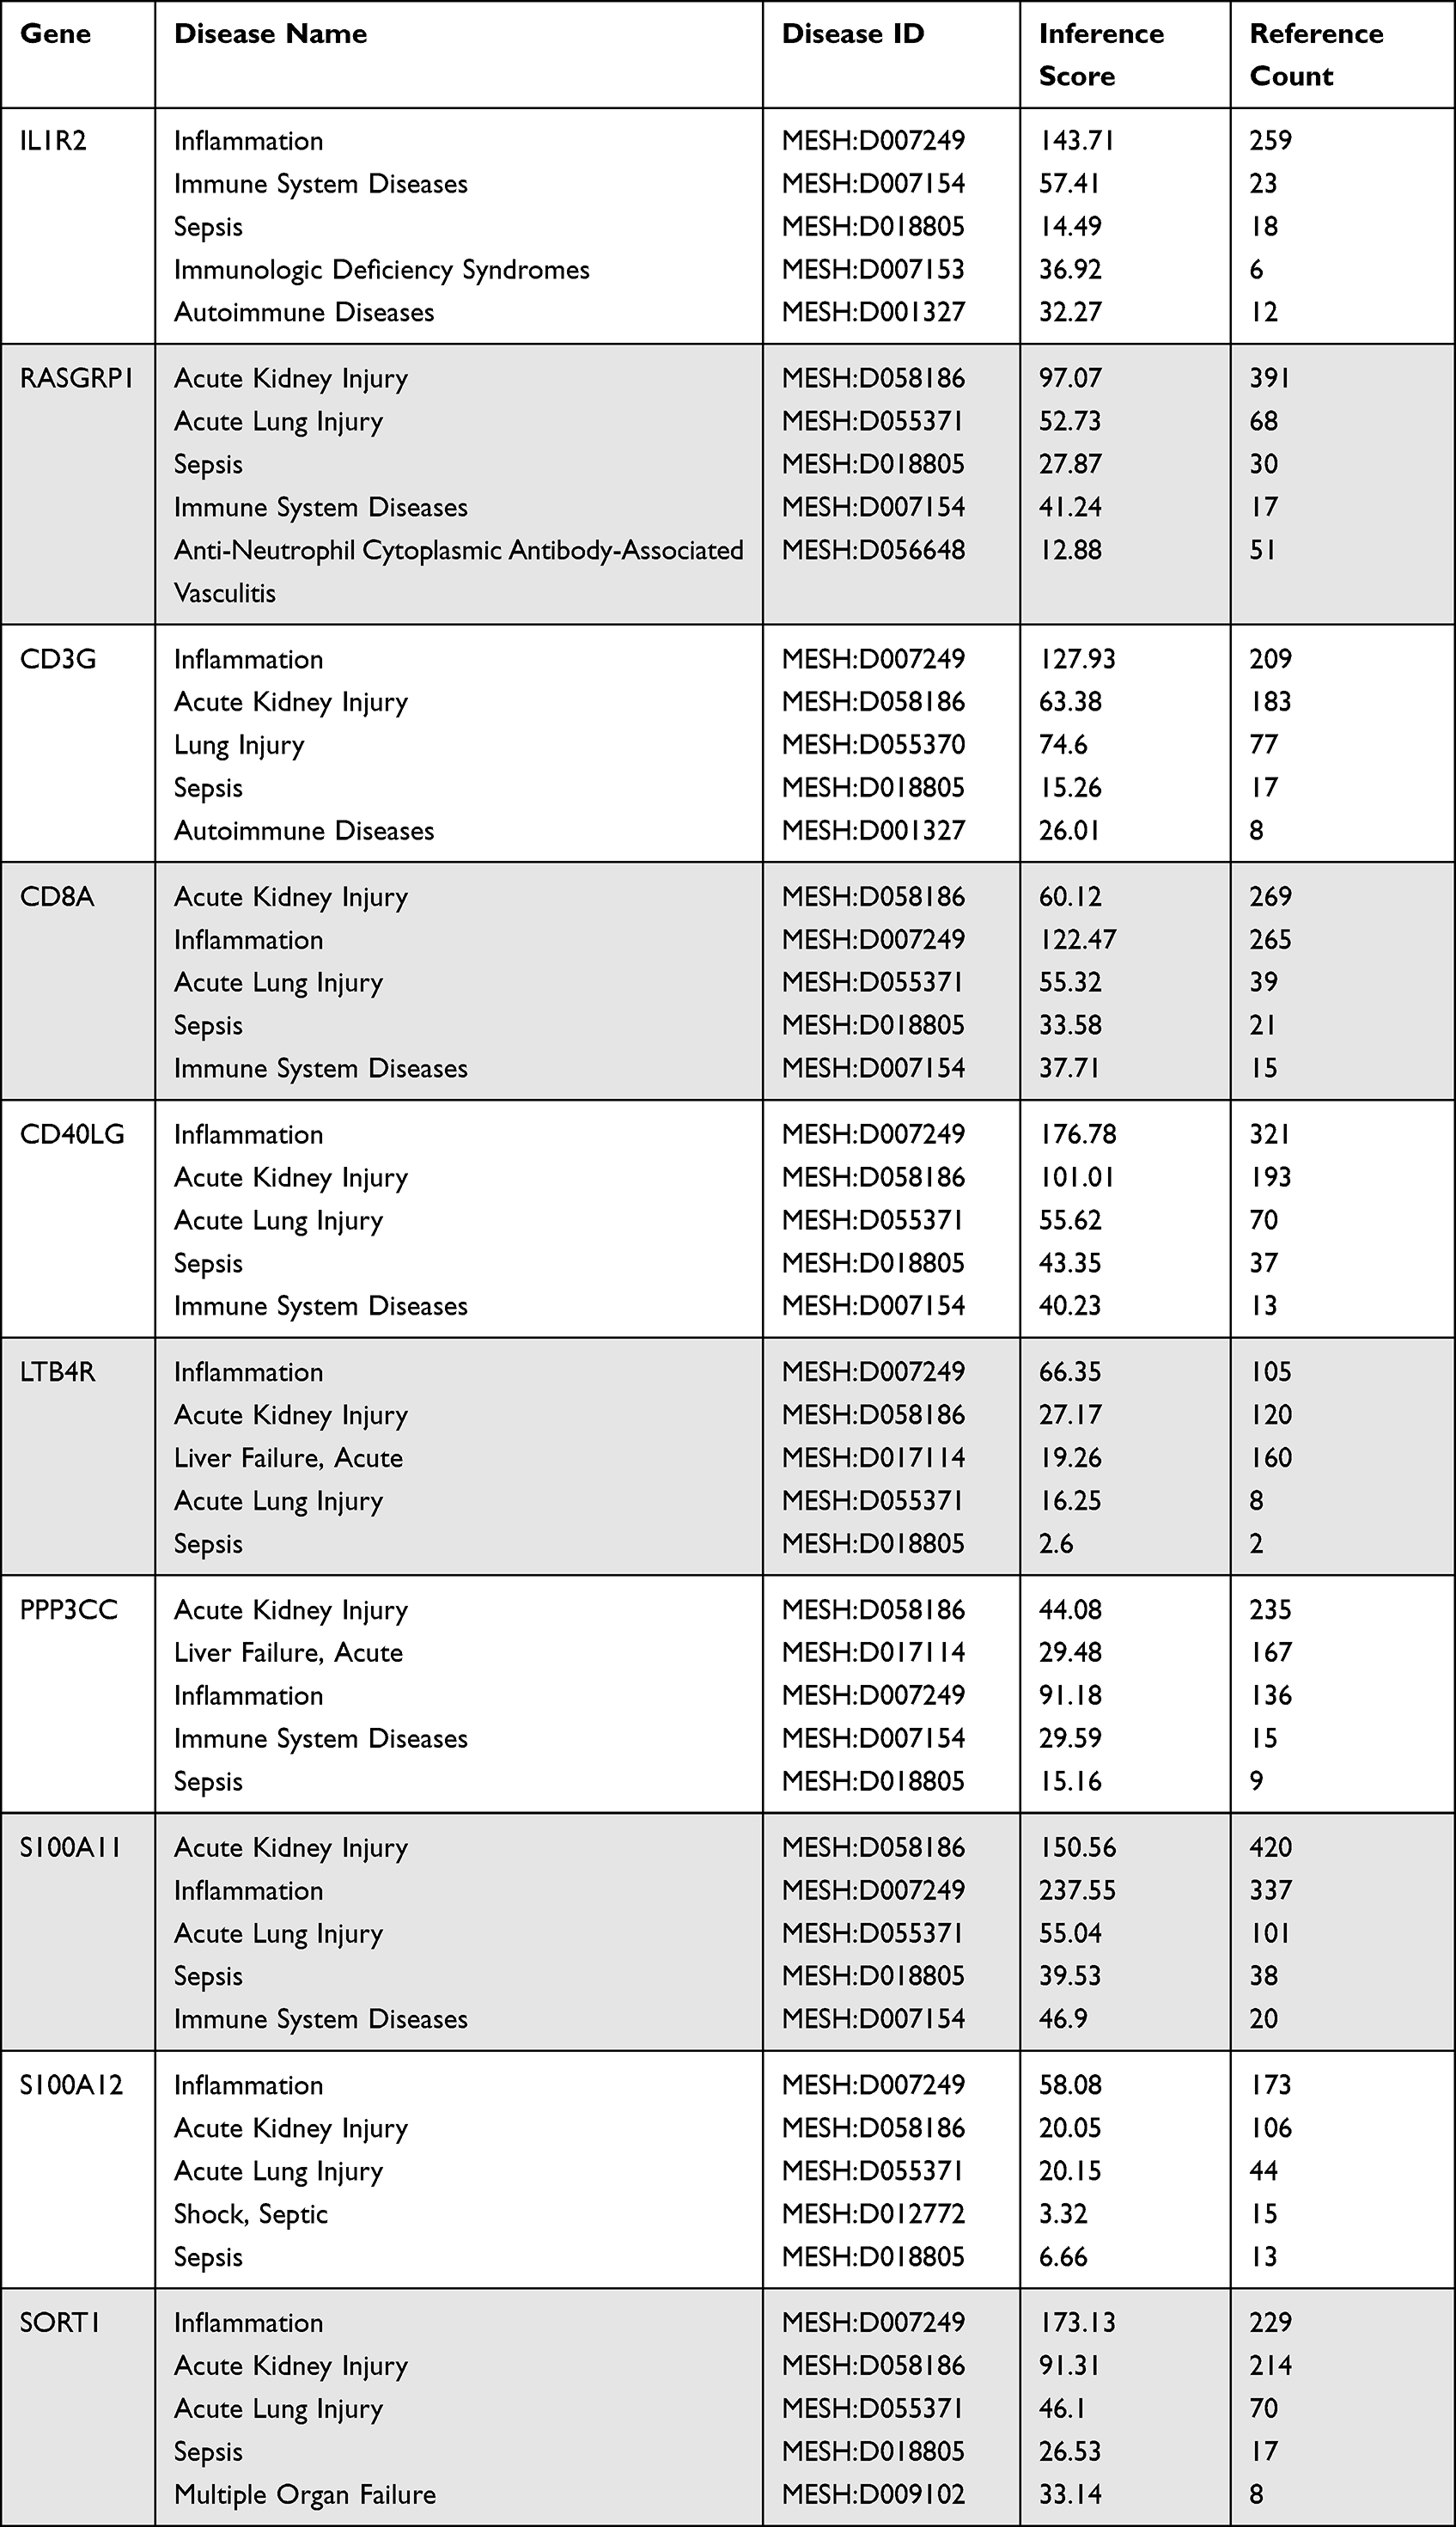 |
Table 3 Diseases Related to Key Gene Regulation |
Predictive Value of Key Genes in Sepsis Survival
To determine the predictive value of key genes for sepsis survival, we performed univariate and multivariate logistic regression analysis. Among key genes, univariate regression analysis showed that 6 genes (LTB4R, S100A11, SORT1, RASGRP1, CD3G and CD8A) expression were significantly associated with sepsis survival. Multivariate regression analysis showed that S100A11 was an independent prognostic factor for sepsis survival (Table 4).
 |
Table 4 Univariate and Multiple Regressive Analysis of Death for Sepsis |
In the comparison of survival and non-survival groups of sepsis, the expression of down-regulated genes (RASGRP1, CD3G and CD8A) were significantly decreased in the survival group; the expression of up-regulated genes (LTB4R, S100A11, SORT1) increased significantly in the survival group (Figure 6).
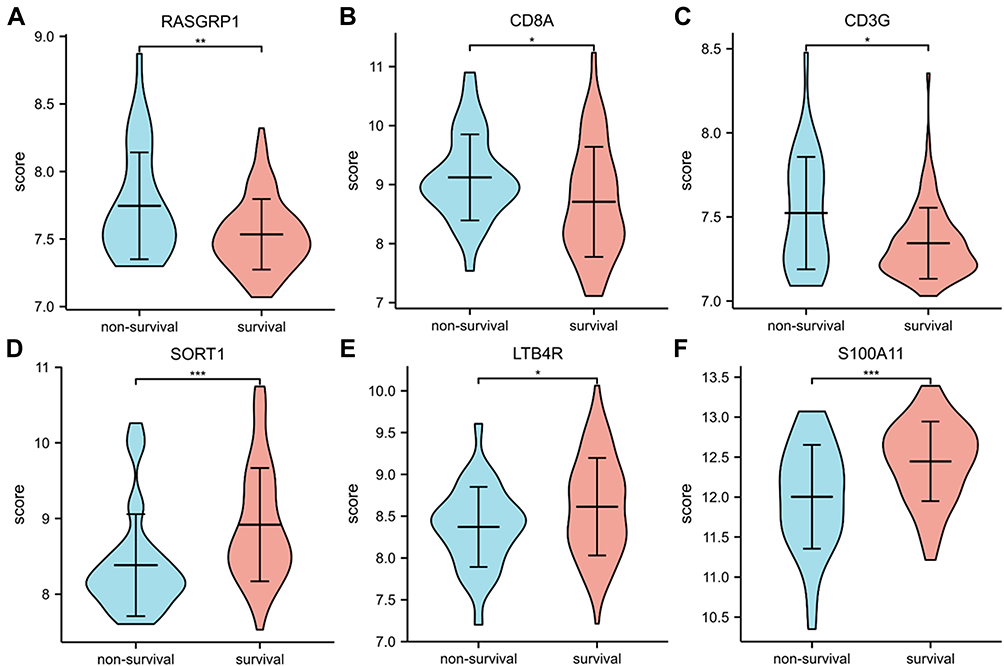 |
Figure 6 (A-F) Expression of RASGRP1, CD8A, CD3G, SORT1, LTB4R, S100A11, respectively. *P < 0.05, **P < 0.01, ***P < 0.001. |
Our results revealed that the 6 key genes expression levels are significantly associated with survival in sepsis. Most importantly, multivariate analysis showed that the S100A11 was an independent and favorable marker of prognosis in patients with sepsis. Therefore, the expression of S100A11 has the potential to predict the prognosis of patients with sepsis.
PCR Validation of Key Gene Expression Profiles
The expression of 10 key genes in sepsis patients (n = 6) and healthy controls (n = 6) was compared by real-time quantitative PCR. The results showed that compared with the control group, the expression of genes (RASGRP1, CD3G, CD40LG, CD8A and PPP3CC) was significantly down-regulated and genes (IL1R2, S100A12) was significantly up-regulated in patients with sepsis (P < 0.05; Figure 7). The expression results of these 7 key genes were consistent with the trend observed in microarray analysis.
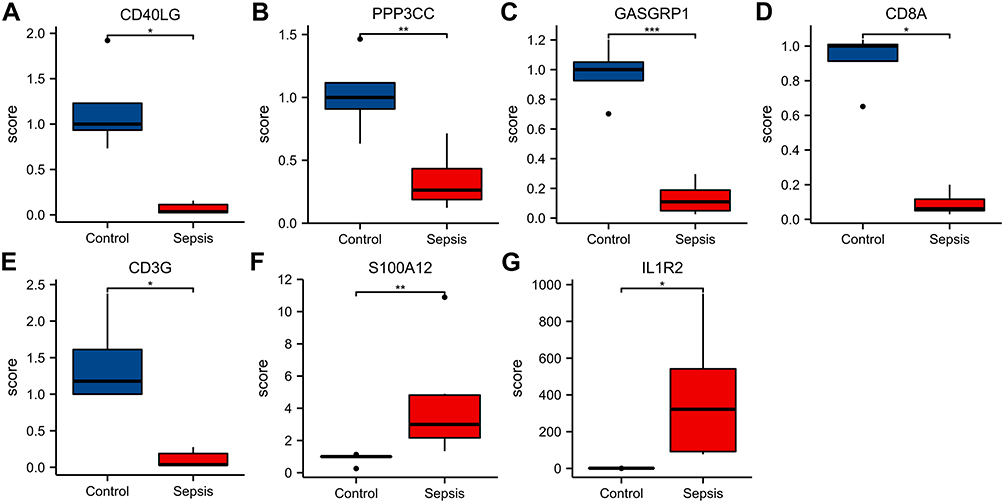 |
Figure 7 (A-G) Expression of CD40LG, PPP3CC, RASGRP1, CD8A, CD3G, S100A12 and IL1R2, respectively. Notes: *P < 0.05, **P < 0.01, ***P < 0.001. |
Discussion
Sepsis accounts for one-fifth of deaths worldwide, and the number of deaths from sepsis has doubled compared with estimates in previous years. Early diagnosis, prognostic evaluation and timely treatment of sepsis play an important role in reducing mortality. In essence, sepsis is a disorder of immune response caused by severe infection, but the specific mechanism is still not very clear. Despite years of research, the diagnosis and prediction of sepsis and septic shock still mainly rely on clinical criteria. Many biomarkers have been studied, none of which have the accuracy required for clinical practice.25 In this study, bioinformatic analysis of sepsis-related gene expression data was performed to explore the function of immune cell infiltration in sepsis and to identify molecules involved in causing immune dysregulation in sepsis to assist in the early diagnosis of sepsis and to predict sepsis prognosis. We found that in patients with sepsis, there was an increased infiltration of intrinsic immune cells and a significant decrease in adaptive immune cell infiltration. We identified 10 key genes with high diagnostic efficacy associated with the immune infiltration characteristics of sepsis, and six of these may be key genes affecting the prognosis of sepsis.
By intersecting immune-related and differentially expressed genes, we identified immune-related differential genes associated with sepsis. Enrichment analysis revealed that these immune-associated differential genes are mainly involved in inflammatory and immunometabolic responses. In our analysis, immune cell infiltration in septic patients showed significantly higher levels of infiltration of certain intrinsic immune cells (eg, macrophages, neutrophils, mast cells) and reduced levels of infiltration of T cells (CD4, CD8) and NK cells. This is similar to the results of previous studies.25 In the sepsis host, macrophages generate pro-inflammatory cytokines and chemokines which upregulate the inflammatory response and fight pathogens by generating a systemic inflammatory response in innate immune cells.26 Neutrophils can migrate rapidly from the bone marrow in early sepsis, and within a few hours, the number of neutrophils can be 10 times higher than normal.27 The number of circulating NK cells is significantly reduced in patients with sepsis, possibly due to increased apoptosis, and the results are associated with increased mortality.28 It has been found that reduced and dysfunctional NK cells are closely associated with sepsis-induced immunosuppression, leading to a greater susceptibility to infection and a poorer prognosis for patients.29,30 It is evident that these intrinsic immune cells play an important role in the regulation of inflammation in sepsis. On the other hand, sepsis increases apoptosis, which may lead to a decrease in the number of CD4 T cells,31 and significantly reduces the proliferative capacity of CD4 T cells.32 Also, sepsis-induced apoptosis reduces the number of naive and memory CD8 T cells.33,34 Condotta et al observed increased expression of co-suppressor molecules (eg, PD-1, LAG-3 and 2B4) and reduced release of effector cytokines (eg, IFN-γ, TNF-α and IL-2), suggesting that CD8 T cells are depleted in mice and sepsis patients.35–37 Overall, our findings are largely consistent with previous reports that sepsis leads to a significant reduction in CD4 and CD8 T cells, which is a major driver of impaired immune responses and reduced host antimicrobial capacity.38–40
We further identified 10 key genes (IL1R2, LTB4R, S100A11, S100A12, SORT1, RASGRP1, CD3G, CD40LG, CD8A and PPP3CC) with high diagnostic efficacy by AUC analysis, all of which had AUC values greater than 0.8 for the diagnosis of sepsis in six datasets, and therefore they may be early diagnostic markers for sepsis. Analysis of the correlation between these 10 key genes and immune infiltrating cells revealed that their differential expression was mainly associated with high levels of infiltration of macrophages and neutrophils and low levels of infiltration of T cells (CD4, CD8) and NK cells significantly. We speculate that upregulation of the key genes IL1R2, LTB4R, S100A11, S100A12, SORT1 and downregulation of the key genes RASGRP1, CD3G, CD40LG, CD8A and PPP3CC may play an important role in the enhancement of intrinsic immunity and suppression of adaptive immunity during the development of sepsis. Specifically, our PCR results showed that the expression levels of 7 key genes (IL1R2, S100A12, RASGRP1, CD3G, CD40LG, CD8A and PPP3CC) were consistent with the results of microarray analysis, while other three genes (LTB4R, S100A11, SORT1) were not significantly different. This inconsistency may be related to different assay methods, sample size, patient heterogeneity and disease duration. Later experiments with larger sample sizes are needed for validation.
The high mortality rate of sepsis has long plagued the world. Immunosuppression is now largely recognised as a major cause of sepsis-related death, with T-cell depletion being one of the most serious factors.5,41 Significant reductions in NK-cell numbers have also been associated with increased mortality.28 However, the exact mechanisms are not well understood. To further understand the association between key genes and the survival prognosis of sepsis, we used logistic regression analysis to identify 10 key genes, and the results suggested that six key genes (LTB4R, S100A11, SORT1, RASGRP1, CD3G and CD8A) might affect the survival prognosis of sepsis, among which S100A11 might be an independent prognostic factor for survival. These six key genes were significantly differentially expressed in the survival group compared to the non-survival group of sepsis, further suggesting that they may be prognostic markers of sepsis.
SA10012 is mainly expressed and secreted by neutrophils and is an important pro-inflammatory factor that plays an important role in microbial resistance, regulation of apoptosis and involvement in inflammatory and immune responses.42 It has been shown that S100A12 expression levels are significantly upregulated in neonatal septic rats and that it has a positive pro-inflammatory role in the inflammatory response, a role that is important in the development and progression of sepsis.42 Whereas S100A11 was mainly involved in the process of tumor development in previous studies, it is not clear whether it is associated with disease regulation in sepsis. We found that S100A11 expression was upregulated in septic patients and independently affected the prognosis of septic patients, the mechanism of which needs further investigation. RASGRP1 is a key signaling molecule essential for lymphocyte function. Immunologically, RASGRP1 deficiency is characterized by reduced CD4 and CD8 T-cell lymphocytes and impaired proliferation, as well as impaired B-cell development and proliferation, and abnormal NK cytotoxic function.43,44 RASGRP1-deficient mice have shown significant T-cell lymphopenia and immunodeficiency45 and are more susceptible than wild-type mice to sepsis infections caused by cecum ligation and puncture.46 Similarly, we found reduced levels of RASGRP1 expression in sepsis patients, suggesting that impaired immunity in sepsis patients may be associated with low RASGRP1 expression. Therefore, we speculate that RASGRP1 may play a very critical role in the development of sepsis. LTB4R is the receptor for LTB 4, which induces the recruitment of CD4 and CD8 effector T cells as well as helper T cells to inflammatory tissues,47,48 and the recruited immune cells will promote inflammation by secreting cytokines and chemokines. Sort1 may participate in innate immunity by regulating inflammation and phagocytosis, as well as participating in adaptive immunity by controlling the maturation of immune cells and regulating the activation of T cells and NK cells.49 CD3G is involved in the formation of T cell receptor CD3 complex and is an important regulator of T cell development and differentiation.50 Its defects are related to T cell immunodeficiency.51 CD8A is primarily involved in cell-mediated immune defence and T cell development.52,53 The role of these key genes in sepsis is rarely studied, but the results of our analysis suggest that they may contribute to the early diagnosis and prognostic assessment of sepsis.
Our research also has some limitations. First of all, because our research is based on multiple public datasets, the course of sepsis may be inconsistent. Secondly, due to the small sample size and short study time, there is a lack of patient data, such as blood culture results and mortality. We will increase sample size, extend research time, and add more patient data in subsequent research.
Conclusions
In conclusion, we identified ten key genes (IL1R2, LTB4R, S100A11, S100A12, SORT1, RASGRP1, CD3G, CD40LG, CD8A and PPP3CC) as potential diagnostic biomarkers of sepsis. Six key genes (LTB4R, S100A11, SORT1, RASGRP1, CD3G and CD8A) might affect the survival prognosis of sepsis, among which S100A11 might be an independent prognostic biomarker for survival. These genes may aid in the early diagnosis and assessment of sepsis, and could serve as interesting targets for further in-depth research.
Funding
This study was supported by the Basic Science and Cutting-edge Technology Research Projects of Chongqing Science and Technology Commission (N.O. cstc2019jcyj-msxmX0848 and N.O. cstc2020jcyj-msxmX0336).
Disclosure
The authors report no conflicts of interest in this work.
References
1. Hotchkiss RS, Moldawer LL, Opal SM, Reinhart K, Turnbull IR, Vincent JL. Sepsis and septic shock. Nat Rev Dis Primers. 2016;2:16045. doi:10.1038/nrdp.2016.45
2. Rudd KE, Johnson SC, Agesa KM, et al. Global, regional, and national sepsis incidence and mortality, 1990–2017: analysis for the Global Burden of Disease Study. Lancet. 2020;395(10219):200–211. doi:10.1016/S0140-6736(19)32989-7
3. Singer M, Deutschman CS, Seymour CW, et al. The third international consensus definitions for sepsis and septic shock (Sepsis-3). JAMA. 2016;315(8):801–810. doi:10.1001/jama.2016.0287
4. van der PT, van de VFL, Scicluna BP, Netea MG. The immunopathology of sepsis and potential therapeutic targets. Nat Rev Immunol. 2017;17(7):407–420. doi:10.1038/nri.2017.36
5. Patil NK, Bohannon JK, Sherwood ER. Immunotherapy: a promising approach to reverse sepsis-induced immunosuppression. Pharmacol Res. 2016;111:688–702. doi:10.1016/j.phrs.2016.07.019
6. Venet F, Bohe J, Debard AL, Bienvenu J, Lepape A, Monneret G. Both percentage of γδ T lymphocytes and CD3 expression are reduced during septic shock. Crit Care Med. 2005;33(12):2836–2840. doi:10.1097/01.CCM.0000189745.66585.AE
7. Hotchkiss RS, Swanson PE, Freeman BD, et al. Apoptotic cell death in patients with sepsis, shock, and multiple organ dysfunction. Crit Care Med. 1999;27(7):1230–1251. doi:10.1097/00003246-199907000-00002
8. Voll RE, Herrmann M, Roth EA, Stach C, Kalden JR, Girkontaite I. Immunosuppressive effects of apoptotic cells. Nature. 1997;390(6658):350–351. doi:10.1038/37022
9. Coburn B, Morris AM, Tomlinson G, Detsky AS. Does this adult patient with suspected bacteremia require blood cultures? JAMA. 2012;308(5):502–511. doi:10.1001/jama.2012.8262
10. Sinha M, Jupe J, Mack H, Coleman TP, Lawrence SM, Fraley SI. Emerging technologies for molecular diagnosis of sepsis. Clin Microbiol Rev. 2018;31(2):e00089–17. doi:10.1128/CMR.00089-17
11. Miller RR 3rd, Lopansri BK, Burke JP, et al. Validation of a host response assay, septicyte lab, for discriminating sepsis from systemic inflammatory response syndrome in the ICU. Am J Respir Crit Care Med. 2018;198(7):903–913. doi:10.1164/rccm.201712-2472OC
12. Barrett T, Wilhite SE, Ledoux P, et al. NCBI GEO: archive for functional genomics data sets–update. Nucleic Acids Res. 2013;41(D1):D991–5. doi:10.1093/nar/gks1193
13. Ritchie ME, Phipson B, Wu D, et al. limma powers differential expression analyses for RNA-sequencing and microarray studies. Nucleic Acids Res. 2015;43(7):e47. doi:10.1093/nar/gkv007
14. Ginestet C. ggplot2: elegant graphics for data analysis. J R Stat Soc Ser A Stat Soc. 2011;174(1):245. doi:10.1111/j.1467-985X.2010.00676_9.x
15. Newman AM, Liu CL, Green MR, et al. Robust enumeration of cell subsets from tissue expression profiles[J]. Nat Methods. 2015;12(5):453–457. doi:10.1038/nmeth.3337
16. Robin X, Turck N, Hainard A, et al. pROC: an open-source package for R and S+ to analyze and compare ROC curves. BMC Bioinform. 2011;12(1):77. doi:10.1186/1471-2105-12-77
17. Sethupathy P, Corda B, Hatzigeorgiou AG. TarBase: a comprehensive database of experimentally supported animal microRNA targets TarBase: a comprehensive database of experimentally supported animal microRNA targets. RNA. 2006;12(2):192–197. doi:10.1261/rna.2239606
18. Da Hsu S, Lin FM, Wu WY, et al. MiRTarBase: a database curates experimentally validated microRNA-target interactions. Nucleic Acids Res. 2011;39(suppl_1):163–169. doi:10.1093/nar/gkq1107
19. Khan A, Fornes O, Stigliani A, et al. JASPAR 2018: update of the open-access database of transcription factor binding profiles and its web framework. Nucleic Acids Res. 2018;46(D1):D260–D266. doi:10.1093/nar/gkx1126
20. Xia J, Gill EE, Hancock REW. NetworkAnalyst for statistical, visual and network-based meta-analysis of gene expression data. Nat Protoc. 2015;10(6):823–844. doi:10.1038/nprot.2015.052
21. Kohl M, Wiese S, Warscheid B. Cytoscape: software for visualization and analysis of biological networks. Methods Mol Biol. 2011;696:291–303.
22. Davis AP, Grondin CJ, Johnson RJ, et al. The comparative toxicogenomics database: update 2017. Nucleic Acids Res. 2017;45(D1):D972–8. doi:10.1093/nar/gkw838
23. Carbon S, Ireland A, Mungall CJ, Shu S, Marshall B, Lewis S. AmiGO: online access to ontology and annotation data. Bioinformatics. 2009;25(2):288–289. doi:10.1093/bioinformatics/btn615
24. Fernando SM, Rochwerg B, Seely AJ. Clinical implications of the third international consensus definitions for sepsis and septic shock (Sepsis-3). CMAJ. 2018;190(36):E1058–9. doi:10.1503/cmaj.170149
25. Coopersmith CM, De Backer D, Deutschman CS, et al. Surviving sepsis campaign: research priorities for sepsis and septic shock. Intensive Care Med. 2018;44(9):1400–1426. doi:10.1007/s00134-018-5175-z
26. Vachharajani V, McCall CE. Epigenetic and metabolic programming of innate immunity in sepsis. Innate Immun. 2019;25(5):267–279. doi:10.1177/1753425919842320
27. Manz MG, Boettcher S. Emergency granulopoiesis. Nat Rev Immunol. 2014;14(5):302. doi:10.1038/nri3660
28. Jensen IJ, Winborn CS, Fosdick MG, et al. Polymicrobial sepsis influences NK-cell-mediated immunity by diminishing NK-cell-intrinsic receptor-mediated effector responses to viral ligands or infections. PLoS Pathog. 2018;14(10):e1007405. doi:10.1371/journal.ppat.1007405
29. Demirkol D, Kavgaci U, Babaoglu B, Tanju S, Oflaz Sozmen B, Tekin S. Cytomegalovirus reactivation in a critically ill patient: a case report. J Med Case Rep. 2018;12(1):163. doi:10.1186/s13256-018-1681-4
30. Cook CH, Trgovcich J. Cytomegalovirus reactivation in critically ill immunocompetent hosts: a decade of progress and remaining challenges. Antiviral Res. 2011;90(3):151–159. doi:10.1016/j.antiviral.2011.03.179
31. Boomer JS, To K, Chang KC, et al. Immunosuppression in patients who die of sepsis and multiple organ failure. JAMA. 2011;306(23):2594–2605. doi:10.1001/jama.2011.1829
32. Cabrera-Perez J, Condotta SA, James BR, et al. Alterations in antigen-specific naive CD4 T cell precursors after sepsis impairs their responsiveness to pathogen challenge. J Immunol. 2015;194(4):1609–1620. doi:10.4049/jimmunol.1401711
33. Hotchkiss RS, Osmon SB, Chang KC, Wagner TH, Coopersmith CM, Karl IE. Accelerated lymphocyte death in sepsis occurs by both the death receptor and mitochondrial pathways. J Immunol. 2005;174(8):5110–5118. doi:10.4049/jimmunol.174.8.5110
34. Weber SU, Schewe JC, Lehmann LE, et al. Induction of Bim and Bid gene expression during accelerated apoptosis in severe sepsis. Crit Care. 2008;12(5):R128. doi:10.1186/cc7088
35. Condotta SA, Khan SH, Rai D, Griffith TS, Badovinac VP. Polymicrobial sepsis increases susceptibility to chronic viral infection and exacerbates CD8 +T cell exhaustion. J Immunol. 2015;195(1):116–125. doi:10.4049/jimmunol.1402473
36. Xie J, Crepeau RL, Chen CW, et al. Sepsis erodes CD8(+) memory T cell-protective immunity against an EBV homolog in a 2B4-dependent manner. J Leukoc Biol. 2019;105:565–575. doi:10.1002/JLB.4A0718-292R
37. Condotta SA, Rai D, James BR, Griffith TS, Badovinac VP. Sustained and incomplete recovery of naive CD8+ T cell precursors after sepsis contributes to impaired CD8+ T cell responses to infection. J Immunol. 2013;190:1991–2000. doi:10.4049/jimmunol.1202379
38. Hotchkiss RS, Tinsley KW, Swanson PE, et al. Sepsis-induced apoptosis causes progressive profound depletion of B and CD4+ T lymphocytes in humans. J Immunol. 2001;166(11):6952–6963. doi:10.4049/jimmunol.166.11.6952
39. Unsinger J, McDonough JS, Shultz LD, Ferguson TA, Hotchkiss RS. Sepsis-induced human lymphocyte apoptosis and cytokine production in“humanized”. Mice J Leukoc Biol. 2009;86(2):219–227. doi:10.1189/jlb.1008615
40. Hotchkiss RS, Monneret G, Payen D. Immunosuppression in sepsis: a novel understanding of the disorder and a new therapeutic approach. Lancet Infect Dis. 2013;13(3):260–268. doi:10.1016/S1473-3099(13)70001-X
41. Jensen IJ, Sjaastad FV, Griffith TS, Badovinac VP. Sepsis-induced T cell immunoparalysis: the ins and outs of impaired T cell immunity. J Immunol. 2018;200(5):1543–1553. doi:10.4049/jimmunol.1701618
42. Enerback C, Shubbar E, Petersson S. Expression of S100 proteins in the progression of melanocytic lesions[J]. Eur J Cancer Suppl. 2008;6(9):133. doi:10.1016/S1359-6349(08)71686-0
43. Salzer E, Cagdas D, Hons M, et al. RASGRP1 deficiency causes immunodeficiency with impaired cytoskeletal dynamics. Nat Immunol. 2016;17(12):1352–1360. doi:10.1038/ni.3575
44. Platt CD, Fried AJ, Hoyos-Bachiloglu R, et al. Combined immunodeficiency with EBV positive B cell lymphoma and epidermodysplasia verruciformis due to a novel homozygous mutation in RASGRP1. Clin Immunol. 2017;183:142–144. doi:10.1016/j.clim.2017.08.007
45. Dower NA, Stang SL, Bottorff DA, et al. RasGRP is essential for mouse thymocyte differentiation and TCR signaling. Nat Immunol. 2000;1(4):317–321. doi:10.1038/79766
46. Guo B, Ludlow AV, Brightwell AS, et al. Impairment of PD-L2 positive b1a cells enhances susceptibility to sepsis in RasGRP1-deficient mice. Cell Immunol. 2019;346:103993. doi:10.1016/j.cellimm.2019.103993
47. Goodarzi K, Goodarzi M, Tager AM, Luster AD, von Andrian UH. Leukotriene B4 and BLT1 control cytotoxic effector T cell recruitment to inflamed tissues. Nat Immunol. 2003;4(10):965–973. doi:10.1038/ni972
48. Tager AM, Bromley SK, Medoff BD, et al. Leukotriene B4 receptor BLT1 mediates early effector T cell recruitment. Nat Immunol. 2003;4(10):982–990. doi:10.1038/ni970
49. Talbot H, Saada S, Naves T, et al. Regulatory roles of Sortilin and SorLA in immune-related processes[J]. Front Pharmacol;2019. 9. doi:10.3389/fphar.2019.00009
50. Flanagan BF, Wotton D, Tuck-Wah S, et al. DNase hypersensitivity and methylation of the human CD3G and D genes during T-cell development. Immunogenetics. 1990;31(1):13–20. doi:10.1007/BF00702484
51. Alain F, Geneviève DSB, Franoise LD. CD3 Deficiencies. Curr Opin Allergy Clin Immunol. 2005;5(6):491–495. doi:10.1097/01.all.0000191886.12645.79
52. Tregaskes CA, Kong FK, Paramithiotis E, et al. Identification and analysis of the expression of CD8 alpha beta and CD8 alpha alpha isoforms in chickens reveals a major TCR-gamma delta CD8 alpha beta subset of intestinal intraepithelial lymphocytes. J Immunol. 1995;154(9):4485–4494.
53. Xu Q, Chen Y, Zhao WM, et al. DNA methylation and regulation of the CD8A after duck hepatitis virus type 1 infection. PLoS One. 2014;9(2):e88023. doi:10.1371/journal.pone.0088023
 © 2022 The Author(s). This work is published and licensed by Dove Medical Press Limited. The full terms of this license are available at https://www.dovepress.com/terms.php and incorporate the Creative Commons Attribution - Non Commercial (unported, v3.0) License.
By accessing the work you hereby accept the Terms. Non-commercial uses of the work are permitted without any further permission from Dove Medical Press Limited, provided the work is properly attributed. For permission for commercial use of this work, please see paragraphs 4.2 and 5 of our Terms.
© 2022 The Author(s). This work is published and licensed by Dove Medical Press Limited. The full terms of this license are available at https://www.dovepress.com/terms.php and incorporate the Creative Commons Attribution - Non Commercial (unported, v3.0) License.
By accessing the work you hereby accept the Terms. Non-commercial uses of the work are permitted without any further permission from Dove Medical Press Limited, provided the work is properly attributed. For permission for commercial use of this work, please see paragraphs 4.2 and 5 of our Terms.