")
Back to Journals » Infection and Drug Resistance » Volume 11
Identifying differentially expressed long non-coding RNAs in PBMCs in response to the infection of multidrug-resistant tuberculosis
Authors Yan H, Xu R, Zhang XR, Wang Q, Pang J, Zhang X, Chang X, Zhang Y
Received 16 October 2017
Accepted for publication 30 April 2018
Published 13 July 2018 Volume 2018:11 Pages 945—959
DOI https://doi.org/10.2147/IDR.S154255
Checked for plagiarism Yes
Review by Single anonymous peer review
Peer reviewer comments 2
Editor who approved publication: Dr Joachim Wink
Hong Yan,1,* Rufeng Xu,2,* Xiangrong Zhang,3 Qian Wang,1 Jing Pang,2 Xia Zhang,3 Xiaoai Chang,2 Yaqin Zhang2
1Department of Laboratory Medicine, Nanjing Chest Hospital, Nanjing 210029, China; 2Department of Biochemistry and Molecular Biology, Key Laboratory of Human Functional Genomics of Jiangsu Province, Nanjing Medical University, Nanjing, Jiangsu 210029, China; 3Nanjing Public Health Clinical Center, Nanjing, Jiangsu 211133,China
*These authors contributed equally to this work
Purpose: The aim of this paper was to identify differentially expressed long non-coding RNAs (lncRNAs) in peripheral blood mononuclear cells (PBMCs) influenced by the infection of multidrug-resistant tuberculosis (MDR-TB).
Materials and methods: IncRNA and mRNA expression profiles in PBMCs derived from healthy controls (HCs) and individuals with MDR-TB and drug-sensitive tuberculosis (DS-TB) were analyzed and compared by microarray assay. Six lncRNAs were randomly selected for validation by using real-time quantitative polymerase chain reaction (RT-qPCR). The biological functions and signaling pathways affected by the differentially expressed mRNAs were investigated by using Gene Ontology (GO) and Kyoto Encyclopedia of Genes and Genomes (KEGG) pathway-based approaches.
Results: Compared with the HC group, 1,429 lncRNAs (983 mRNAs) and 2,040 lncRNAs (1,407 mRNAs) were identified to be deregulated in the MDR-TB group and in the DS-TB group, respectively, and 1,511 lncRNAs and 1,047 mRNAs were identified to be differentially expressed in both MDR-TB and DS-TB groups. Between the three groups, 22 lncRNAs and 38 mRNAs were found deregulated. Most deregulated lncRNAs were from intergenic regions (~55% of the total), natural antisense to protein-coding loci (~32% of the total), or intronic antisense to protein-coding loci (~5% of the total). Significantly enriched signaling pathways regulated by the deregulated mRNAs were mainly associated with natural killer cell-mediated cytotoxicity, antigen processing and presentation, graft-vs-host disease, the transforming growth factor-β signaling pathway, and the Hippo signaling pathway.
Conclusion: This study is the first to report differentially expressed lncRNAs in PBMCs in response to MDR-TB infection. It revealed that some lncRNAs might be associated with regulating host immune response to MDR-TB infection. Further elucidation of the potential of these deregulated lncRNAs in MDR-TB and its reactivation requires further study.
Keywords: mycobacterium tuberculosis, MDR, molecular characterization, lncRNA, infection
Introduction
Efforts to control tuberculosis (TB), caused by infection with Mycobacterium tuberculosis (Mtb), have been impaired by the emergence of multidrug-resistant strains and HIV epidemic.1 Multidrug-resistant tuberculosis (MDR-TB) is a disease caused by Mtb strains with resistance to both isoniazid (INH) and rifampin (RIF), the two first-line anti-TB drugs, in vitro.2 In 2013, the World Health Organization reported 9 million newly diagnosed cases of TB and 1.5 million TB-related deaths worldwide.3 Moreover, there were 480,000 newly diagnosed cases of MDR-TB and 210,000 deaths related to MDR-TB.4 MDR-TB is estimated to comprise 3.5% of newly diagnosed cases of TB and 20.5% of previously treated cases of TB. In China, the rate of MDR-TB is estimated at 11.6% and 35.9% for new and previously treated cases of TB, respectively.5 These rates are significantly higher than the global average. Whereas 90% of patients with drug-sensitive TB (DS-TB) were cured, only 48% of patients with MDR-TB were reported to be successfully treated.3 Hence, MDR-TB has complicated the prevention and treatment of TB, causing the widespread of TB.
Previous studies have suggested that complex MDR mechanisms involve multiple genes and various mechanisms at the tissue, cellular, and molecular levels.6,7 As transcription regulating factors, noncoding RNAs have been found to regulate protein-coding gene expression at the transcriptional and post-transcriptional levels. Noncoding RNAs are divided into two major classes based on their length: short (<200 nucleotides) and long (>200 nucleotides). The roles of microRNAs (miRNAs), a large group of short noncoding RNA, have been well studied.8,9 However, concerning their functions, long noncoding RNAs (lncRNAs) are much less well known than miRNAs, and recent evidence indicates that lncRNAs are key players in many physiological and pathological processes, namely cell differentiation, apoptosis, proliferation, and cancer.10 For example, aberrantly expressed lncRNAs in T-cells are involved in HIV and Helicobacter pylori infection.11,12 Furthermore, lncRNAs have also been reported to modulate the development of MDR in gastric cancer cells13 and colorectal cancer cells.14 However, there are very few studies that assess the role of lncRNAs in MDR-TB.
In this study, expression profiles of both lncRNAs and mRNAs in peripheral blood mononuclear cells (PBMCs) from patients with MDR-TB, patients with DS-TB, or healthy controls (HCs) were first detected to investigate whether lncRNAs were involved in MDR-TB pathogenesis. Then the relationship between deregulated lncRNAs, their adjacent protein-coding genes, and deregulated mRNAs related to signaling pathways was analyzed. Finally, our study proposes potential molecules for the onset of MDR-TB and provides a new experimental basis to understand the pathogenesis of MDR-TB.
Materials and methods
Ethical statement
This study has been approved by the institutional ethics committee of Nanjing Medical University. Written informed consent was obtained from all participants before the study commenced. Each recruited patient completed a questionnaire including personal information, sociodemographic characteristics, and previous treatment history.
Specimen collection and examination
From January 2015 to May 2016, TB suspects who had cough, expectoration, or hemoptysis for more than 2 weeks continuously were enrolled in the Nanjing Chest Hospital in Nanjing, China. Each patient was asked to give three sputum samples comprising one spot, one morning, and one night sputum for laboratory examination. Then, all sputum specimens were submitted to the laboratory for smear microscopy to obtain the positive TB isolates.
Drug-susceptibility testing (DST)
DST was performed by using the proportional method with an L/J medium. Cultures obtained on the L/J medium were collected and then tested for phenotypic DST to INH and RIF. The critical drug concentrations were 0.2 µg/mL for INH and 40 µg/mL for RIF. The strain was declared resistant to the corresponding drug when the growth rate was 1% higher than the drug-free control. Strains resistant to INH and RIF were defined as MDR-TB.15
Collection of peripheral blood samples
Peripheral blood samples (3 mL each) were collected from 20 patients with MDR-TB, 30 patients with DS-TB, and 50 healthy donors. At the time of the analysis, all patients had primary TB and were not undergoing anti-TB treatment. Clinical signs of TB or latent TB infection was not found in HCs. Note that we excluded individuals who had allergic diseases, immune-compromised conditions, diabetes, cancer, diabetes, or infectious diseases such as HIV, hepatitis C virus, or hepatitis B virus. PBMCs were isolated after sample collection was completed according to the measured density gradient centrifugation using Hypaque-Ficoll (GE Healthcare Bio-Sciences AB, Uppsala, Sweden). The PBMC samples were then lysed with TRIzol reagent (Thermo Fisher Scientific, Waltham, MA, USA) and incubated in a temperature-controlled chamber at −80°C.
RNA isolation
Total RNA was extracted from purified PBMCs by using TRIzol reagent and subsequently purified with an RNeasy mini kit (Qiagen NV, Venlo, the Netherlands). The quantity and purity of the isolated RNA were assessed on a NanoDrop Spectrophotometer ND-1000 (NanoDrop Technologies, Wilmington, DE, USA). The integrity of the RNA was determined using denaturing gel electrophoresis. Only samples with OD260/OD280 ratios between 1.8 and 2.1 and OD260/OD230 ratios >1.8 were accepted for spectrophotometer analysis. Prior to electrophoresis analysis, samples were prepared without any genomic DNA contamination, and the ratios of 28S/18S band intensities were maintained at values >2.0.
Microarray analysis of lncRNA and mRNA expression
Arraystar Human LncRNA Array V3.0 was used to profile expression of lncRNAs, which was performed by KangChen Bio-tech (Shanghai, China). The experimental procedure was consistent with a previous study.16 Briefly, RNA samples from PBMCs were further purified to remove rRNA and transcribed into fluorescent cRNA as probes that hybridize onto the Human LncRNA Array V3.0 (8660 K; Arraystar). The lncRNAs were carefully collected from databases such as GENCODE, UCSC KnownGene, RefSeq, and UCR. Each transcript was represented by a specific exon or splice junction probe that can reliably and accurately identify individual transcripts. For hybridization and quality control, positive probes for 28 house-keeping genes (NM_000291, NM_000841, NM_001101, NM_001536, NM_001614, NM_001861, NM_002046, NM_002107, NM_002539, NM_003753, NM_005022, NM_006098, NM_021009, NM_022551, EIF3D, PFN1, GAPDH, ODC1, COX4I1, ACTB, ACTG1, GRM4, GNB2L1, RPS18, PRMT1, PGK1, H3F3A, and UBC) and negative probes were printed onto the array. The microarray analysis was performed following the standard procedures. By using an mRNA-ONLY TM Eukaryotic mRNA Isolation Kit, mRNA was further purified from total RNA after the removal of rRNA. Subsequently, by using a random priming method, the samples were amplified and transcribed into fluorescent cRNA along the whole length of the transcripts without 30 biases. These labeled cRNA samples were then purified by RNeasy MiniKit. The yield and specific activity of the labeled cRNA (pmol Cy3/mg cRNA) were measured by NanoDrop ND-1000. The labeled cRNA samples were then proceeded to the next hybridization step if the yield and specific activity exceeded 1.65 mg and 9.0 pmol Cy3/mg cRNA, respectively. After passing the quality test, 1 mg of each labeled cRNA sample in the hybridization solution was used for hybridization. Subsequently, the hybridized arrays were washed, fixed, and scanned with an Agilent DNA Microarray Scanner (Agilent Technologies, Santa Clara, CA, USA).
The software packages Agilent Feature Extraction with version 11.0.1.1 and GeneSpring GX v12.0 were used to analyze the array images and to perform quantile normalization, respectively. Then data processing was conducted to analyze data. Next, lncRNAs and mRNAs with at least three out of six sample flags in present or marginal (all targets values) were selected for further analysis. Differentially expressed lncRNAs and mRNAs between two groups were identified through fold-change filtering and Student’s t-test. A fold-change of >2.0 and a two-tailed p-value of <0.05, corrected using false discovery rate (FDR), were considered as the criteria for differential expression. In addition, hierarchical clustering was used to demonstrate the deregulated patterns of lncRNA and mRNA expression.
Gene Ontology (GO) and Kyoto Encyclopedia of Genes and Genomes (KEGG) pathway analysis
A controlled vocabulary is provided by the GO project to characterize gene and the attributes of gene products (http://www.geneontology.org).17 GO categories were considered significantly enriched if p<0.05. Involved biological pathways of the deregulated mRNAs were analyzed using KEGG enrichment analysis. Note that lower p-values denote more significantly correlated pathways.
Real-time quantitative PCR (RT-qPCR)
Using TransScript One-Step gDNA Removal and cDNA Synthesis SuperMix (TransGen Biotech, Beijing, China) with oligo-dT, 1 μg of the RNA samples were reversely transcribed into cDNA primer following RNA extraction. Real-time PCR was carried out by using TransStart Top Green qPCR SuperMix (TransGen Biotech) on a Mastercycler ep realplex 4 (Eppendorf, Hamburg, Germany). The PCR analysis started at an initial step at 95°C for 30 s, followed by 40 cycles of amplification and quantification (95°C for 15 s, 60°C for 15 s, and 68°C for 20 s). The internal control was β-actin. The 2−ΔΔCt method was used to calculate relative gene expression levels, and melt curve analysis was performed to verify the specificity of the primers. Table S1 lists the sequences of the primers used.
Analysis of the relationship between lncRNAs and adjacent protein-coding genes
Originating from complex transcriptional loci, lncRNA regulates gene expression through epigenetic regulation of chromatin modification and transcriptional and post-transcriptional processing. This study aimed to understand the role of lncRNA in the TB infection and to examine the underlying mechanisms of MDR-TB and MDR-TB reactivation. Therefore, we focused on analyzing deregulated lncRNAs and their relation to adjacent protein-coding genes.18
Statistical analysis
The amount of variation of the data is expressed as the mean ± SD. Student’s t-test was used to reveal the differential expression of the lncRNAs and mRNAs in the microarray and PCR analysis. A two-tailed p-value of <0.05 was considered statistically significant.
Results
Characteristics of the study subjects
A total of 510 participants (460 TB-suspected patients and 50 HCs) were enrolled in this study. As depicted in Figure 1, sputum specimens were collected from TB suspects and then were detected using the conventional DST method. Of the 280 strains, 51.4% (144/280) were INH- and/or RIF-resistant strains. Indeed, 19.3% (54/280) were INH monoresistant, 17.9% (50/280) of strains were RIF monoresistant, and 14.3% (40/280) were MDR-TB strains. Herein, the 30 new phenotypic DS-TB cases and 20 new phenotypic MDR strains that did not undergo anti-TB treatment were selected for further studies.
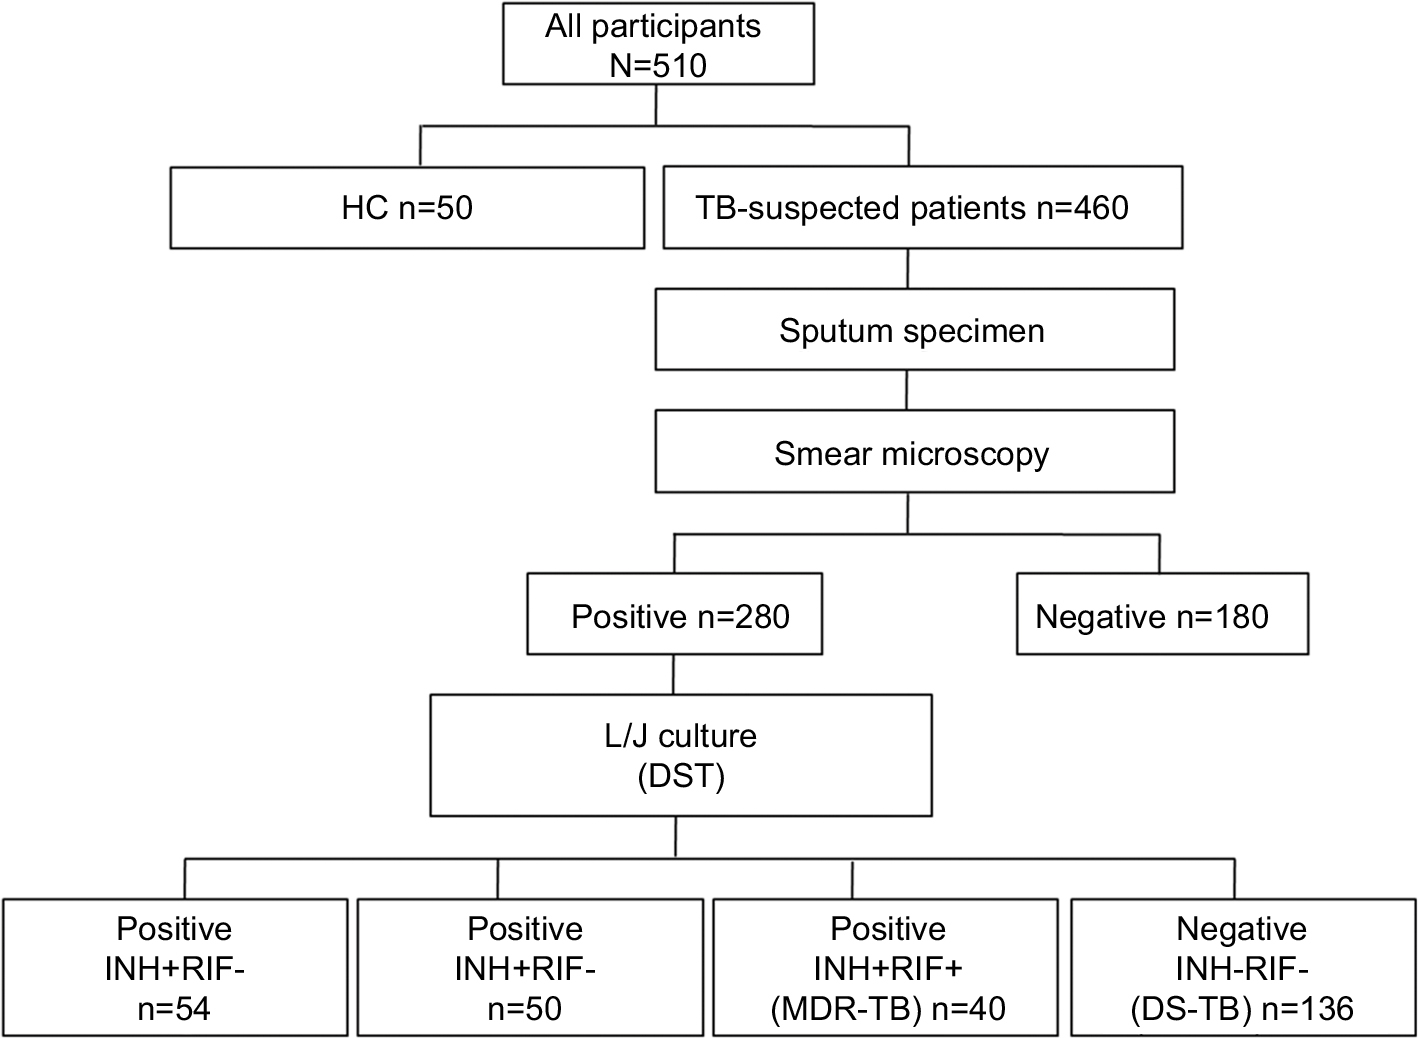 | Figure 1 Enrolment of participants in this study. Abbreviations: HC, healthy control; TB, tuberculosis; DST, drug-susceptibility testing; L/J, Lownstein-Jenson culture; MDR-TB, multidrug-resistant tuberculosis; DS-TB, drug-sensitive tuberculosis; INH, isoniazid; RIF, rifampin. |
According to demographic data (Table 1), the mean age of new DS-TB and MDR-TB cases was 32.6 years (SD: 21.4, range: 20–62 years) and 40.5 years (SD: 17.9, range: 18–66 years), respectively, with ages from 20 to 66 years. The sex ratio of DS-TB and MDR-TB patients were 1.5 (18/12) and 1.2 (11/9). No patients had a family history of new DS-TB and MDR-TB cases. However, as shown in Table 2, there were significant differences between the patients with MDR-TB and the HCs (p<0.05). Furthermore, a significant difference of INR level was identified among patients with MDR-TB and those with DS-TB (p<0.05) (Table 2).
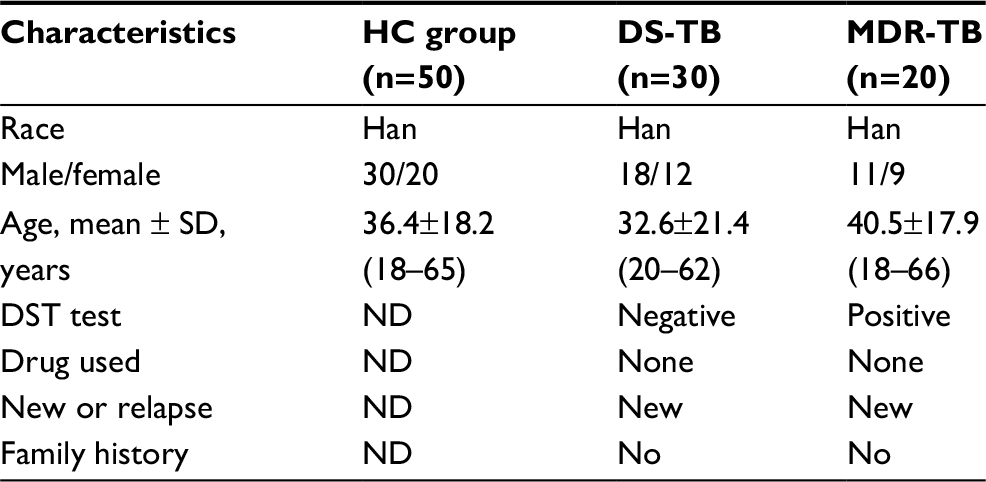 | Table 1 The demographic characteristics of participants selected in this study Notes: All patients with active pulmonary TB had clinical signs and symptoms, such as cough, fever, and fibrocavitary lung infiltrate on chest radiograph. Healthy controls involved in the study were free of clinical symptoms of any infectious disease. There were no significant differences in age (P>0.05, one-way ANOVA test) or gender (P>0.05, chi-square test) between three groups. Abbreviations: HC, healthy control; TB, tuberculosis; DS-TB, drug-sensitive TB; MDR-TB, multidrug-resistant TB; ND, not determined; DST, drug-susceptibility testing. |
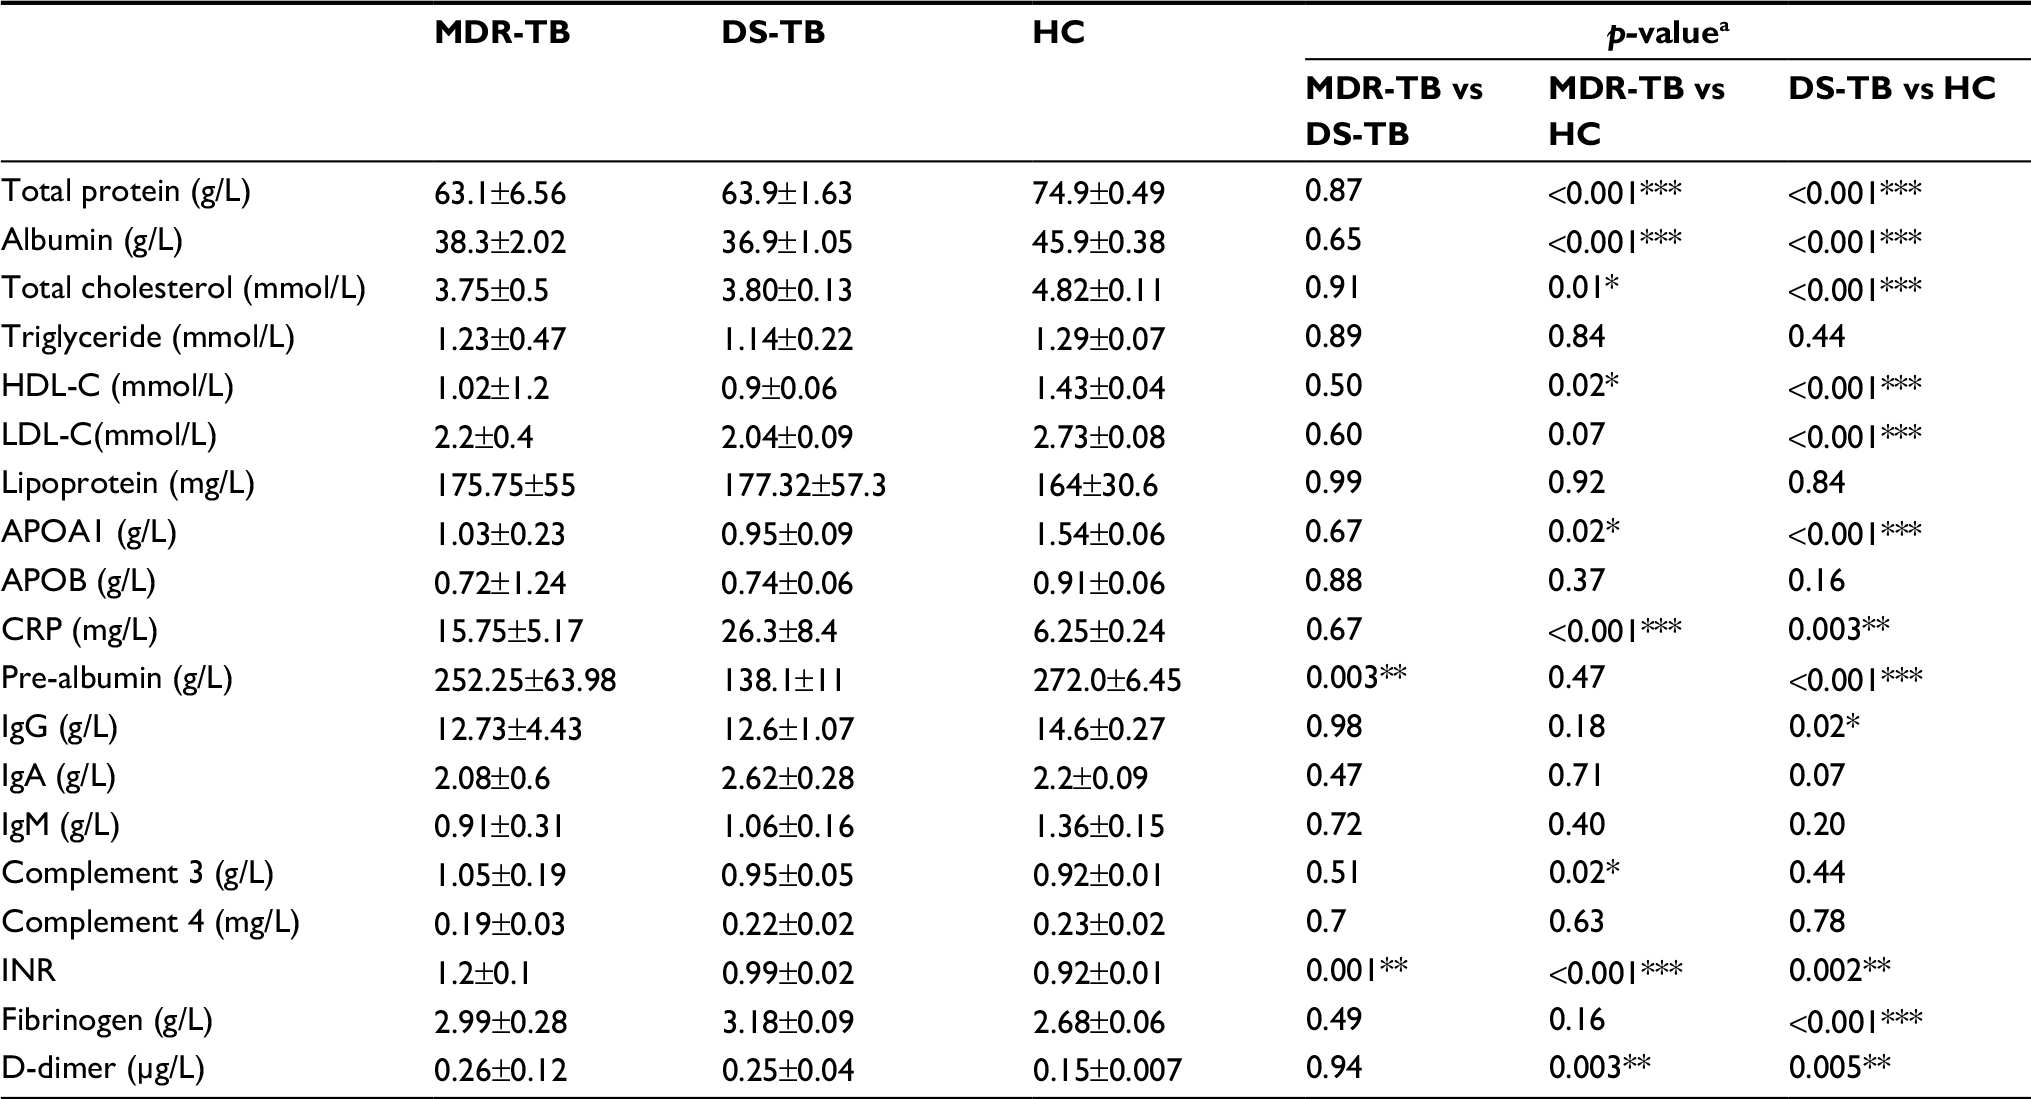 | Table 2 Clinical data of participants selected in this study Notes: All data are presented as the mean±SD. ap-value between two groups, for independent t-test. *p<0.05, **p<0.01, ***p<0.001. Abbreviations: TB, tuberculosis; MDR-TB, multidrug-resistant tuberculosis; DS-TB, drug-sensitive tuberculosis; HC, healthy control; HDL-C, high-density lipoprotein cholesterol; LDL-C, low-density lipoprotein cholesterol; APOA1, apolipoprotein A1; APOB, apolipoprotein B; CRP, C-reactive protein; INR, international normalized ratio. |
Differential expression of lncRNAs and mRNAs in PBMCs
Expression profiling studies were performed on the RNA from three independent PBMC samples in each group. Microarray analysis demonstrated variations in lncRNA and mRNA expression between chips. Hierarchical cluster (Figure 2A and B) and volcano plot (Figure 2C and D) demonstrated the expression patterns of lncRNA and mRNA. The distributions of lncRNA and mRNA data set profiles are visualized with box plots (Figure 3A and C); the expression variations of lncRNA and mRNA between groups were assessed with scatter plots (Figure 3B and D). lncRNAs or mRNAs with not less than twofold expression changes were chosen to identify the most significant candidates. Following data normalization, hundreds of lncRNAs among groups in Ensembl, RNAdb, NRED, lincRNA, misc_RNA, UCSC_knowngene, H-invDB, HOX cluster, RefSeq_NR, and UCR were detected to be differentially expressed with FDR <0.05.
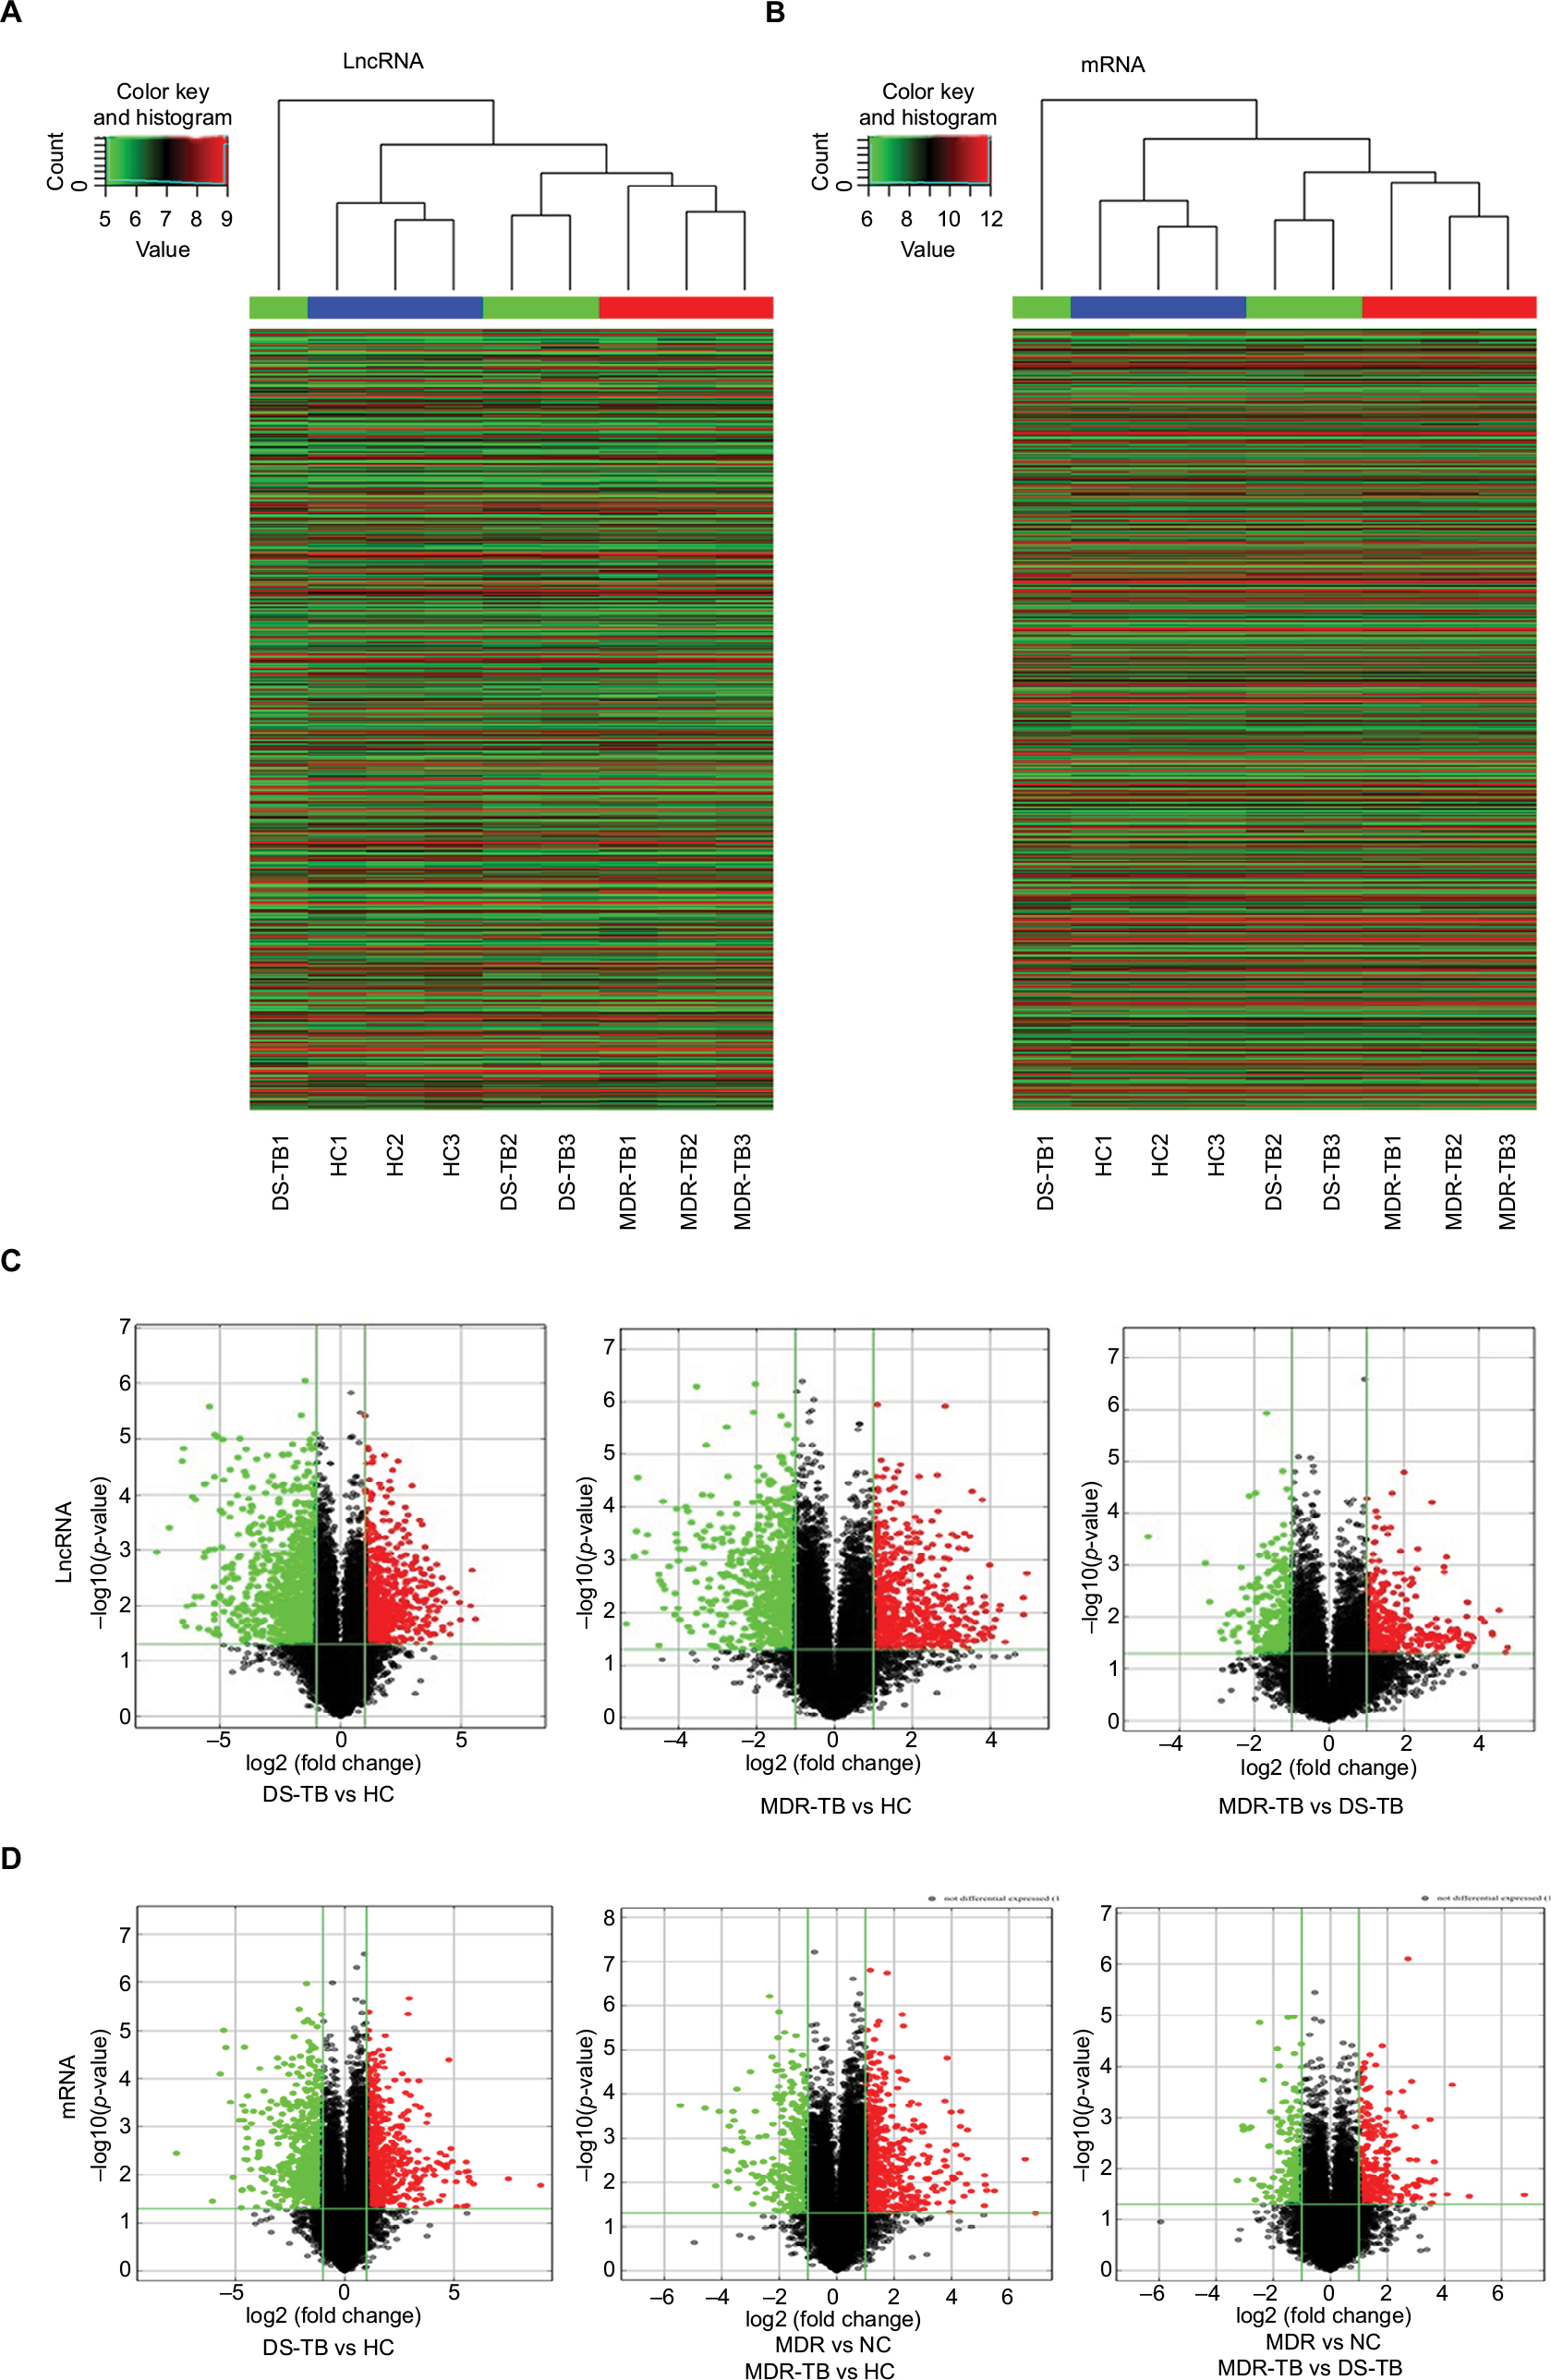 | Figure 2 Heat map presentation and volcano plot of the expression profile of lncRNA and mRNA. (A and B) Each column represents a sample, and each row represented a gene. High relative expression is indicated by red color, and low relative expression is indicated by green color. HC, n=3; MDR-TB, n=3; DS-TB, n=3. (C and D) The significantly different genes are represented. Red indicates high relative expression, and green indicates low relative expression. One-way analysis of variance test was used for statistical analysis. lncRNA or mRNA with expression fold change >2.0 and with FDR adjusted p-value <0.05 was considered statistically significant. Abbreviations: HC, healthy control; TB, tuberculosis; MDR-TB, multidrug-resistant tuberculosis; DS-TB, drug-sensitive tuberculosis; FDR, false discovery rate; lncRNA, long non-coding RNA. |
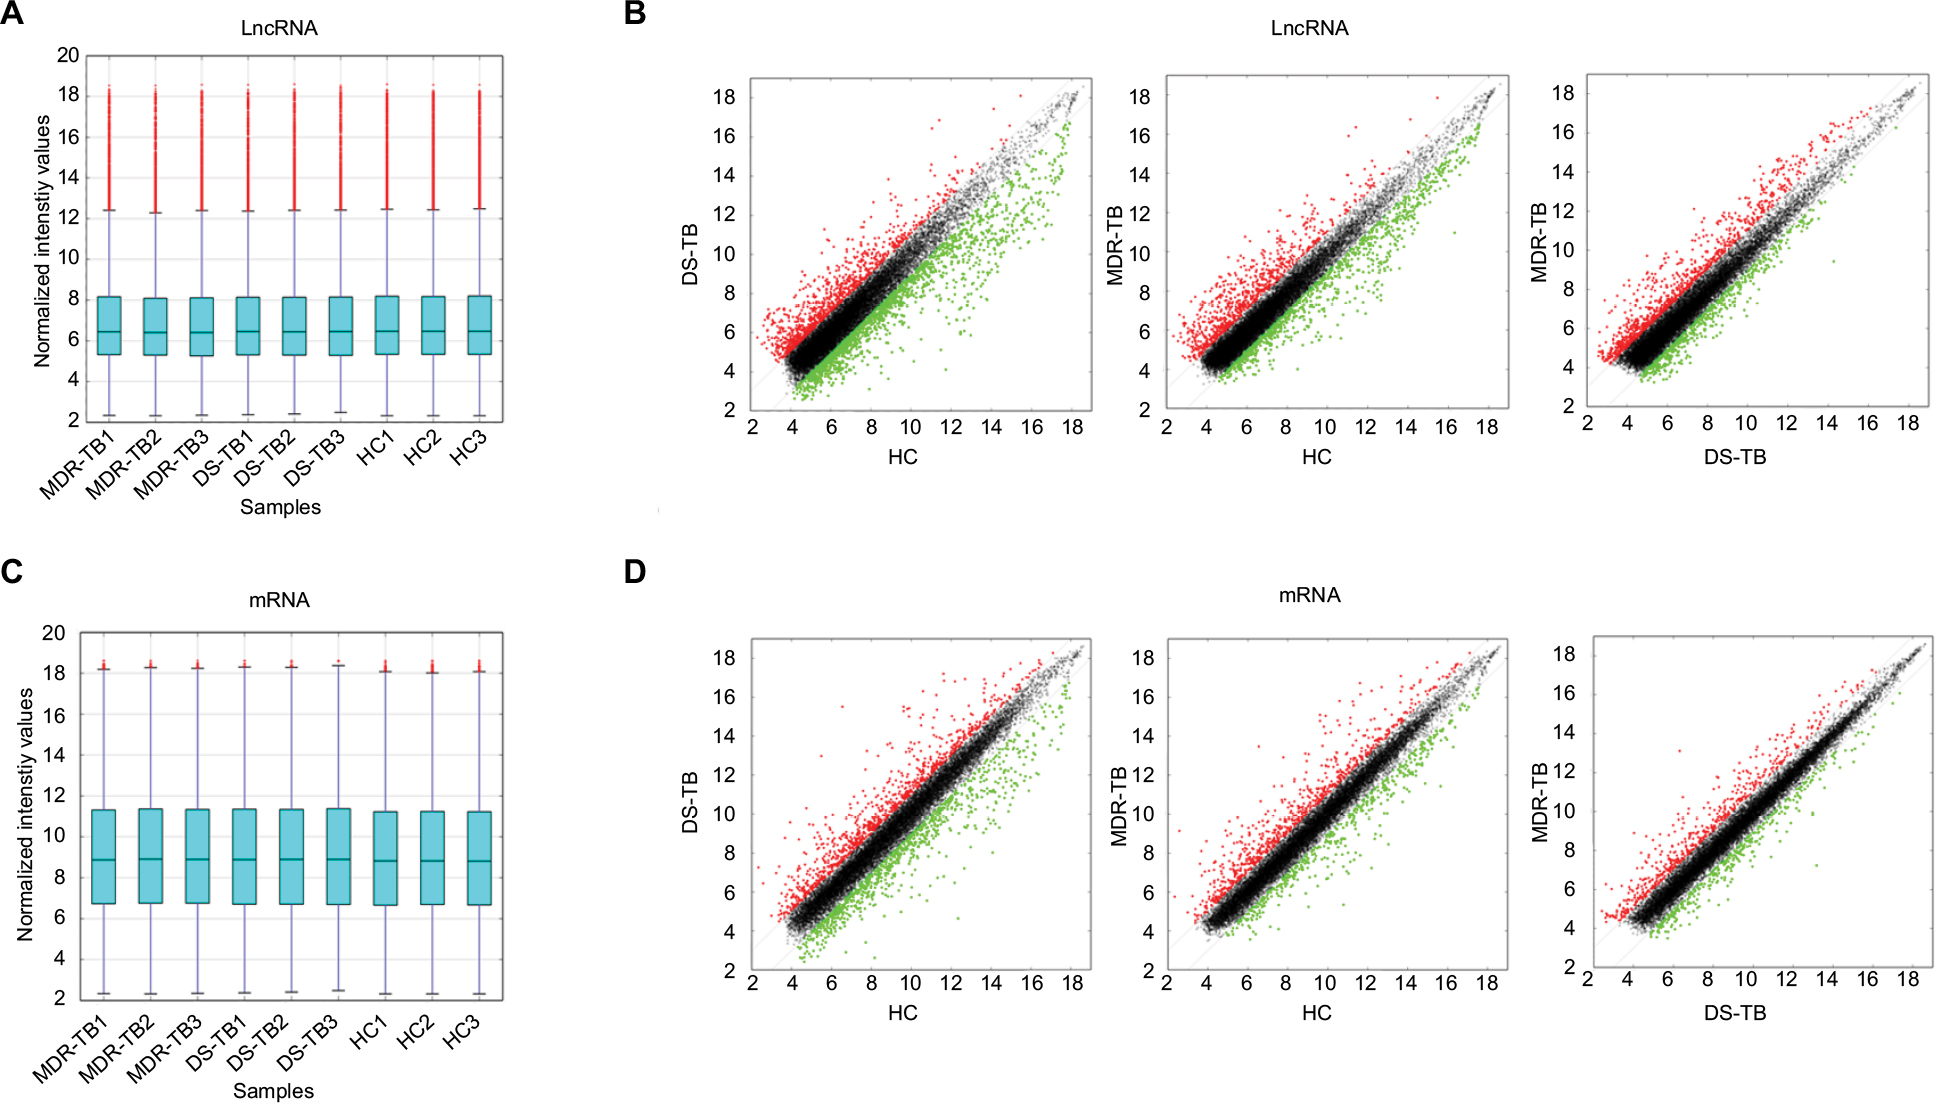 | Figure 3 Expression of lncRNA and mRNA between chips. (A and C) Box plot was used for the visualization of the distribution of a data set of lncRNA (A) and mRNA (C) profiles. (B and D) Scatter plot was used to assess lncRNA (B) and mRNA (D) expression variations between the two groups. High normalized intensity is indicated by red color, and low normalized intensity is indicated by blue color. Abbreviations: lncRNA, long non-coding RNA; HC, healthy control; MDR-TB, multidrug-resistant tuberculosis; DS-TB, drug-sensitive tuberculosis. |
Compared with the HC group, 1,429 lncRNAs (568 upregulated) and 2,040 lncRNAs (710 upregulated) were identified to be deregulated in the MDR-TB and DS-TB groups, respectively, and 1,511 lncRNAs (607 upregulated) were detected to be differentially expressed in both the MDR-TB and the DS-TB groups (FDR <0.05). Furthermore, Figure 4A shows that 712 lncRNAs (393 upregulated) were identified to be differentially expressed in the MDR-TB group compared with the DS-TB group (FDR <0.05). Note that 22 lncRNAs were found deregulated between the three groups with fold changes >10.0 and FDR <0.05 (Table 3). Nineteen of these lncRNAs showed a similar expression tendency in the MDR-TB and DS-TB groups compared with the HC group.
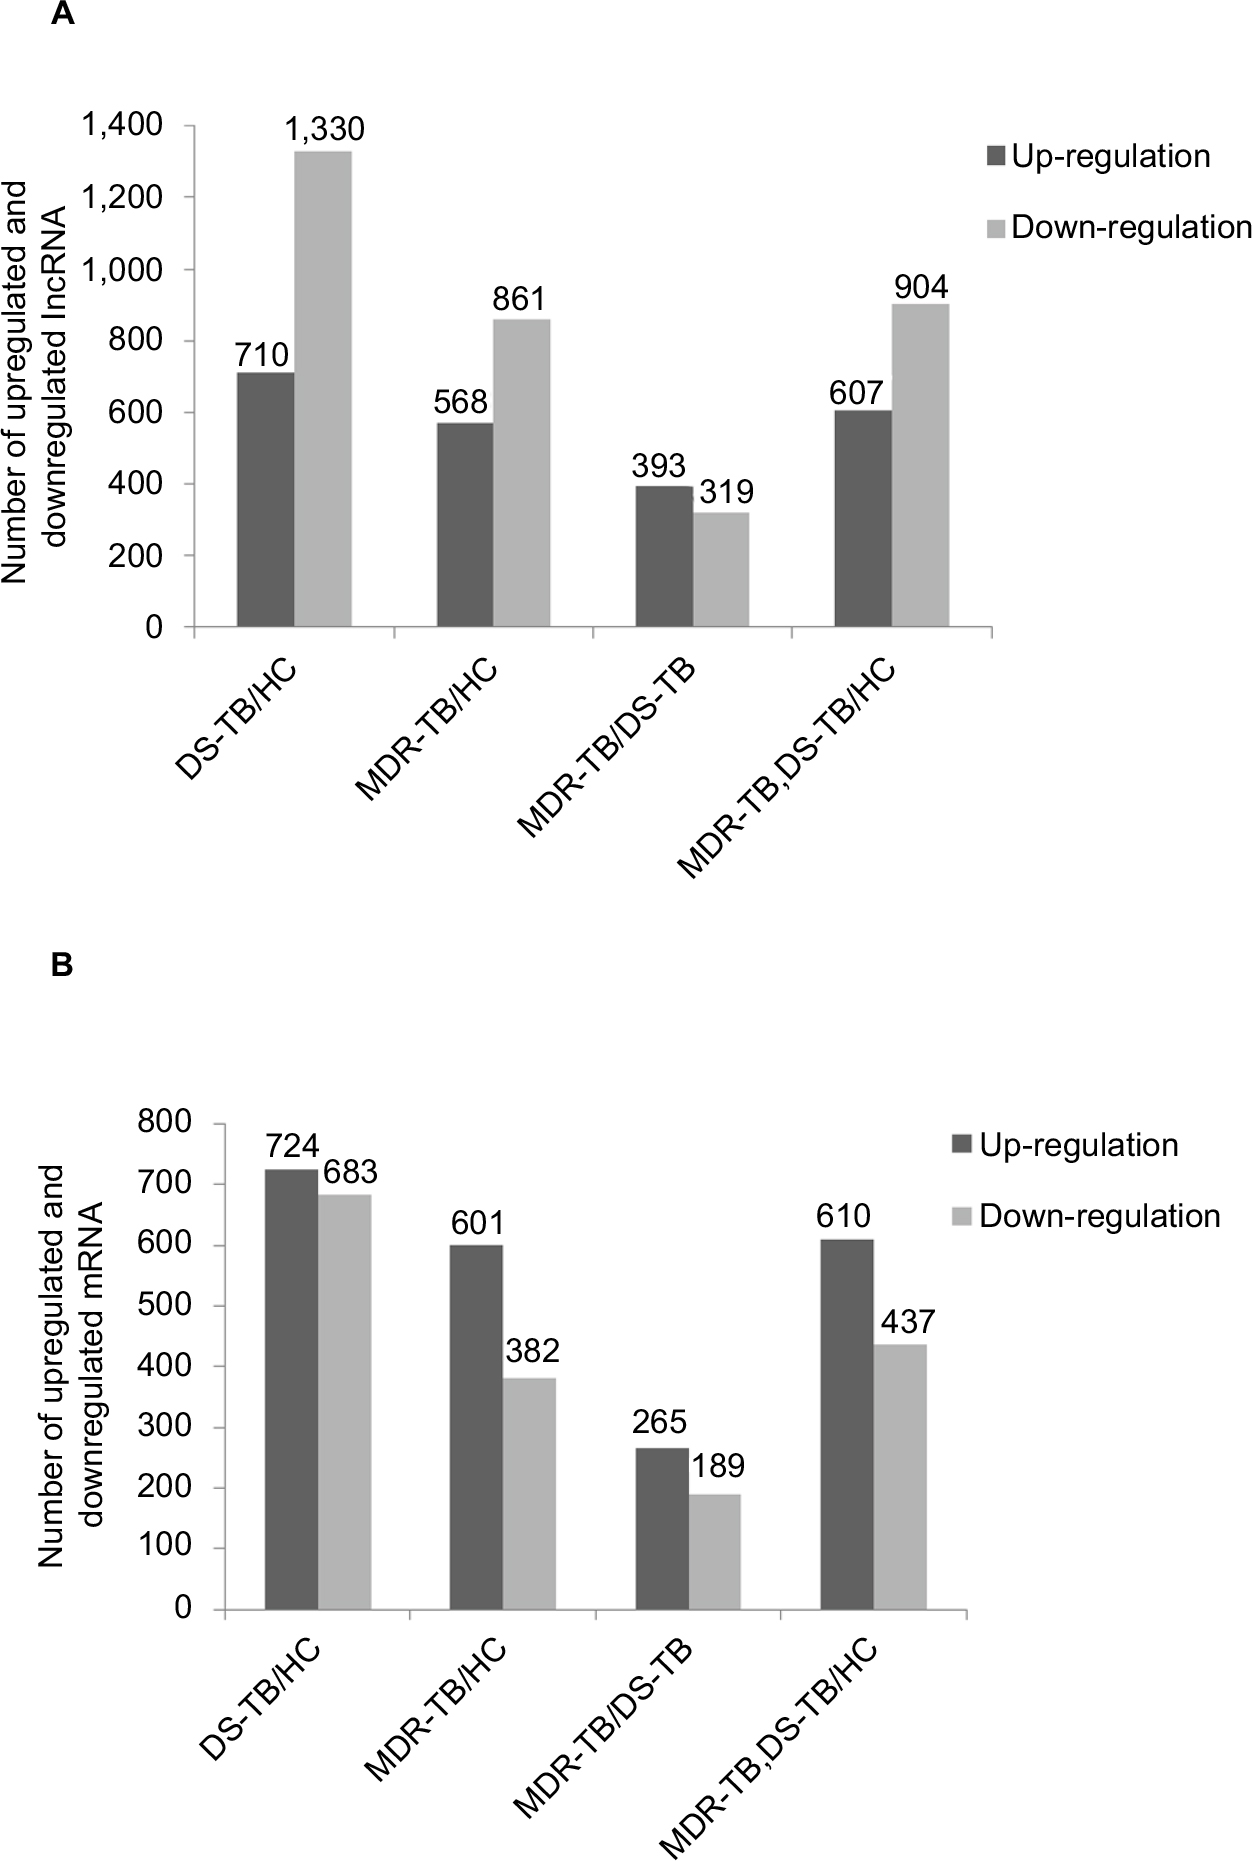 | Figure 4 Number of upregulated and downregulated lncRNAs (A) and mRNAs (B). Abbreviations: lncRNA, long non-coding RNA; HC, healthy control; MDR-TB, multidrug-resistant tuberculosis; DS-TB, drug-sensitive tuberculosis. |
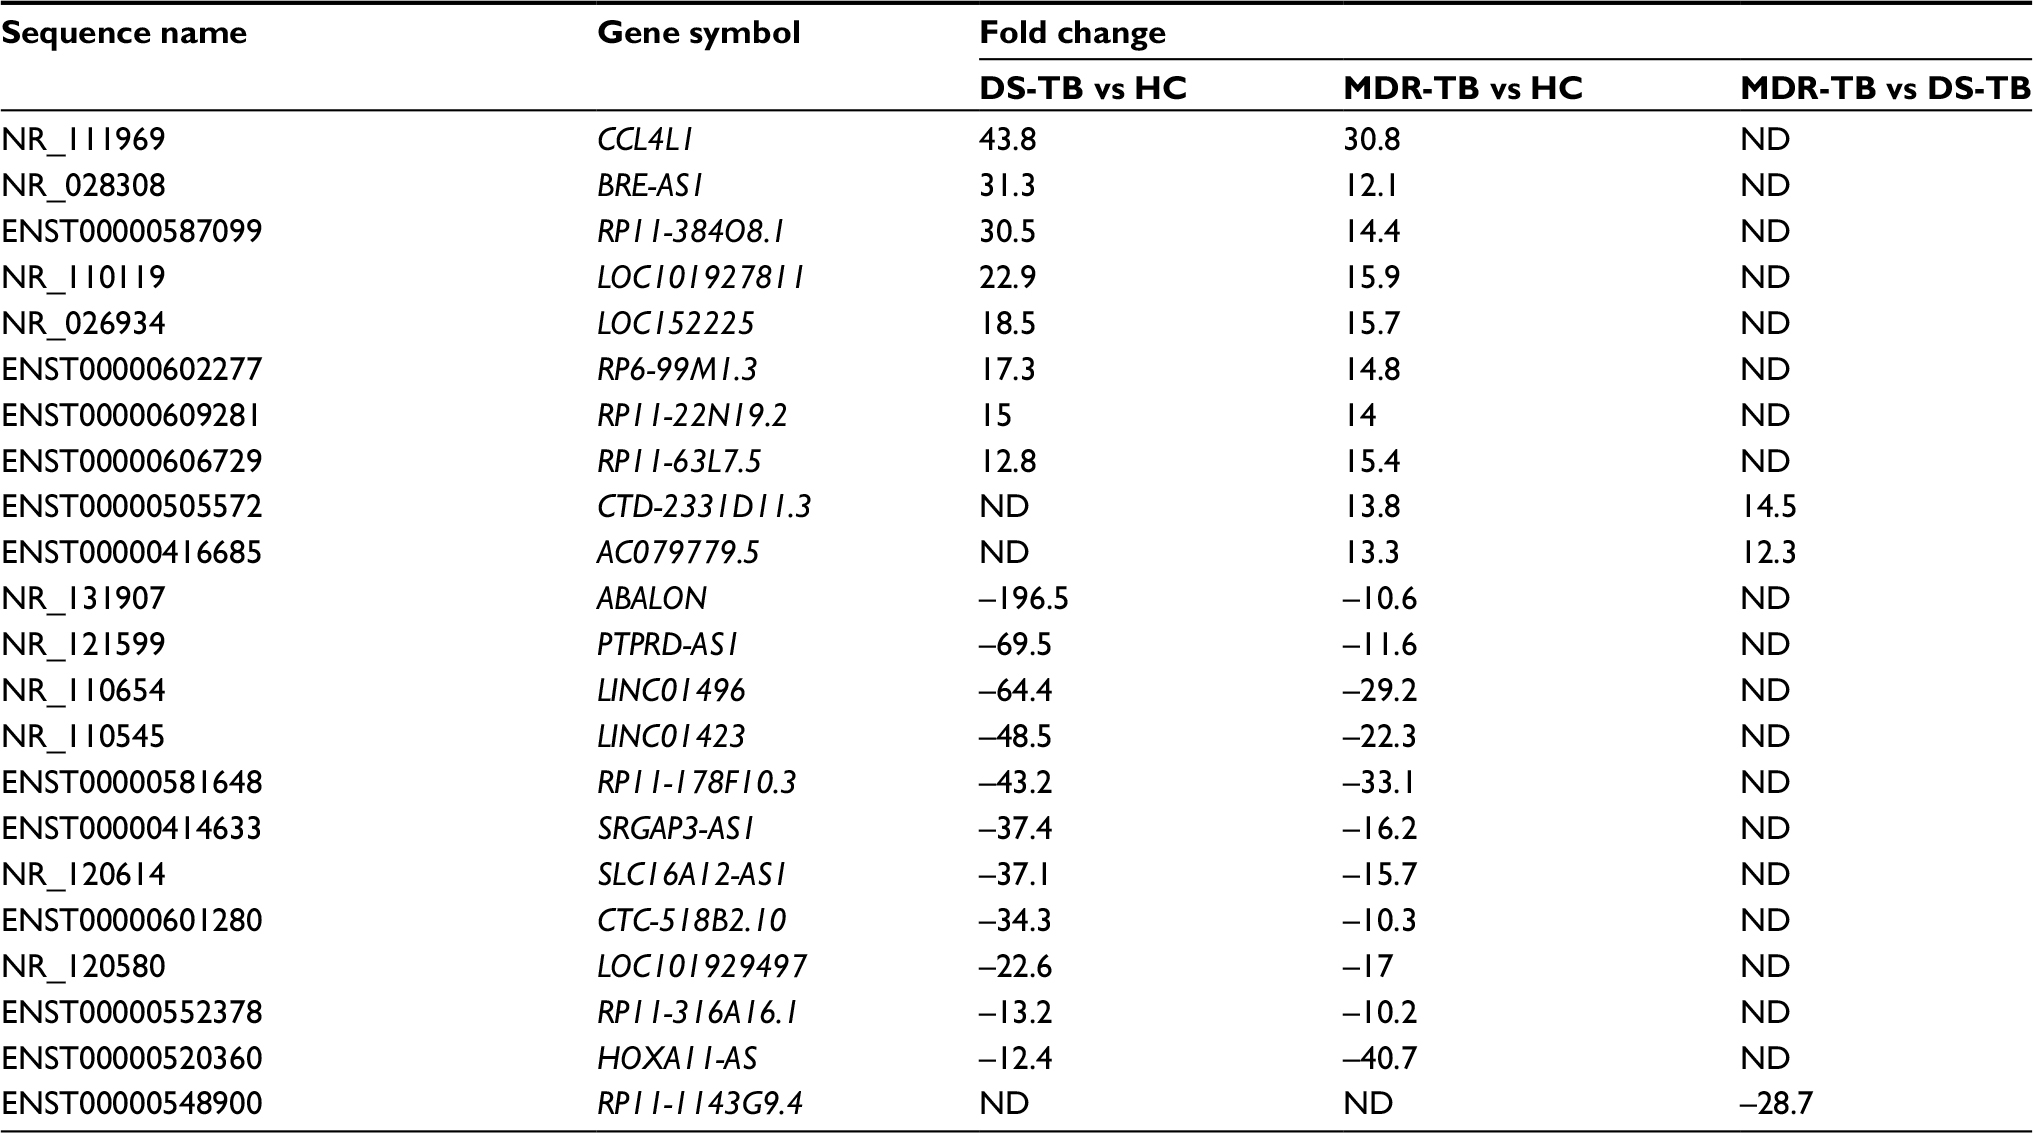 | Table 3 Differentially expressed LncRNAs between the three groups Notes: Data as fold change. Positive value indicates upregulation and negative value indicates downregulation. One-way ANOVA test was used for statistical analysis. LncRNA with expression fold change >2 and with FDR adjusted p-value <0.05 was considered statistically significant. Here we show the expression fold change >10. Abbreviations: MDR-TB, multidrug-resistant tuberculosis; DS-TB, drug-sensitive tuberculosis; HC, healthy control; ND, not determined; lncRNAs, long non-coding RNA; ANOVA, analysis of variance; FDR, false discovery rate. |
Further data analysis showed that, compared with the HC group, 983 mRNAs (601 upregulated) and 1,407 mRNAs (724 upregulated) were identified to be differentially expressed in the MDR-TB group and DS-TB group, respectively. Also, there were 1,047 mRNAs (610 upregulated) identified in both the MDR-TB and DS-TB groups (FDR <0.05). Compared with the DS-TB group, 454 mRNAs (265 upregulated) were identified to be differentially expressed in the MDR-TB group with FDR <0.05 (Figure 4B). Thirty-eight mRNAs were deregulated between the three groups with fold changes >10.0 and FDR <0.05 (Table 4). Thirty-six of these mRNAs presented a similar expression tendency in both the MDR-TB and DS-TB groups compared with the HC group. Collectively, these results indicate that molecular events in PBMCs such as lncRNAs and mRNAs were altered in patients with MDR-TB and DS-TB.
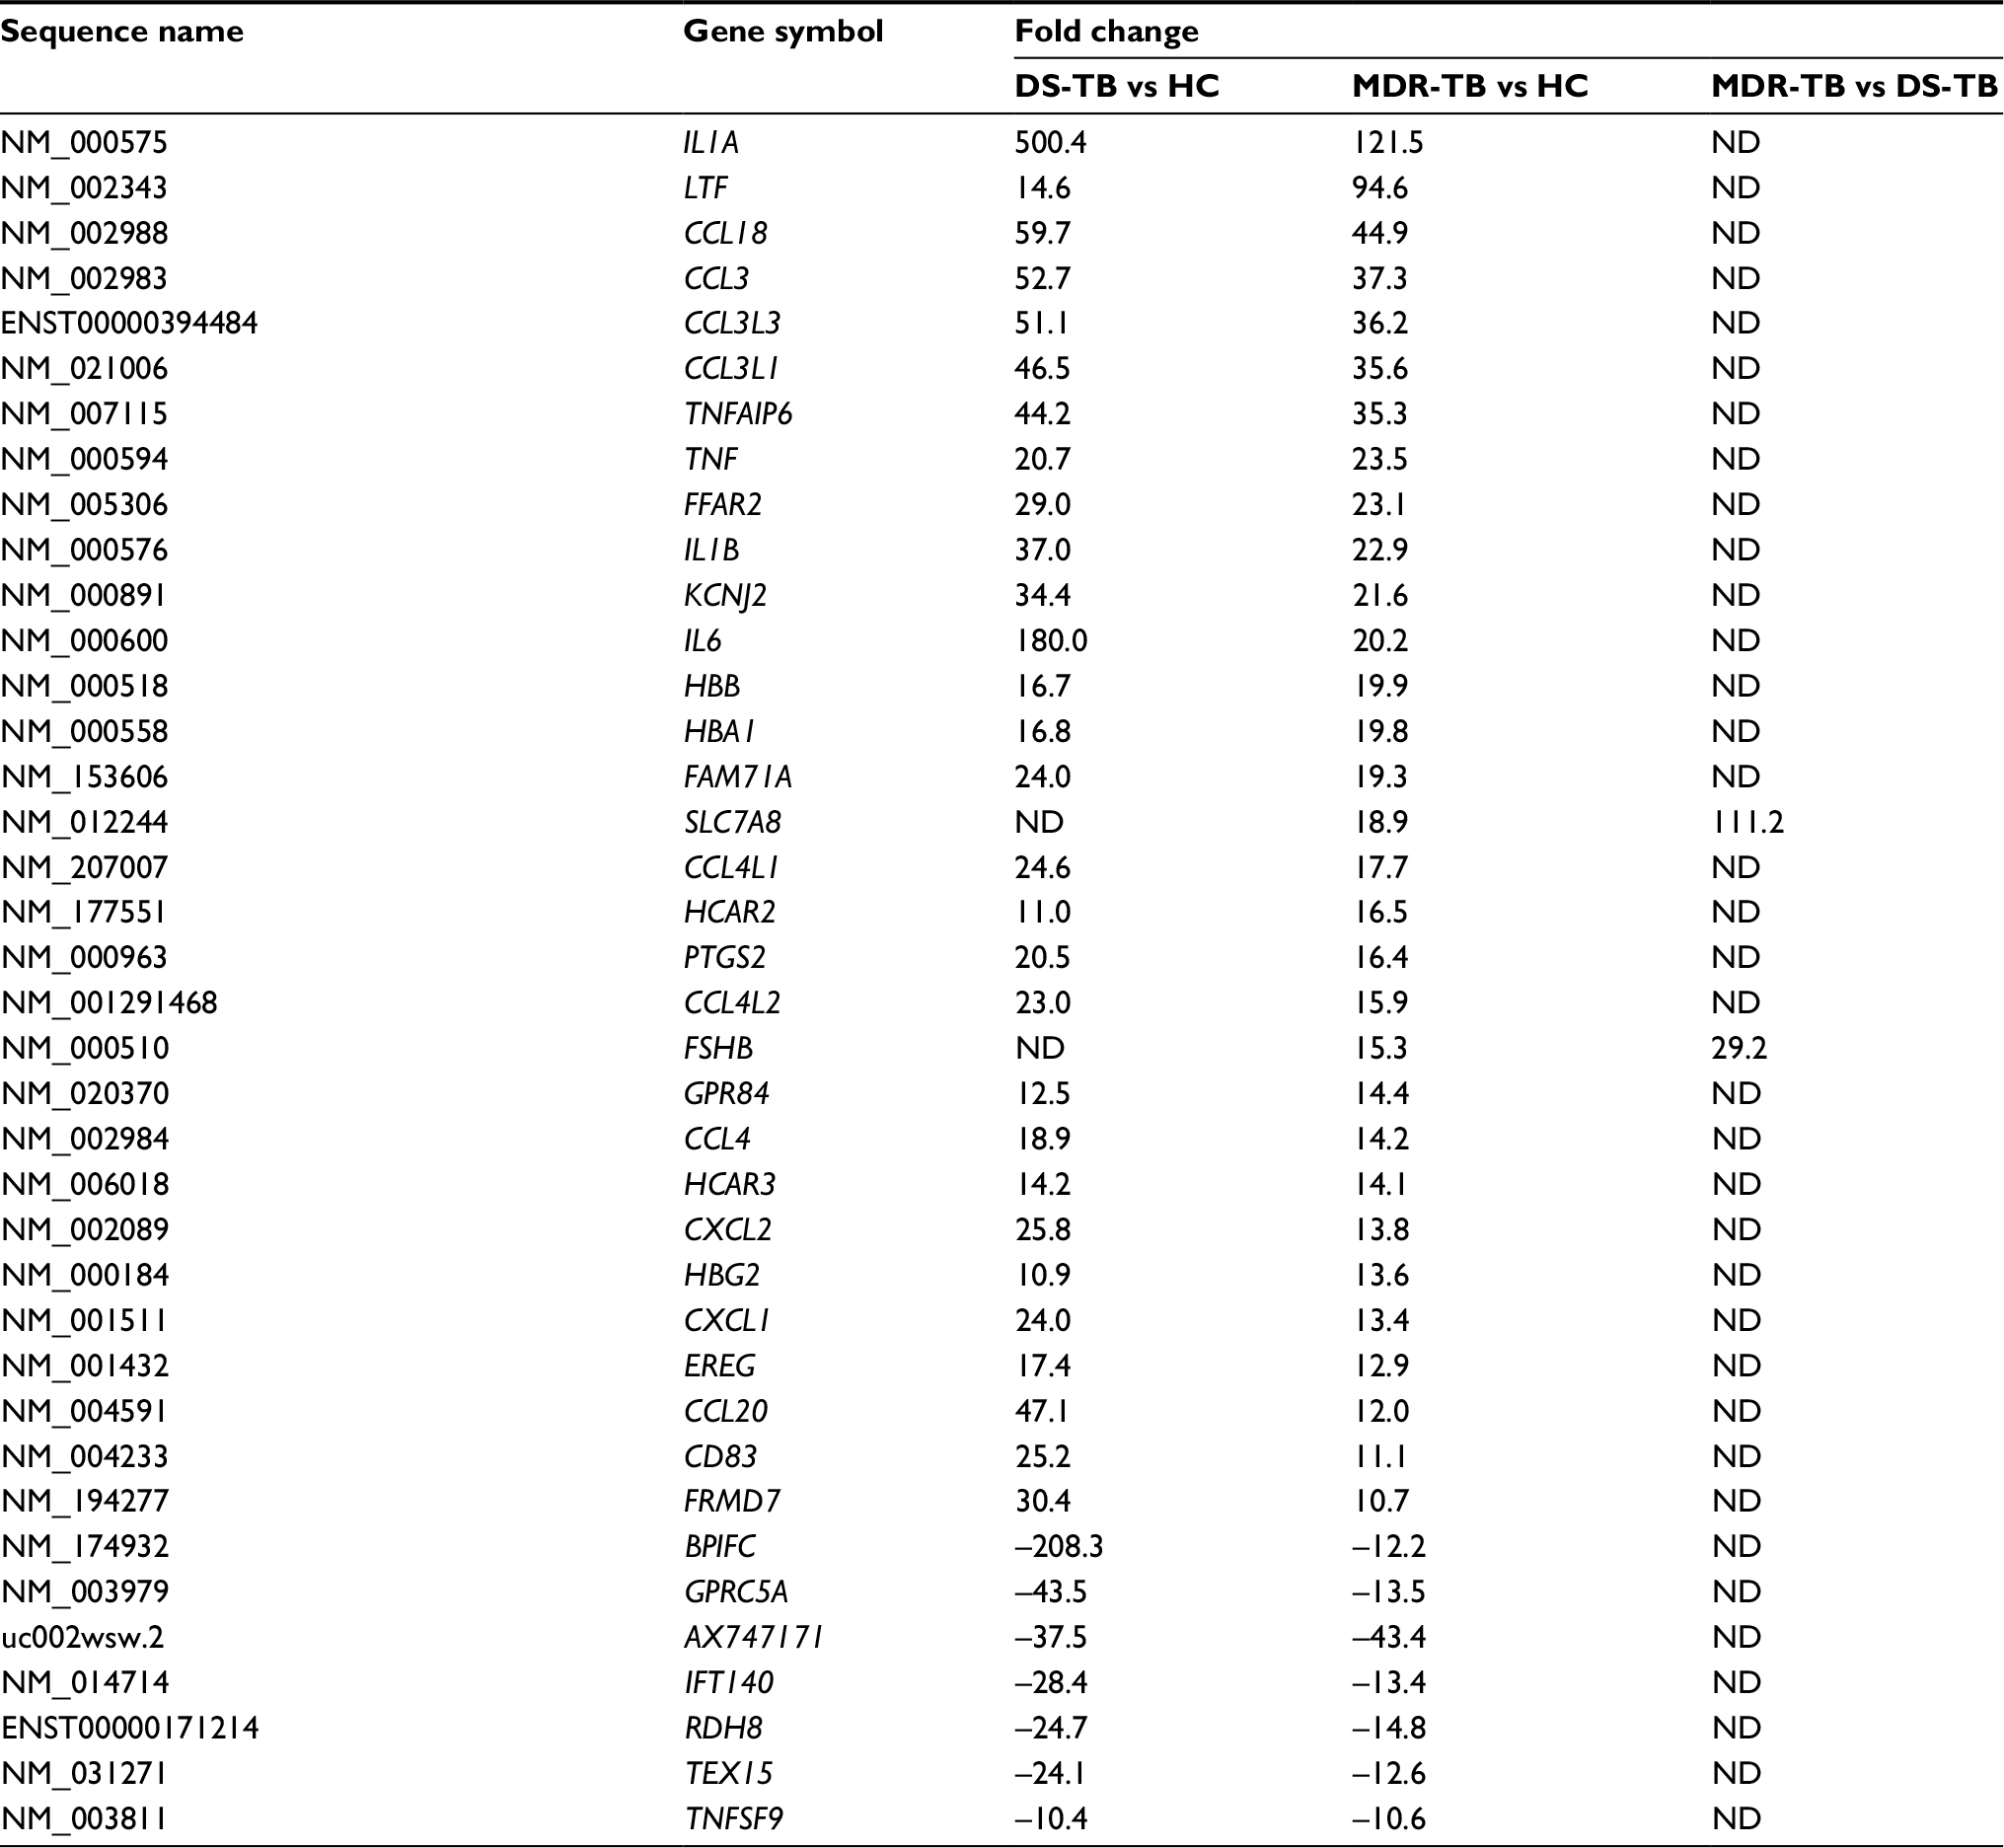 | Table 4 Differentially expressed mRNAs between the three groups Notes: Data as fold change. Positive value indicates upregulation and negative value indicates downregulation. One-way ANOVA test was used for statistical analysis. mRNA with expression fold change >2 and with FDR adjusted p-value <0.05 was considered statistically significant. Here we show the expression fold change >10. Abbreviations: MDR-TB, multidrug-resistant tuberculosis; DS-TB, drug-sensitive tuberculosis; HC, healthy control; ND, not determined; lncRNAs, long non-coding RNA; ANOVA, analysis of variance; FDR, false discovery rate. |
Validation of microarray results by RT-qPCR
Six lncRNAs in all samples were randomly selected for the RT-qPCR analysis to validate the microarray results. Results show that, compared with the HC group, four lncRNAs presented similar expression tendencies in the MDR-TB and DS-TB groups. LOC0101929497, LINC01496, and CTC-518B2.10 were downregulated while BRE-AS1 was upregulated in the MDR-TB and DS-TB groups. Compared with the DS-TB group, BRE-AS1 was increased while LOC0101929497, LINC01496, and CTC-518B2.10 were decreased in the MDR-TB group (Table 3; Figure 5A). The results of the RT-qPCR analysis are consistent with the microarray data, indicating that these four lncRNAs might be related to TB infection. Intriguingly, it was further discovered that, compared with DS-TB, CTD-2331D11.3 and AC079779.5 were increased in the MDR-TB group (Table 3; Figure 5B), implying that these two lncRNAs might be involved in the pathogenesis of MDR in TB infection.
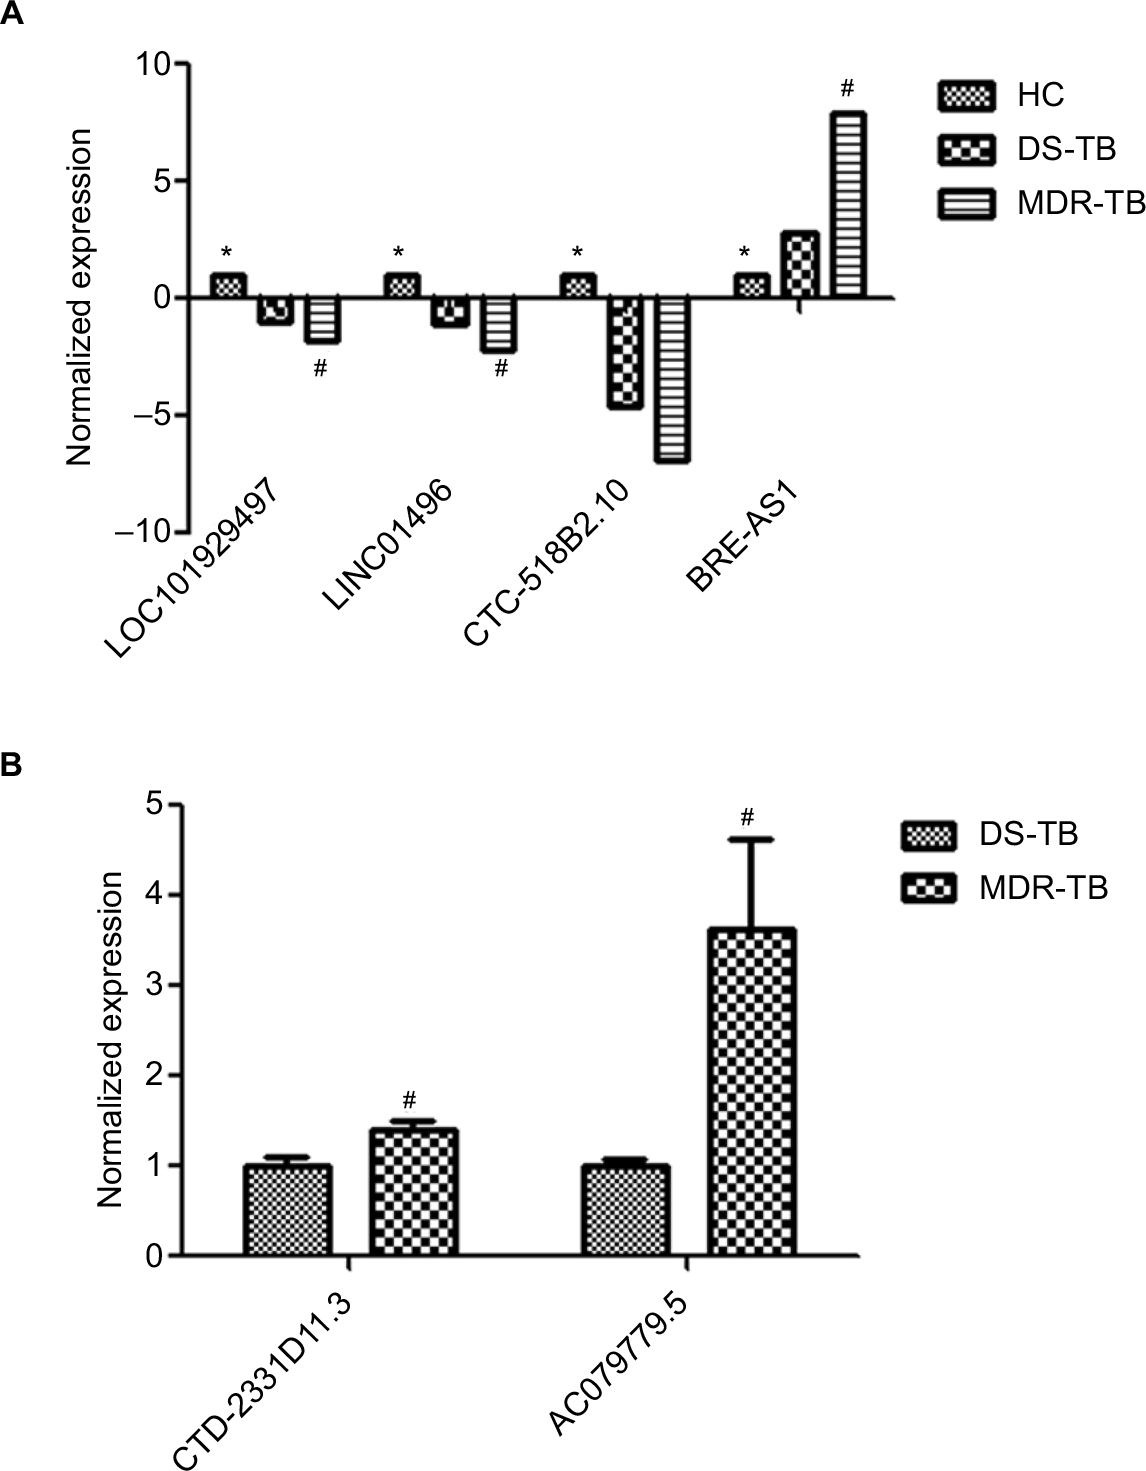 | Figure 5 Confirmation of lncRNA expression by RT-qPCR. After the data were normalized to GAPDH expression, mean ± SD and average expression value for each lncRNA were presented for statistics. One-way ANOVA test for the three groups or Student’s t-test for two groups was used for statistical analysis. (A) Four lncRNAs were differentially expressed between the three groups. (B) Two lncRNAs were differentially expressed between MDR-TB and DS-TB groups. *Significant difference between healthy controls (n=50) and the MDR-TB group (n=20) and between healthy controls and the DS-TB group (n=30). #Significant difference between the MDR-TB and DS-TB groups. A p-value of <0.05 was regarded as statistically significant. Standard deviations were presented as error bars in graphs. Each reaction with technical triplicates was run three times. Abbreviations: lncRNA, long non-coding RNA; HC, healthy control; MDR-TB, multidrug-resistant tuberculosis; DS-TB, drug-sensitive tuberculosis; ANOVA, analysis of variance; RT-qPCR, real-time quantitative polymerase chain reaction. |
Subgroup analysis of differentially expressed lncRNAs and their adjacent mRNA pairs
An increasing amount of evidence indicates that lncRNAs are key players in regulating gene expression.19 The relationship between the differentially expressed lncRNAs and their adjacent protein-coding genes was analyzed to reveal the potential roles of lncRNAs in the pathogenesis of MDR-TB. Most differentially expressed lncRNAs were from intergenic regions (~55% of the total), natural antisense to protein-coding loci (~32% of the total), or intronic antisense to protein-coding loci (~5% of the total). The rest were from exon sense-overlapping lncRNAs and bidirectional lncRNAs. Five hundred and eighty-one out of the 712 differentially expressed lncRNAs between the MDR-TB and DS-TB groups were orientated in or around a known protein-coding region (ie, not intergenic). Ten of the 22 differentially expressed lncRNAs between the three groups were oriented in or around a known protein-coding region (Table 5).
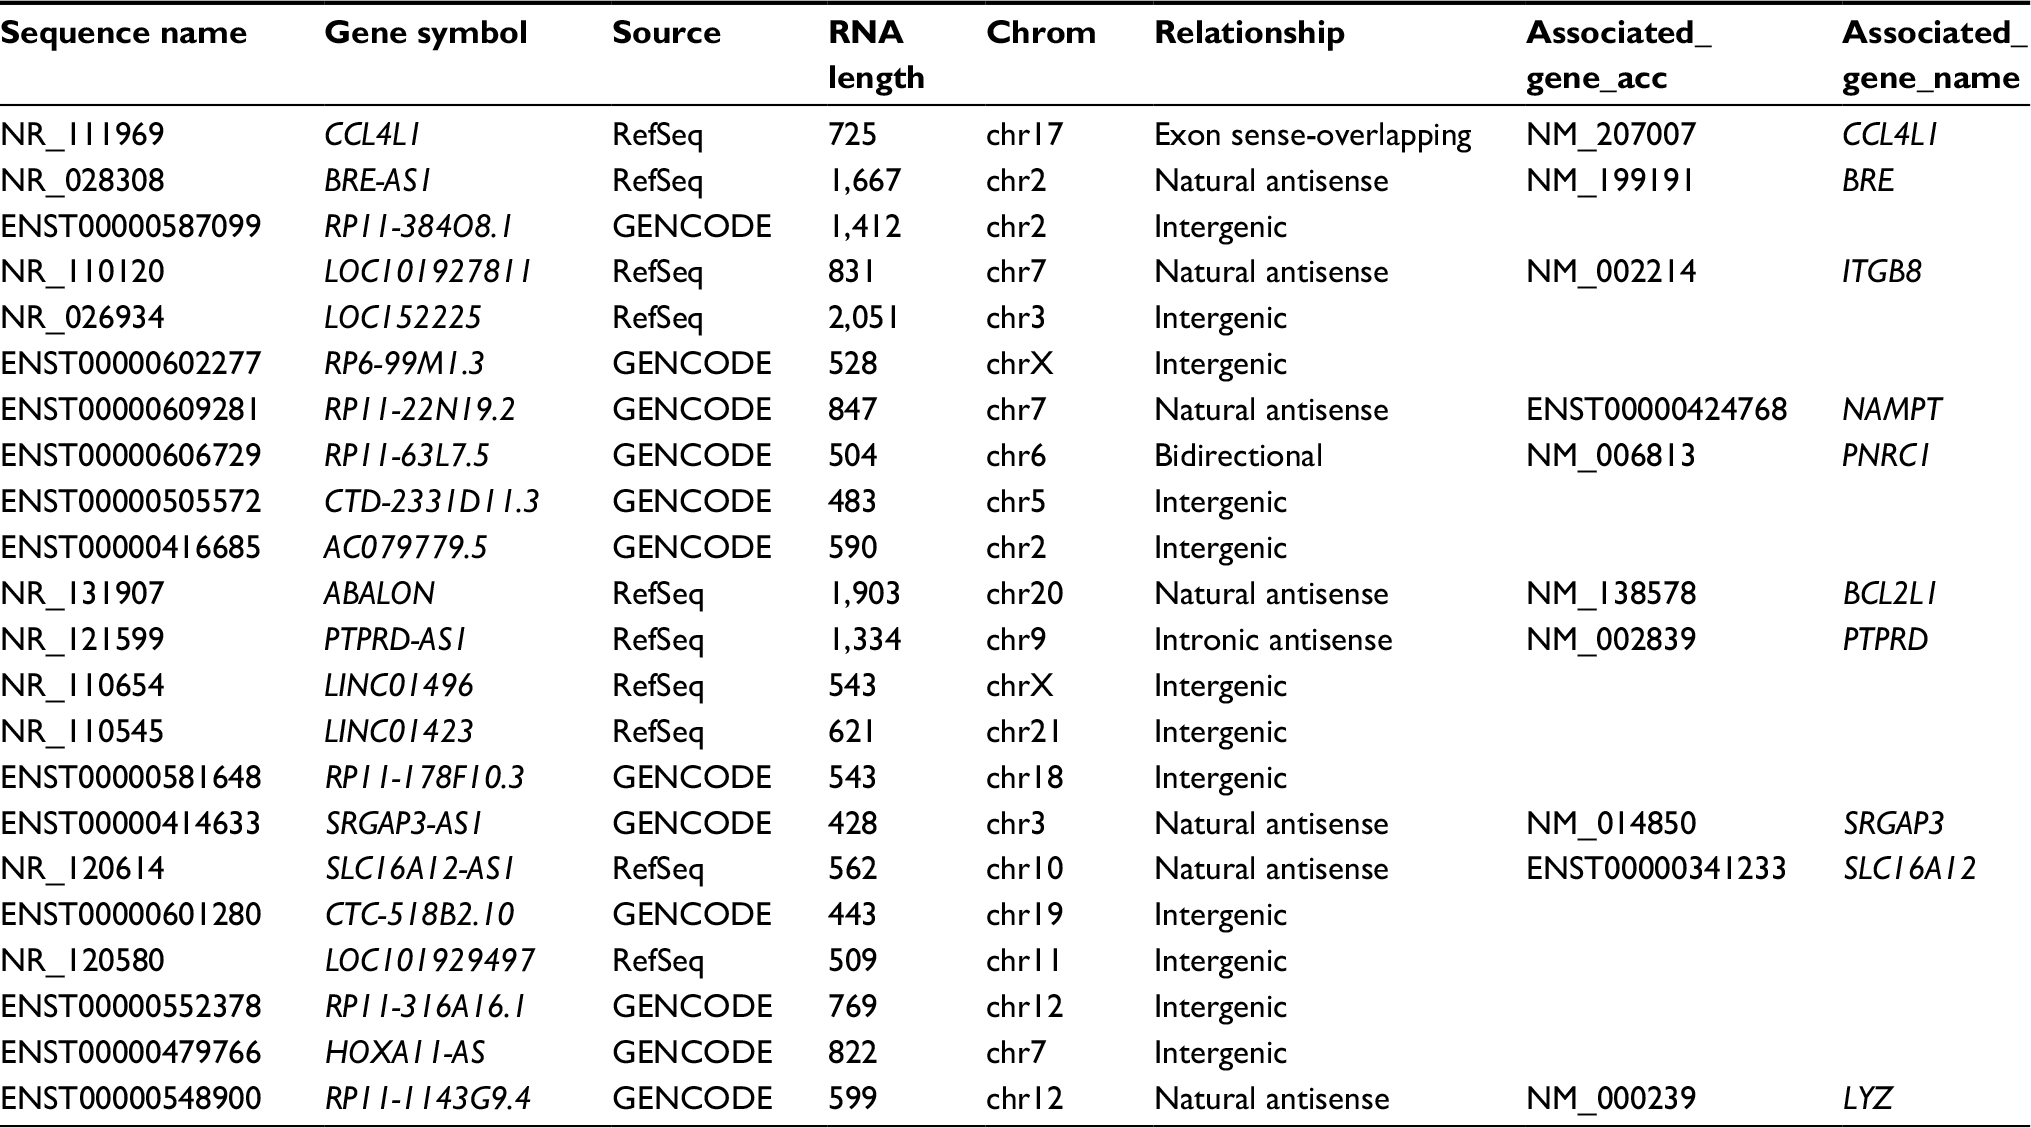 | Table 5 Analysis of the differentially expressed lncRNAs and adjacent protein-coding genes Notes: RefSeq, transcripts collected from RefSeq database; GENCODE: the GENCODE project (http://www.gencodegenes.org/); relationship: the relationship of lncRNA and its nearby coding gene; exon sense-overlapping, the lncRNA exon is overlapping a coding transcript exon on the same genomic strand; natural antisense, the lncRNA is transcribed from the antisense strand and overlapping with a coding transcript; intergenic, there are no overlapping or bidirectional coding transcripts nearby the lncRNA; bidirectional, the lncRNA is oriented head to head to a coding transcript within 1,000 bp; intronic antisense, the lncRNA is overlapping the intron of a coding transcript on the antisense strand. Abbreviations: MDR-TB, multidrug-resistant tuberculosis; DS-TB, drug-sensitive tuberculosis; HC, healthy control; lncRNAs, long non-coding RNA. |
GO and KEGG pathway analysis of deregulated mRNAs
GO analysis provides insight into the potential functions of the MDR-TB-induced host genes in the PBMCs. Based on the biological processes of the GO classification, differentially expressed mRNAs from the microarray analysis were classified into different functional categories. The GO analysis results show that, compared with the DS-TB group, the upregulated mRNAs in the MDR-TB group were mainly involved in organ morphogenesis, T-cell differentiation, regulation of muscle organ development, and negative T-cell selection. The downregulated mRNAs, on the other hand, were mainly involved in immune response, response to a virus or type I interferon, cellular response to type I interferon, type I interferon signaling pathways, and regulation of viral genome replication (Figure 6A and B). KEGG pathway analysis was utilized to examine the biological pathways involved with the differentially expressed mRNAs. The results show that, compared with the DS-TB group, the upregulated mRNAs in the MDR-TB group mainly participated in hematopoietic cell lineage, transforming growth factor-β (TGF-β) signaling pathway, Hippo signaling pathway, and primary immunodeficiency. The downregulated mRNAs, in contrast, were mainly involved in natural killer cell mediated cytotoxicity, antigen processing, presentation, and graft-versus-host disease (Figure 6C and D).
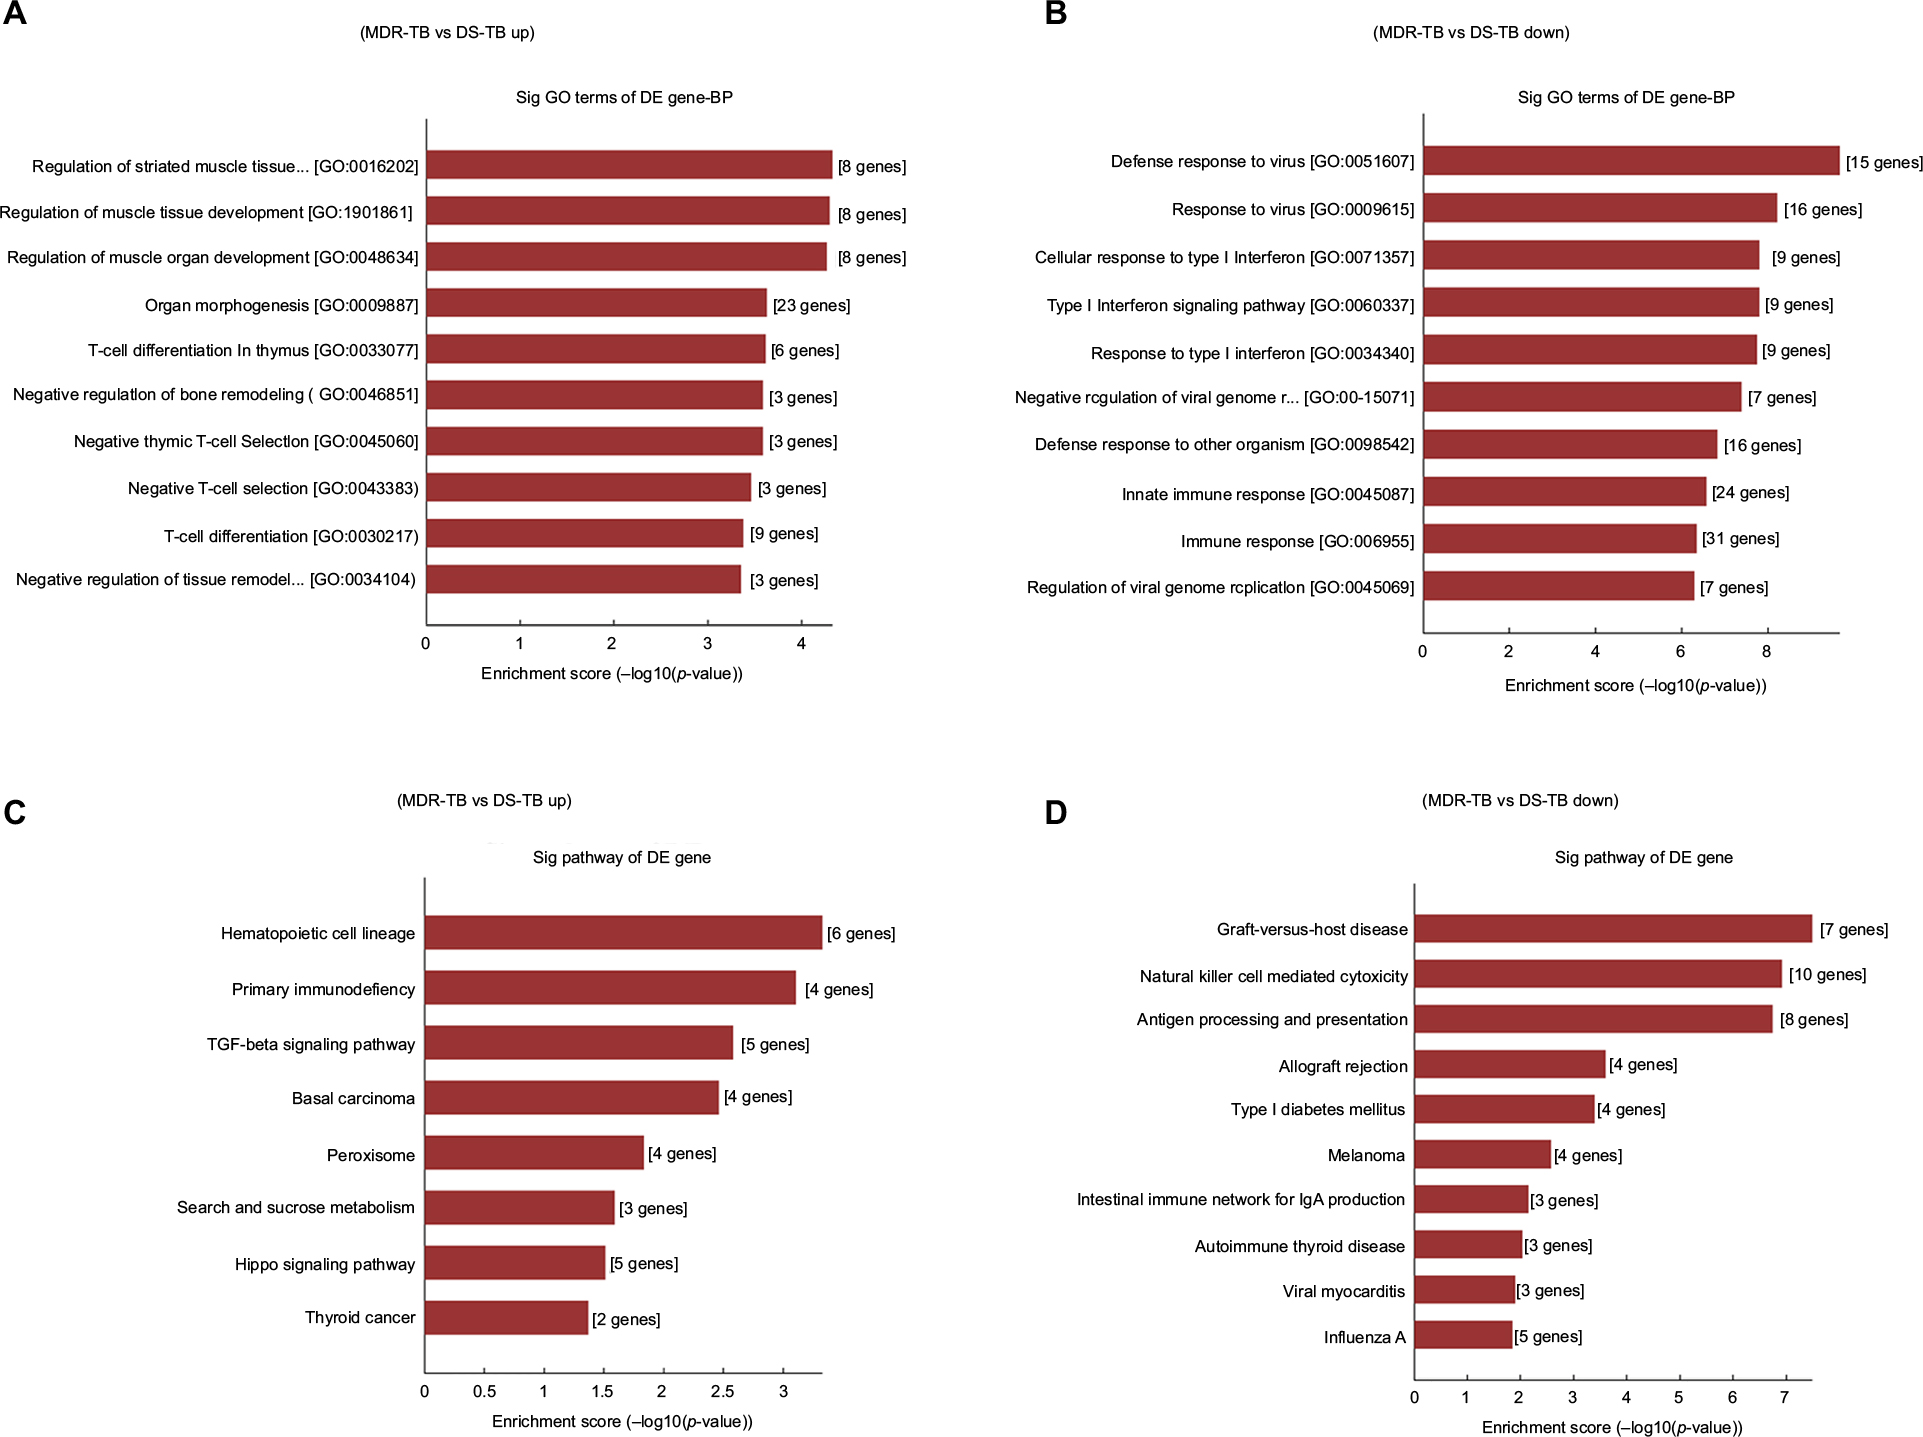 | Figure 6 GO and KEGG pathway analysis of differentially expressed mRNAs. The most significant GO terms for upregulated genes (A) and downregulated genes (B) in the MDR-TB group compared with the DS-TB group. The GO terms were filtered in accordance with p<0.05 and FDR <0.05. The top 10 significantly enriched GO terms are shown. The most significant pathways for upregulated genes (C) and downregulated genes (D) in the MDR-TB group compared with the DS-TB group. Abbreviations: MDR-TB, multidrug-resistant tuberculosis; DS-TB, drug-sensitive tuberculosis; ANOVA, analysis of variance; GO, Gene Ontology; KEGG, Kyoto Encyclopedia of Genes and Genomes; FDR, false discovery rate. |
Discussion
This study employed microarray analysis and in-depth data profiling to detect that a large number of lncRNAs and mRNAs were differentially expressed in PBMCs derived from patients with MDR-TB, patients with DS-TB, and HCs. Subsequent RT-qPCR results of the six randomly selected lncRNAs validated the microarray data, thus demonstrating high credibility for the microarray analysis of lncRNAs.
Patients with MDR-TB are likely infected with strains resistant to INH and RIF. The highest rates of MDR-TB are in Eastern Europe and central Asia, where MDR strains are nearly as common as pan-susceptible strains.20 According to clinical data analysis, liver dysfunction (decreased albumin), complement system activation (increased C3), and coagulation disorder (increased INR, fibrinogen) are present in patients with MDR-TB and patients with DS-TB (Table 2). In addition, significant differences in pre-albumin and INR levels existed between patients with MDR-TB and patients with DS-TB (p<0.05).
More lncRNAs and mRNAs were deregulated in the MDR-TB group than in the DS-TB group. Compared with the DS-TB group, 712 lncRNAs (393 upregulated) and 454 mRNAs (265 upregulated) were detected to be differentially expressed in the MDR-TB group (Figure 4). This finding suggests that transcriptional activity is more increased in MDR-TB than in DS-TB.
Moreover, 22 lncRNAs were differentially expressed between the three groups. Nineteen lncRNAs showed similar expression tendencies in both the MDR-TB and DS-TB groups compared with the HC group. This finding suggests that both MDR-TB and DS-TB might possess similar regulatory mechanisms. An increasing amount of new evidence demonstrates that many lncRNAs are associated with MDR of therapy failure in some cancers and infectious diseases. Recent data showed that plasmacytoma variant translocation 1 (PVT-1), an lncRNA, was highly expressed in gastric cancer tissues of cisplatin-resistant patients and cisplatin-resistant cells. Overexpression of PVT-1 in gastric carcinoma promotes the development of MDR, suggesting an efficacious target for reversing MDR in gastric cancer therapy.13 These data suggest that colorectal cancer-associated lncRNA is a crucial oncogenic regulator that is involved in CRC tumorigenesis and progression.14 Other data have suggested that the cisplatin-resistance ability of human endometrial cancer cells could be regulated by lncRNAs (specifically HOTAIR) through the regulation of autophagy by affecting Beclin-1, MDR, and P-gp expression.21 Our results show that CTD-2331D11.3 and AC079779.5 lncRNAs were upregulated in the MDR-TB group compared with the DS-TB and the HC groups (Figure 5B), suggesting that CTD-2331D11.3 and AC079779.5 may be important players in the pathogenesis of MDR-TB. Despite much progress, the functions of CTD-2331D11.3 and AC079779.5 are still not well defined and understood. Only a few lncRNAs have been found to be associated with MDR in various diseases, but their potential functions of most deregulated lncRNAs like LOC0101929497, LINC01496, CTC-518B2.10, and BRE-AS1 are still largely unknown.
GO analysis and KEGG pathway analysis can provide insights into the potential functions of the differentially expressed mRNAs and improve our understanding of the mechanisms of MDR-TB. In this study, most of the enriched upregulated and downregulated GO terms and pathway terms in the MDR-TB group and the DS-TB group differed, suggesting that virulent MDR-TB strains can evade immune system defenses via the regulation of particular pathways. For example, in our data, the TGF-β signaling and Hippo signaling pathways were activated in PBMCs derived from patients with MDR-TB (Figure 6C). Previous studies have indicated that TGF-β could play a prominent role in macrophage deactivation and the suppression of T-cell responses to Mtb.22 Furthermore, excessive TGF-β activity is a feature of active pulmonary TB23 and human mononuclear phagocytes infected or exposed to MTB or its components in vitro. In addition, a recent study has demonstrated that inhibiting the TGF-β pathway was critical for the persistence of Mtb.24 Intriguingly, the Hippo signaling pathway, which regulates autoimmunity via modulating the expression of Mtb-induced chemokines CXCL1 and CXCL2,25 was enriched in upregulated mRNAs in the MDR-TB group. Therefore, the outcome of immune cells (such as macrophages) infected with MDR-TB depends on the balance between the host defense of immune cells and bacterial immune subversion mechanisms.
In summary, this study describes differentially expressed lncRNAs and mRNAs and related signaling pathways between patients with MDR-TB, patients with DS-TB, and HCs. Our new findings shed light on our knowledge of MDR-TB pathogenesis. To the best of our knowledge, this is the first study to address lncRNA expression profiles in MDR-TB PBMCs. However, the primary limitation was the small number of MDR-TB/DS-TB patients, which may not reflect the real pathogenesis of the result in this study. Moreover, whether the results were universal phenomena in TB or some specific phenomena in certain conditions remains unclear and should be explored in the future. The conclusions, entirely based on the changes in lncRNAs levels and bioinformatics analysis, still need experimental identification and validation. Further studies focusing on the function of lncRNAs involved in MDR-TB may lead to new theories for MDR-TB pathogenesis. New and potential therapeutic targets in MDR-TB may also be developed in future.
Acknowledgments
We thank Professor Xiao Han for his critical reading of the manuscript and helpful comments. This work was supported by research grants from the Outstanding Young scholar Foundation of Jiangsu Province, China (BK20170106), the grant from Collaborative Research Project of Southeast University and Nanjing Medical University (2242017K3DN27), the Key Project supported by Medical Science and technology development Foundation, Nanjing Department of Health (ZKX13042), and the Foundation of Nanjing Medical Science and Technique Development (QRX11229).
Disclosure
The authors report no conflicts of interest in this work.
References
Wang C, Liu CM, Wei LL, et al. A group of novel serum diagnostic biomarkers for multidrug-resistant tuberculosis by iTRAQ-2D LC-MS/MS and solexa sequencing. Int J Biol Sci. 2016;12(2):246–256. | ||
Johnston J, Admon A, Ibrahim A, et al. Long term follow-up of drug resistant and drug susceptible tuberculosis contacts in a low incidence setting. BMC Infect Dis. 2012;12:266. | ||
Zumla A, George A, Sharma V, et al. The WHO 2014 global tuberculosis report – further to go. Lancet Glob Health. 2015;3(1):e10–e12. | ||
Loveday M, Cox H. Carpe diem (‘Seize the day’): building on the findings of the 2015 World Health Organization evaluation of the multidrug-resistant tuberculosis (MDR-TB) programme to make the most of shortened MDR-TB treatment in South Africa. S Afr Med J. 2017;107(3):176–177. | ||
Denholm J. The most recent report from the World Health Organization found that, worldwide, approximately 5% of new tuberculosis cases are caused by multidrug-resistant strains (MDR TB). J Travel Med. 2010;17(3):216. | ||
Comas I, Borrell S, Roetzer A, et al. Whole-genome sequencing of rifampicin-resistant Mycobacterium tuberculosis strains identifies compensatory mutations in RNA polymerase genes. Nat Genet. 2011;44(1):106–110. | ||
Pang Y, Lu J, Wang Y, Song Y, Wang S, Zhao Y. Study of the rifampin monoresistance mechanism in Mycobacterium tuberculosis. Antimicrob Agents Chemother. 2013;57(2): 893-900. | ||
Malardo T, Gardinassi LG, Moreira BP, et al. MicroRNA expression signatures in lungs of mice infected with Mycobacterium tuberculosis. Tuberculosis (Edinb). 2016;101:151–159. | ||
Corral-Fernandez NE, Cortes-Garcia JD, Bruno RS, et al. Analysis of transcription factors, microRNAs and cytokines involved in T lymphocyte differentiation in patients with tuberculosis after directly observed treatment short-course. Tuberculosis (Edinb). 2017;105:1–8. | ||
Lee JT. Epigenetic regulation by long noncoding RNAs. Science. 2012;338(6113):1435–1439. | ||
Li J, Chen C, Ma X, et al. Long noncoding RNA NRON contributes to HIV-1 latency by specifically inducing tat protein degradation. Nat Commun. 2016;7:11730. | ||
Yao Y, Jiang Q, Jiang L, et al. Lnc-SGK1 induced by Helicobacter pylori infection and highsalt diet promote Th2 and Th17 differentiation in human gastric cancer by SGK1/Jun B signaling. Oncotarget. 2016;7(15):20549–20560. | ||
Zhang XW, Bu P, Liu L, et al. Overexpression of long non-coding RNA PVT1 in gastric cancer cells promotes the development of multidrug resistance. Biochem Biophys Res Commun. 2015;462(3):227–232. | ||
Ma Y, Yang Y, Wang F, et al. Long non-coding RNA CCAL regulates colorectal cancer progression by activating Wnt/beta-catenin signalling pathway via suppression of activator protein 2alpha. Gut. 2016;65(9):1494–1504. | ||
Canetti G, Froman S, Grosset J, et al. Mycobacteria: Laboratory Methods for Testing Drug Sensitivity and Resistance. Bull World Health Organ. 1963;29:565–578. | ||
Cao L, Xiao PF, Tao YF, et al. Microarray profiling of bone marrow long non-coding RNA expression in Chinese pediatric acute myeloid leukemia patients. Oncol Rep. 2016;35(2):757–770. | ||
Alam-Faruque Y, Huntley RP, Khodiyar VK, et al. The impact of focused gene ontology curation of specific mammalian systems. PLoS One. 2011;6(12):e27541. | ||
Yi Z, Li J, Gao K, Fu Y. Identification of differentially expressed long non-coding RNAs in CD4+ T cells response to latent tuberculosis infection. J Infect. 2014;69(6):558–568. | ||
Huarte M, Guttman M, Feldser D, et al. A large intergenic noncoding RNA induced by p53 mediates global gene repression in the p53 response. Cell. 2010;142(3):409–419. | ||
Seung KJ, Keshavjee S, Rich ML. Multidrug-resistant tuberculosis and extensively drug-resistant tuberculosis. Cold Spring Harb Perspect Med. 2015;5(9):a017863. | ||
Sun MY, Zhu JY, Zhang CY, et al. Autophagy regulated by lncRNA HOTAIR contributes to the cisplatin-induced resistance in endometrial cancer cells. Biotechnol Lett. 2017;39(10):1477–1484. | ||
Toossi Z, Ellner JJ. The role of TGF beta in the pathogenesis of human tuberculosis. Clin Immunol Immunopathol. 1998;87(2):107–114. | ||
Aung H, Toossi Z, Mckenna SM, et al. Expression of transforming growth factor-β but not tumor necrosis factor-α, interferon-γ, and interleukin-4 in granulomatous lung lesions in tuberculosis. Tuber Lung Dis. 2000;80(2):61–67. | ||
Wu M, Aung H, Hirsch CS, Toossi Z. Inhibition of M. tuberculosis induced signaling by transforming growth factor-β in human mononuclear phagocytes. Scand J Immunol. 2012;75(3):301. | ||
Qin F, Tian J, Zhou D, Chen L. Mst1 and Mst2 kinases: regulations and diseases. Cell Biosci. 2013;3(1):31. |
Supplementary material
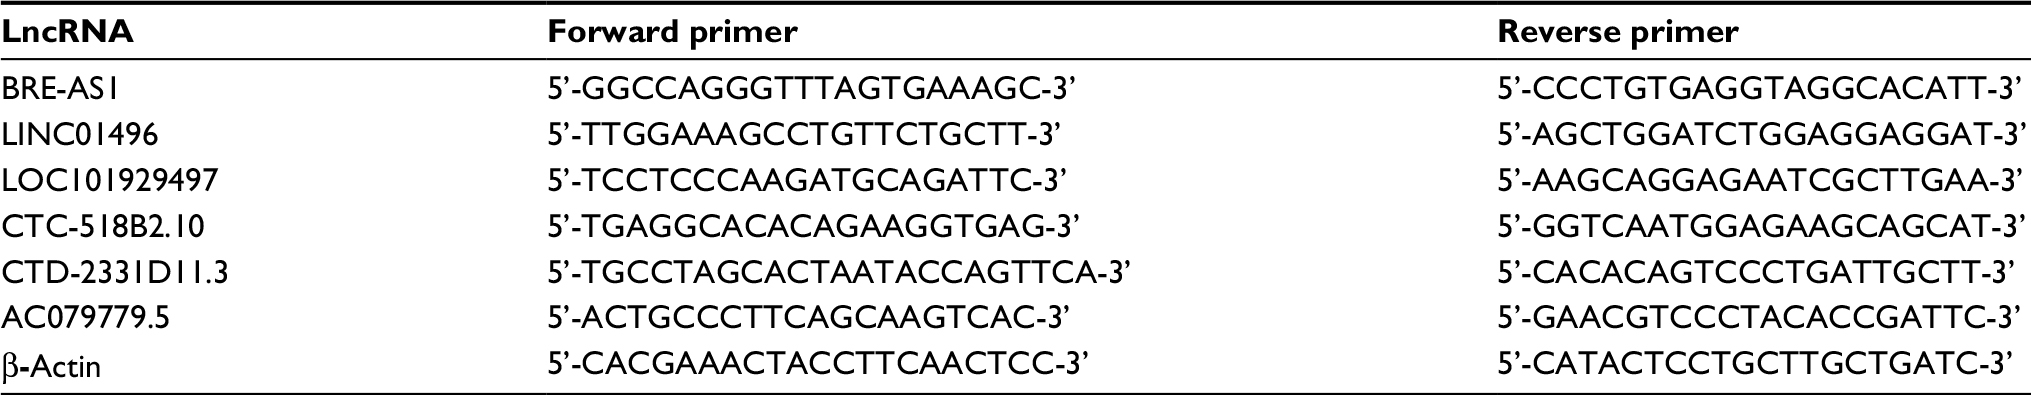 | Table S1 Primers used for qPCR Abbreviation: qPCR, quantitative polymerase chain reaction. |
 © 2018 The Author(s). This work is published and licensed by Dove Medical Press Limited. The full terms of this license are available at https://www.dovepress.com/terms.php and incorporate the Creative Commons Attribution - Non Commercial (unported, v3.0) License.
By accessing the work you hereby accept the Terms. Non-commercial uses of the work are permitted without any further permission from Dove Medical Press Limited, provided the work is properly attributed. For permission for commercial use of this work, please see paragraphs 4.2 and 5 of our Terms.
© 2018 The Author(s). This work is published and licensed by Dove Medical Press Limited. The full terms of this license are available at https://www.dovepress.com/terms.php and incorporate the Creative Commons Attribution - Non Commercial (unported, v3.0) License.
By accessing the work you hereby accept the Terms. Non-commercial uses of the work are permitted without any further permission from Dove Medical Press Limited, provided the work is properly attributed. For permission for commercial use of this work, please see paragraphs 4.2 and 5 of our Terms.