")
Back to Journals » Diabetes, Metabolic Syndrome and Obesity » Volume 13
Identifying Diabetic Macular Edema and Other Retinal Diseases by Optical Coherence Tomography Image and Multiscale Deep Learning
Authors Zhang Q, Liu Z, Li J, Liu G
Received 27 October 2020
Accepted for publication 21 November 2020
Published 4 December 2020 Volume 2020:13 Pages 4787—4800
DOI https://doi.org/10.2147/DMSO.S288419
Checked for plagiarism Yes
Review by Single anonymous peer review
Peer reviewer comments 3
Editor who approved publication: Professor Ming-Hui Zou
Quan Zhang,1,2 Zhiang Liu,3 Jiaxu Li,4 Guohua Liu1,2
1College of Electronic Information and Optical Engineering, Nankai University, Tianjin 300350, People’s Republic of China; 2Tianjin Key Laboratory of Optoelectronic Sensor and Sensing Network Technology, Nankai University, Tianjin 300350, People’s Republic of China; 3College of Computer Science, Nankai University, Tianjin 300350, People’s Republic of China; 4The Second Affiliated Hospital of Harbin Medical University, Department of Plastic and Cosmetic Surgery, Harbin, Heilongjiang, 150081, People’s Republic of China
Correspondence: Guohua Liu Tel +86-22-85358565
Email [email protected]
Purpose: Diabetic Macular Edema has been one of the research hotspots all over the world. But as the global population continues to grow, the number of OCT images requiring manual analysis is becoming increasingly unaffordable. Medical images are often fuzzy due to the inherent physical processes of acquiring them. It is difficult for traditional algorithms to use low-quality data. And traditional algorithms usually only provide diagnostic results, which makes the reliability and interpretability of the model face challenges. To solve problem above, we proposed a more intuitive and robust diagnosis model with self-enhancement ability and clinical triage patients’ ability.
Methods: We used 38,057 OCT images (Drusen, DME, CNV and Normal) to establish and evaluate the model. All data are OCT images of fundus retina. There were 37,457 samples in the training dataset and 600 samples in the validation dataset. In order to diagnose these images accurately, we propose a multiscale transfer learning algorithm. Firstly, the sample is sent to the automatic self-enhancement module for edge detection and enhancement. Then, the processed data are sent to the image diagnosis module to determine the disease type. This process makes more data more effective and can be accurately classified. Finally, we calculated the accuracy, precision, sensitivity and specificity of the model, and verified the performance of the model from the perspective of clinical application.
Results: The model proposed in this paper can provide the diagnosis results and display the detection targets more intuitively. The model reached 94.5% accuracy, 97.2% precision, 97.7% sensitivity and 97% specificity in the independent testing dataset.
Conclusion: Comparing the performance of relevant work and ablation test, our model achieved relatively good performance. It is proved that the model proposed in this paper has a stronger ability to recognize diseases even in the face of low-quality images. Experiment results also demonstrate its clinical referral capability. It can reduce the workload of medical staff and save the precious time of patients.
Keywords: optical coherence tomography, clinical triage, self-reinforcing, assisted diagnostics, deep learning, diabetic macular edema, retina diseases
Introduction
In recent years, with the continuous growth of the population base and the aging of the population, people have shown an urgent need for technologies that can improve human health.1–4 However, there are still many problems, such as uneven distribution of medical resources, high time and economic costs for training medical staff.5–8 Actually, the growth rate of medical resources is difficult to match the needs of the world.
In order to solve the above problems, medical assistant diagnosis systems based on artificial intelligence have been proposed. Artificial intelligence (AI) can achieve similar diagnostic performance to human experts in a short time. Therefore, it shows the potential to further promote medical diagnostic technology and patient health management technology. For example, Sasank Chilamkurthy et al used natural language models to identify brain CT images and automatically diagnose a variety of brain diseases.9 Diego Ardila et al used convolutional neural networks and CT images to automatically diagnosis lung cancer.10 Michael A. Schwemmer et al used a recurrent neural network to identify the power spectrum of human brain and controlled the motor to assist patients with missing actions to perform the desired action.11 David Sinton et al used a nonlinear model to analyze the integrity of DNA from the morphological perspective.12
According to statistics, the number of diabetic patients aged 18–99 in the world will rise to 693 million in 2045, and the number of deaths due to diabetes will reach 5 million each year. Moreover, diabetes complications also extremely affect people’s quality of life.13 Diabetic retinopathy is a serious disabling chronic disease and the main causes of blindness and visual impairment in diabetic patients. According to the study, 90% of cases can be prevented by early detection and treatment.14–18 At the same time, there are many other diseases that threaten human vision globally, such as choroidal neovascularization, drusen and so on. Fortunately, although these chronic diseases are very harmful, they all can be purposefully prevented and treated according to the specific conditions of the patient’s retina. Detecting the situation of the retina timely can effectively reduce the disability rate of the above diseases.19–23 Optical coherence tomography (OCT) images of the retina can accurately and effectively express the physiological structural characteristics of the retina, and it has become one of the important criteria for the diagnosis and treatment of eye diseases worldwide.24,25 As the aging of the world’s population continues to intensify and diabetes is becoming more prevalent, the number of OCT images that need to be manually analyzed has become increasingly unaffordable. Additionally, it takes a long time to train new professional doctors because it requires professional knowledge through daily practice. Furthermore, the diagnosis result depends on the professional level of the doctor, so there are some subjective factors. In many areas where medical resources are scarce, it is difficult for patients to get timely diagnosis. Therefore, it is proposed to provide an auxiliary diagnosis system that can automatically judge the patient’s health situation according to the retinal OCT image, which has positive significance for improving the global disease diagnosis level and the patient’s quality of life.
In order to achieve the above objectives, the two-dimensional convolutional neural network has been proposed. Compared to traditional physician training methods that require a lot of time and economic cost, two-dimensional convolutional neural network can use filters to quickly and automatically extract tiny features of images.26 The method of automatically extracting features overcomes the subjectivity and one-sidedness of traditional manual diagnosis, reduces the overall cost of obtaining medical resources, and alleviates the contradiction of uneven distribution of medical resources.
Although the AI has shown great potential in automatically diagnose diseases, its intuitiveness and interpretability are still facing challenges. The improvement of the performance of the auxiliary diagnosis system not only depends on the improvement of the diagnosis accuracy, but also should provide simpler and more intuitive information while providing recommended diagnosis results. This can really increase the clinical assistance capabilities of the auxiliary diagnosis system. Separating the scene into the detection target and background is an essential step in image interpretation. While automatically diagnosing the medical image, it accurately presents the contour and position of the detection target, which can effectively improve the auxiliary ability and application scope of the auxiliary diagnosis system, such as medical teaching. Adding visual markers to the detection target can improve the intuition and interpretability of the deep learning model.
Another challenge facing the AI diagnostic model is the amount of relevant data. Medical data resources are invaluable, and due to ethical review, disease types and other factors, it is often difficult to collect enough data just like other types of data. Too few samples will hinder the improvement of model performance. This may make the model over-learn the features of the training dataset, and it is difficult to show good generalization ability on the test dataset. One way to address the lack of relevant data is to take advantage of other resemble data, this method known as transfer learning.27 Different images often have the same primary features, such as points, lines, and so on. The similar data can be used to let the model learn the primary features of the image, then fix the learned primary features, use the target data to train the model, and let the model learn the advanced features of the target data, such as texture, shape, etc. Finally, the classifier is retrained with the new advanced features. Through backpropagation, the model can recognize images of a specific category. Instead of training a completely blank deep learning model, use the already trained primary features to further learn the advanced features of a specific image, and use these features to train the classifier. Fixing the primary weights can effectively reduce the number of weights that need to be trained. This method can not only reduce the number of training samples required by the model, but also reduce the demand for computing resources.
Another factor that limits the number of medical image samples is the quality of the medical image itself. Medical images are often blurred due to the inherent physical processes of acquiring them.28 Although human eyes can recognize the most subtle part of objects’ boundary even in the case of blur, this situation is a major challenge for the computer. In addition, the above problems further hinder the collection of effective training samples, which not only limits the further improvement of the performance of the auxiliary diagnostic system, but also limit the feasibility of its clinical application. Therefore, the edge of the retinal OCT image is critical for the diagnosis of disease types.29 Edge detection technology is often used for target detection and segmentation of life pictures, which can effectively detect and extract blurred edges in images. Due to the randomness of image quality, traditional edge detection methods relying on manual threshold selection are difficult to meet the clinical needs.30–32 This phenomenon shows that multiscale feature learning with adaptive ability should be used when processing medical image data. If we can propose an auxiliary diagnosis system with capability of automatically diagnosing diseases, enhancing data quality and visually expressing the state of the target, it will have positive significance for the improvement of the level of medical diagnosis. It can also enhance the interpretability and clinical applicability of artificial intelligence systems. Moreover, extracting edge can help us process effective information purposefully and ignore unimportant information. It can improve work efficiency to a certain extent.
This study strives to propose a high-speed and efficient multiscale transfer learning algorithm for image-based medical data processing to achieve efficient and accurate judgment of the disease type of each medical image. In addition, this algorithm could automatically represent the situation of the target and enhance data quality. We initially use the fundus OCT image data to illustrate the algorithm and discuss the performance of different algorithms at the same time.
In order to reduce the workload of clinicians, alleviate the contradiction of uneven distribution of medical resources, and enhance the auxiliary ability of traditional auxiliary diagnostic systems, we firstly proposed a computer-aided diagnosis model with automatic enhanced data, automatic detection of targets, and automatic diagnosis of disease types. Compared with the traditional auxiliary diagnosis model that only provides the diagnosis results, the algorithm we proposed in this paper has higher interpretability and feasibility. In the actual clinical process, the model also has the ability to triage patients, which can speed up the patient’s medical treatment process. Emergency patients could be quickly referred to a professional physician for timely treatment, which can effectively improve the chance of the patient being cured. For example, choroidal neovascularization (CNV) and diabetic macular edema (DME) are marked as emergency referrals. These conditions require urgent referral to an ophthalmologist for anti-VEGF treatment.33,34 If the treatment is delayed, irreversible visual impairment may occur. Drusen is not the urgent disease and is labeled as a routine referral. It has a low probability of irreversible visual impairment, so it is not very urgent.35 The principle of the assisted referral process is shown in Figure 1. Our work provides a possible path for the development of automated diagnosis, which is of positive significance to promote the improvement of comprehensive medical standards.
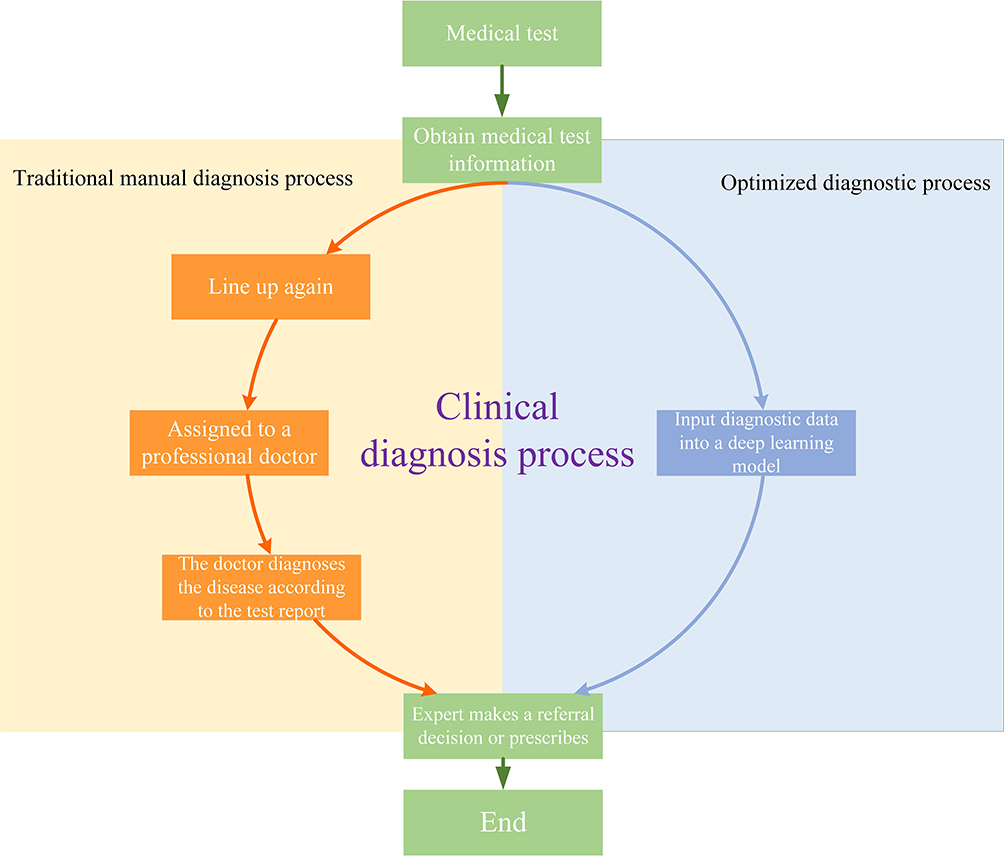 |
Figure 1 Auxiliary diagnostic system clinical diagnosis process and traditional diagnosis process. |
Method
The multiscale transfer learning algorithm (MTLA) model proposed in this paper consists of two parts: the self-enhancement model and the disease detection model. The workflow is shown in Figure 2.
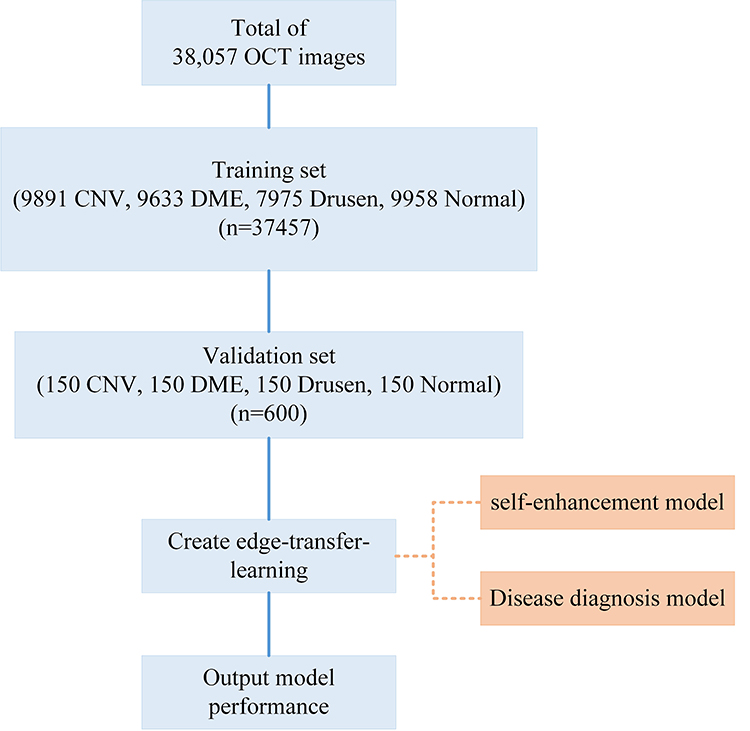 |
Figure 2 Workflow diagram (The workflow diagram shows the general flow of all experiments. First, the OCT image data is used to construct the self-enhancement model, the image with obvious edges can be obtained. At this time, the detection target is also intuitively represented. The enhanced data is used to train the disease diagnosis model. At last, the final performance of the model is evaluated by a completely independent data set. The multiscale transfer learning algorithm model consists of two parts: the self-enhancement model and the disease detection model.). |
Firstly, the self-enhancement model is constructed, which uses the multiscale feature learning method to detect and extract the edge of the diagnosis target, and clearly express the blurred edge. Then, the enhanced data are used to construct a disease diagnosis model which fuses transfer learning technology. The data is first processed by convolutional layers and pooling layers to extract features hidden in the original data. Finally, these features are sent to the classification layer, and the classification function can be used to automatically determine the type of disease. We used the confusion matrix, accuracy, precision, sensitivity and specificity to evaluate the performance of model. The working principle of the overall model is shown in Figure 3.
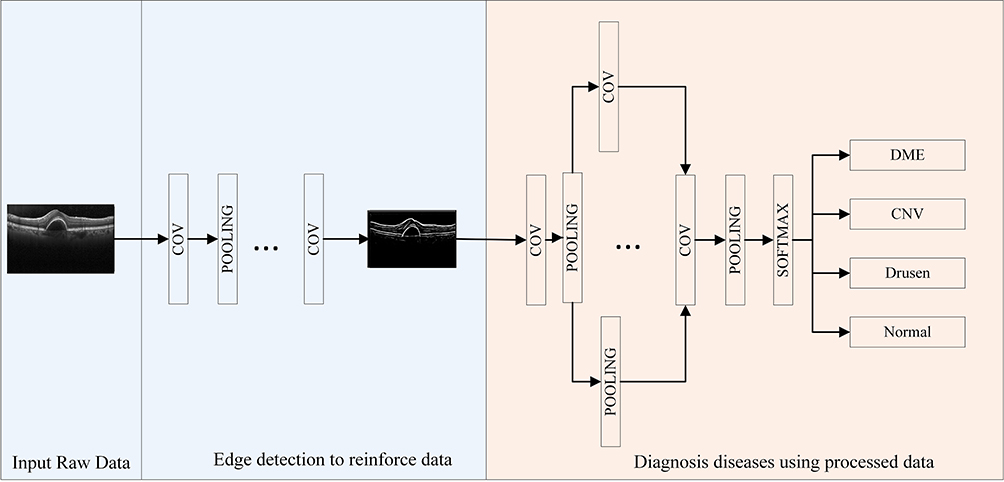 |
Figure 3 Working principle of the overall model (the primary features are obtained by training the model with other similar data and are fixed during the new training process. In addition, we use back propagation algorithms to relearn advanced features and classifiers in specific data. CNV means choroidal neovascularization, DME means diabetic macular edema, COV means convolution). |
Convolutional Neural Network (CNN)
The two-dimensional convolutional neural network is the core of all algorithms. Using filters, it can effectively and automatically learn the features hidden in the original image. The principle is shown in Figure 4.
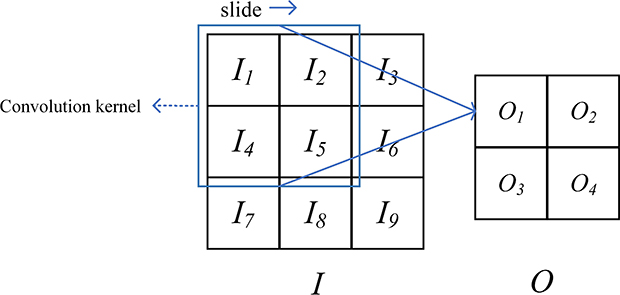 |
Figure 4 Convolutional neural network schematic diagram. |
The input image can be regarded as a pixel matrix, and each pixel is the input of a neuron. The filter represents the weight matrix, and the weight sharing method is adopted. Each filter learns a feature. The calculation principle is shown in Equation 1.

where O is the output to the j, kth neuron,  is the weight matrix, I is the input pixel, b is bias.
Adam Optimizer
In the experiment, the Adam optimizer is used to update the global parameters, and the Adam optimizer is different from the traditional stochastic gradient descent. The stochastic gradient descent maintains a single learning rate to update all weights, and the learning rate does not change during the training process. Adam calculates independent adaptive learning rates for different parameters by calculating the first-order moment estimation and second-order moment estimation of the gradient.36 The global parameter update rule is shown in Equation 2.
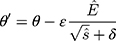
where  is the model parameter and
  is the updated parameter.
  is the learning rate.
  ,
,  are the first moment estimation and the second moment estimation of the target function gradient, respectively.
  is the corrected first moment estimation and
  is the corrected second moment estimation.
  is the minimum value that guarantees that the fraction is always meaningful.
The expressions of and
and are shown by Equation 3 and Equation 4.

where  is the gradient of the target function. Compared with the traditional gradient descent algorithm, Adam algorithm allows the model to converge to the minimum point more quickly.
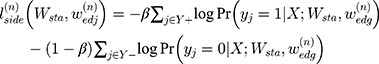
Multiscale Edge Detection Method
The two-dimensional convolution algorithm is the core of the above self-enhancement module. Since the contour of each medical image is different and unclear, multiscale feature learning is a better choice37,38 and the model principle is shown in Figure 5.
 |
Figure 5 Schematic diagram of the self-enhancement model (The solid line represents the weighted error from the output, and the dotted line represents the error from the next layer. Each scale has a direct relationship with the final output, so the model has a higher generalization ability.). |
Due to the use of multiscale features learning methods, it is necessary to comprehensively learn all the scale features to jointly evaluate the deviation between the edge found by the model and the actual edge. The smaller the above deviation, the closer the edge found by the model is to the actual edge, so the deviation can be regarded as a scale target function. The scale target function is shown in Equation 5.

where  is the target function.
  is the pixel matrix of the input image.
  is the ground truth of the corresponding image.
  is the weight of the output of the nth scale connected to the classifier, and
  is the weight of the other generally connected neural network.
  is the hyperparameter which means the weight of the nth scale loss function.
  is the loss of the nth scale as shown in Equation 6.
The expression of  is shown in Equation 7.

where  , respectively, represented edge pixels and the non-edge pixels.
To best utilize each scale output in the above structure, a weight blending layer is used to connect the prediction results of all scales together and learn the blending weights during the training. The loss function of the weight blending layer is shown in Equation 8.
Where is the parameter of weight blending layer and
  is the cross-entropy function. The final target function can be obtained as shown in Equation 9.
Experiment and Result
In this section, we will explain the data, process and results of our experiment.
Data Description
All data of this experiment were obtained from the fundus OCT image.35 A total of 38,057 samples were used to construct the AI algorithm in this paper. This is a retrospective study. All OCT images are acquired during routine treatment of adult patients. No additional burden on patients. All data are anonymized. There are no special exclusion criteria, such as gender, age, race, etc. All samples have been verified by more than two senior independent retina experts. Each expert has more than 20 years of clinical experience. The original dataset includes 207, 130 OCT images. This experiment randomly selected 38,057 images from the above dataset. All original data are from public reference.35 More details about the original data set and ethical disclosures can be obtained from reference.35 Specifically, in this paper, there were 37,457 samples in the training set and 600 samples in the validation set. The training data and the validation data are completely independent of each other. The training samples are used to train the self-enhancement model and the automatic diagnosis model in the multiscale transfer learning algorithm, and the validation data is used to evaluate the performance of the algorithm. The training set includes 9891 cases (26.41%) of CNV, 9633 cases (25.72%) of DME, 7975 cases (21.29%) of Drusen, and 9958 cases (26.58%) of Normal. The validation set includes 150 cases (25%) of CNV, 150 cases (25%) of DME, 150 cases (25%) of Drusen and 150 cases (25%) of Normal.
Edge Detection
This paper uses a Holistically-Nested Edge Detection structure based on the VGG16 structure.37 The experiment platform is a workstation with an NVIDIA GTX 1080 GPU in the system of Ubuntu 16.04. Moreover, the transfer learning method is used here. During the training process, the primary scale features are fixed. The primary scale features were trained by using the BSDS500 data set. The specific explanation is as follows. Due to the lack of human experts to mark the edges of tens of thousands of OCT images pixel by pixel. Therefore, this paper uses the transfer learning algorithm. Compared with complex natural scenes, the basic features of fundus lesions are contained in relatively complex natural scenes, such as points, lines, and textures. We use the images included in the BSD500 dataset and the corresponding edges truth (edge images) to train the edge detection model. The parameters of the pre-trained model are frozen, and then the model is used to extract the edges of the OCT image. The edge detection model is located in front of the disease diagnosis model. The purpose is to automatically enhance data quality, highlight fuzzy edges, visually display the detecting targets and increase the interpretability, intuitiveness and clinical feasibility of the overall model. At the same time, this part is used to increase the recognition ability of fuzzy edge. The results of edge extraction are shown in Figure 6. This proves that the model can recognize the edge which is not very clear.
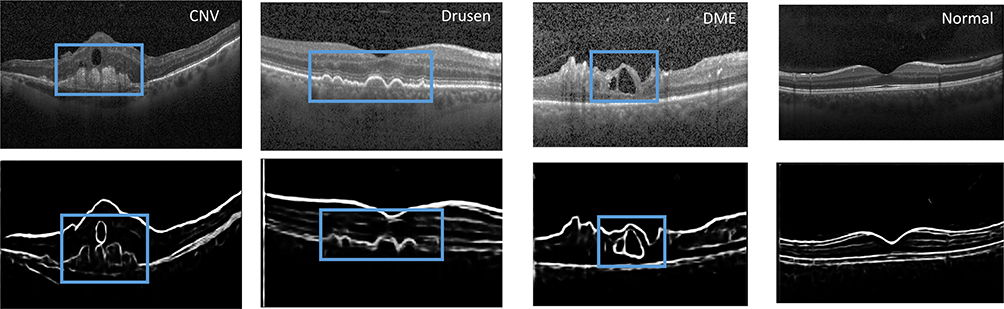 |
Figure 6 Edge detection results of the fundus with four disease types respectively (the upper four images are the original image, and the lower four images are the automatically detected edge images. It can be clearly seen that some blur contours and disease features are highlighted which increases intuitiveness and interpretability of the model. Detection edge can help us process effective information purposefully and ignore unimportant information. CNV means choroidal neovascularization, DME means diabetic macular edema). |
CNV is a disease caused by the proliferation of choroidal capillaries, which usually occurs in the macula. Its lesions have the characteristics of deep growth, easy bleeding, large volume and central location in the macula. Drusen is a colloidal or transparent body. It is a degenerative disease that occurs in the choroid and retina. Generally, it has binocular symmetry. It is caused by abnormal deposition of abnormal metabolites of pigment epithelial cells on the retina. DME refers to the thickening or hard exudation of the retina caused by the accumulation of extracellular fluid within the diameter of the optic disc in the fovea of the macula due to diabetes. The above characteristics are important basis for the diagnosis of eye diseases. Therefore, enhancing the fuzzy edges of low-quality images has positive significance for the improvement of artificial intelligence model performance. This can make the model have stronger clinical application potential.
It can be seen from the experimental results that our proposed method can effectively extract and enhance the edges of samples with different health conditions. This makes some low-quality fuzzy images recognizable. And it may have higher clinical applicability. In addition, it automatically displays and locates the lesions, which also increases the intuitiveness and interpretability of the model to a certain extent.
Disease Diagnosis Model
The purpose of the disease diagnosis model is automatically diagnosing disease. Confusion matrix, sensitivity, specificity, precision and accuracy curve are used to evaluate the final performance of the model. The convolutional neural network is the core of the model. In order to achieve higher results with less data, we use transfer learning algorithm. The network structure used in the experiment is the Inception V3. The Inception V3 model has been trained by Google with the ImageNet dataset. ImageNet includes more than 14 million samples and more than 20,000 categories, so the Inception V3 model already has the ability to extract multiple features.39 Since the primary features between the images are similar, in this experiment, the primary features of Inception V3 are fixed and only the advanced features and classifiers need to be trained based on the new specific data. The transfer learning algorithm can effectively reduce the time of training the new model while reducing the need for the amount of the original data.
During the training process, the Adam algorithm is applied to the update of the model parameters, where =0.001,
 =0.9,
=0.9, =0.999,
 =
= . In order to increase the generalization ability of the model, the label of the disease type is encoded as the one-hot form, which means the classifier output is 4 dimensions. Each dimension represents a disease. When the model is diagnosing, only the neurons of the corresponding disease type are activated (output is 1), and the remaining neurons are set to zero. Since the model identifies multiple diseases, the classification function uses the softmax function.40 At the same time, to ensure the learning speed of the model, the cross-entropy function is used as the loss function. Additionally, model performance is evaluated by a completely independent testing dataset. In the testing set, we balance the number of samples for all types of diseases to ensure that all types of diseases are validated with the same probability.
In the end, the model achieved 94.5% accuracy in the testing dataset. During the experiment, we found that the performance of the training set did not perform better than the verification set. This is because the training set includes images with more noise and lower quality, which can help the model to reduce over-fitting and increase generalization ability. We also conducted ablation experiments. When the edge detection model is not used, the model achieves 93% ACC in the same test dataset. We infer that this is due to the lack of edge detection model, the fuzzy edges of some low-quality images cannot be well recognized by the model. Edge is an important basis to judge the health of fundus. Without the edge detection module proposed in this paper, the fuzzy edge of low-quality image cannot be enhanced, which limits the performance of the model. According to the accuracy of the model, the above model can not only judge the known samples well, but also can judge the unknown samples and has high robustness. Although the performance of the validation set fluctuates greatly, it still converges with the training set converges. After the performance of the training set is stable, the model can still show high performance in the validation set, and the performance of the validation set does not decrease with the increase of the performance of the training set. This phenomenon indicates that the model has not been over-fitting. Furthermore, in order to verify the model’s triage ability, we studied the ability of the model to identify “emergency referrals” (emergency referrals: CNV, DME, non-emergency referrals: Drusen, Normal) as shown in Figure 7. Figure 8 shows the accuracy curve of the model.
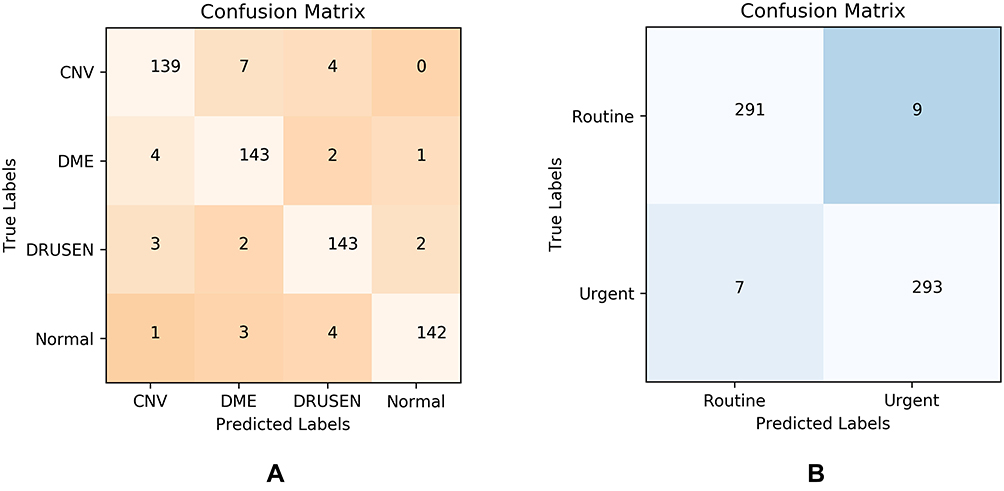 |
Figure 7 Confusion matrixes of the model and referral ability. (A) Shows the confusion matrix of automatically diagnosing multiple diseases with the model on the testing set. (B) Shows the confusion matrix of the model’s ability to refer to the testing set, and this confusion matrix could give the model specificity and sensitivity to the referral problem. CNV means choroidal neovascularization, DME means diabetic macular edema). |
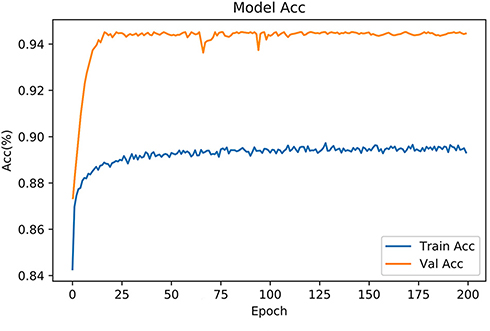 |
Figure 8 The accuracy curve of the model (ACC means accuracy). |
As shown in Figure 7A, the model exhibited similar performance in identifying different fundus diseases, and no performance imbalance was observed. As shown in Figure 7B, the model can achieve 97.7% sensitivity, 97% specificity and 97.02% precision. In summary, we can prove that our multiscale transfer learning algorithm has achieved good results. It can automatically and accurately diagnose a variety of eye health conditions, even in the absence of samples in the training set. Moreover, the model has a good referral ability, which helps to improve the efficiency of patients’ medical treatment and reduce the disability rate of acute diseases.
Figure 7 proves that the multiscale transfer learning algorithm proposed in this article can accurately use OCT images to judge the health of patients. Figure 8 shows that the performance of the model in the independent test set did not decrease with the continuous improvement of the training set performance, so the model did not overfit. When the self-enhancement model is not used, the model achieves an ACC of 93% in the same test set. This proves that multiscale transfer learning algorithm has the potential to identify unclear images in the clinic. In the discussion section, we will compare more similar work.
Discussion
In this study, we systematically proposed an AI diagnostic system with automatic display of detection targets and self-enhanced data quality functions which can automatically diagnose retinal health using retinal OCT images. The multiscale transfer learning algorithm proposed not only accurately and automatically diagnoses four fundus retinal diseases, but also automatically enhances data quality and displays detection targets. As shown in Figure 6, the proposed model can accurately mark the detection target and enhance the fuzzy edges caused by physical factors. Since the target edge plays a crucial role in the judgment of the disease types, enhancing the target edge can improve the performance of the disease diagnosis model. In addition, highlighting significant features and weakening secondary information expression can effectively reduce system demand of computation resource. Compared with traditional auxiliary diagnostic systems, the above proposed model is more intuitive, interpretable and clinically implementable. From the experimental results, it can be seen that the model can achieve better performance regardless of the training set or the testing set. In a completely independent verification set, the model reached 94.5% ACC (150 cases of CNV (25%), 150 cases of DME (25%), 150 cases of Drusen (25%), 150 cases of normal (25%)). As shown in Figure 6A, the model shows similar performance in judging different types of diseases, and no unevenness occurs. Therefore, it can be proved that our proposed model has good generalization ability, and it can still achieve better performance in the face of data that does not exist in the training set. During training, we found the performance of the training set does not exceed the testing set. This is because, in order to improve the generalization ability of the model, the training set contains a large number of low-quality, noisy OCT images of the fundus. The ablation experiments were also implemented. The artificial intelligence model without edge detection model reached 93% ACC in the same test dataset. The edge of the image of the lesion is an important basis for judging the health of the sample. When the edge detection model is lost, the model no longer has the ability to enhance the blurred edge of the image. The fuzzy edges of some low-quality images are difficult to learn only by the convolution kernel. This phenomenon proves that the model proposed in this paper has the potential to diagnose low-quality images that exist in the clinic. Furthermore, the model proposed in this paper not only has a better ability to automatically diagnose diseases, but also has the function of referral in the clinical process. Since CNV and DME require timely anti-VEGF treatment, if treatment is delayed, irreversible visual impairment may occur. Therefore, CNV and DME are marked as “emergency referrals”, and patients with these two diseases need to be rushed to a professional doctor for professional treatment. As shown in Figure 7B, the model can achieve 97.7% sensitivity, 97% specificity and 97.2% precision, which can prove that the model not only achieves better diagnostic accuracy, but also has a good ability to distinguish and referral different health condition. It has a high degree of credibility. We proposed an AI system with automatic display and detection targets, self-enhancing data quality, and automatic diagnosis of retinal health. It can alleviate the problem of uneven distribution of medical resources and improve the medical level in areas with insufficient medical resources. It also alleviates the problem of more difficult data collection due to access methods. Speed up the patient’s medical treatment process, save golden treatment time for emergency patients, and improve the cure rate of the disease. Most importantly, the model achieved better results in less time, alleviating the lack of medical resources caused by the economic and time costs of training professional physicians.
In a very limited range, we found some similar works, and the performance of related works were compared. Oscar Perdomo et al used a pre-trained convolutional neural network to classify diabetes-related retinal diseases.41 Turimerla Pratap et al used convolutional neural networks to diagnose cataracts.42 Tao Li et al used a deep learning model to screen diabetic retinopathy.43 Rory Sayres et al used a convolutional neural network to grade diabetic retinopathy.44 Valentina Bellemo et al combined VGGNET and residual neural network structure to diagnose diabetic retinopathy.45 Filippo Arcadu et al used Inception-V3 model to predict diabetic macular thickening.46 Genevieve C. Y. Chan et al used AlexNet and SVM to diagnosis DME.47 Muhammad Awais et al used pre-trained VGG16 model to detect DME.48 Thomas Schlegl et al used convolutional neural network with an encoder-decoder architecture to distinguish the three eye diseases,49 as shown in Table 1.
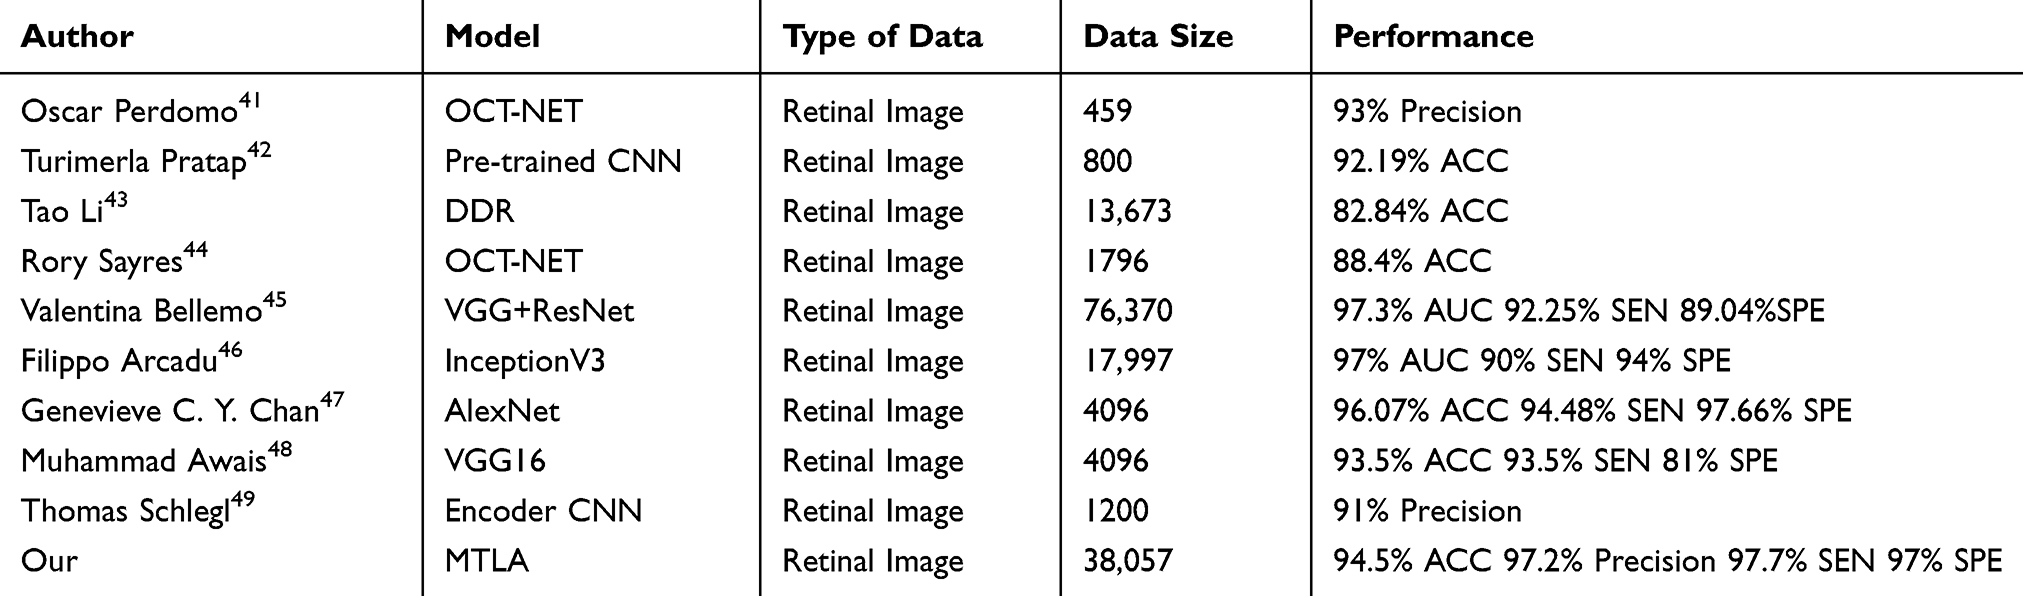 |
Table 1 Different Model Performance (Acc Means Ac Curacy, AUC Means Area Under Curve, SEN Means Sensitivity, SPE Means Specificity) |
All the above work has achieved a better performance in the testing set. These works use deep learning technology to accurately and automatically diagnose eye diseases. The use of transfer learning technology accelerates the operating efficiency of the model. Deep learning technology can automatically extract the semantic features contained in the image, and use these semantic features to automatically determine the health of the patient’s eyes. Although the above work shows the great potential of artificial intelligence technology, it still needs to be further studied. The model proposed integrates multiscale feature recognition technology, which can effectively strengthen the fuzzy edges after reading the original clinical images. It has higher automatic assistance capability. Compared with the existing methods, the proposed method is more feasible.
Furthermore, it is should not improve the performance of assistant diagnosis system only depend on improving its accuracy.50 Because the “black-box” character of deep learning model, its intuition and interpretability remain faces challenges. This undoubtedly reduces the reliability and interpretability of some auxiliary diagnostic models that only provide diagnostic results. Detection target extraction is an essential step in image interpretation. While using medical image data to diagnose diseases automatically, the contour and position of detection targets can be presented accurately, which can effectively improve the intuitiveness, interpretability and application scope of the auxiliary diagnostic system. The multiscale transfer learning algorithm proposed in this paper not only provides accurate and robust diagnostic results, but also accurately presents the contour and location of the detection target, which improves the interpretability and intuitiveness of the deep learning model and further increases its credibility. The main features of different diseases have been highlighted. Our model does not diagnose a single disease, but can diagnose multiple eye diseases at the same time. Compared with the auxiliary diagnosis model that can only diagnose one disease, the model in this paper has higher practical application potential.
Our real purpose is not to propose an AI system that only provides diagnostic results, but to effectively save the time required by the clinical diagnosis process of patients through the AI model. For some urgent diseases, saving the golden treatment time can effectively increase the cure rate of the disease and reduce the disability rate. Therefore, we also explored the ability of the model in this paper to clinically triage patients. It achieved better performance, as shown in Figure 7B.
Although the model shows great potential, it still has limitations. One limitation is the type of data we use, which only includes image data. In the actual clinical diagnosis process, age, gender, medical history and other factors will also be related to the judgment of the disease. The disease may also be related to other medical information not included in the training set. Another limitation is the training method. Due to the limitation of computing resources and data resources, although the transfer learning algorithm used in this paper can achieve not bad performance in a short time, its performance is still difficult to exceed the completely blank model trained with tens of millions of high-quality data. This is due to the fact that although the same type of data has similar primary characteristics, these characteristics do not exactly match the specific type of data, which is also a factor limiting further improvement of model performance. Although the edge features of complex scenery can be used to extract the edges of OCT images well. But if it is possible to train a completely blank neural network using edge images with pixel-by-pixel labeling by human experts, the model may be able to achieve higher performance. Making the model have the ability to recognize more diseases also requires further research. For example, cystoid macular edema associated with retinal vein occlusion, which looks like DME, is not involved. For similar diseases, the edge extraction model needs to be further improved, which is also one of the limitations of this method. In future work, we will study how to make models capable of recognizing cross-media information, such as using image-based information and text-based medical records simultaneously. We will also work hard to collect edge images marked by human experts. In addition, the model’s ability to distinguish a certain disease needs to be further studied. Because this experiment explores comprehensive disease diagnosis, rather than distinguishing a certain disease sample from a healthy sample. So instead of exploring the receiver operating characteristic curve of a single disease, we gave a confusion matrix. Receiver operating characteristic curve is more suitable for verifying the ability to diagnose a single disease. But through experiments, we found that the model has different recognition capabilities for different diseases. Therefore, we will use receiver operating characteristic curve to explore the diagnostic capabilities of the model for different diseases in the future work. Some diseases with similar image features will also be further studied, such as cystoid macular edema associated with retinal vein occlusion. At the same time, we will also further study the explanation of the disease mechanism by artificial intelligence models, such as occlusion experiments, multi-center randomized controls, etc. Moreover, in order to further improve the comprehensive performance of the model, it is necessary to study the auxiliary diagnostic model which is faster, more capable using less resources.
Conclusion
In this paper, a multiscale transfer learning algorithm is proposed to automatically determine the health status of samples using fundus OCT images. The model can not only provide robust and accurate diagnostic results (94.5% ACC), but also automatically extract detection targets and enhance data quality. Highlighting main features and weakening secondary information, which save computation resource. Compared with the existing auxiliary diagnostic model, it is more intuitive, interpretable and clinically feasible, and has stronger auxiliary ability. At the same time, the performance of the proposed model and similar work is compared and the possible reasons for the performance difference are discussed. In the clinical process, the model also has the ability of referral, which can effectively and accurately distinguish the severity of the disease. The model proposed reaching 97.7% sensitivity, 97% specificity and 97.02% precision in the testing dataset.
The above model can effectively alleviate the shortage of medical resources caused by the time and high economic cost of training professional doctors. It alleviates the contradiction of uneven distribution of medical resources, reduces the necessary time of clinical diagnosis, saves the golden treatment time of emergency patients, and guarantees the cure rate of patients.
Future work revolves around improving the performance of the assistive diagnostic system. To further improve the accuracy of the model, we will consider how to input more types of data, such as the patient’s medical history, gender, age, etc. To further improve the diagnostic capability of the model, we will next study how to use cross-media diagnostic data as input to the training model. In order to further explore the differences in the performance of the model to diagnose different diseases. We will also analyze the model’s ability to distinguish different diseases from more perspectives, such as using a binary classification receiver operating characteristic curve, occlusion test. Some similar diseases will also be studied. Not only in the medical field, but also from an engineering point of view, we will further study the optimization methods of the auxiliary diagnostic system, such as how to make the model achieve better performance with less computing resources.
Data Sharing Statement
The raw data used in this paper can be obtained from the public dataset: https://doi.org/10.17632/rscbjbr9sj.3.
Ethical Approval
All procedures performed in studies involving human participants were in accordance with the ethical standards of the Nankai University and with the 1964 Helsinki declaration and its later amendments or comparable ethical standards. The study was approved by the institutional review board of the Nankai University. Informed consent was waived in this retrospective study.
Author Contributions
All authors contributed to data analysis, drafting or revising the article, have agreed on the journal to which the article will be submitted, gave final approval of the version to be published, and agree to be accountable for all aspects of the work.
Funding
This work was funded by the National Natural Science Foundation of China (61771261).
Disclosure
The authors declare no conflicts of interest.
References
1. Torkamani A, Topol E. Polygenic risk scores expand to obesity. Cell. 2019;177(3):518–520. doi:10.1016/j.cell.2019.03.051
2. Shenghui H, Norman E. Sharpless senescence in health and disease. Cell. 2017;169(6):1000–1011. doi:10.1016/j.cell.2017.05.015
3. Polubriaginof FCG, Vanguri R, Quinnies K, et al. Disease heritability inferred from familial relationships reported in medical records. Cell. 2018;173(7):1692–1704. doi:10.1016/j.cell.2018.04.032
4. Dwolatzky T, Brodsky J, Azaiza F, et al. Coming of age: health-care challenges of an ageing population in Israel. Lancet. 2017;389(10088):2542–2550. doi:10.1016/S0140-6736(17)30789-4
5. Manolio TA, Rowley R, Williams MS, et al. Opportunities, resources, and techniques for implementing genomics in clinical care. Lancet. 2019;394(10197):511–520. doi:10.1016/S0140-6736(19)31140-7
6. Abeysinghe S, Leppold C, Ozaki A, et al. Disappearing everyday materials: the displacement of medical resources following disaster in Fukushima, Japan. Soc Sci Med. 2017;191:117–124. doi:10.1016/j.socscimed.2017.09.011
7. WHO Ebola Response Team. After ebola in West Africa — unpredictable risks, preventable epidemics. N Engl J Med. 2016;375(6):587–596. doi:10.1056/NEJMsr1513109
8. Mayosi BM, Benatar SR. Health and health care in South Africa — 20 years after Mandela. N Engl J Med. 2014;371(14):1344–1353. doi:10.1056/NEJMsr1405012
9. Chilamkurthy S, Ghosh R, Tanamala S, et al. Deep learning algorithms for detection of critical findings in head CT scans: a retrospective study. Lancet. 2018;392(10162):2388–2396. doi:10.1016/S0140-6736(18)31645-3
10. Ardila D, Kiraly AP, Bharadwaj S, et al. End-to-end lung cancer screening with three-dimensional deep learning on low-dose chest computed tomography. Nat Med. 2019;25(6):954–961. doi:10.1038/s41591-019-0447-x
11. Schwemmer Michael A, Skomrock Nicholas D, Sederberg Per B, et al. Meeting brain–computer interface user performance expectations using a deep neural network decoding framework. Nat Med. 2018;24(11):1669. doi:10.1038/s41591-018-0171-y
12. Wang Y, Riordon J, Kong T. Prediction of DNA integrity from morphological parameters using a single‐sperm DNA fragmentation index assay. Adv Sci. 2019;6(15):1900712. doi:10.1002/advs.201900712
13. Cho NH, Shaw JE, Karuranga S, et al. IDF diabetes atlas: global estimates of diabetes prevalence for 2017 and projections for 2045. Diabetes Res Clin Pract. 2018;138:271–281. doi:10.1016/j.diabres.2018.02.023
14. Ting DSW, Cheung CY, Lim G, et al. Development and validation of a deep learning system for diabetic retinopathy and related eye diseases using retinal images from multiethnic populations with diabetes. JAMA. 2017;318(22):2211–2223. doi:10.1001/jama.2017.18152
15. Flaxman SR, Bourne RRA, Resnikoff S, et al. Global causes of blindness and distance vision impairment 1990–2020: a systematic review and meta-analysis. Lancet Glob Health. 2017;5(12):e1221–e1234. doi:10.1016/S2214-109X(17)30393-5
16. Tilahun M, Gobena T, Dereje D, et al. Prevalence of Diabetic retinopathy and its associated factors among diabetic patients at Debre Markos referral hospital, Northwest Ethiopia, 2019: hospital-based cross-sectional study. Diabetes Metab Syndr Obes. 2020;13:2179–2187. doi:10.2147/DMSO.S260694
17. Maturi RK, Glassman AR, Liu D, et al. Effect of adding dexamethasone to continued ranibizumab treatment in patients with persistent diabetic macular edema: a DRCR network phase 2 randomized clinical trial. JAMA Ophthalmol. 2018;136(1):29–38. doi:10.1001/jamaophthalmol.2017.4914
18. Shan K, Liu C, Liu B-H, et al. Circular noncoding RNA HIPK3 mediates retinal vascular dysfunction in diabetes mellitus. Circulation. 2017;136(17):1629–1642. doi:10.1161/CIRCULATIONAHA.117.029004
19. Sung IS, Park SY, Jeong K-Y, et al. Investigation of the preventive effect of calcium on inflammation-mediated choroidal neovascularization. Life Sci. 2019;233:116727. doi:10.1016/j.lfs.2019.116727
20. LeBlanc ME, Wang W, Ji Y, et al. Secretogranin III as a novel target for the therapy of choroidal neovascularization. Exp Eye Res. 2019;181:120–126. doi:10.1016/j.exer.2019.01.009
21. Askou AL, Alsing S, Benckendorff JNE, et al. Suppression of choroidal neovascularization by AAV-based dual-acting antiangiogenic gene therapy. Mol Ther Nucleic Acids. 2019;16:38–50. doi:10.1016/j.omtn.2019.01.012
22. Nakagami Y, Hatano E, Chayama Y, et al. An anti-PLVAP antibody suppresses laser-induced choroidal neovascularization in monkeys. Eur J Pharmacol. 2019;854:240–246. doi:10.1016/j.ejphar.2019.04.035
23. Bergen AA, Arya S, Koster C, et al. On the origin of proteins in human drusen: the meet, greet and stick hypothesis. Prog Retin Eye Res. 2019;70:55–84. doi:10.1016/j.preteyeres.2018.12.003
24. Liu L, Edmunds B, Takusagawa HL, et al. Projection-resolved optical coherence tomography angiography of the peripapillary retina in glaucoma. Am J Ophthalmol. 2019;207:99–109. doi:10.1016/j.ajo.2019.05.024
25. Ito Y, Sasaki M, Takahashi H, et al. Quantitative assessment of the retina using OCT and associations with cognitive function. Ophthalmology. 2020;127(1):107–118. doi:10.1016/j.ophtha.2019.05.021
26. Sarıgül M, Ozyildirim BM, Avci M. Differential convolutional neural network. Neural Netw. 2019;116:279–287. doi:10.1016/j.neunet.2019.04.025
27. Zhou JT, Pan SJ, Tsang IW. A deep learning framework for hybrid heterogeneous transfer learning. Artif Intell. 2019;275:310–328. doi:10.1016/j.artint.2019.06.001
28. de la Torre J, Valls A, Puig D. A deep learning interpretable classifier for diabetic retinopathy disease grading. Neurocomputing. 2020;396:465–476. doi:10.1016/j.neucom.2018.07.102
29. Girish GN, Thakur B, Chowdhury SR, et al. Segmentation of intra-retinal cysts from optical coherence tomography images using a fully convolutional neural network model. IEEE J Biomed Health Inform. 2019;23(1):296–304. doi:10.1109/JBHI.2018.2810379
30. Niu S, Chen Q, Sisternes L, et al. Automated detection of foveal center in SD‐OCT images using the saliency of retinal thickness maps. Med Phys. 2017;44(12):6390–6403. doi:10.1002/mp.12614
31. Fang L, Wang C, Shutao L, et al. Automatic classification of retinal three-dimensional optical coherence tomography images using principal component analysis network with composite kernels. J Biomed Opt. 2017;22(11):116011. doi:10.1117/1.JBO.22.11.116011
32. Yoshioka N, Zangerl B, Nivison-Smith L, et al. Pattern recognition analysis of age-related retinal ganglion cell signatures in the human eye. Invest Ophthalmol Vis Sci. 2017;58(7):3086–3099. doi:10.1167/iovs.17-21450
33. Chakravarthy U, Harding SP, Rogers CA, et al. Alternative treatments to inhibit VEGF in age-related choroidal neovascularisation: 2-year findings of the IVAN randomised controlled trial. Lancet. 2013;382(9900):1258–1267.
34. Croci DO, Cerliani JP, Dalotto-Moreno T, et al. Glycosylation-dependent lectin-receptor interactions preserve angiogenesis in anti-VEGF refractory tumors. Cell. 2014;156(4):744–758. doi:10.1016/j.cell.2014.01.043
35. Kermany DS, Goldbaum M, Cai W, et al. Identifying medical diagnoses and treatable diseases by image-based deep learning. Cell. 2018;172(5):1122–1131.e9. doi:10.1016/j.cell.2018.02.010
36. Kingma DP, Jimmy B. A method for stochastic optimization. arXiv Preprint. 2014;arXiv:
37. Xie S, Tu Z. Holistically-nested edge detection. Proc IEEE Int Conf Comput Vis. 2015;1395–1403.
38. Roth HR, Lu L, Lay N, et al. Spatial aggregation of holistically-nested convolutional neural networks for automated pancreas localization and segmentation. Med Image Anal. 2018;45:94–107. doi:10.1016/j.media.2018.01.006
39. Szegedy C, Vanhoucke V, Ioffe S, et al. Rethinking the inception architecture for computer vision. arXiv Preprint. 2016;arXiv:
40. Liu W, Wen Y, Zhiding Y, et al. Large-margin softmax loss for convolutional neural networks. ICML. 2016;2(3):7.
41. Perdomo O, Rios H, Rodríguez FJ, et al. Classification of diabetes-related retinal diseases using a deep learning approach in optical coherence tomography. Comput Methods Programs Biomed. 2019;178:181–189. doi:10.1016/j.cmpb.2019.06.016
42. Pratap T, Kokil P. Computer-aided diagnosis of cataract using deep transfer learning. Biomed Signal Process Control. 2019;53:101533. doi:10.1016/j.bspc.2019.04.010
43. Tao L, Gao Y, Wang K, et al. Diagnostic assessment of deep learning algorithms for diabetic retinopathy screening. Inf Sci (Ny). 2019;501:511–522. doi:10.1016/j.ins.2019.06.011
44. Sayres R, Taly A, Rahimy E, et al. Using a deep learning algorithm and integrated gradients explanation to assist grading for diabetic retinopathy. Ophthalmology. 2019;126(4):552–564. doi:10.1016/j.ophtha.2018.11.016
45. Bellemo V, Lim ZW, Lim G, et al. Artificial intelligence using deep learning to screen for referable and vision-threatening diabetic retinopathy in Africa: a clinical validation study. Lancet Digit Health. 2019;1(1):e35–e44. doi:10.1016/S2589-7500(19)30004-4
46. Arcadu F, Benmansour F, Maunz A, et al. Deep learning predicts OCT measures of diabetic macular thickening from color fundus photographs. Invest Ophthalmol Vis Sci. 2019;60(4):852–857. doi:10.1167/iovs.18-25634
47. Chan GCY, Muhammad A, Shah SAA, et al. Transfer learning for diabetic macular edema (DME) detection on optical coherence tomography (OCT) images.
48. Awais M, Müller H, Tang TB, et al. Classification of SD-OCT images using a deep learning approach.
49. Schlegl T, Waldstein SM, Bogunovic H, et al. Fully automated detection and quantification of macular fluid in OCT using deep learning. Ophthalmology. 2018;125(4):549–558. doi:10.1016/j.ophtha.2017.10.031
50. Liu Y, Liu G, Zhang Q. Deep learning and medical diagnosis. Lancet. 2019;394(10210):1709–1710. doi:10.1016/S0140-6736(19)32501-2
 © 2020 The Author(s). This work is published and licensed by Dove Medical Press Limited. The full terms of this license are available at https://www.dovepress.com/terms.php and incorporate the Creative Commons Attribution - Non Commercial (unported, v3.0) License.
By accessing the work you hereby accept the Terms. Non-commercial uses of the work are permitted without any further permission from Dove Medical Press Limited, provided the work is properly attributed. For permission for commercial use of this work, please see paragraphs 4.2 and 5 of our Terms.
© 2020 The Author(s). This work is published and licensed by Dove Medical Press Limited. The full terms of this license are available at https://www.dovepress.com/terms.php and incorporate the Creative Commons Attribution - Non Commercial (unported, v3.0) License.
By accessing the work you hereby accept the Terms. Non-commercial uses of the work are permitted without any further permission from Dove Medical Press Limited, provided the work is properly attributed. For permission for commercial use of this work, please see paragraphs 4.2 and 5 of our Terms.