")
Back to Journals » International Journal of General Medicine » Volume 15
Identification Prognostic Value and Correlation with Tumor-Infiltrating Immune Cells of Tripartite-Motif Family Genes in Hepatocellular Carcinoma
Authors Su H, Tang Y, Nie K, Wang Z, Wang H, Dong H, Chen G
Received 13 November 2021
Accepted for publication 19 January 2022
Published 9 February 2022 Volume 2022:15 Pages 1349—1363
DOI https://doi.org/10.2147/IJGM.S341018
Checked for plagiarism Yes
Review by Single anonymous peer review
Peer reviewer comments 2
Editor who approved publication: Dr Scott Fraser
Hao Su,* Yueheng Tang,* Kexin Nie, Zhi Wang, Hongzhan Wang, Hui Dong, Gang Chen
Institute of Integrated Traditional Chinese and Western Medicine, Tongji Hospital, Tongji Medical College, Huazhong University of Science and Technology, Wuhan, Hubei, 430030, People’s Republic of China
*These authors contributed equally to this work
Correspondence: Gang Chen
Department of Integration Traditional Chinese Medicine and Western Medicine, TongJi Hospital, Huazhong University of Science and Technology, 1095Jiefang Avenue, Wuhan, Hubei Province, 430030, People’s Republic of China
, Email [email protected]
Background: Hepatocellular carcinoma (HCC) is one of the most common and mortality types of malignant tumors in the world. The Tripartite-Motif (TRIM) protein family consists of more than 80 proteins with E3 ubiquitin ligase activity. Increasing studies have found that TRIM family proteins play an extremely important role in the occurrence and development of tumors. However, the expression and prognostic values of TRIMs in HCC have not been clarified.
Methods: We used bioinformatic methods to explore the potential function of TRIM family genes in the HCC. Web servers ONCOMINE, UALCAN, GEPIA, cBioPortal, STRING, DAVID 6.8 and TIMER were used in this research.
Results: We screened TRIM1-76 and found the expressions of TRIM6, TRIM11, TRIM16, TRIM18(MID1), TRIM24, TRIM28, TRIM31, TRIM37, TRIM45, TRIM52, TRIM59, TRIM66 were significantly changed in HCC. Among them, TRIM24, TRIM28, TRIM37, TRIM45 and TRIM59 had significant effects on pathological stages, overall survival and disease free survival. Functions of these genes are primarily related to transcriptional misregulation in cancer, p53 signaling pathway, alcoholism and viral carcinogenesis, FoxO signal pathway, PI3K-AKT pathway, cell cycle, microRNAs in cancer. Our results showed the significant correlation between TRIMs expression and infiltration of innate immune cells (macrophages, neutrophils, and dendritic cells).
Conclusion: Our result provides novel insights into the function of TRIM family genes, which may be used as potential references for drug targets and accurate survival predictions in patients with HCC.
Keywords: hepatocellular carcinoma, bioinformatics analysis, TRIM, survival, tumor immunology
Introduction
Protein ubiquitination is a common form of post-translational modification that involves in regulation of almost all cellular processes and is closely related to tumors and many other diseases.1 Via a three-enzyme cascade (E1-E2-E3), ubiquitin binding of proteins is catalyzed by the ubiquitin E3 ligase, an enzyme best represented by the Collin-RING complex superfamily. Because ubiquitin E3 ligase determines the choice of substrates and selection of polyubiquitin chains, it becomes the key regulatory step of the ubiquitination reaction.2 The Tripartite-Motif (TRIM) protein family consists of more than 80 proteins with E3 ubiquitin ligase activity.3 This large protein family has an N-terminal modified motif that contains a RING finger domain, one or two zinc finger domains, called B-box (B1 and B2), and a coiled coil region.4 According to the -terminal domain of TRIM proteins, they were divided into 11 subfamilies (C-I ~ C-XI).3 Among them, the C-IV subfamily had the largest number of members, including 33 TRIM proteins, while other family proteins were fewer. Due to their complex properties, TRIM proteins are involved in regulating many cellular pathways, including cell proliferation,5 promotion or inhibition of cell transformation to cancer,6 cell metabolism,7 autophagy,8 etc.
Primary liver cancer is one of the most common malignant tumors in the world, ranking seventh in morbidity and third in mortality among all malignant tumors.9 More than 90% of cases of primary liver cancer are hepatocellular carcinoma (HCC). Despite significant advances in clinical treatments for HCC, such as hepatectomy, liver transplantation, chemotherapy, and radiotherapy, the overall 5-year survival rate for HCC patients remains low.10 In recent years, more and more studies have found that TRIM family proteins play an extremely important role in the occurrence and development of tumors.11 TRIM8 was downregulated in clear cells renal cell carcinoma and glioma.12,13 Higher TRIM28 expression was associated with tumorigenesis and progression of breast cancer and prostate cancer.14,15
Previous studies have elucidated the role of some TRIMs in HCC,16,17 but considerable efforts are still necessary to find appropriate TRIMs as therapeutic targets and prognostic biomarkers. In this study, we screened 76 TRIM genes and found 12 TRIM genes differently expressed in HCC. We comprehensively analyzed the expression of these 12 TRIM genes in HCC patients and their effect on prognosis, as well as explored the relationship between TRIM genes and immune cell infiltration. Our findings provide additional data to help further search for appropriate drug targets and accurate prediction of tumor survival in patients with HCC.
Materials and Methods
ONCOMINE
ONCOMINE database (https://www.oncomine.org) is an online database providing genome-wide expression analysis in different types of tumors.18 We extracted the transcription data of TRIM1-76 in patients with HCC and normal from ONCOMINE and analyzed the difference in the expression of TRIMs in HCC with Student’s t-test. The threshold settings were fold change of 2, gene ranking of top 10% and p-value 0.05.
UALCAN
UALCAN (http://ualcan.path.uab.edu/analysis.html) is a comprehensive, user-friendly, and interactive web resource for analyzing cancer OMICS data.19 It is designed to provide easy access to publicly available cancer OMICS data, such as The Cancer Genome Atlas (TCGA), MET500 and clinical proteomic tumor analysis consortium (CPTAC). In this research, we used the function “Expression Analysis” of UALCAN to get the expression data of 14 TRIMs in HCC dataset. The Student’s t-test was used for analysis and p-value less than 0.05 indicates a statistical difference.
GEPIA
Gene Expression Profiling Interactive Analysis (GEPIA) (http://gepia.cancer-pku.cn/index.html), which was developed at Peking University, is an interactive web server for analyzing and visualizing RNA sequencing expression data.20 We used the “single gene analysis” module of GEPIA to perform differential mRNA expression analysis between tumor tissue and normal tissue, pathological staging analysis, and correlative prognostic analysis of TRIMs. Multigene comparative analysis of TRIMs was performed using the “HCC” dataset with the “multigene comparison” module of GEPIA. The Student’s t-test was used in expression or pathological stage analysis and the critical value of p is 0.05. Kaplan–Meier curve was used for prognosis analysis.
cBioPortal
cBio Cancer Genomics Portal (cBioPorta) (http://cbioportal.org) is an open platform for the study of multidimensional cancer genomic data sets.21 The platform provides genomic data from more than 215 studies, tens of thousands of tumor samples, and corresponding clinical information. It also has the ability to visualize and analyze cancer genome data. The genetic alterations and coexpression module of TRIMs were obtained based on TCGA database from cBioPortal. Three hundred and seventy-two samples of liver hepatocellular carcinoma (TCGA, PanCancer Atlas) were analyzed in this study.
STRING
Search tool for recurring instances of neighboring genes (STRING) (https://string-db.org) aims to collect, score, and integrate all publicly available sources of protein–protein interaction (PPI) data.22 In addition to experimental data, results of text from PubMed abstracts and synthesis of data from other databases, it also contains the potential functions predicted results using bioinformatics methods. We conducted a PPI network analysis of differentially expressed TRIMs to explore the interactions among them and their neighbor genes with STRING.
DAVID 6.8
The Database for Annotation, Visualization and Integrated Discovery version 6.8 (DAVID 6.8) (https://david.ncifcrf.gov) provides a comprehensive set of functional annotation tools for investigators to understand the biological meaning behind a large list of genes.23 In this study, we used the Gene Ontology (GO) enrichment analysis and Kyoto Encyclopedia of Genes and Genomes (KEGG) pathway enrichment analysis to explore the neighbor genes of these TRIMs and the cutoff p value was 0.05. Data isolated from DAVID 6.8 were visualized with R project using a “ggplot2” package. Cellular components (CC), and molecular function (MF) and biological processes (BP) were included in the GO enrichment analysis.
GeneMANIA
GeneMANIA (http://www.genemania.org) is a user-friendly web server search publicly available biological datasets for relevant genes.24 These include protein–protein, protein-DNA and genetic interactions, pathways, reactions, gene and protein expression data, protein domains and phenotypic screening profiles. In this study, it was used to explore the genes associated with the 12 TRIMs in expression and function.
TIMER
Tumor Immune Estimation Resource (TIMER) (https://cistrome.shinyapps.io/timer/) is a comprehensive resource for systematical analysis of immune infiltrates across various cancer types.25 It provides interactive web tools, tumor infiltrating immune cells to comprehensive and flexible analysis and visualization, the deconvolution method from the TCGA samples of different types of cancer gene expression profile in inference tumor infiltrating immune cells (B cells, CD4 + T cells and CD8 + T cells, macrophages, neutrophils and dendritic cells) of abundance. In this study, the “Gene module” was used to evaluate the correlation between TRIM levels and the infiltration of immune cells. “Survival module” was used to evaluate the correlation among clinical outcome and the infiltration of immune cells and TRIM expression.
Result
Aberrant Expression of TRIMs in Patients with HCC
The transcriptional levels of TRIM1-76 genes of the TRIM family (not including TRIM12, TRIM30, TRIM53, TRIM60, TRIM71) were retrieved using the ONCOMINE database. Based on the data from ONCOMINE, the mRNA levels of 11 (TRIM6, TRIM11, TRIM16, TRIM18 (MID1), TRIM24, TRIM28, TRIM31, TRIM37, TRIM45, TRIM52, TRIM59) were significantly elevated in HCC vs normal tissue, while 2(TRIM15, TRIM66) were significantly reduced (Figure 1 and Table 1). Figure 1 also shows the aberrant expression of these TRIMs in other tumors besides HCC. The transcriptional level change of TRIM22 was the opposite in different studies. The transcriptional levels of TRIM6, TRIM11, TRIM16, TRIM18 (MID1), TRIM31 and TRIM52 were remarkably higher than normal tissue in HCC (fold change 2.178, 2.23, 5.726, 3.083, 3.01 and 2.319) in Wurmbach’s dataset.26 Chen’s dataset27 suggested that the expression of TRIM15 decreased with a fold change of −2.809, while TRIM45 and TRIM59 increased with a fold change of 2.292 and 2.25. Dependent on the dataset of Roessler et al,28 TRIM24, TRIM28 and TRIM37 significantly elevated with a fold change of 2.046, 2.326 and 2.183, TRIM66 downregulated with a fold change of −2.198. The result of Mas29 suggested increased significantly in HCC (fold change 5.671), while the dataset of 2 cohorts in Roessler’s study28 gave opposite trends (fold change −2.976 and −3.23).
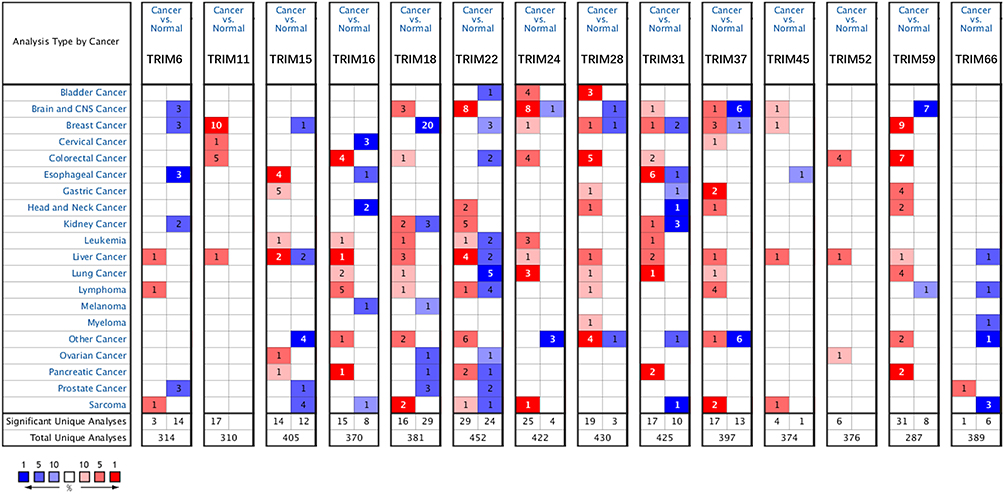 |
Figure 1 Expression of TRIMs in different tumors compared to normal tissues in the ONCOMINE database. The figure shows the numbers of datasets with statistically significant mRNA overexpression (red) or downregulated expression (blue) of TRIMs. |
To test the result of this finding, we assessed the mRNA levels of these 14 TRIMs in HCC and normal liver tissue with UALCAN, a website providing analyses based on the data of TCGA (Figure 2). Although 14 of the TRIMs were identified by ONCOMINE, there was no statistically significant difference in the change of TRIM15 and TRIM22 in HCC vs normal tissue in UALCAN. Therefore, trim15 and trim22 were excluded in our further analysis. We also explored the relative mRNA levels of TRIMs in HCC tissues and found that TRIM28 was the highest among the 12 TRIMs (Figure 3).
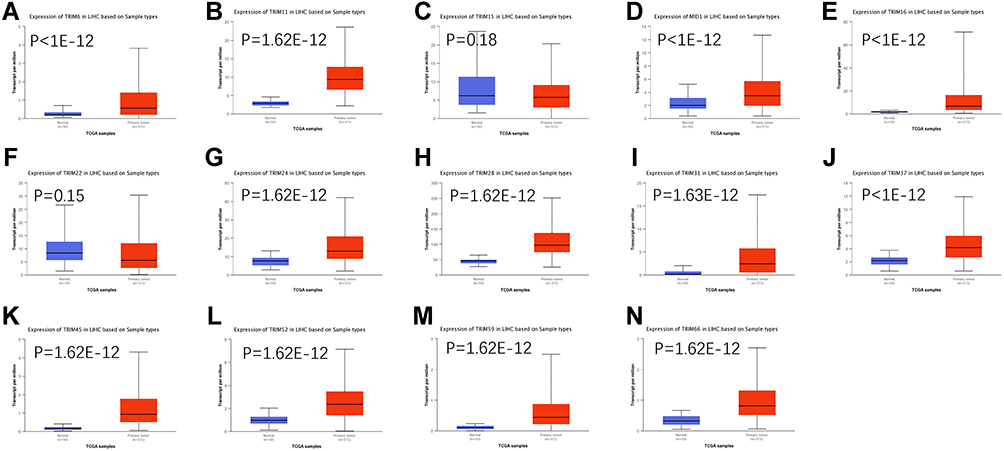 |
Figure 2 The transcription levels of TRIMs in HCC (UALCAN). The transcriptional levels of (A) TRIM6, (B) TRIM11, (C) TRIM15, (D) TRIM16, (E) TRIM18(MID1), (F) TRIM22, (G) TRIM24, (H) TRIM28, (I) TRIM31, (J) TRIM37, (K) TRIM45, (L) TRIM52, (M) TRIM59, (N) TRIM66 in HCC tissues. The transcription levels of TRIM6, TRIM11, TRIM16, TRIM18(MID1), TRIM22, TRIM24, TRIM28, TRIM31, TRIM37, TRIM45, TRIM52, TRIM59, TRIM66 were significantly elevated, the levels change of TRIM15 and TRIM22 were not reach statistically significant. |
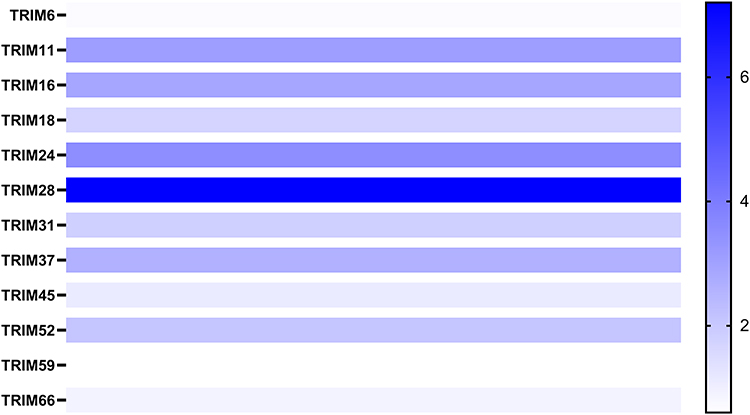 |
Figure 3 The heatmap of the relative mRNA levels of TRIMs in HCC tissues. The deeper the colour, the higher the expression. |
The Prognostic Value of TRIMs in Patients with HCC
Then the correlation between TRIMs expression and the HCC pathological stage was assessed (Figure 4). We found a significant correlation between TRIM11, TRIM16, TRIM18 (MID1), TRIM24, TRIM28, TRIM37, TRIM45 and TRIM59. These 8 changed similarly as the tumor progressed that they increased in stage I to stage III, while decreased in stage IV. These data suggested that TRIMs are involved in the regulation of the tumorigenesis and progression of HCC. And they played different roles in the early stage or end stage of the disease.
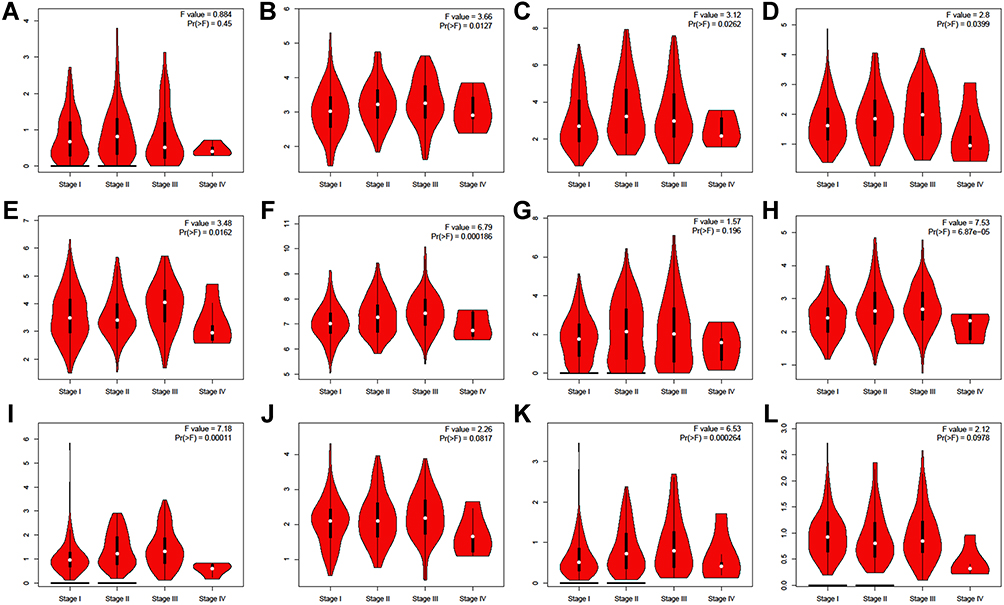 |
Figure 4 Correlation between different expressed TRIMs and the pathological stage of HCC patients (GEPIA). The correlation between the expression of (A) TRIM6, (B) TRIM11, (C) TRIM16, (D) TRIM18(MID1), (E) TRIM24, (F) TRIM28, (G) TRIM31, (H) TRIM37, (I) TRIM45, (J) TRIM52, (K) TRIM59, (L) TRIM66 and the pathological stage of HCC patients. |
To evaluate if different expressions of TRIMs play a role in the progression of HCC, we access differentially expressed TRIMs remarkably correlated with clinical outcomes in HCC. With the dataset from GEPIA2, we found that patients with high transcriptional levels of TRIM11, TRIM16, TRIM24, TRIM28, TRIM37, TRIM45, TRIM52, TRIM59 had shorter overall survival time vs low levels patients (Figure 5). Patients with low TRIM24, TRIM28, TRIM37, TRIM45 and TRIM59 transcriptional levels were correlated with longer disease-free survival time in HCC (Figure 6).
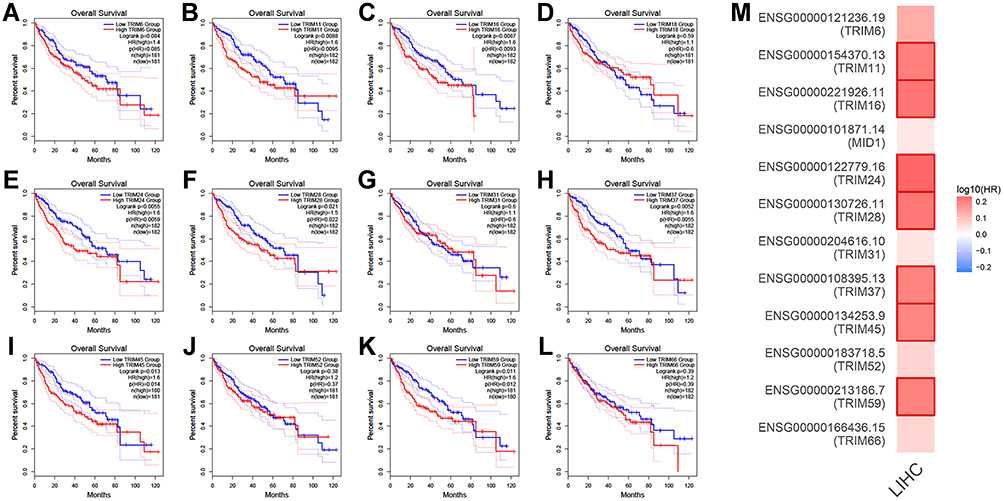 |
Figure 5 The prognostic value of TRIMs in HCC patients in the overall survival curve (GEPIA). The overall survival curve of (A) TRIM6, (B) TRIM11, (C) TRIM16, (D) TRIM18(MID1), (E) TRIM24, (F) TRIM28, (G) TRIM31, (H) TRIM37, (I) TRIM45, (J) TRIM52, (K) TRIM59, (L) TRIM66 in HCC. (M) The overall survival heatmap of TRIMs in HCC. |
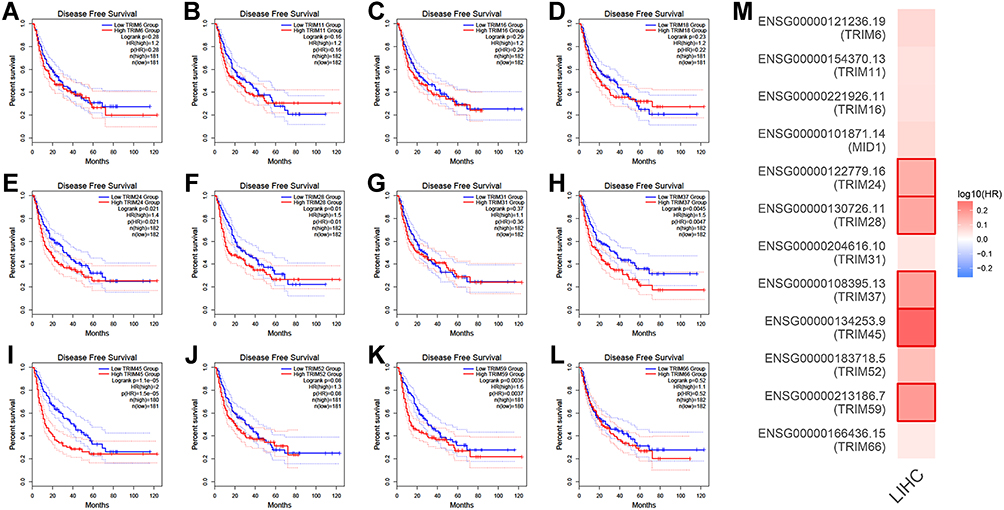 |
Figure 6 The prognostic value of TRIMs in HCC patients in the disease free survival curve (GEPIA). The overall survival curve of (A) TRIM6, (B) TRIM11, (C) TRIM16, (D) TRIM18(MID1), (E) TRIM24, (F) TRIM28, (G) TRIM31, (H) TRIM37, (I) TRIM45, (J) TRIM52, (K) TRIM59, (L) TRIM66 in HCC. (M) The disease free survival heatmap of TRIMs in HCC. |
Gene Mutation, Correlation, Neighboring Gene Network Analyses of Different Expressed TRIMs in HCC Patients
TCGA datasets were used to analyze different TRIMs genetic alterations in patients with HCC. The results showed that TRIM6, TRIM11, TRIM16, TRIM18(MID1), TRIM24, TRIM28, TRIM31, TRIM37, TRIM45, TRIM52, TRIM59, TRIM66 were altered in 0.3%, 7%, 2%, 2.3%, 0.8%, 1.7%, 3%, 4%, 0.3%, 0.8%, 0.8%, 2% in HCC samples respectively (Figure 7A). Next, we explored the potential co-expression of different TRIMs, and the correlation among these 12 TRIMs was shown in Figure 7B. GeneMANIA was used to explore the potential interaction among them, and the result revealed the wide correlation of the TRIM family (Figure 7C). After that, we got a PPI network analysis of these 12 TRIMs and genes related to them with STRING. Figure 7D shows the relationship of these genes in a PPI network.
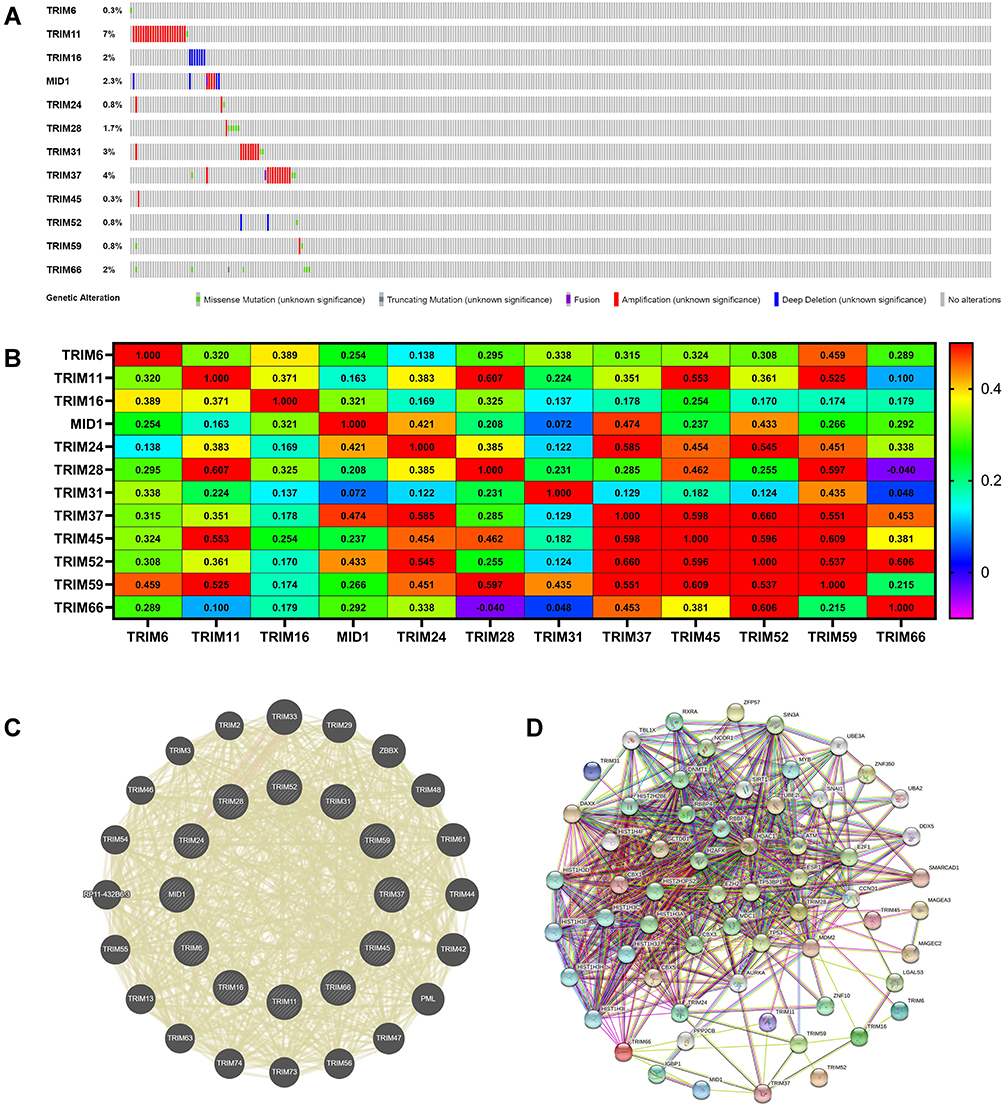 |
Figure 7 Gene mutations, correlations, neighboring genes network analyses of different expressed TRIMs in HCC patients. (A) Mutations in different expressed TRIMs in HCC. (B) Correlation heat map of different expressed TRIMs in HCC. The correlation coefficients of TRIMs were labeled in the cells. The colours of the cells indicate the correlation coefficients of TRIMs. And the value scale for determining cell colours was put on the right of the heatmap. (C) PPI network of TRIMs. (D) PPI network of TRIMs with neighboring genes. |
Functional Enrichment Analysis of TRIMs in Patients with HCC
The functions of 50 neighbor genes of these 12 TRIMs were analyzed with DAVID 6.8. After GO enrichment, the top 10 enriched items were shown in Figure 8A-C. About the cellular components (CC), nucleus (nucleoplasm, nuclear chromosome, nucleosome, nuclear nucleosome, nuclear chromatin, nuclear heterochromatin), protein complex and transcriptional repressor complex were enriched. In the category of MF, the functions related to the transcription and its regulation were enriched. In the BP category, the process related to the tumorigenesis and progression of HCC, for example transcriptional misregulation in cancer was enriched. The processes related to nucleus, nucleoplasm, nucleosome assembly, nuclear chromosome, nucleosome, negative regulation of gene expression, negative regulation of transcription from RNA polymerase II promoter 21, DNA replication-dependent nucleosome assembly, chromatin silencing at rDNA were also enriched. We also performed KEGG pathways analysis. Twenty-three pathways were enriched by this analysis (Figure 8D). Cellular pathways highly associated with the etiology of HCC such as alcoholism and viral carcinogenesis are enriched. The pathways related to tumorigenesis and progression such as p53 signaling pathway transcriptional misregulation in cancer, microRNAs in cancer, cell cycle, FoxO signal pathway, PI3K-AKT pathway were also enriched. These 12 TRIMs were also related to other types of cancer such as bladder cancer, non-small cell lung cancer, etc.
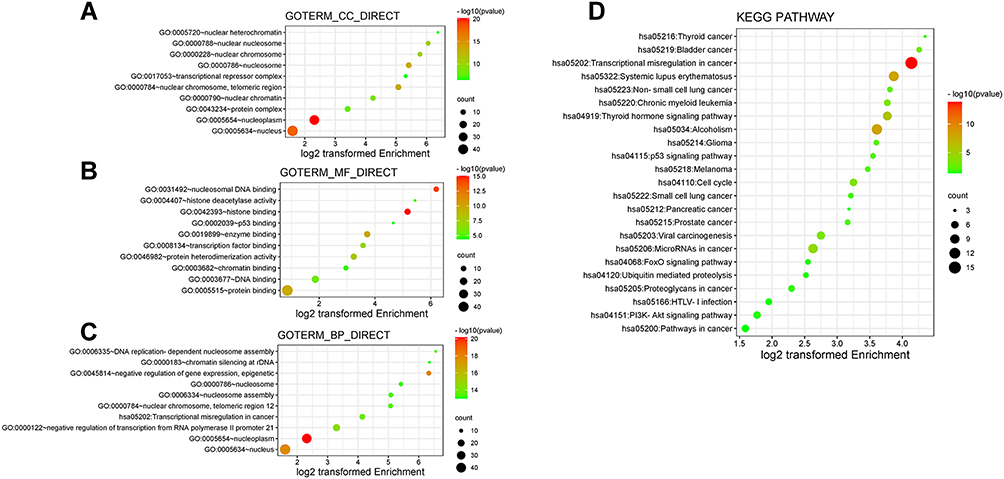 |
Figure 8 The enrichment analysis of the 50 most related neighboring genes of TRIMs in HCC (David 6.8). Bubble plots of GO enrichment of the 50 most related neighboring genes of TRIMs in HCC in (A) cellular component terms, (B) molecular function terms and (C) biological process terms. (D) Bubble plots of KEGG enriched terms of the 50 most related neighboring genes of TRIMs in HCC. The size of the bubble represents the number of enriched genes. The redder the bubble is, the smaller the p value is. |
Immune Cell Infiltration of TRIMs in Patients with HCC
The immune response to the tumor affects the clinical outcome of patients, so we evaluated the correlation of survival rates with TRIMs and immune cell infiltration. The “Survival” module of TIMER allows users to explore the clinical relevance of one or more tumor immune subsets with the flexibility to correct for multiple covariates in a multivariable Cox proportional hazard model. B cell (HR=0.000, p=0.006), CD8+ T cell (HR=0.003, p=0.027) have a significant positive correlation with LICH patient’s outcome. Dendritic cell (HR=141.42, p=0.010), TRIM16 (HR=1.173, p=0.007) and TRIM28 (HR=1.530, p=0.018) have a significant negative correlation with LICH patient’s outcome (Table 2).
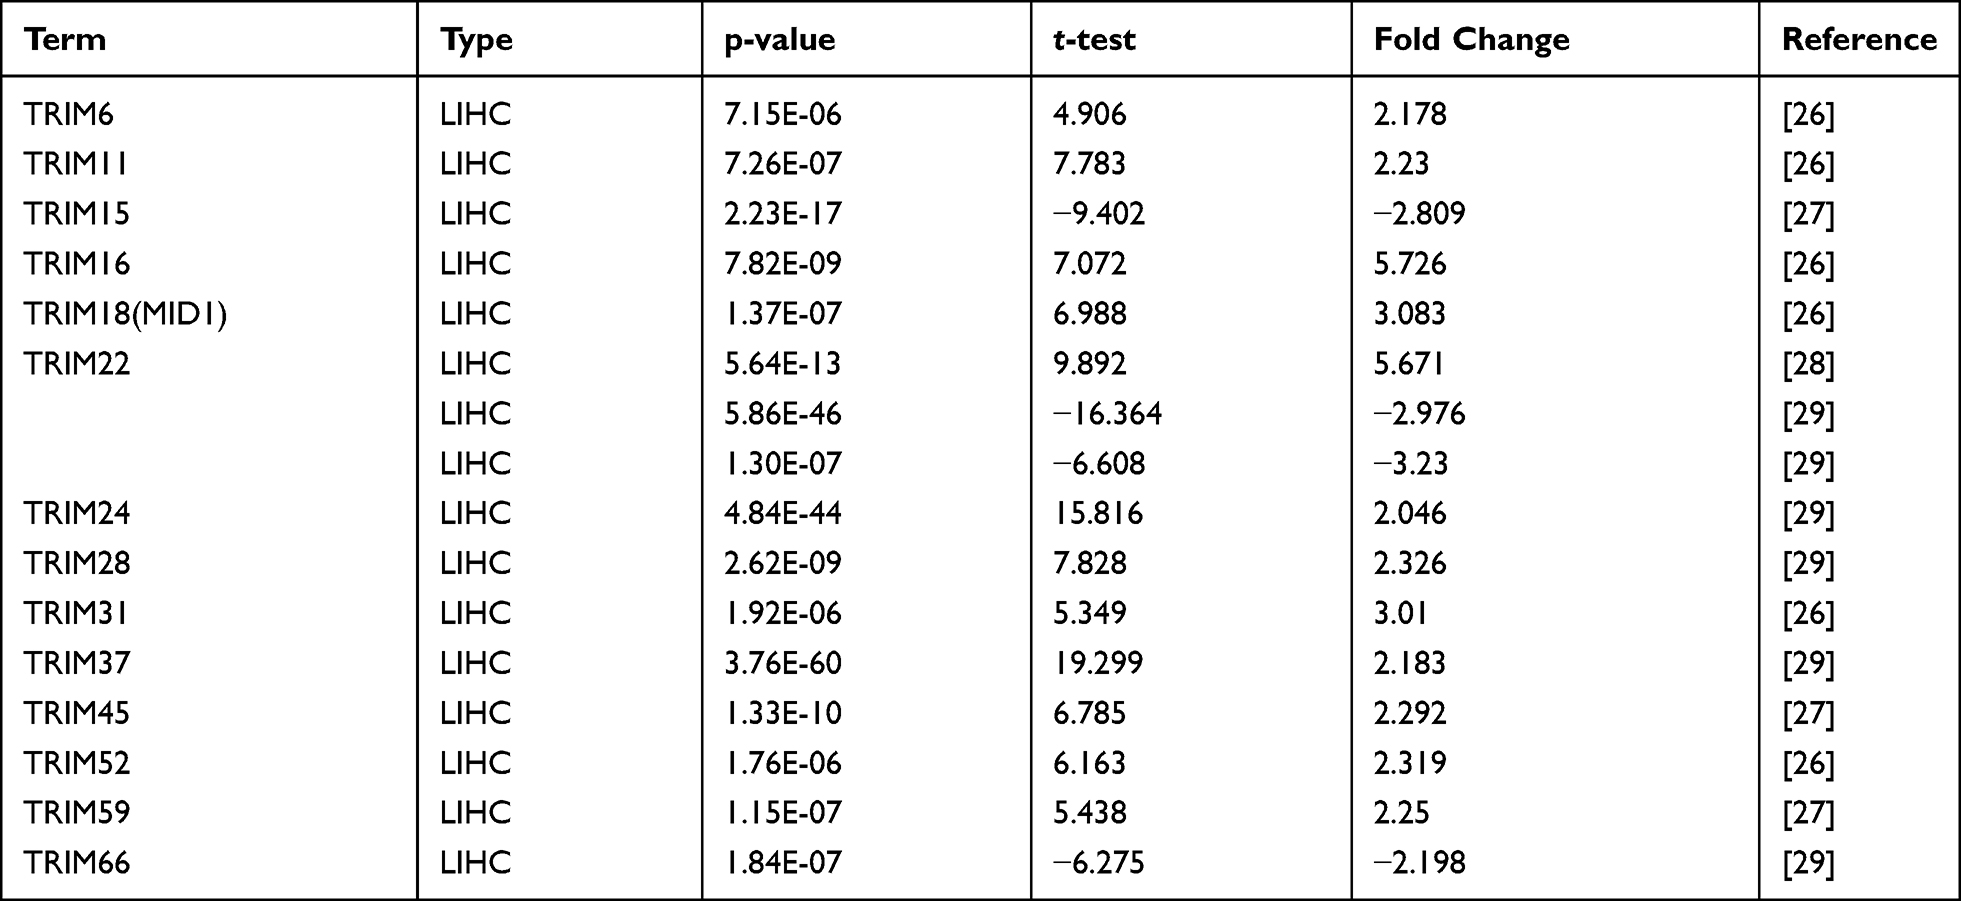 |
Table 1 The mRNA Levels of TRIMs in HCC Tissues and Normal Liver Tissues at Transcriptome Level (ONCOMINE) |
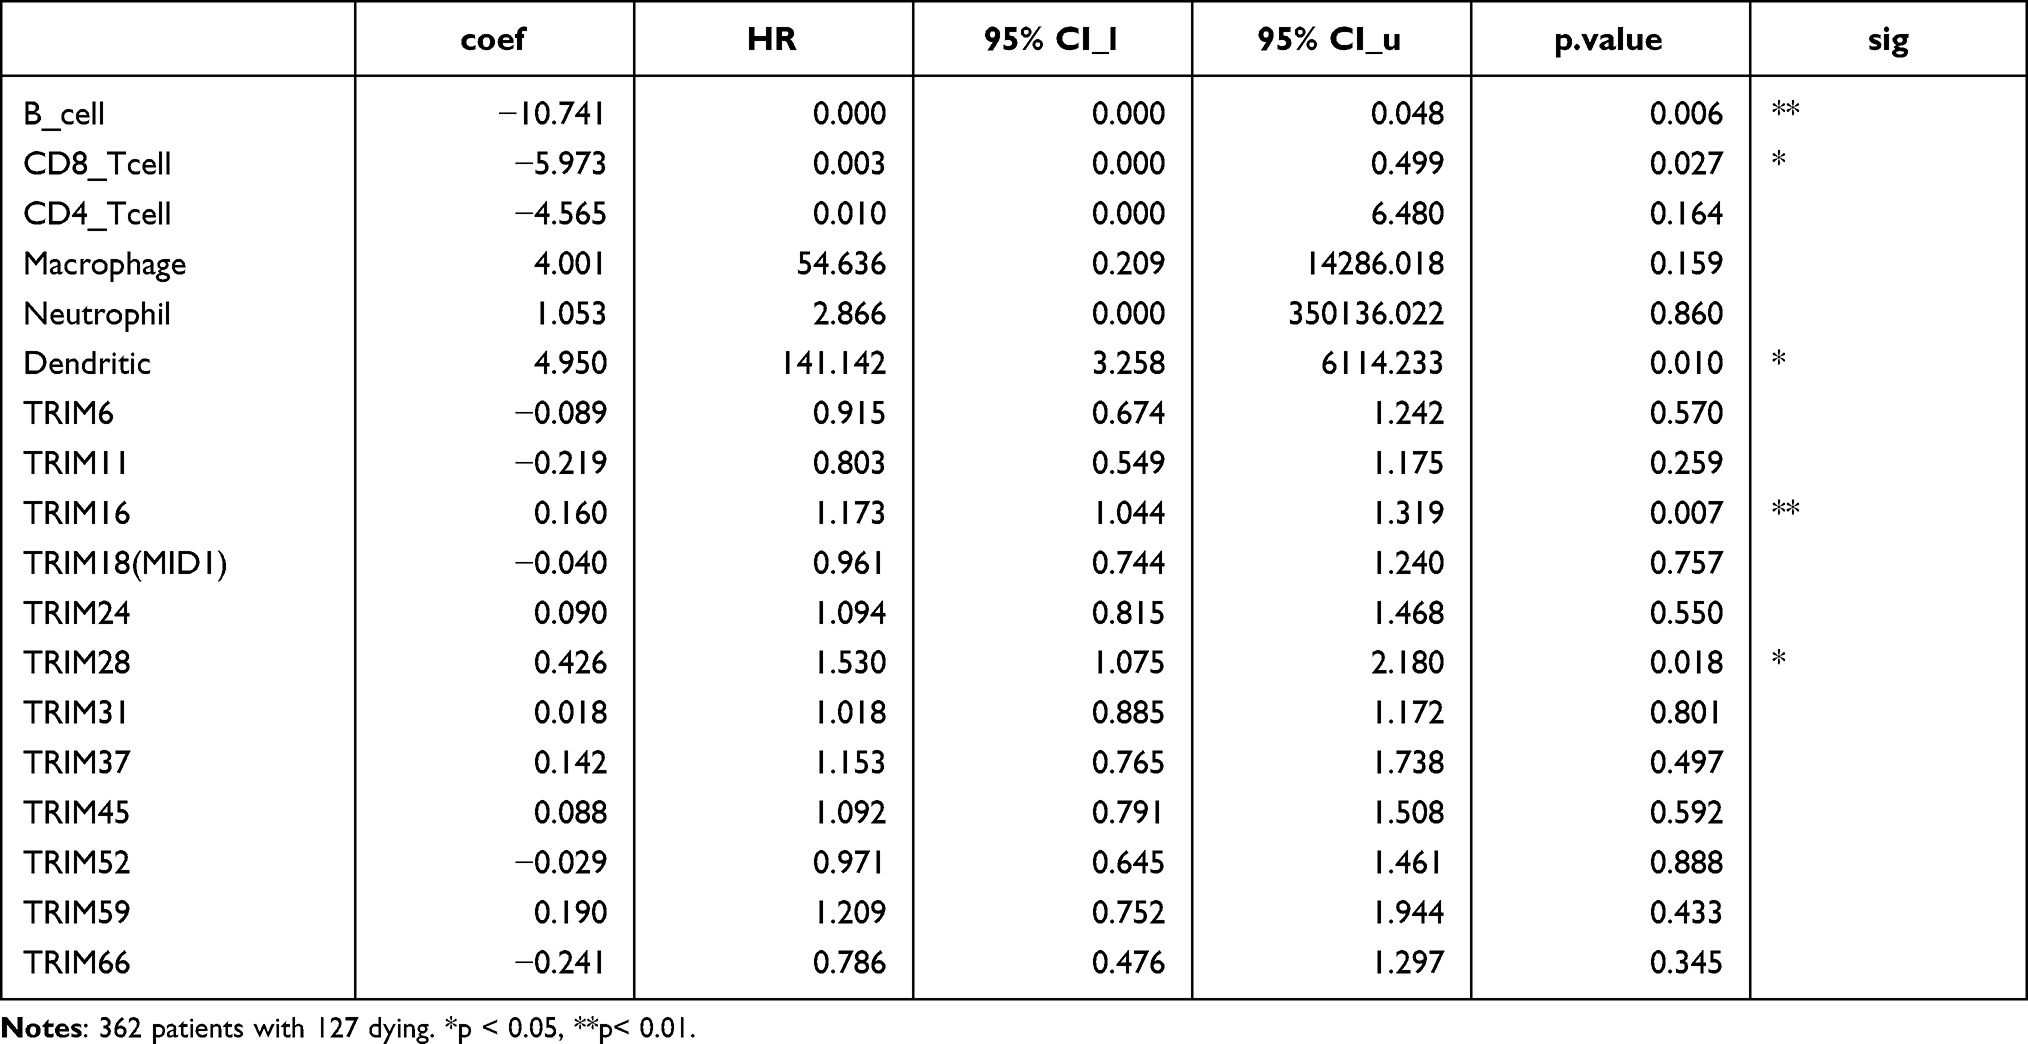 |
Table 2 The Cox Proportional Hazard Model of TRIMs and Six Tumor-Infiltrating Immune Cells in HCC (TIMER) |
We also explore the role TRIMs play in the immune cell infiltration in HCC. We accessed a comprehensive analysis of the correlation between TRIM6, TRIM11, TRIM16, TRIM18(MID1), TRIM24, TRIM28, TRIM31, TRIM37, TRIM45, TRIM52, TRIM59 and TRIM66 gene expressions and tumor-infiltrating lymphocytes with TIMER database (Figure 9). Eleven of the 12 TRIMs have significant positive correlation between the gene expressions and B cell infiltration. TRIM28 (r=0.436, p=1.96e-17), TRIM59 (r=0.471, p=1.95e-20) have partial correlation coefficients more than 0.4. The correlation between TRIMs and CD+ T cells infiltration was weaker than other types of immunocytes. TRIM11 (r=0.417, p=6.67e-16), TRIM45 (r=0.401, p=1.10e-14), TRIM59 (r=0.484, p=1.19e-21) have partial correlation coefficients more than 0.4 between the gene expressions and CD4+ T cell infiltration. All of the 12 TRIMs have significant positive correlation between the gene expressions and Macrophage, Neutrophil and Dendritic cell infiltration.
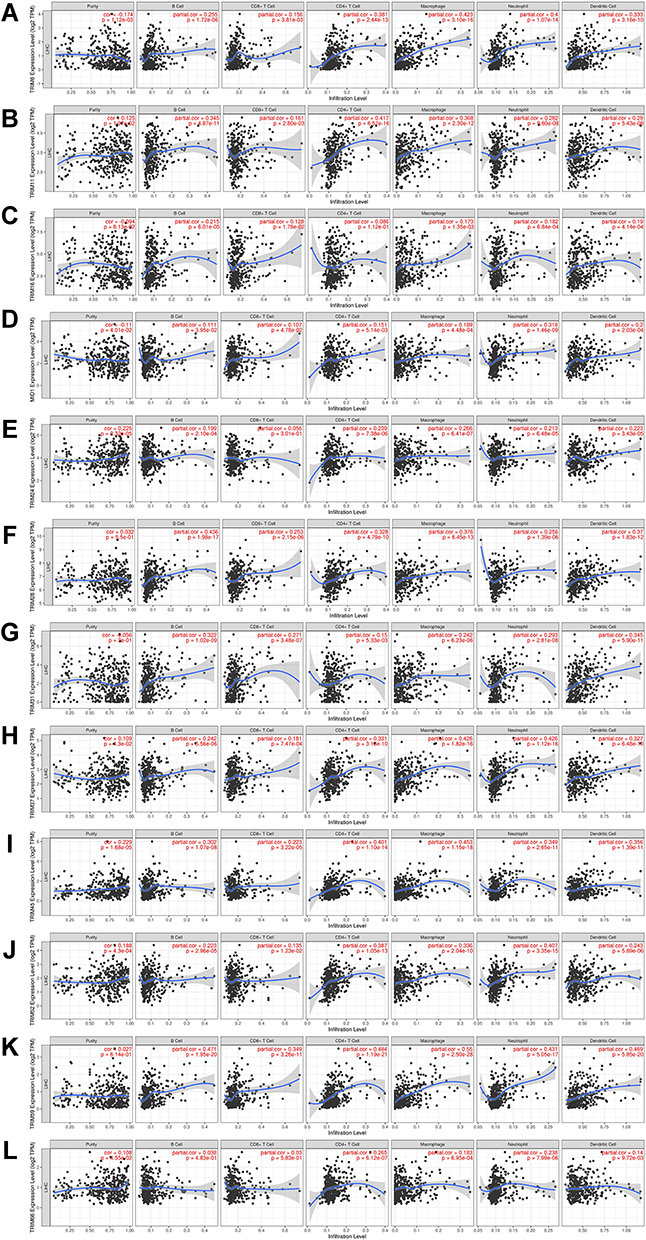 |
Figure 9 The correlation between different expressed TRIMs and immune cell infiltration (TIMER). The correlation between the abundance of immune cells and the expression of (A) TRIM6, (B) TRIM11, (C) TRIM16, (D) TRIM18(MID1), (E) TRIM24, (F) TRIM28, (G) TRIM31, (H) TRIM37, (I) TRIM45, (J) TRIM52, (K) TRIM59, (L) TRIM66 in HCC. |
Discussion
In this study, we searched public databases with bioinformatics methods and found that the TRIM family genes play a carcinogenic role in the development of HCC. Among them, TRIM24, TRIM28, TRIM37, TRIM45 and TRIM59 had significant effects on pathological stages and survival, and may be used as potential drug targets and prognosis markers.
Liver cancer is one of the leading causes of cancer-related death in the world.30 Liver Hepatocellular carcinoma is the primary form of liver cancer and accounts for similar to 90% of cases. With an estimated incidence of more than 1 million cases by 2025, it remains a great challenge for global health.10 Although our understanding of the pathophysiology of HCC has improved in the past decades, the pathogenesis of liver cancer is still far from being fully elucidated. And the dominant drivers in HCC, such as the mutation of TP53, TERT, CTNNB1 were still undruggable.31 Therefore, exploring the molecular mechanisms and new therapeutic targets of HCC remains urgent.
Emerging clinical evidence suggests that ubiquitin-mediated disruption of oncogene products or tumor suppressor degradation may be involved in the etiology of cancer.32 TRIM family proteins (one of the subfamilies of the RING type E3 ubiquitin ligases) are involved in a broad range of biological processes such as autophagy, viral infections and cancer.3 Accounting for more than half of cases, hepatitis B virus (HBV) and hepatitis C virus (HCV) infection are the most prominent risk factors for HCC development. Non-alcoholic steatohepatitis (NASH), associated with misregulation of protein degradation, is becoming the fastest-growing etiology of HCC in western countries. Based on the above reasons, we explored the roles of TRIMs in tumorigenesis and progression of HCC.
Yet few studies have analyzed the role they play in the HCC. We screened the expressions of TRIM1-76 with ONCOMINE and tested the results with the dataset from UALCAN. TRIM6, TRIM11, TRIM16, TRIM18 (MID1), TRIM24, TRIM28, TRIM31, TRIM37, TRIM45, TRIM52, TRIM59 and TRIM66 showed significant expressions in HCC and normal tissue. In the past, studies showed that TRIM proteins may positively and negatively regulate carcinogenesis. TRIM6, TRIM11, TRIM18 (MID1), TRIM24, TRIM28, TRIM31, TRIM59 and TRIM66 were reported oncogenes while TRIM16, TRIM37, TRIM45 were reported tumor suppressors in different types of cancers.3,11,33–35 TRIM52 was reported oncogene in ovarian cancer,36 hepatocellular carcinoma,37 but tumor suppressor in glioma.38
To investigate the role these TRIMs play in HCC, we analyzed the correlation of the gene expressions with pathological stage and survival. TRIM11, TRIM16, TRIM18 (MID1), TRIM24, TRIM28, TRIM37, TRIM45, TRIM59 significant correlation between expressions and pathological stage. Low TRIM24, TRIM28, TRIM37, TRIM45 and TRIM59 transcriptional levels correlated with longer both overall and disease-free survival time in HCC.
Our results confirmed some previous findings. Liu reported that elevated TRIM11 can promote the occurrence of HCC by inhibiting p53.39 TRIM16 can perform a tumor suppression role in most tumors by inhibiting E2F1 and pRb expressions.40 However, the high expression of TRIM16 can also be a marker of adverse prognosis.41 Li reported that TRIM16 inhibits hepatocellular carcinoma cell migration and invasion by inhibiting ZEB2 expression.17 In this study we found the opposite trend, patients with high expression of TRIM16 had shorter overall survival time in HCC. TRIM24 and TRIM28 have been widely studied in the tumor field. TRIM24 was found to increase expression in HCC and promote tumor progression via the AMPK signaling pathway.42 Previous studies reported that TRIM28 interacting with UBE2S in the nucleus accelerates cell cycle by ubiquitination of p27,43 MAGE-TRIM28 complex promotes the Warburg effect by targeting FBP1 for degradation.44 Elevated expression of TRIM37 will promote cell migration and metastasis by activating Wnt/beta-catenin signaling.45 It can also induce chemoresistance via activating the AKT signaling pathway.46 TRIM59 contributes to HCC growth by degrading protein phosphatase 1B,47 and promotes cancer cell proliferation and metastasis through the p53 pathway.48
In the present study, differential expressions of TRIM31, TRIM52 and TRIM66 did not affect the survival of tumor patients. In previous studies, TRIM31 upregulation can promote disease progression by inducing ubiquitination of the TSC1-TSC2 complex,16 and it promotes resistance to anoikis of hepatocarcinoma cells through the p53-AMPK axis.49 Zhang reported that TRIM52 promotes proliferation, migration and invasion through the ubiquitination of PPM1A.37 TRIM66 can promote the malignant progression of HCC by inhibiting E-cadherin expression50 and GSK-3β-dependent Wnt/β-catenin signaling pathway.51 It seems that some genes may influence the function of cancer cells without affecting the patient’s eventual clinical outcome. Up to now, no study related to TRIM45 in the field of liver cancer has been published. In our study, TRIM45 had a significant correlation between expressions and pathological stage, and low TRIM45 transcriptional levels correlated with longer both overall and disease-free survival time in HCC. Further information on the role of TRIM45 in cancer needs to be clarified.
We explored the frequent genetic mutations in the TRIMs differentially expressed in HCC. The major type of mutation was elevated mRNA expression. While all the 12 TRIMs were with low mutation rates. It was reported that approximately 25% of HCC present actionable mutations, but the prevalence of most mutations is <10%.52 Therefore, the development of drugs targeting specific gene mutations in the treatment of liver cancer is a complex and inefficient approach, which seems to be not an ideal choice.
Then we analyzed the functions of genes related to these 12 TRIMs using GO enrichment analysis and KEGG pathway enrichment analysis. As expected, functions of these genes are primarily related to transcriptional misregulation in cancer, p53 signaling pathway, alcoholism and viral carcinogenesis, FoxO signal pathway, PI3K-AKT pathway, cell cycle, microRNAs in cancer. P53 is an important tumor suppressor gene. Its mutation is the most common in HCC.30 Alcoholism and viral infection are the most risk factors for HCC.10 The FoxO signal pathway and PI3K-AKT pathway play important roles in the proliferation, invasion, and metastasis of hepatocarcinoma cells.53,54 These data suggest that the differentially expressed TRIMs are potential drug therapeutic targets in HCC.
It was reported that immune cell infiltration could affect the progression and the recurrence of different types of tumors. And the type and abundance of infiltrated immune cells could also act as a marker of response to immunotherapy and clinical outcome. In this study, we explored the correlation between six types of immune cells, B cells, CD8+ T cells, CD4+ T cells, macrophages, neutrophils, and dendritic cells with the expressions of TRIMs. Previous studies have revealed the infiltrated of CD8+ T cells were the major subset that perform anti-tumor effector functions.55 The role of tumor-infiltrating B cells and CD4+ T cells in the development of HCC remains controversial.56,57 Kupffer cells (Macrophages in the liver), DCs and neutrophils have been identified as exacerbating factors and predictive of a poorer outcome in the pathogenesis of HCC.58,59 Our results showed the correlation between TRIMs expression and CD8+ T cells were weaker than macrophages, neutrophils, and dendritic cells. It suggested that TRIMs may promote the infiltration of innate immune cells and aggravate the pathogenesis of HCC.
Conclusion
In the present study, we used bioinformatic analysis to identify 12 TRIM family genes and explored the roles they play in the development of HCC. Our result provides novel insights into the function of TRIM family genes, which may be used as potential references for drug targets and accurate survival predictions in patients with HCC.
Data Sharing Statement
The datasets analyzed for this study can be found in the ONCOMINE, UALCAN, GEPIA cBioPortal, STRING and DAVID 6.8, TIMER web resources.
Ethics Approval and Consent to Participate
Our research was approved and supervised by the Medical Ethics Committee of Tongji Hospital, Tongji Medical College, Huazhong University of Science and Technology (TJ IRB20211112).
Funding
This study was supported by the National Natural Science Foundation of China (No. 81874423) and National Administration of Traditional Chinese Medicine Foundation (No. JDZX2015178).
Disclosure
The authors declare no conflict of interest.
References
1. Popovic D, Vucic D, Dikic I. Ubiquitination in disease pathogenesis and treatment. Nat Med. 2014;20(11):1242–1253. doi:10.1038/nm.3739
2. Berndsen CE, Wolberger C. New insights into ubiquitin E3 ligase mechanism. Nat Struct Mol Biol. 2014;21(4):301–307. doi:10.1038/nsmb.2780
3. Hatakeyama S. TRIM family proteins: roles in autophagy, immunity, and carcinogenesis. Trends Biochem Sci. 2017;42(4):297–311. doi:10.1016/j.tibs.2017.01.002
4. Jaworska AM, Wlodarczyk NA, Mackiewicz A, Czerwinska P. The role of TRIM family proteins in the regulation of cancer stem cell self-renewal. Stem Cells. 2020;38(2):165–173. doi:10.1002/stem.3109
5. Lv D, Li Y, Zhang W, et al. TRIM24 is an oncogenic transcriptional co-activator of STAT3 in glioblastoma. Nat Commun. 2017;8. doi:10.1038/s41467-017-01731-w
6. Bhatnagar S, Gazin C, Chamberlain L, et al. TRIM37 is a new histone H2A ubiquitin ligase and breast cancer oncoprotein. Nature. 2014;516(7529):116–U313. doi:10.1038/nature13955
7. Hatakeyama S. TRIM proteins and cancer. Nat Rev Cancer. 2011;11(11):792–804. doi:10.1038/nrc3139
8. Mandell MA, Jain A, Arko-Mensah J, et al. TRIM proteins regulate autophagy and can target autophagic substrates by direct recognition. Dev Cell. 2014;30(4):394–409. doi:10.1016/j.devcel.2014.06.013
9. Sung H, Ferlay J, Siegel RL, et al. Global cancer statistics 2020: GLOBOCAN estimates of incidence and mortality worldwide for 36 cancers in 185 countries. CA Cancer J Clin. 2021;71(3):209–249. doi:10.3322/caac.21660
10. Llovet JM, Kelley RK, Villanueva A, et al. Hepatocellular carcinoma. Nat Rev Dis Primers. 2021;7(1). doi:10.1038/s41572-020-00240-3
11. Venuto S, Merla G. E3 ubiquitin ligase TRIM proteins, cell cycle and mitosis. Cells. 2019;8(5):510. doi:10.3390/cells8050510
12. Micale L, Fusco C, Fontana A, et al. TRIM8 downregulation in glioma affects cell proliferation and it is associated with patients survival. BMC Cancer. 2015;15:470. doi:10.1186/s12885-015-1449-9
13. Caratozzolo MF, Valletti A, Gigante M, et al. TRIM8 anti-proliferative action against chemo-resistant renal cell carcinoma. Oncotarget. 2014;5(17):7446–7457. doi:10.18632/oncotarget.2081
14. Wei C, Cheng J, Zhou B, et al. Tripartite motif containing 28 (TRIM28) promotes breast cancer metastasis by stabilizing TWIST1 protein. Sci Rep. 2016;6:29822. doi:10.1038/srep29822
15. Czerwinska P, Mazurek S, Wiznerowicz M. The complexity of TRIM28 contribution to cancer. J Biomed Sci. 2017;24(1):63. doi:10.1186/s12929-017-0374-4
16. Guo P, Ma X, Zhao W, et al. TRIM31 is upregulated in hepatocellular carcinoma and promotes disease progression by inducing ubiquitination of TSC1-TSC2 complex. Oncogene. 2018;37(4):478–488. doi:10.1038/onc.2017.349
17. Li LL, Dong L, Qu XT, et al. Tripartite motif 16 inhibits hepatocellular carcinoma cell migration and invasion. Int J Oncol. 2016;48(4):1639–1649. doi:10.3892/ijo.2016.3398
18. Rhodes DR, Yu J, Shanker K, et al. ONCOMINE: a cancer microarray database and integrated data-mining platform. Neoplasia. 2004;6(1):1–6. doi:10.1016/S1476-5586(04)80047-2
19. Chandrashekar DS, Bashel B, Balasubramanya SH, et al. UALCAN: a portal for facilitating tumor subgroup gene expression and survival analyses. Neoplasia. 2017;19(8):649–658. doi:10.1016/j.neo.2017.05.002
20. Tang Z, Li C, Kang B, et al. GEPIA: a web server for cancer and normal gene expression profiling and interactive analyses. Nucleic Acids Res. 2017;45(W1):W98–W102. doi:10.1093/nar/gkx247
21. Gao J, Aksoy BA, Dogrusoz U, et al. Integrative analysis of complex cancer genomics and clinical profiles using the cBioPortal. Sci Signal. 2013;6(269):pl1. doi:10.1126/scisignal.2004088
22. Szklarczyk D, Gable AL, Lyon D, et al. STRING v11: protein-protein association networks with increased coverage, supporting functional discovery in genome-wide experimental datasets. Nucleic Acids Res. 2019;47(D1):D607–D613. doi:10.1093/nar/gky1131
23. Huang da W, Sherman BT, Lempicki RA. Systematic and integrative analysis of large gene lists using DAVID bioinformatics resources. Nat Protoc. 2009;4(1):44–57. doi:10.1038/nprot.2008.211
24. Warde-Farley D, Donaldson SL, Comes O, et al. The GeneMANIA prediction server: biological network integration for gene prioritization and predicting gene function. Nucleic Acids Res. 2010;38(Web Server issue):W214–W220. doi:10.1093/nar/gkq537
25. Li T, Fan J, Wang B, et al. TIMER: a web server for comprehensive analysis of tumor-infiltrating immune cells. Cancer Res. 2017;77(21):e108–e110. doi:10.1158/0008-5472.CAN-17-0307
26. Wurmbach E, Chen Y-B, Khitrov G, et al. Genome-wide molecular profiles of HCV-induced dysplasia and hepatocellular carcinoma. Hepatology. 2007;45(4):938–947. doi:10.1002/hep.21622
27. Chen X, Cheung ST, So S, et al. Gene expression patterns in human liver cancers. Mol Biol Cell. 2002;13(6):1929–1939. doi:10.1091/mbc.02-02-0023
28. Roessler S, Jia H-L, Budhu A, et al. A unique metastasis gene signature enables prediction of tumor relapse in early-stage hepatocellular carcinoma patients. Cancer Res. 2010;70(24):10202–10212. doi:10.1158/0008-5472.CAN-10-2607
29. Mas VR, Maluf DG, Archer KJ, et al. Genes involved in viral carcinogenesis and tumor initiation in hepatitis C virus-induced hepatocellular carcinoma. Mol Med. 2009;15(3–4):85–94. doi:10.2119/molmed.2008.00110
30. Villanueva A, Longo DL. Hepatocellular carcinoma. N Engl J Med. 2019;380(15):1450–1462. doi:10.1056/NEJMra1713263
31. Zucman-Rossi J, Villanueva A, Nault J-C, Llovet JM. Genetic landscape and biomarkers of hepatocellular carcinoma. Gastroenterology. 2015;149(5):
32. Deng L, Meng T, Chen L, Wei WY, Wang P. The role of ubiquitination in tumorigenesis and targeted drug discovery. Sign Transduct Target Ther. 2020;5(1). doi:10.1038/s41392-020-0107-0
33. Demir U, Koehler A, Schneider R, Schweiger S, Klocker H. Metformin anti-tumor effect via disruption of the MID1 translational regulator complex and AR downregulation in prostate cancer cells. BMC Cancer. 2014;14. doi:10.1186/1471-2407-14-52
34. Peng X, Wen Y, Zha L, et al. TRIM45 suppresses the development of non-small cell lung cancer. Curr Mol Med. 2020;20(4):299–306. doi:10.2174/1566524019666191017143833
35. Wei C, Wu J, Liu W, et al. Tripartite motif-containing protein 6 facilitates growth and migration of breast cancer through degradation of STUB1. Eur J Histochem. 2021;65(1). doi:10.4081/ejh.2021.3214
36. Yang W, Liu L, Li C, et al. TRIM52 plays an oncogenic role in ovarian cancer associated with NF-kB pathway. Cell Death Dis. 2018;9. doi:10.1038/s41419-018-0881-6
37. Zhang Y, Tao R, Wu -S-S, et al. TRIM52 up-regulation in hepatocellular carcinoma cells promotes proliferation, migration and invasion through the ubiquitination of PPM1A. J Exp Clin Cancer Res. 2018;37. doi:10.1186/s13046-018-0780-9
38. Benke S, Agerer B, Haas L, et al. Human tripartite motif protein 52 is required for cell context-dependent proliferation. Oncotarget. 2018;9(17):13565–13581. doi:10.18632/oncotarget.24422
39. Chen Y, Li L, Qian XX, Ge YS, Xu GL. High expression of TRIM11 correlates with poor prognosis in patients with hepatocellular carcinoma. Clin Res Hepatol Gastroenterol. 2017;41(2):190–196. doi:10.1016/j.clinre.2016.09.010
40. Kim PY, Tan O, Liu B, et al. High TDP43 expression is required for TRIM16-induced inhibition of cancer cell growth and correlated with good prognosis of neuroblastoma and breast cancer patients. Cancer Lett. 2016;374(2):315–323. doi:10.1016/j.canlet.2016.02.021
41. Tan H, Qi J, Chu G, Liu Z. Tripartite motif 16 inhibits the migration and invasion in ovarian cancer cells. Oncol Res. 2017;25(4):551–558. doi:10.3727/096504016X14758370595285
42. Zhu YF, Zhao L, Shi KQ, Huang ZT, Chen BC. TRIM24 promotes hepatocellular carcinoma progression via AMPK signaling. Exp Cell Res. 2018;367(2):274–281. doi:10.1016/j.yexcr.2018.04.006
43. Zhang R, Liu Z, Wei D, et al. UBE2S interacting with TRIM28 in the nucleus accelerates cell cycle by ubiquitination of p27 to promote hepatocellular carcinoma development. Sign Transduct Target Ther. 2021;6(3):938–949.
44. Jin X, Pan Y, Wang L, et al. MAGE-TRIM28 complex promotes the Warburg effect and hepatocellular carcinoma progression by targeting FBP1 for degradation. Oncogenesis. 2017;6:e312–e312. doi:10.1038/oncsis.2017.21
45. Jiang JX, Yu C, Chen MY, Tian S, Sun CY. Over-expression of TRIM37 promotes cell migration and metastasis in hepatocellular carcinoma by activating Wnt/beta-catenin signaling. Biochem Biophys Res Commun. 2015;464(4):1120–1127. doi:10.1016/j.bbrc.2015.07.089
46. Tan G, Xie B, Yu N, et al. TRIM37 overexpression is associated with chemoresistance in hepatocellular carcinoma via activating the AKT signaling pathway. Int J Clin Oncol. 2021;26(3):532–542. doi:10.1007/s10147-020-01832-5
47. Ying H, Ji L, Xu Z, et al. TRIM59 promotes tumor growth in hepatocellular carcinoma and regulates the cell cycle by degradation of protein phosphatase 1B. Cancer Lett. 2020;473:13–24. doi:10.1016/j.canlet.2019.12.030
48. Sun G, Sui X, Han D, et al. TRIM59 promotes cell proliferation, migration and invasion in human hepatocellular carcinoma cells. Pharmazie. 2017;72(11):674–679. doi:10.1691/ph.2017.7659
49. Guo PB, Qiu YM, Ma XM, et al. Tripartite motif 31 promotes resistance to anoikis of hepatocarcinoma cells through regulation of p53-AMPK axis. Exp Cell Res. 2018;368(1):59–66. doi:10.1016/j.yexcr.2018.04.013
50. Zhang HG, Pan YW, Feng J, et al. TRIM66 promotes malignant progression of hepatocellular carcinoma by inhibiting E-cadherin expression through the EMT pathway. Eur Rev Med Pharmacol Sci. 2019;23(5):2003–2012. doi:10.26355/eurrev_201903_17239
51. Fan W, Du F, Liu X. TRIM66 confers tumorigenicity of hepatocellular carcinoma cells by regulating GSK-3 beta-dependent Wnt/beta-catenin signaling. Eur J Pharmacol. 2019;850:109–117. doi:10.1016/j.ejphar.2019.01.054
52. Schulze K, Imbeaud S, Letouze E, et al. Exome sequencing of hepatocellular carcinomas identifies new mutational signatures and potential therapeutic targets. Nat Genet. 2015;47(5):505–U106. doi:10.1038/ng.3252
53. Yang SJ, Pang LW, Dai WL, et al. Role of forkhead box O proteins in hepatocellular carcinoma biology and progression (review). Front Oncol. 2021;11:1797.
54. Dimri M, Satyanarayana A. Molecular signaling pathways and therapeutic targets in hepatocellular carcinoma. Cancers. 2020;12(2). doi:10.3390/cancers12020491
55. Flecken T, Schmidt N, Hild S, et al. Immunodominance and functional alterations of tumor-associated antigen-specific CD8(+) T-cell responses in hepatocellular carcinoma. Hepatology. 2014;59(4):1415–1426. doi:10.1002/hep.26731
56. Ringelhan M, Pfister D, O’connor T, Pikarsky E, Heikenwalder M. The immunology of hepatocellular carcinoma. Nat Immunol. 2018;19(3):222–232. doi:10.1038/s41590-018-0044-z
57. Lo Re O, Mazza T, Giallongo S, et al. Loss of histone macroH2A1 in hepatocellular carcinoma cells promotes paracrine-mediated chemoresistance and CD4(+)CD25(+)FoxP3(+) regulatory T cells activation. Theranostics. 2020;10(2):910–924. doi:10.7150/thno.35045
58. Ouyang F-Z, Wu R-Q, Wei Y, et al. Dendritic cell-elicited B-cell activation fosters immune privilege via IL-10 signals in hepatocellular carcinoma. Nat Commun. 2016;7. doi:10.1038/ncomms13453
59. Li X, Xing Y-F, Lei A-H, et al. Neutrophil count is associated with myeloid derived suppressor cell level and presents prognostic value for hepatocellular carcinoma patients. Oncotarget. 2017;8(15):24380–24388. doi:10.18632/oncotarget.15456
 © 2022 The Author(s). This work is published and licensed by Dove Medical Press Limited. The full terms of this license are available at https://www.dovepress.com/terms.php and incorporate the Creative Commons Attribution - Non Commercial (unported, v3.0) License.
By accessing the work you hereby accept the Terms. Non-commercial uses of the work are permitted without any further permission from Dove Medical Press Limited, provided the work is properly attributed. For permission for commercial use of this work, please see paragraphs 4.2 and 5 of our Terms.
© 2022 The Author(s). This work is published and licensed by Dove Medical Press Limited. The full terms of this license are available at https://www.dovepress.com/terms.php and incorporate the Creative Commons Attribution - Non Commercial (unported, v3.0) License.
By accessing the work you hereby accept the Terms. Non-commercial uses of the work are permitted without any further permission from Dove Medical Press Limited, provided the work is properly attributed. For permission for commercial use of this work, please see paragraphs 4.2 and 5 of our Terms.