")
Back to Journals » OncoTargets and Therapy » Volume 11
Identification of tumor-educated platelet biomarkers of non-small-cell lung cancer
Authors Sheng ML, Dong ZH, Xie YP
Received 15 June 2018
Accepted for publication 15 October 2018
Published 14 November 2018 Volume 2018:11 Pages 8143—8151
DOI https://doi.org/10.2147/OTT.S177384
Checked for plagiarism Yes
Review by Single anonymous peer review
Peer reviewer comments 2
Editor who approved publication: Dr Jianmin Xu
Meiling Sheng,1,* Zhaohui Dong,2,* Yanping Xie3
1Department of Respiration, Jinhua People’s Hospital, Jinhua, Zhejiang 321000, China; 2Department of Intensive Care Unit, First Hospital of Huzhou, First Affiliated Hospital of Huzhou University, Huzhou, Zhejiang 313000, China; 3Department of Respiratory Medicine, First Hospital of Huzhou, First Affiliated Hospital of Huzhou University, Huzhou, Zhejiang 313000, China
*These authors contributed equally to this work
Background: Lung cancer is a severe cancer with a high death rate. The 5-year survival rate for stage III lung cancer is much lower than stage I. Early detection and intervention of lung cancer patients can significantly increase their survival time. However, conventional lung cancer-screening methods, such as chest X-rays, sputum cytology, positron-emission tomography (PET), low-dose computed tomography (CT), magnetic resonance imaging, and gene-mutation, -methylation, and -expression biomarkers of lung tissue, are invasive, radiational, or expensive. Liquid biopsy is non-invasive and does little harm to the body. It can reflect early-stage dysfunctions of tumorigenesis and enable early detection and intervention.
Methods: In this study, we analyzed RNA-sequencing data of tumor-educated platelets (TEPs) in 402 non-small-cell lung cancer (NSCLC) patients and 231 healthy controls. A total of 48 biomarker genes were selected with advanced minimal-redundancy, maximal-relevance, and incremental feature-selection (IFS) methods.
Results: A support vector-machine (SVM) classifier based on the 48 biomarker genes accurately predicted NSCLC with leave-one-out cross-validation (LOOCV) sensitivity, specificity, accuracy, and Matthews correlation coefficients of 0.925, 0.827, 0.889, and 0.760, respectively. Network analysis of the 48 genes revealed that the WASF1 actin cytoskeleton module, PRKAB2 kinase module, RSRC1 ribosomal protein module, PDHB carbohydrate-metabolism module, and three intermodule hubs (TPM2, MYL9, and PPP1R12C) may play important roles in NSCLC tumorigenesis and progression.
Conclusion: The 48-gene TEP liquid-biopsy biomarkers will facilitate early screening of NSCLC and prolong the survival of cancer patients.
Keywords: tumor-educated platelet, TEP, liquid biopsy, minimal redundancy, maximal relevance, MRMR, incremental feature selection, IFS, non-small-cell lung cancer, NSCLC
Introduction
Lung cancer is a severe cancer with a high death rate.1,2 Early detection of lung cancer is the most effective way to increase survival time, since survival time is directly associated with lung cancer stage and early-treatment patients will have better diagnoses.3 The 5-year survival rates for stage I and stage III lung cancer patients are 67% and 23%, respectively.3 The survival difference between early-stage and late-stage lung cancer is huge. Therefore, early screening of lung cancer is the key to lung cancer prevention and therapy.
Conventionally, lung cancer is detected through chest X-rays, sputum cytology, positron-emission tomography (PET), low-dose computed tomography (CT), and magnetic resonance imaging.4 However, many diagnosed patients are already in late stages.5 Although PET and CT are developing progressively higher resolutions and can detect smaller tumors, they are radiational and expensive.
In recent years, sequencing technologies have developed rapidly. It has been found that tumor tissue can release small numbers of tumor cells, DNA, RNA, or exosomes into blood. These tumor cells in blood are called circulating tumor cells (CTCs).6 Nowadays, CTCs can be isolated and DNA and RNA with CTCs sequenced accurately.7 Other types of liquid-biopsy components include ctDNA, ctRNA, exosomes, and tumor-educated platelets (TEPs).8 Tumor-derived exosomes contain various molecules, such as dsDNA and small RNA, and can reflect the status of tumor cells.9 TEPs are blood platelets that contain tumor RNAs.10 They are a great source of tumor-derived RNAs. There have been several studies showing that TEP RNAs can be cancer biomarkers.10–12 Liquid biopsy has become ever more important in early lung cancer detection and is the one of the foundations of personalized medicine.13 It can reflect early-stage dysfunctions of tumorigenesis and enable early detection and intervention.
In this study, we analyzed RNA-sequencing data of TEPs in 402 non-small-cell lung cancer (NSCLC) patients and 231 healthy controls. By comparing their expression differences with the minimal redundancy, maximal relevance (MRMR) method, differentially expressed genes were ranked. Then, with incremental feature selection (IFS), optimal biomarkers were selected. Finally, a support vector machine (SVM) classifier based on the optimal biomarkers was constructed and evaluated. TEP biomarkers could be a useful way to enable early intervention in lung cancer patients and prolong their survival.
Methods
Blood gene-expression profiles of NSCLC
Blood gene-expression profiles of NSCLC patients were downloaded from the Gene Expression Omnibus with accession number GSE8984314 (https://www.ncbi.nlm.nih.gov/geo/query/acc.cgi?acc=GSE89843). There were 402 NSCLC samples and 231 healthy control samples. Samples with chronic pancreatitis, epilepsy, multiple sclerosis, insignificant atherosclerosis, pulmonary hypertension, stable angina pectoris, and unstable angina pectoris were excluded. Expression levels of 4,722 genes in TEPs were measured using RNA sequencing. We considered the 402 NSCLC samples as positive samples, the 231 healthy control samples as negative samples, and the expression levels of the 4,722 genes as classification features. The goal was to identify the differentially expressed genes between NSCLC and healthy controls and construct an effective TEP-biomarker-based NSCLC classifier. The workflow of TEP-biomarker-based NSCLC-classifier construction is shown in Figure 1. First, TEP data were preprocessed as a matrix with rows of samples and columns with genes. Then, genes were ranked with the MRMR method.15 After MRMR, the genes were all ranked. Then, with the ranked-gene list, the IFS method18–23 was used to optimize the biomarker-gene set. Finally, biomarkers were determined and the final SVM classifier constructed. Each step is illustrated in the following sections.
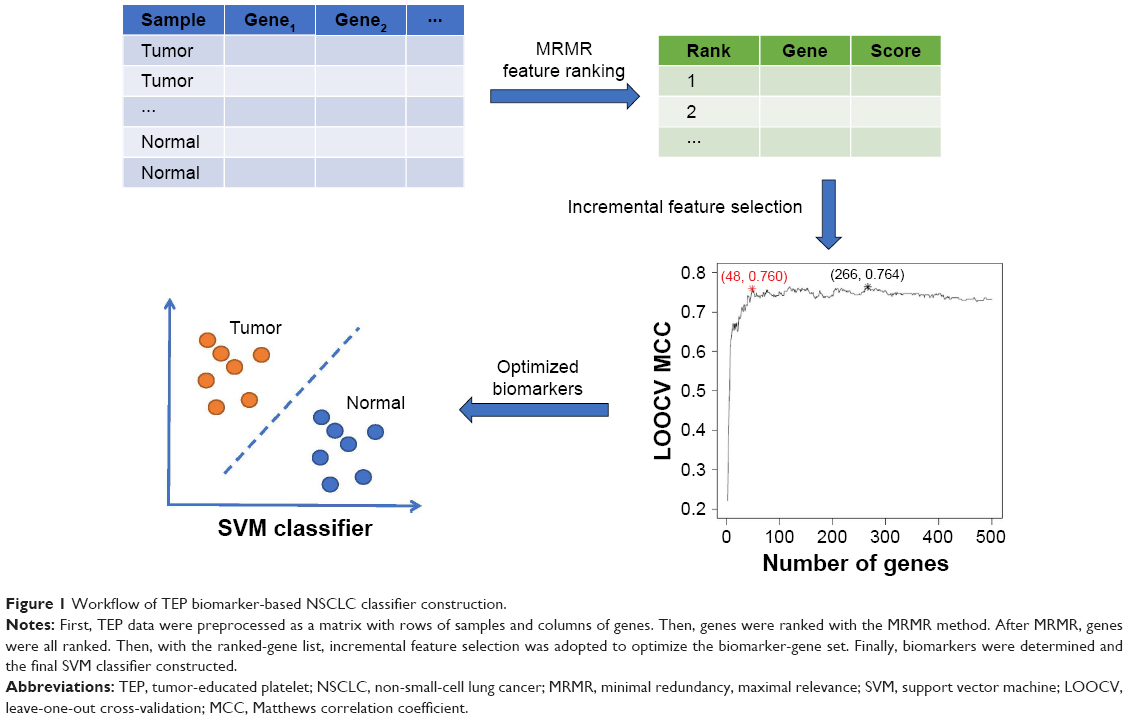 | Figure 1 Workflow of TEP biomarker-based NSCLC classifier construction. |
Biomarker-gene selection based on MRMR and IFS methods
We used the MRMR method15 to rank the genes based on their relevance with sample labels (NSCLC or healthy controls) and redundancy between genes. To illustrate this method clearly, let us use Ω, Ωs, and Ωt to represent the complete set of candidate genes for biomarker ranking, the selected m biomarker genes, and the to-be-selected n genes, respectively. The relevance of gene g from Ωt with sample type t can be measured with mutual information (I):16,17
| (1) |

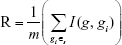
After we defined mutual information, the redundancy (R) of the gene g with the selected biomarker genes in Ωs can be calculated:
|
|
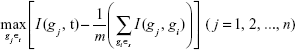
To select the best gene gj from Ωt that can maximize its relevance with sample type t and minimize its redundancy with the selected biomarker genes in Ωs, we need to maximize the MRMR function:
|
|
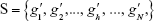
After n rounds of evaluation, a ranked-gene list can be obtained:
| (4) |
The position of a gene in this ranked list (h) reflects the trade-off between relevance with sample classes, ie, whether a sample is NSCLC, and redundancy with selected biomarker genes, ie, genes with smaller index values. The genes on the top are better than the genes on the bottom.
To reduce computation complexity, we analyzed only the top 500 MRMR genes. To determine how many genes should be selected to form the optimal biomarkers, we adopted the IFS method18–23 and constructed 500 SVM classifiers. In this study, we used the SVM function with default parameters from R package e10171 (https://cran.r-project.org/web/packages/e1071) to build the SVM classifier. Each time, a candidate gene set Sk = {g′1, g′2, ..., g′k} (1 ≤ k ≤ 500) of the top k genes in the MRMR list was used to build the SVM classifier. The performance of the top k-gene classifier was evaluated with leave-one-out cross-validation (LOOCV). Finally, an IFS curve was plotted, with the top genes used as the x-axis and the LOOCV Matthews correlation coefficients (MCCs) of classifiers as the y-axis. Based on the IFS curve, we can decide how many genes should be used to build a classifier with great performance and little complexity. Usually, the peak or the change point of the IFS curve was chosen.
Prediction-performance evaluation of SVM classifier
As mentioned, LOOCV,24,25 also known as jackknife testing, was used to evaluate the prediction performance of each SVM classifier. LOOCV continues for n rounds to test all samples one by one. In each round of LOOCV, one sample was tested while the other samples were trained. After n rounds, all samples were tested one at a time. LOOCV is widely used to evaluate prediction performance.26 Although the independent test has also been widely used, the selection of independent-test samples is arbitrary, and sometimes the choice of different validation cohorts may lead to totally different conclusions, as the validation samples may have different distributions from the training samples.26 Cross-validation can overcome these problems.26
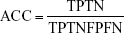
By comparing the predicted sample classes with the actual sample classes, sensitivity (Sn), specificity (Sp), accuracy (ACC), and MCC were calculated to evaluate prediction performance:
|
|

|
|

|
|
|
|
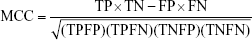
where TP, TN, FP, and FN stand for true positive (NSCLC), true negative (healthy control), false positive (NSCLC), and false negative (healthy control), respectively. Since the sizes of positive (NSCLC) and negative (healthy control) samples were imbalanced in this study, MCC was a better measurement than ACC. MCC considered both sensitivity and specificity.27
Results and discussion
Genes showing different expression patterns between NSCLC and healthy controls
We obtained the top 500 most discriminative genes of NSCLC and healthy control samples using the MRMR method. The MRMR method is based on information theory. Mutual information is used to measure relevance and redundancy. It has been widely used in the bioinformatics field.28–32 We used a C/C++ version of MRMR software (http://home.penglab.com/proj/mRMR/) to apply the gene-ranking process. Unlike statistical test methods, such as the t-test for case–control experiment design and ANOVA for multiple-group design, MRMR not only considers the relevance between genes and sample classes but also redundancy between genes.
Optimal biomarkers identified from MRMR gene list with IFS methods
After MRMR analysis, we applied the IFS procedure to select the optimal number of top MRMR genes to form the biomarker-gene set. The relationship between the number of genes and prediction MCCs was plotted as an IFS curve (Figure 2). It can be seen that when 266 genes were used, the LOOCV MCC was the highest – 0.764, but even early, when only 48 genes were used, the MCC was 0.760. To consider both using fewer genes and achieving higher prediction MCC, we chose the 48 genes as the optimal biomarker-gene set, since increasing the number of genes beyond 48 would not significantly increase the MCC any more. The 48 genes are shown in Table 1.
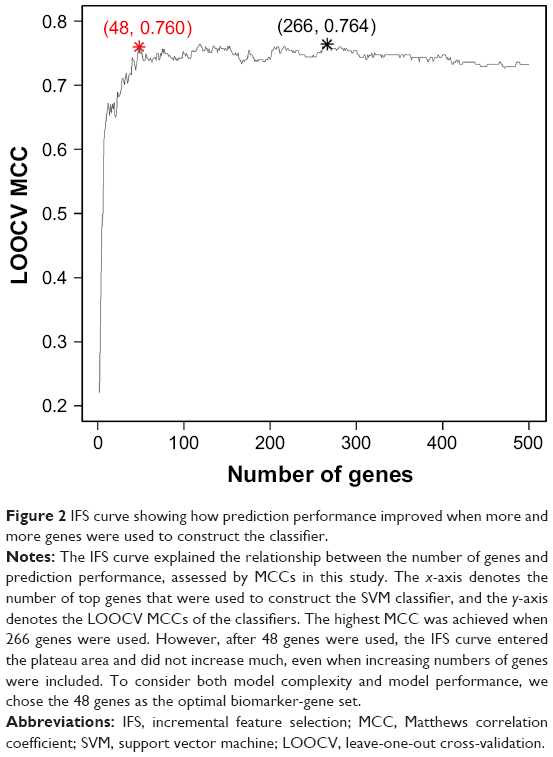 | Figure 2 IFS curve showing how prediction performance improved when more and more genes were used to construct the classifier. |
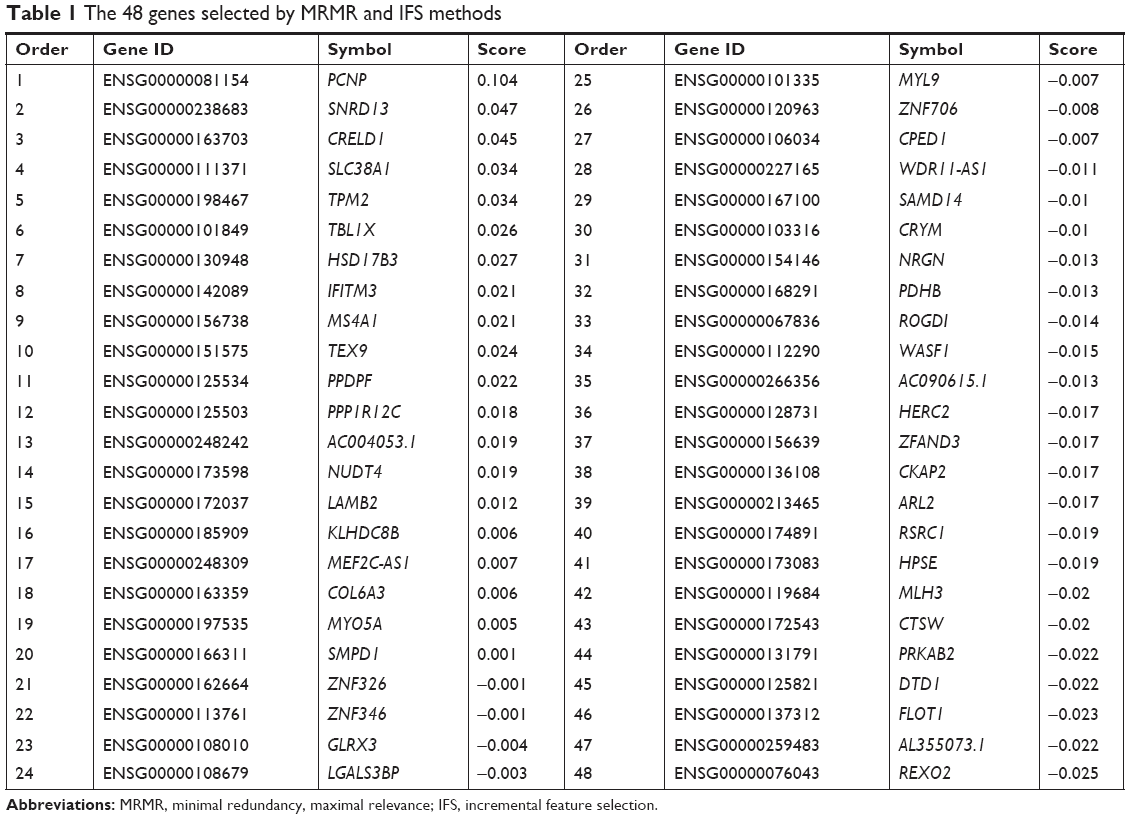 | Table 1 The 48 genes selected by MRMR and IFS methods |
Prediction performance of the 48-gene classifier
The 48 genes were chosen based on MRMR and IFS methods. To evaluate their prediction power objectively, we calculated LOOCV sensitivity, specificity, accuracy, and MCC. The confusion matrix of predicted sample classes and actual sample classes is shown in Table 2. LOOCV sensitivity, specificity, accuracy and MCC of the 48-gene classifier were 0.925, 0.827, 0.889, and 0.760, respectively.
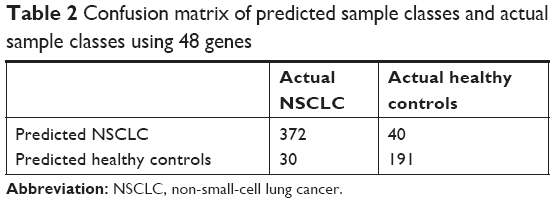 | Table 2 Confusion matrix of predicted sample classes and actual sample classes using 48 genes |
To demonstrate more intuitively the discriminative power of these 48 genes for NSCLC and healthy control samples, we draw a heat map using these 48 genes (Figure 3). It can be seen that even without an advanced machine-learning algorithm, such as SVM, the simple hierarchical clustering can group most NSCLC and healthy control samples into the right clusters. Upregulation and downregulation patterns of these 48 genes were very clear between NSCLC and healthy control samples.
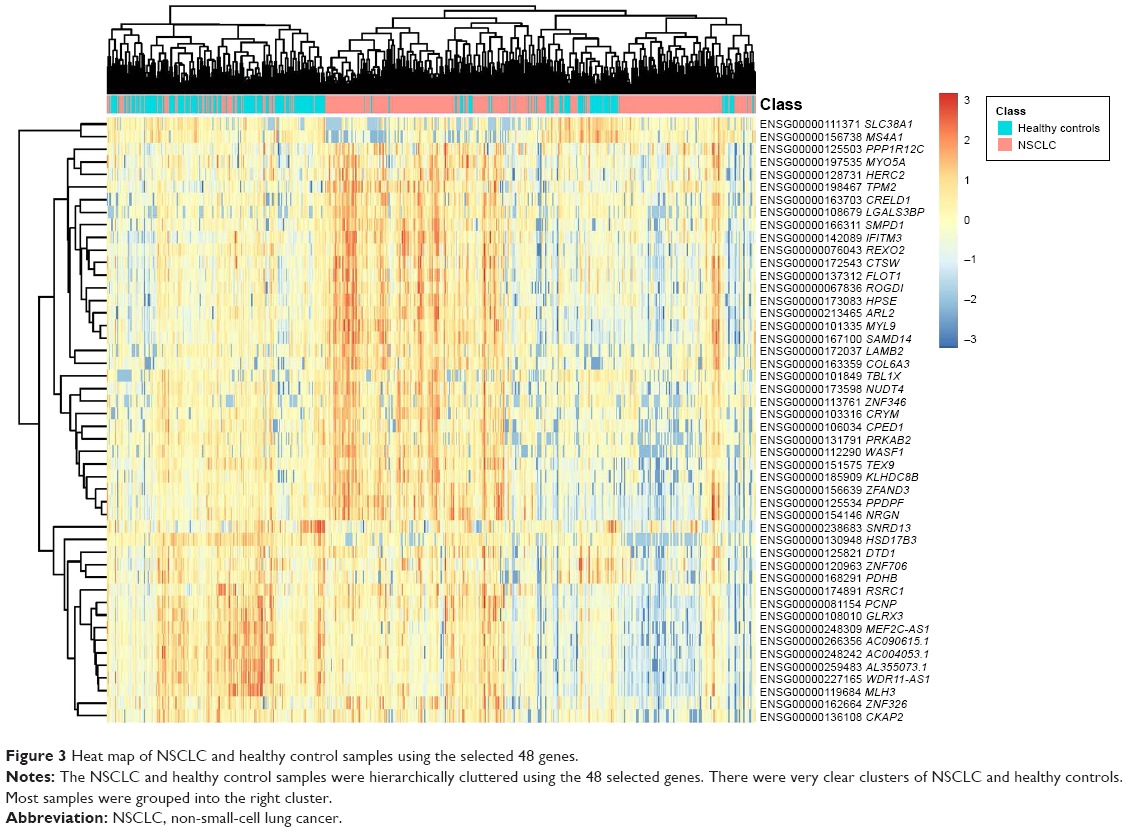 | Figure 3 Heat map of NSCLC and healthy control samples using the selected 48 genes. |
Biological significance of the 48 biomarker genes
To explore the regulatory mechanisms of the 48 genes, we mapped them onto Search Tool for the Retrieval of Interacting Genes/Proteins (STRING),33 a comprehensive and widely used protein functional association network.34–39 The subnetwork of these 48 genes extracted from STRING is shown in Figure 4, with selected genes highlighted in red. It can be seen that there were several modules on the network that were circled together.
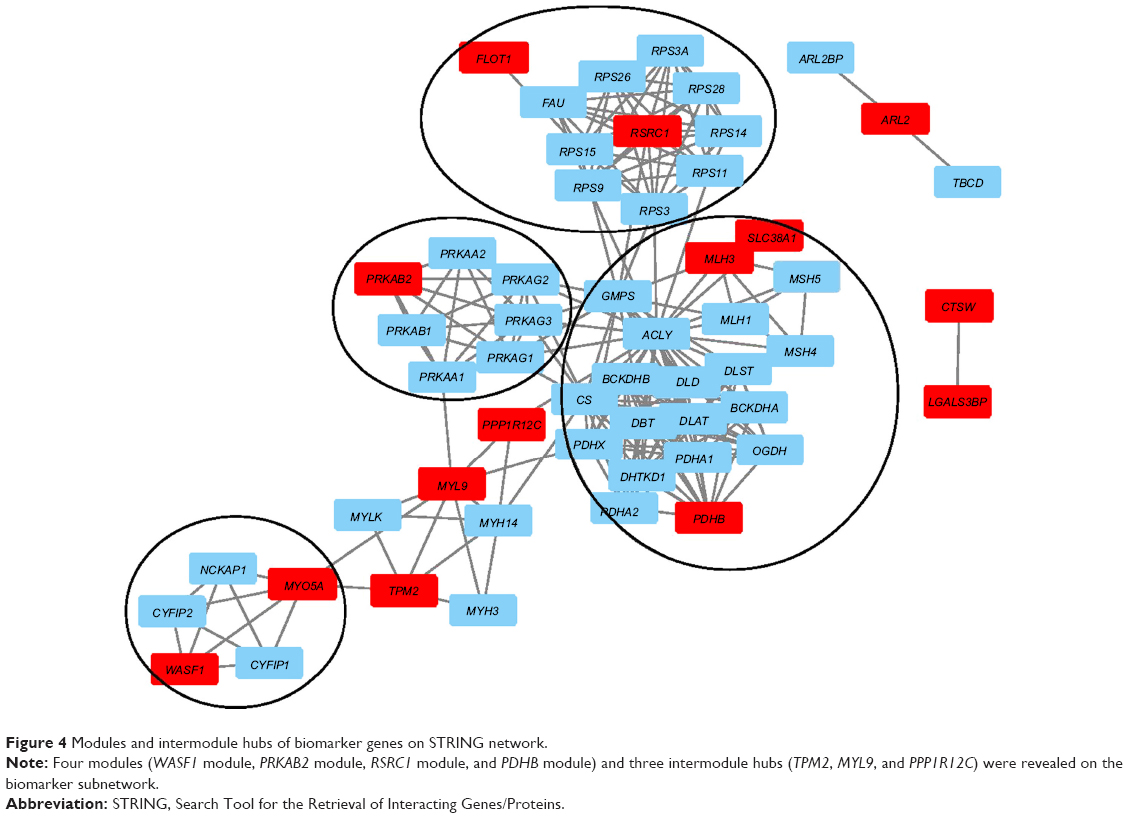 | Figure 4 Modules and intermodule hubs of biomarker genes on STRING network. |
On the bottom left is the WASF1 module which included MYO5A and WASF1. These two genes both interacted with NCKAP1, CYFIP2, and CYFIP1. In this WASF1 module, four genes (CYFIP1, CYFIP2, NCKAP1, and WASF1) were involved in hsa04810: regulation of actin cytoskeleton. It has been reported that actin cytoskeleton was associated with lung cancer migration and invasion.40
The WASF1 module interacted with the PRKAB2 module and PDHB module through the intermodule hubs. There were three intermodule hubs as follows: TPM2, MYL9, and PPP1R12C. They connected the WASF1 actin-cytoskeleton module, the PRKAB2 kinase module, and the PDHB carbohydrate-metabolism module. Interestingly, these intermodule hubs ranked significantly higher than the intramodule genes. TPM2, PPP1R12C, and MYL9 ranked fifth, 12th, and 25th, respectively (Table 1). These intermodule hubs are understudied. Only one study has suggested that MYL9 is downregulated in NSCLC and may be associated with tumorigenesis of NSCLC.41 Unlike traditional lung cancer-tissue analysis, these intermodule hubs may reflect an earlier dysfunction in NSCLC and worth further investigation.
In the PRKAB2 module, PRKAB2 is a family member of AMPK. AMPK is a key pathway in NSCLC and engages in cross talk with the EGFR pathway to sensitize the response of NSCLC cells to lung cancer therapeutics, such as erlotinib treatment.42 In the PDHB module was PDHB, MLH3, and SLC38A1. Functional analysis of these modules using GATHER43 suggested that seven members (ACLY, CS, DLAT, DLST, OGDH, PDHA2, and PDHB) were involved in GO:0006092 main pathways of carbohydrate metabolism, with P<0.0001 and Bayes factor of 21. As we know, one of the hallmarks of cancer is cellular energy metabolism.44 Cancer cell growth and proliferation need a lot of energy. The module was significantly enriched in carbohydrate metabolism. MLH3 and SLC38A1 were less connected with these carbohydrate metabolism genes than PDHB. Also, it has been reported that the haplotype MSH3 was associated with lung cancer45 and SLC38A1 significantly overexpressed in NSCLC.46
At the top middle was the RSRC1 module, which included RSRC1 and FLOT1. Within this module, eight genes (RPS11, RPS14, RPS15, RPS26, RPS28, RPS3, RPS3A, and RPS9) that RSRC1 interacted with were ribosomal protein genes. Ribosome is important for protein biosynthesis, and there have been several reports that downregulation of ribosomal protein can inhibit or attenuate NSCLC growth and migration.47–49 Also, they have been considered oncogenes of NSCLC.49 Another gene was FLOT1. It has been reported that in NSCLC, the expression of FLOT1 was abnormal and correlated with tumor progression and poor survival.50
To summarize, the possible biological mechanism of the NSCLC TEP biomarkers is shown in Figure 5. The intermodule hub genes, including TPM2, MYL9, and PPP1R12C, stitched together the WASF1 module, which regulated actin cytoskeleton, the PRKAB2 module, which was involved in the AMPK–EGFR pathway, and the PDHB module, which was involved in carbohydrate metabolism. The PDHB module interacted with the RSRC1 module, which was associated with protein biosynthesis, growth, and migration.
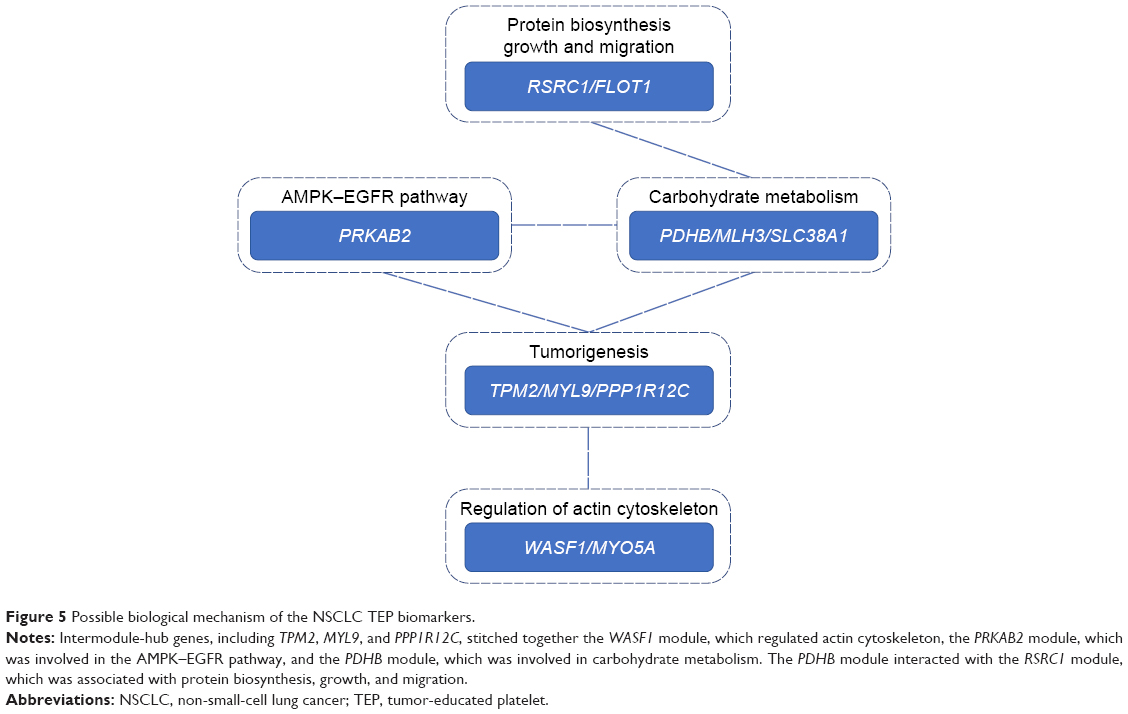 | Figure 5 Possible biological mechanism of the NSCLC TEP biomarkers. |
Conclusion
Early detection of lung cancer is critical for NSCLC patients, since early-stage patients have much longer survival than late-stage patients. Unfortunately, conventional lung cancer screening, such as chest X-rays, sputum cytology, PET, CT, and magnetic resonance imaging, are invasive, radiational, or expensive. Liquid biopsy makes early detection possible, since CTC, ctDNA, ctRNA, exosomes, and TEP reflect early changes during tumorigenesis. By analyzing TEP RNA-sequencing data of NSCLC patients and healthy controls, we identified 48 TEP biomarkers. These biomarkers can accurately predict NSCLC. In-depth biological network analysis suggested that there were four modules and three intermodule hubs that may trigger NSCLC. Our results provided novel insights into tumorigenesis and a useful tool for early detection and treatment of NSCLC.
Acknowledgments
This study was supported by Science Technology Department of Zhejiang Province (2017C37103). Meiling Sheng and Zhaohui Dong are co-first authors for this study.
Disclosure
The authors report no conflicts of interest in this work.
References
Liu C, Zhang YH, Huang T, Cai Y. Identification of transcription factors that may reprogram lung adenocarcinoma. Artif Intell Med. 2017;83:52–57. | ||
Chen L, Huang T, Zhang YH, Jiang Y, Zheng M, Cai YD. Identification of novel candidate drivers connecting different dysfunctional levels for lung adenocarcinoma using protein-protein interactions and a shortest path approach. Sci Rep. 2016;6:29849. | ||
Roberto G, Rosalia R, Giulia S. Diagnostic biomarkers for lung cancer prevention. J Breath Res. 2017;12(2). | ||
Mulshine JL. Screening for lung cancer: in pursuit of pre-metastatic disease. Nat Rev Cancer. 2003;3(1):65–73. | ||
Wang L, Screening WL. Screening and Biosensor-Based Approaches for Lung Cancer Detection. Sensors (Basel). 2017;17(10):E2420. | ||
Masuda T, Hayashi N, Iguchi T, Ito S, Eguchi H, Mimori K. Clinical and biological significance of circulating tumor cells in cancer. Mol Oncol. 2016;10(3):408–417. | ||
Zhang YC, Zhou Q, Wu YL. The emerging roles of NGS-based liquid biopsy in non-small cell lung cancer. J Hematol Oncol. 2017;10(1):167. | ||
Molina-Vila MA, Mayo-de-Las-Casas C, Giménez-Capitán A, et al. Liquid Biopsy in Non-Small Cell Lung Cancer. Front Med. 2016;3(10):69. | ||
Pérez-Callejo D, Romero A, Provencio M, Torrente M. Liquid biopsy based biomarkers in non-small cell lung cancer for diagnosis and treatment monitoring. Transl Lung Cancer Res. 2016;5(5):455–465. | ||
Nilsson RJ, Balaj L, Hulleman E, et al. Blood platelets contain tumor-derived RNA biomarkers. Blood. 2011;118(13):3680–3683. | ||
Best MG, Sol N, Kooi I, et al. RNA-Seq of Tumor-Educated Platelets Enables Blood-Based Pan-Cancer, Multiclass, and Molecular Pathway Cancer Diagnostics. Cancer Cell. 2015;28(5):666–676. | ||
Zhang YH, Huang T, Chen L, et al. Identifying and analyzing different cancer subtypes using RNA-seq data of blood platelets. Oncotarget. 2017;8(50):87494–87511. | ||
Pi C, Zhang MF, Peng XX, Zhang YC, Xu CR, Zhou Q. Liquid biopsy in non-small cell lung cancer: a key role in the future of personalized medicine? Expert Rev Mol Diagn. 2017;17(12):1089–1096. | ||
Best MG, Sol N, In’t Veld SGJG, et al. Swarm Intelligence-Enhanced Detection of Non-Small-Cell Lung Cancer Using Tumor-Educated Platelets. Cancer Cell. 2017;32(2):238–252.e9. | ||
Peng H, Long F, Ding C. Feature selection based on mutual information: criteria of max-dependency, max-relevance, and min-redundancy. IEEE Trans Pattern Anal Mach Intell. 2005;27(8):1226–1238. | ||
Huang T, Cai YD. An information-theoretic machine learning approach to expression QTL analysis. PLoS One. 2013;8(6):e67899. | ||
Sun L, Yu Y, Huang T, et al. Associations between ionomic profile and metabolic abnormalities in human population. PLoS One. 2012;7(6):e38845. | ||
Zhang N, Huang T, Cai YD. Discriminating between deleterious and neutral non-frameshifting indels based on protein interaction networks and hybrid properties. Mol Genet Genomics. 2015;290(1):343–352. | ||
Shu Y, Zhang N, Kong X, Huang T, Cai YD. Predicting A-to-I RNA editing by feature selection and random forest. PLoS One. 2014;9(10):e110607. | ||
Li BQ, You J, Huang T, Cai YD. Classification of non-small cell lung cancer based on copy number alterations. PLoS One. 2014;9(2):e88300. | ||
Jiang Y, Huang T, Chen L, Gao YF, Cai Y, Chou KC. Signal propagation in protein interaction network during colorectal cancer progression. Biomed Res Int. 2013;2013. | ||
Zhang PW, Chen L, Huang T, Zhang N, Kong XY, Cai YD. Classifying ten types of major cancers based on reverse phase protein array profiles. PLoS One. 2015;10(3):e0123147. | ||
Huang T, Shu Y, Cai YD. Genetic differences among ethnic groups. BMC Genomics. 2015;16(1):1093. | ||
Yang J, Chen L, Kong X, Huang T, Cai YD. Analysis of tumor suppressor genes based on gene ontology and the KEGG pathway. PLoS One. 2014;9(9):e107202. | ||
Cui W, Chen L, Huang T, et al. Computationally identifying virulence factors based on KEGG pathways. Mol Biosyst. 2013;9(6):1447–1452. | ||
Chou KC. Some remarks on protein attribute prediction and pseudo amino acid composition. J Theor Biol. 2011;273(1):236–247. | ||
Huang T, Wang M, Cai YD. Analysis of the preferences for splice codes across tissues. Protein Cell. 2015;6(12):904–907. | ||
Zhou Y, Zhang N, Li BQ, Huang T, Cai YD, Kong XY. A method to distinguish between lysine acetylation and lysine ubiquitination with feature selection and analysis. J Biomol Struct Dyn. 2015;33(11):2479–2490. | ||
Zhao TH, Jiang M, Huang T, et al. A novel method of predicting protein disordered regions based on sequence features. Biomed Res Int. 2013;2013. | ||
Niu B, Huang G, Zheng L, et al. Prediction of substrate-enzyme-product interaction based on molecular descriptors and physicochemical properties. Biomed Res Int. 2013;2013. | ||
Zhang N, Wang M, Zhang P, Huang T. Classification of cancers based on copy number variation landscapes. Biochim Biophys Acta. 2016;1860(11 Pt B):2750–2755. | ||
Liu L, Chen L, Zhang YH, et al. Analysis and prediction of drug-drug interaction by minimum redundancy maximum relevance and incremental feature selection. J Biomol Struct Dyn. 2017;35(2):312–329. | ||
Franceschini A, Szklarczyk D, Frankild S, et al. STRING v9.1: protein-protein interaction networks, with increased coverage and integration. Nucleic Acids Res. 2013;41(Database issue):D808–D815. | ||
Chen L, Pan H, Zhang YH, et al. Network-Based Method for Identifying Co-Regeneration Genes in Bone, Dentin, Nerve and Vessel Tissues. Genes (Basel). 2017;8(10):252. | ||
Li J, Chen L, Wang S, et al. A computational method using the random walk with restart algorithm for identifying novel epigenetic factors. Mol Genet Genomics. 2018;293(1):293–301. | ||
Chen L, Yang J, Xing Z, et al. An integrated method for the identification of novel genes related to oral cancer. PLoS One. 2017;12(4):e0175185. | ||
Chen L, Zhang YH, Huang T, Cai YD. Identifying novel protein phenotype annotations by hybridizing protein-protein interactions and protein sequence similarities. Mol Genet Genomics. 2016;291(2):913–934. | ||
Cai YD, Zhang Q, Zhang YH, Chen L, Huang T. Identification of Genes Associated with Breast Cancer Metastasis to Bone on a Protein-Protein Interaction Network with a Shortest Path Algorithm. J Proteome Res. 2017;16(2):1027–1038. | ||
Huang T, Liu CL, Li LL, et al. A new method for identifying causal genes of schizophrenia and anti-tuberculosis drug-induced hepatotoxicity. Sci Rep. 2016;6(1):32571. | ||
Zhao H, Jiao Y, Zhang Z. Deguelin inhibits the migration and invasion of lung cancer A549 and H460 cells via regulating actin cytoskeleton rearrangement. Int J Clin Exp Pathol. 2015;8(12):15582–15590. | ||
Tan X, Chen M. MYLK and MYL9 expression in non-small cell lung cancer identified by bioinformatics analysis of public expression data. Tumour Biol. 2014;35(12):12189–12200. | ||
Praveen P, Hülsmann H, Sültmann H, Kuner R, Fröhlich H. Cross-talk between AMPK and EGFR dependent Signaling in Non-Small Cell Lung Cancer. Sci Rep. 2016;6(1):27514. | ||
Chang JT, Nevins JR. GATHER: a systems approach to interpreting genomic signatures. Bioinformatics. 2006;22(23):2926–2933. | ||
Hanahan D, Weinberg RA. Hallmarks of cancer: the next generation. Cell. 2011;144(5):646–674. | ||
Michiels S, Danoy P, Dessen P, et al. Polymorphism discovery in 62 DNA repair genes and haplotype associations with risks for lung and head and neck cancers. Carcinogenesis. 2007;28(8):1731–1739. | ||
Leithner K, Hirschmugl B, Li Y, et al. TASK-1 Regulates Apoptosis and Proliferation in a Subset of Non-Small Cell Lung Cancers. PLoS One. 2016;11(6):e0157453. | ||
Chen B, Zhang W, Gao J, et al. Downregulation of ribosomal protein S6 inhibits the growth of non-small cell lung cancer by inducing cell cycle arrest, rather than apoptosis. Cancer Lett. 2014;354(2):378–389. | ||
Abdulrahman N, Jaballah M, Poomakkoth N, et al. Inhibition of p90 ribosomal S6 kinase attenuates cell migration and proliferation of the human lung adenocarcinoma through phospho-GSK-3β and osteopontin. Mol Cell Biochem. 2016;418(1–2):21–29. | ||
Zhang Y, Zhang G, Li X, Li B, Zhang X. The effect of ribosomal protein S15a in lung adenocarcinoma. PeerJ. 2016;4(5):e1792. | ||
Li H, Wang RM, Liu SG, et al. Abnormal expression of FLOT1 correlates with tumor progression and poor survival in patients with non-small cell lung cancer. Tumour Biol. 2014;35(4):3311–3315. |
 © 2018 The Author(s). This work is published and licensed by Dove Medical Press Limited. The full terms of this license are available at https://www.dovepress.com/terms.php and incorporate the Creative Commons Attribution - Non Commercial (unported, v3.0) License.
By accessing the work you hereby accept the Terms. Non-commercial uses of the work are permitted without any further permission from Dove Medical Press Limited, provided the work is properly attributed. For permission for commercial use of this work, please see paragraphs 4.2 and 5 of our Terms.
© 2018 The Author(s). This work is published and licensed by Dove Medical Press Limited. The full terms of this license are available at https://www.dovepress.com/terms.php and incorporate the Creative Commons Attribution - Non Commercial (unported, v3.0) License.
By accessing the work you hereby accept the Terms. Non-commercial uses of the work are permitted without any further permission from Dove Medical Press Limited, provided the work is properly attributed. For permission for commercial use of this work, please see paragraphs 4.2 and 5 of our Terms.