")
Back to Journals » Diabetes, Metabolic Syndrome and Obesity » Volume 12
Identification of Transcriptional Metabolic Dysregulation in Subtypes of Pituitary Adenoma by Integrated Bioinformatics Analysis
Authors Hu J, Yin H, Li B, Yang H
Received 5 August 2019
Accepted for publication 6 November 2019
Published 27 November 2019 Volume 2019:12 Pages 2441—2451
DOI https://doi.org/10.2147/DMSO.S226056
Checked for plagiarism Yes
Review by Single anonymous peer review
Peer reviewer comments 2
Editor who approved publication: Prof. Dr. Antonio Brunetti
Jintao Hu,1,* Huachun Yin,1,2,* Bo Li,2 Hui Yang1
1Department of Neurosurgery, Xinqiao Hospital, The Army Medical University, Chongqing, People’s Republic of China; 2College of Life Sciences, Chongqing Normal University, Chongqing, People’s Republic of China
*These authors contributed equally to this work
Correspondence: Bo Li; Hui Yang
Email [email protected]; [email protected]
Background: Pituitary adenoma (PA) is a prevalent intracranial tumor. Metabolites differ between pituitary tumor and healthy tissues or among different tumor subtypes. However, the transcriptional changes in metabolic enzymes, which are usually seemed as targets for metabolic therapy, remain unidentified.
Methods: Using microarray data for 160 samples from the Gene Expression Omnibus database, across the four most common tumor subtypes, we present the integrated identification of differentially expressed genes (DEGs) between tumors and controls.
Results: Subtype-specific DEGs revealed 1081 prolactin tumor-specific DEGs, 437 nonfunctioning tumor-specific DEGs, and 217 common DEGs among the four subtypes. Functional enrichment showed that a lot of biological functions related to metabolism had changed. Twenty-one prolactin and twenty-three nonfunctioning tumor-specific metabolic-related DEGs are mainly involved in fatty acid and nucleotide metabolism, redox reaction, and gluconeogenesis. Eighteen metabolic-related DEGs enriched in the metabolism of xenobiotics by the cytochrome P450 pathway, sulfur metabolism, retinoid metabolism, and glucose homeostasis were abnormal in all subtypes of PA.
Conclusion: Based on a comprehensive bioinformatics analysis of the available PA-related transcriptomics data, we identified specific DEGs related to metabolism, and some of them might be new attractive therapeutic targets. Especially, PDK4 and PCK1 might be new attractive biomarkers and therapeutic targets.
Keywords: pituitary adenoma, differentially expressed genes, metabolic dysregulation, microarray data, metabolism pathway
Introduction
Pituitary adenomas (PAs) are the second most common primary intracranial tumor with an overall prevalence of about 16.7% in the general population.1,2 According to hormone secretion, PAs are grouped into clinical nonfunctioning (NF) adenomas and functional adenomas which include prolactin (PRL)-secreting adenomas, growth hormone (GH)-secreting adenomas, and adrenocorticotropic hormone (ACTH)-secreting adenomas.3 Although PAs are benign tumors, they significantly disturb hormone secretion and affect the quality of life and life span. Of the four most common PA subtypes, those associated with Cushing’s disease (ACTH-secreting), acromegaly (GH-secreting), and NF adenomas are generally treated with transsphenoidal surgery as first-line therapy. However, some PAs can invade the cavernous sinus or surrounding bone in the sellar region, and so it is sometimes difficult to achieve total surgical resection.3 Moreover, currently available pharmacotherapies are not satisfactory. Therefore, there is an urgent need for a new treatment strategy.
Metabolic abnormality is considered as one of the hallmarks of tumor cells.4 Although been a benign tumor, PAs have also shown to undergo metabolic remodeling. Several studies have confirmed differences in metabolites between the pituitary tumor and healthy tissues or among different tumor subtypes by using mass spectrometry or nuclear magnetic resonance spectrometry.5,6 Based on the metabolomics profiles of PAs, several differential metabolite-related enzymes were regarded as the specific therapeutic targets clinically. We previously reported that lactate dehydrogenase A (LDHA), a key glycolysis enzyme, was overexpressed in invasive PAs and was a promising therapeutic target.7
Along with the continuous development of transcriptomics techniques, a large amount of datasets were released in public databases, such as Gene Expression Omnibus database (GEO),8 ArrayExpress,9 and so on. These valuable resources bring an opportunity for exploring the molecular pathogenesis underlying the complex disease. For instance, the systematical investigation for various metabolic reprogramming of tumors was performed using the published transcriptomics data.10,11 To date, there is almost no such transcriptomics research identifying metabolic-related genes and the mechanisms underlying PA development.
In this study, several datasets on PAs from GEO databases were collected and systematically integrated into a large gene expression dataset. Subsequently, differentially expressed genes (DEGs) were screened, annotated, and analyzed statistically. As a result, screened DEGs were enriched in dozens of pathways associated with metabolism, and next, many metabolism-related genes were identified. These results showed that dysregulated metabolisms may be crucial roles in PA pathogenesis. This is the first transcriptome analysis of metabolism-related pituitary tumors, including four hormone subtypes and the normal pituitary. The strategy proposed, along with the metabolism-related DEGs identified in this study, provides a theoretical framework for understanding metabolic changes and developing metabolism-based therapeutics for PAs.
Materials and Methods
Identification of Eligible Gene Expression Datasets
Published studies on the expression profile of human pituitary adenomas were screened by searching “pituitary”, “pituitary adenoma”, “pituitary tumor”, “prolactinoma”, “growth hormone”, and “Cushing disease” in the GEO database (http://www.ncbi.nlm.nih.gov/geo/). Datasets containing the gene expression data of normal human pituitary or the four main subtypes of pituitary tumors were collected and for which raw data were not available were excluded.
Data Preprocessing and Normalization
For raw probe-level microarray datasets, those from Affymetrix platform were normalized using the robust multi-array average method,12 while those from Agilent and Illumina were quantile-normalized and then log2-transformed.13,14 It is worth noting that the negative value was replaced with the smallest positive value in the gene expression matrix before log2 transformation. By using array probe-gene annotation files from GEO, the microarray-specific probe identifiers (IDs) were parsed into gene Entrez IDs, and then the mean expression value was calculated as the expression value in repeated genes according to Entrez IDs.
Data Integration and Batch Effect Removal
To combine these datasets from diverse sources, we extracted the shared genes of all microarray platforms used in this study. Based on the shared genes, the multiple normalized datasets were merged into a large dataset by gene Entrez IDs. Then, we used a combat algorithm in sva package to remove the batch effect so that the comparability between these datasets or samples was enhanced.15
Identification of Differentially Expressed Genes
DEGs between tumors and healthy controls for each subtype of PAs were identified using limma package.13 Specifically, linear model and empirical Bayes (eBayes) statistics were utilized to evaluate the differential expression for all genes, and finally, those with fold change (FC) >1.4 and P value <0.1 were considered as the DEGs.
Subtype-Specific and Common Tumor Markers
To pick up subtype-specific and common tumor markers, the intersection and union of subtype DEGs were computed and visualized using the Venn Diagram package.16 The genes appearing in only one subtype were considered as subtype-specific candidate markers, while those appearing in the four subtypes were considered as common candidate tumor markers.
Gene Ontology and Pathway Enrichment Analysis
To investigate the functional annotation of specific and common markers in each subtype, the enrichment analysis for gene ontology (GO) were performed using the DAVID web server (version 6.8) with a 0.05 cutoff criterion.17 Enriched pathway analysis was carried out using clusterProfiler package with a 0.05 cutoff criterion,18 based on Kyoto Encyclopedia of Genes and Genomes (KEGG) pathway database.
To determine the changed tendency of pathways in tumors, the Z-score was calculated in each term using the following formula:19,20
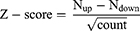
The Nup Ndown separately represents the number of up- and down-regulated genes between tumors and normal controls, and the count is the number of DEGs belonging to this term.
Specific Marker in the PPI Network
Protein–protein interaction (PPI) networks were constructed using the STRINGdb package.21 The interaction pair in PPI networks with a combined score >0.7 was identified. The networks were visualized and analyzed in Cytoscape software (version 3.6).22 The Molecular Complex Detection (MCODE) plugin Cytoscape was applied to screen notable modules from the PPI network,23 and the following parameters were set in the advanced options: degree cutoff = 2, node score cutoff = 0.2, and K-core = 2. Significant modules were identified with scores and nodes > 2.
The whole process steps are diagramed in Figure 1.
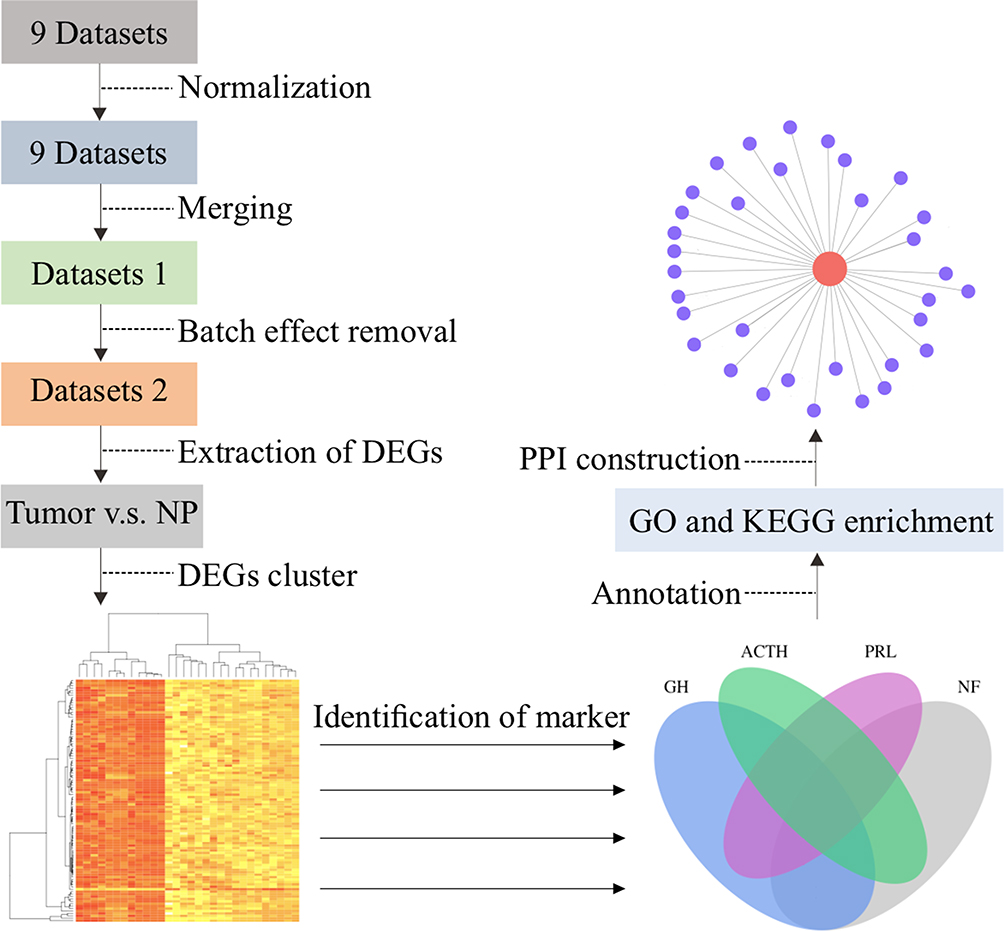 |
Figure 1 The workflow of microarray data integrating and subsequently analyzing in this study. Nine datasets were analyzed in the study after normalization and batch effect removal, the DEGs were extracted by pairwise comparison (GH-NP, ACTH-NP, PRL-NP, NF-NP), and the visualization of clustered results showing with heatmap, respectively. The specific markers and common markers obtained from the DEGs overlap by the Venn diagram. Each specific and common marker was functionally characterized using gene ontology (GO) and Kyoto Encyclopedia of Genes and Genomes (KEGG) database. Then, protein–protein interaction network and network modules were constructed. |
Results
Data Integration and Identification of DEGs
Nine gene expression profiles were collected from the GEO database. A total of 160 samples included 52 ACTH-secreting PAs, 38 GH-secreting PAs, 40 NF PAs, 9 PRL-secreting PAs, and 21 normal pituitary (NP) samples (Table 1).
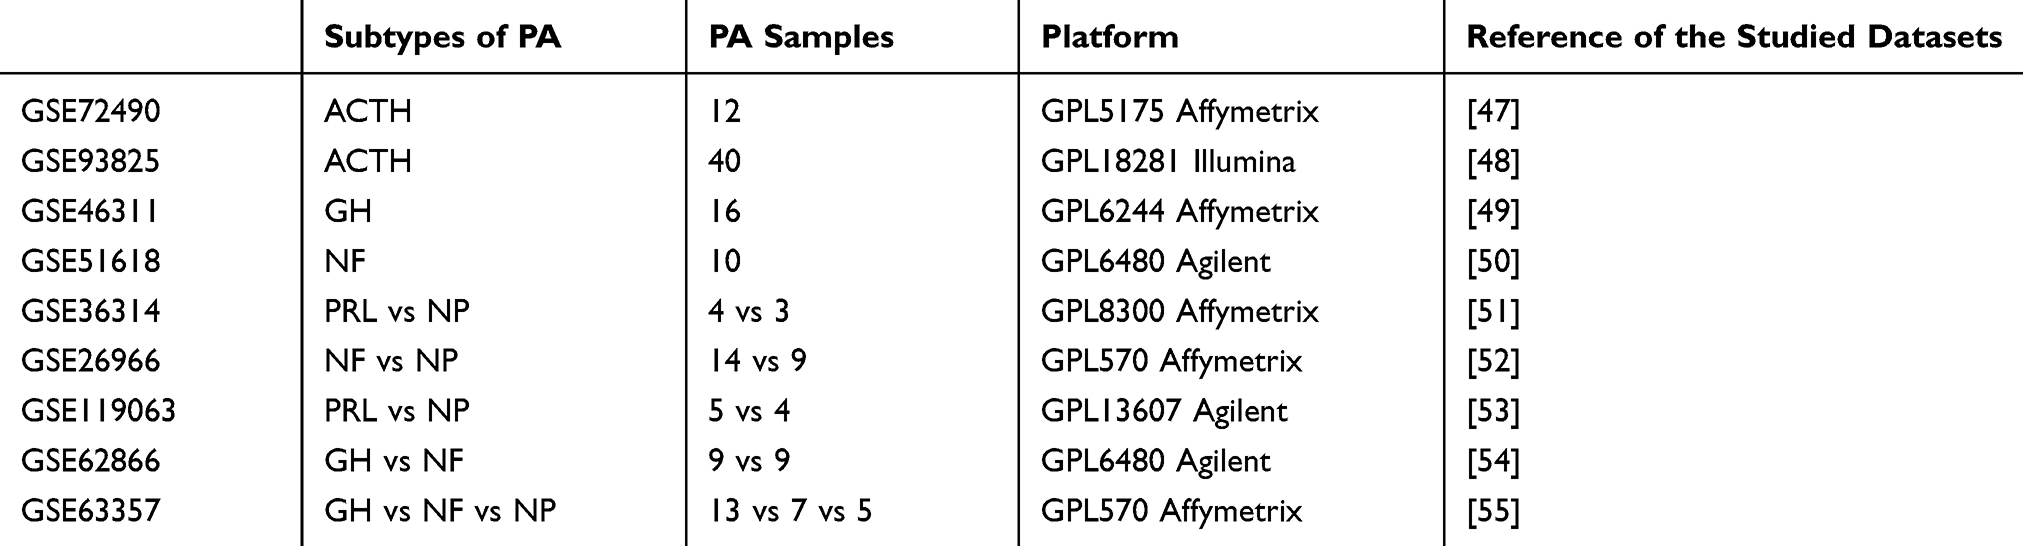 |
Table 1 Microarray Datasets for PA Collected for Analysis in This Study |
After datasets were combined, 6818 shared genes were obtained. The large dataset was then performed global normalization and batch effect correction (Supplemental Figure 1A), and the expression values of PAs and NPs were compared to identify the DEGs related to the subtype. To extract more DEGs from each subtypes, we set relax cut‐off criterion as p < 0.1 and |logFC| >1.4, provided by Xinxia Peng’ research,24 leading to the identification of 512 DEGs in GH-secreting PAs, 392 DEGs in ACTH-secreting PAs, 1581 DEGs in PRL-secreting PAs, and 1149 DEGs in NF PAs (Supplementary Materials S1-4). Cluster analysis showed that tumor and normal samples were well separated (Supplemental Figure 1B–E).
Identification of Markers and KEGG Pathway Analysis of DEGs
Twenty-two GH-specific DEGs, 1081 PRL-specific DEGs, 437 NF-specific DEGs, and 217 common DEGs were identified and visualized using the Venn diagram (Figure 2A), except for ACTH-specific DEGs. Detailed information of specific and common DEGs are displayed in Supplementary Materials S1-5. The top five up- and down-regulated specific DEGs are listed in Table 2.
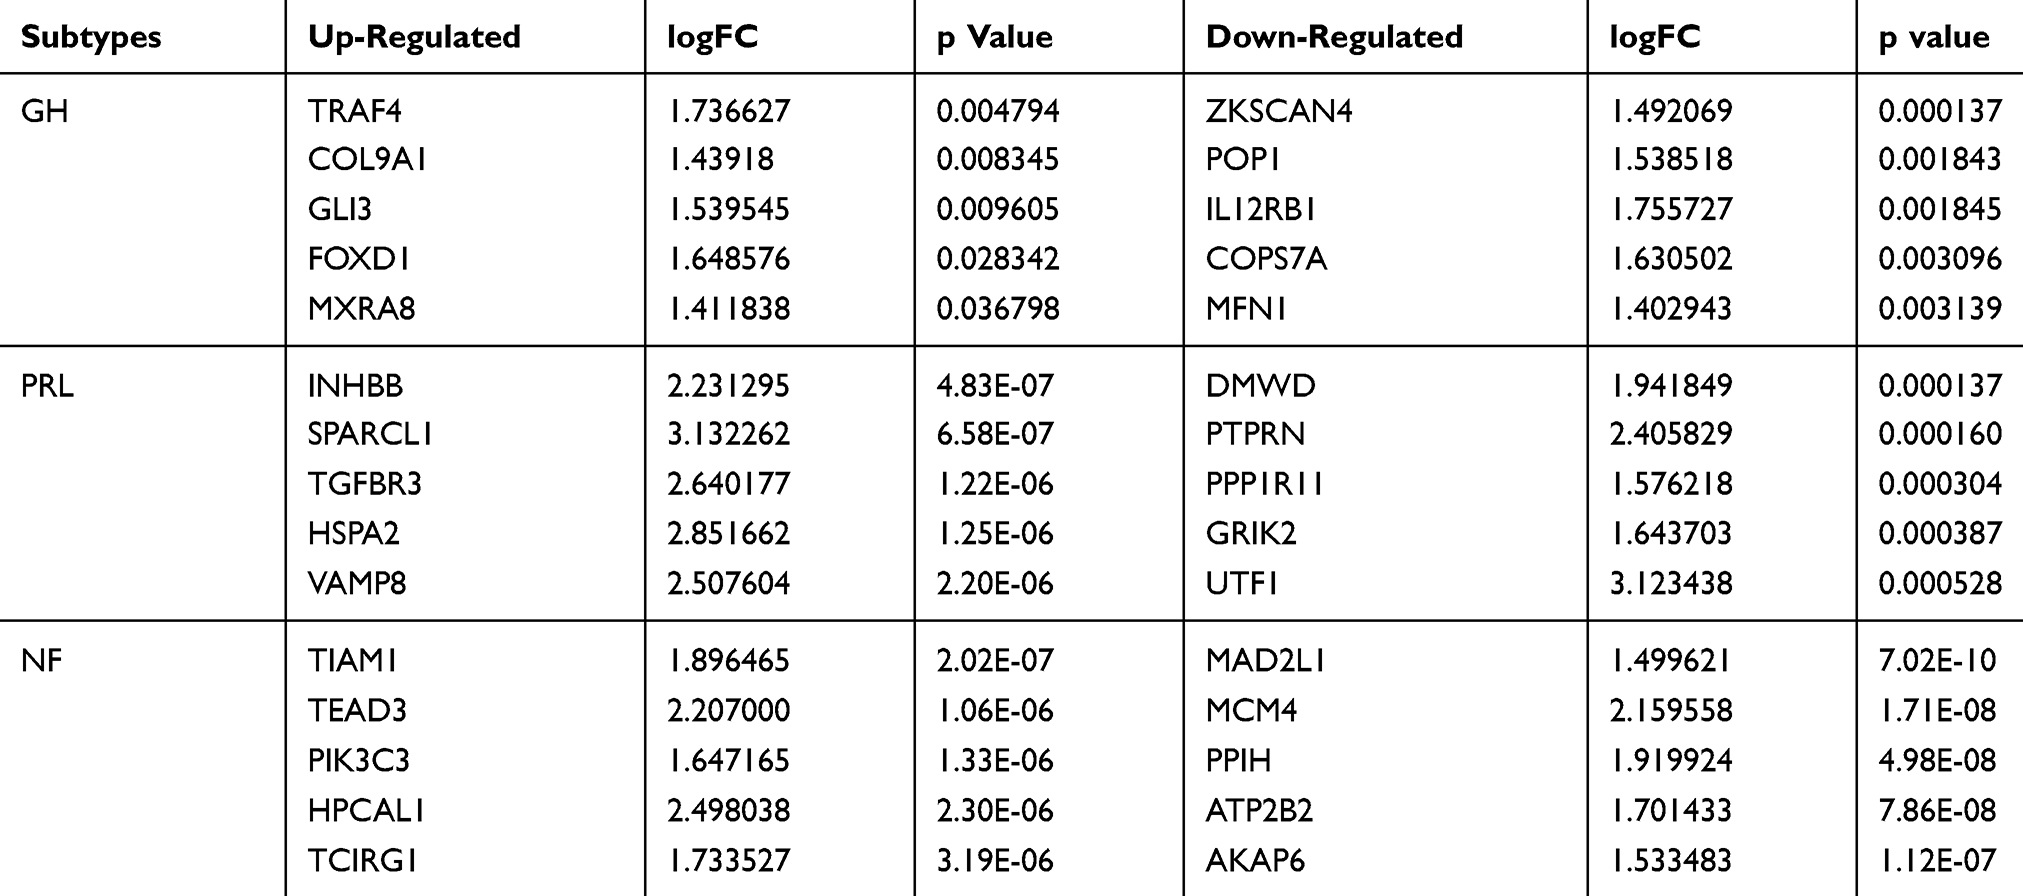 |
Table 2 Top Five Up-Regulated and Down-Regulated Specific DEGs |
 |
Figure 2 Overlap of DEGs and KEGG biomarker enrichment. (A) Traditional Venn diagram showing overlap between DEGs across four tumor types. (B–D) Top 20 pathways in PRL-specific, NF-specific, and common markers. * Full name: AGE-RAGE signaling pathway in diabetic complications. |
Based on KEGG pathway mapping, PRL-specific DEGs were enriched mostly in osteoclast differentiation, toxoplasmosis, inflammatory bowel disease, and apoptosis (Figure 2B). NF-specific DEGs were primarily enriched in glycosphingolipid biosynthesis-globo and isoglobo series, cAMP signaling pathway, proteasome, and serotonergic synapse (Figure 2C). Common DEGs were enriched mostly in the PI3K-Akt signaling pathway, extracellular matrix–receptor interaction, TGF-β signaling pathway, and cytokine–cytokine receptor interaction (Figure 2D).
Metabolism KEGG Pathway and Gene Ontology Analysis
To identify metabolic-related DEGs, subtype-specific DEGs and common DEGs enriching in metabolism GO terms and pathways were further analyzed. Based on GO analysis, PRL-specific DEGs were enriched in 28 metabolism-related GO terms (Figure 3A), except for cellular response to retinoic acid (GO: 0071300, Z-score = −0.30), and all the other terms are up-regulated. However, NF-specific DEGs were enriched in 7 metabolism-related GO terms, and all terms are down-regulated (Figure 3B). Detailed information about metabolism-related GO terms was provided in Supplementary Materials S6.
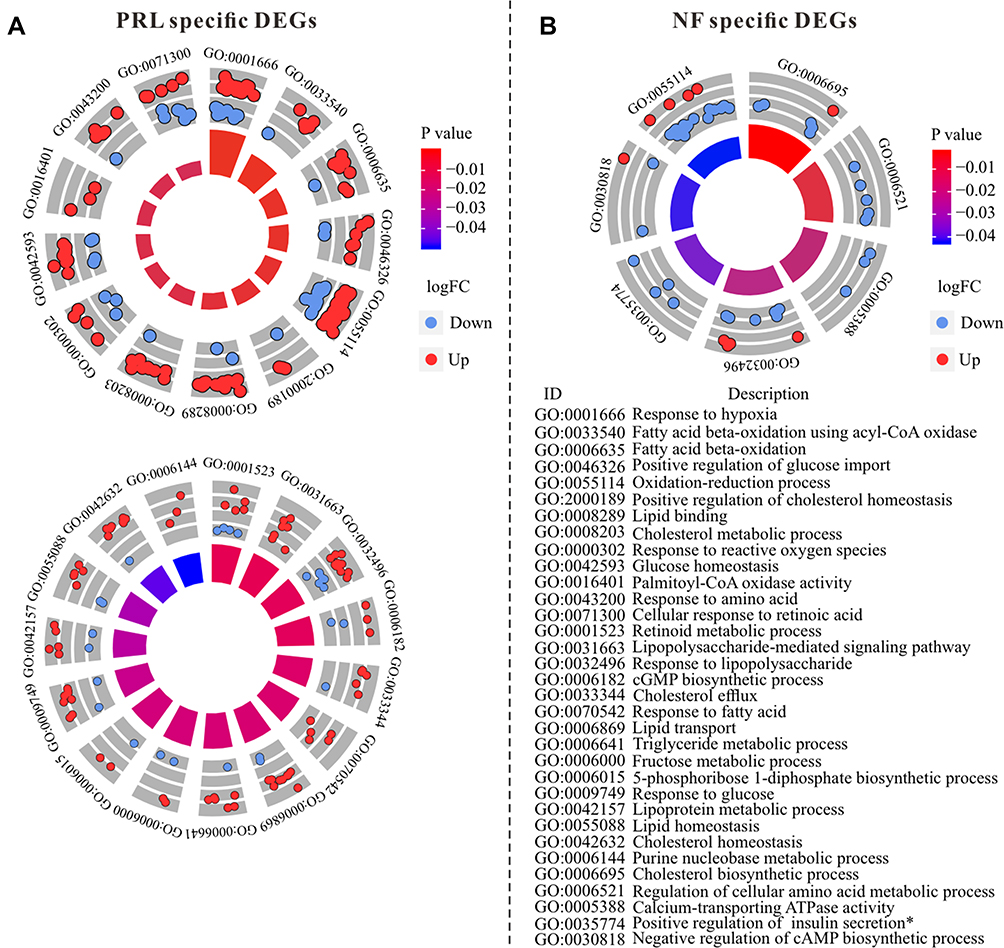 |
Figure 3 GOCircle of metabolism-related GO terms in PRL-specific DEGs (A) and NF-specific DEGs (B). GOCircle was performed by using GOplot package.19 |
There are six metabolism pathways enriched in PRL subtype, including pentose phosphate pathway (Z-score = 0.35), fructose and mannose metabolism (Z-score = 3.16), fatty acid degradation (Z-score = 1.17), tryptophan metabolism (Z-score = 2.64), beta-alanine metabolism (Z-score = 2.12), and carbon metabolism (Z-score = 0.81) (Figure 4A). Twelve metabolism pathways were enriched in NF subtype, including steroid biosynthesis (Z-score = −1.73), arginine biosynthesis (Z-score = −0.57), purine metabolism (Z-score = −1.66), tyrosine metabolism (Z-score = −1.00), cysteine and methionine metabolism (Z-score = −1.34), glycosaminoglycan biosynthesis-heparan sulfate/heparin (Z-score = −0.57), linoleic acid metabolism (Z-score = 0), arachidonic acid metabolism (Z-score = −0.18), glycosphingolipid biosynthesis-globo and isoglobo series (Z-score = −2.00), alpha-linolenic acid metabolism (Z-score = 0.57), pantothenate and CoA biosynthesis (Z-score = −0.57), and sulfur metabolism (Z-score = 0) (Figure 4B).
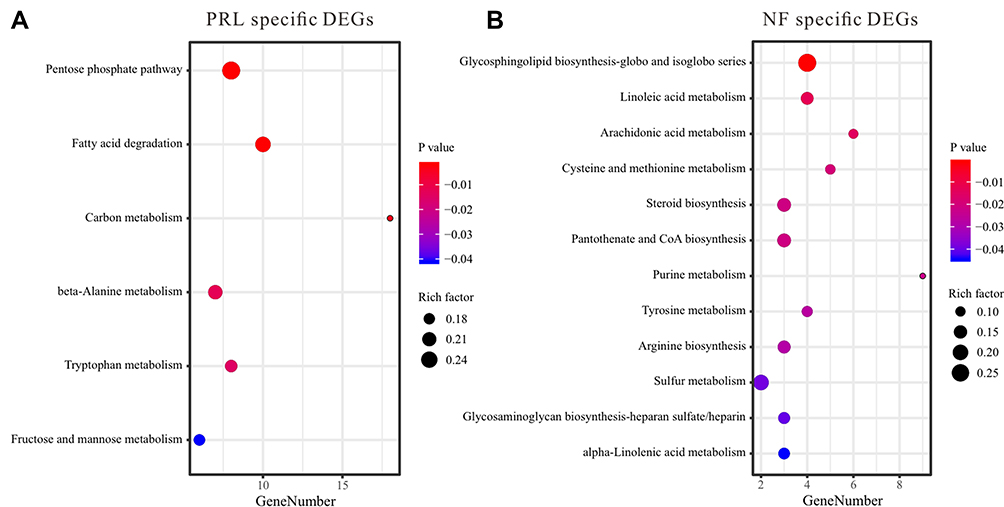 |
Figure 4 Bubble plot of metabolism-related pathways in PRL-specific (A) and NF-specific (B) DEGs. |
Common DEGs showed enrichment in only two KEGG metabolism pathways: metabolism of xenobiotics by cytochrome P450 and sulfur metabolism. GO terms showed enrichment in glucose homeostasis and retinoid metabolic process (Table 3).
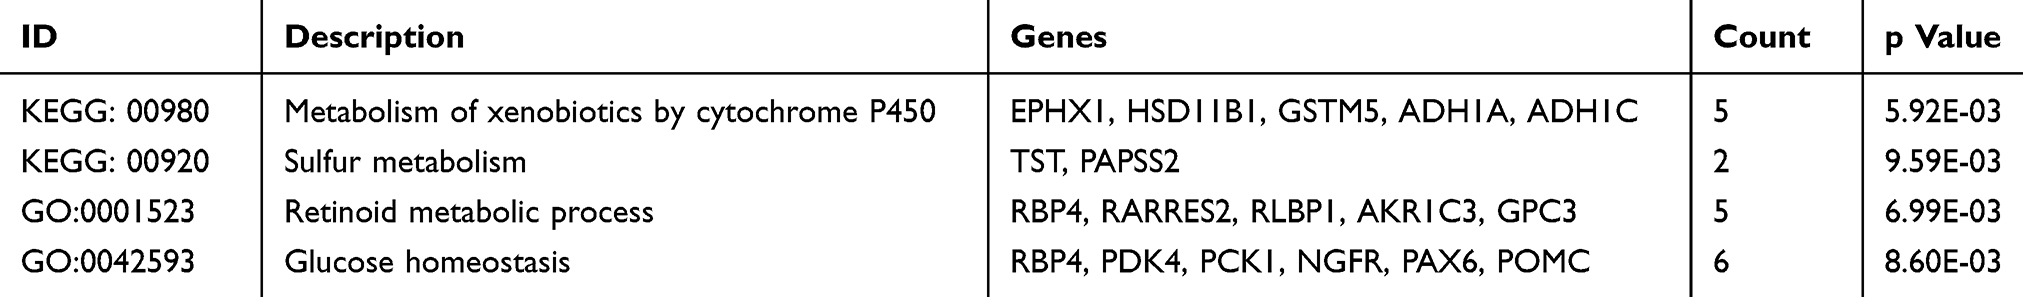 |
Table 3 Metabolism-Related KEGG Pathway and GO Terms in Common DEGs |
PPI Construction and Module Analysis
To explore the role of each gene in the metabolic pathway and the mutual regulatory mechanism, PPI networks for specific DEGs in the PRL-enriched, NF-enriched and common-enriched in metabolism pathways were constructed, respectively.
PPI module analysis showed that genes involved in metabolic processes and pathways were highly correlated (Supplementary Materials S7). Based on PPI network Module analysis. The PRL-specific PPI network containing 21 nodes and 93 edges could be divided into 3 modules (Figure 5A), modules 1, 2, 3 with scores of 12, 3, 3, respectively. In module 1 of the PRL-specific network, ACAA1 (acetyl-CoA acyltransferase 1), ACOX1 (acyl-CoA oxidase 1), ALDH2 (aldehyde dehydrogenase 2), CAT (catalase), ECHS1 (enoyl CoA hydratase, short chain, 1), and TALDO1 (transaldolase 1) were mainly responsible for fatty acid metabolism and oxidation–reduction process. Genes in module 2 were mainly responsible for the pentose phosphate pathway and nucleotide metabolism. Genes in module 3 were primarily responsible for glutamate decarboxylation and tryptophan metabolism.
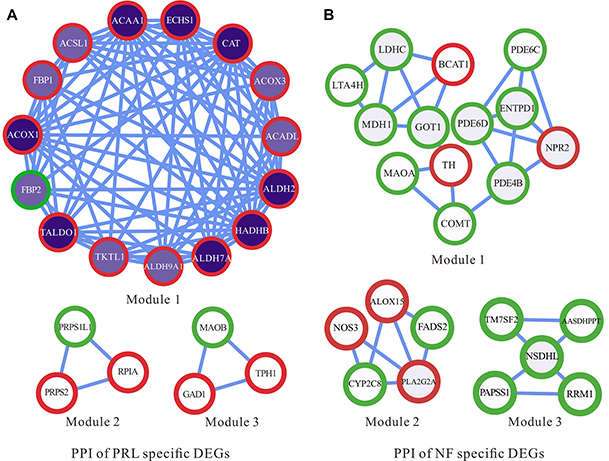 |
Figure 5 Protein–protein interaction network of PRL and NF metabolic-specific markers. The dark purple nodes represent a higher tumor degree, and white nodes represent a lower tumor degree. Red circles represent up-regulated genes, and green circles represent down-regulated genes. |
The NF-specific PPI network containing 23 nodes and 33 edges was grouped into 3 modules (Figure 5B), modules 1, 2, 3 with scores of 3.667, 3.5, 3, respectively. In module 1 of the NF-specific network, LDHC (lactate dehydrogenase C), LTA4H (leukotriene A4 hydrolase), MDH1 (malate dehydrogenase 1), GOT1 (glutamic-oxaloacetic transaminase 1), and BCAT1 (branched chain amino-acid transaminase 1) were most enriched in gluconeogenesis and transamination pathway; MAOA (monoamine oxidase A), TH (tyrosine hydroxylase), and COMT (catechol-O-methyltransferase) were the most enriched in dopamine metabolism; NPR2 (natriuretic peptide receptor 2), ENTPD1 (ectonucleoside triphosphate diphosphohydrolase 1), PDE4B (phosphodiesterase 4B), PDE6C (phosphodiesterase 6C), and PDE6D (phosphodiesterase 6D) were the most enriched in purine metabolism. These interactions between genes that play roles in different metabolic processes reveal the complex metabolic disturbances of the NF PAs. It is noticeable that most genes in the PRL subtype were up-regulated (n=19), while only three genes were down-regulated, containing FBP2 (fructose-1,6-bisphosphatase 2), MAOB (monoamine oxidase B), and PRPS1L1 (phosphoribosyl pyrophosphate synthetase 1-like 1). In contrast, most genes in the NF subtype were down-regulated (n=17), and six genes, including BCAT1, TH, NPR2, NOS3 (nitric oxide synthase 3), ALOX15 (arachidonate 15-lipoxygenase), and PLA2G2A (phospholipase A2, group IIA), were up-regulated.
The PPI network on common DEGs contained 85 nodes and 179 edges. Among the identified metabolic target candidates for PA therapy, PDK4 (pyruvate dehydrogenase kinase 4) and PCK1 (phosphoenolpyruvate carboxykinase 1) were the top two metabolic genes with the highest connectivity to other genes (Figure 6). Moreover, PDK4 connected to STAT5b (signal transducer and activator of transcription 5B), one of the hub genes in the network.
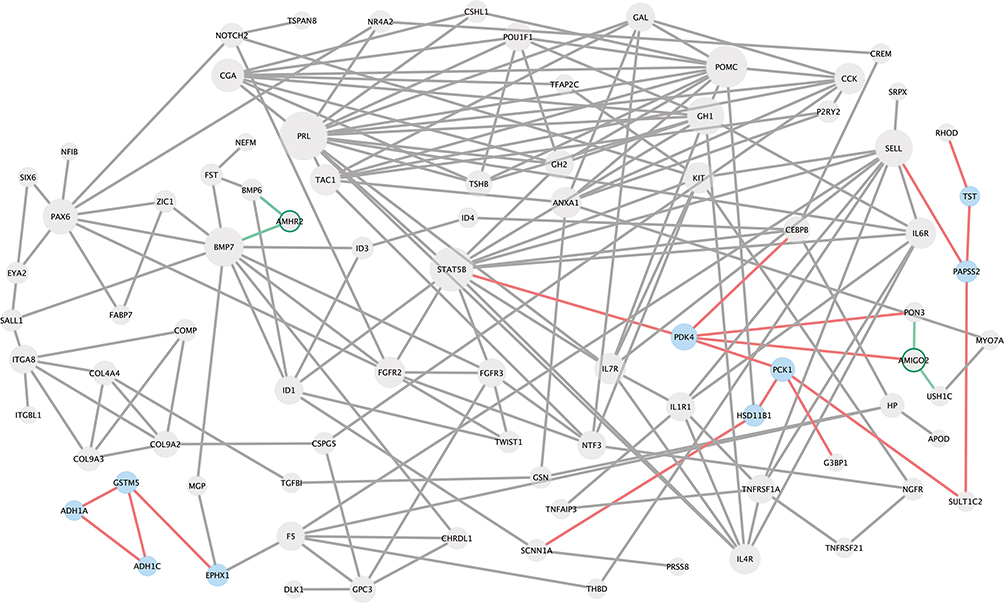 |
Figure 6 Protein–protein interaction network was constructed based on 217 common DEGs. The diameter of each protein was defined by its network degree, and blue color wi identified to be “metabolic-related genes” in this study. Green cycle means down-regulated. |
Discussion
This is the first study to systematically analyze metabolism-related DEGs specific to the main PA subtypes. We analyzed gene expression in 9 microarray datasets based on the NP and four major subtypes of human PAs. A total of 139 tumor samples and 21 normal samples were included. Except for the ACTH subtype, 22 GH-specific DEGs, 1081 PRL-specific DEGs, 437 NF-specific DEGs, and 217 common DEGs were identified. We utilized bioinformatics methods to explore the biological function of these DEGs, including GO and KEGG pathway enrichment, PPI network construction, and metabolic-related DEG annotation.
KEGG pathway enrichment of common DEGs revealed many previously identified therapy targets. Signaling pathways such as PI3K-Akt, TGF-β, JAK-STAT, MAPK, and Hippo are well known to be involved in the pathophysiology and treatment of pituitary adenomas.25–30 The PI3K-Akt and Hippo signal pathways were also revealed by ubiquitin proteomics analysis of human pituitary adenoma and normal pituitary tissues.31 In addition to these signal transduction pathways, the neuroactive ligand–receptor interaction pathway was shown to be related to PA tumorigenesis in studies using microarray data.32,33 The extracellular matrix (ECM) delivers signals through membrane receptors and is involved in PA cell proliferation and hormone production.34,35 These results indicate the reliability of the present data; however, studies of these related potential therapeutic targets are mostly in the laboratory stage.
Although recent efforts have renewed awareness of cancer as a metabolic disorder, and the causal relationship between an oncogene and metabolic reprograming is still controversial.36 However, there is a general consensus regarding the idea that the change of metabolic enzyme expression ultimately alters the metabolic flow. Recently, transcriptomics data, in conjunction with the current biochemical understanding, have been exploited to construct genome-scale metabolic workflows.11,37
In the functional enrichment of common DEGs, we found that the metabolism of xenobiotics by the cytochrome P450 pathway (Figure 2D) is correlated with two Phase III clinical trial drugs, levoketoconazole (NCT03277690) and osilodrostat (NCT02697734). Another enriched KEGG metabolism pathway was sulfur metabolism, which was also enriched by PAPSS2 (3ʹ-phosphoadenosine 5ʹ-phosphosulfate synthase 2) and TAT (thiosulfate sulfur transferase) in the common DEGs. Sulfation is a common modification of exogenous (drugs and xenobiotics) and endogenous (carbohydrates, lipids, and proteins) compounds.38 Although few studies have examined the two genes in PA, they are suitable as therapeutic targets in future studies. Metabolism-related GO terms of common DEGs mentioned retinoid metabolism and glucose homeostasis. Our previous study about LDHA indicated that glucose was the most critical energy source of PA.7 Retinoid acid and isotretinoin had been proved to be effective and safe alternative therapeutic options for patients with Cushing disease.39,40 Altogether, these results indicate the possibility of metabolism-related therapy for PA and also the reliability of the present data.
Additionally, in the PPI network of common DEGs, we identified PDK4 and PCK1 as two key molecules involved in PA glucose metabolism and other related signaling pathways in PA development. Inhibition of PDK4 reportedly increases colon cancer cellular apoptosis and reduces cellular migration and invasion.41 Proteins connected to PDK4 in the PPI network such as PON3, CEBPB, PCK1, and STAT5B have also been reported to be involved in cancer development.42–45 Moreover, STAT5B was the downstream molecule of PRL, GH1, and GH2, and its mutation had been proved to be involved in growth hormone insensitivity.46 Overexpression of STAT3, another gene of STAT family, had been proved to induce growth hormone hypersecretion in pituitary somatotroph adenomas.27 However, the roles of STAT5B, PDK4, and PCK1 in PA are still unknown. Aside from these observations, the current status is that till date, no drugs have been approved for treating non-functional PA; however, the present study provides some potential metabolic therapeutic targets.
In conclusion, based on a comprehensive analysis of the available PA-related transcriptomics data, we identified specific DEGs in different hormone-secreting PA subtypes and found that several biological functions related to metabolism had changed. PRL and NF tumor-specific DEGs were mainly involved in fatty acid and nucleotide metabolism, redox reaction, and gluconeogenesis. Metabolism of xenobiotics by the cytochrome P450 pathway, sulfur metabolism, retinoid metabolism, and glucose homeostasis were abnormal in all subtypes of PA. PDK4 and PCK1 might be considered as targets for the development of anticancer strategies and therapies. However, the raw transcriptomics data came from different sources, the clinical or ethnicity variables might affect the results of the particular research, and more solid scientific work was needed to verify these findings.
Acknowledgments
This work was funded by Scientific and Technological Research Program of Chongqing Municipal Education Commission (No. KJQN201800523) and Scientific Research Staring Foundation of Chongqing Normal University (No. 17XLB017).
Disclosure
The authors declare that there are no conflicts of interest in this work.
References
1. Ostrom QT, Gittleman H, Liao P, et al. CBTRUS Statistical Report: primary brain and other central nervous system tumors diagnosed in the United States in 2010-2014. Neuro Oncol. 2017;19:v1–v88. doi:10.1093/neuonc/nox158
2. Ezzat S, Asa SL, Couldwell WT, et al. The prevalence of pituitary adenomas: a systematic review. Cancer. 2004;101:613–619. doi:10.1002/cncr.20412
3. Molitch ME. Diagnosis and treatment of pituitary adenomas: a review. JAMA. 2017;317:516–524. doi:10.1001/jama.2016.19699
4. Vander Heiden MG, DeBerardinis RJ. Understanding the intersections between metabolism and cancer biology. Cell. 2017;168:657–669. doi:10.1016/j.cell.2016.12.039
5. Pinzariu O, Georgescu B, Georgescu CE. Metabolomics-A promising approach to pituitary adenomas. Front Endocrinol (Lausanne). 2018;9:814. doi:10.3389/fendo.2018.00814
6. Li B, Tang J, Yang Q, et al. NOREVA: normalization and evaluation of MS-based metabolomics data. Nucleic Acids Res. 2017;(W1):W162–W170. doi:10.1093/nar/gkx449
7. An J, Zhang Y, He J, et al. Lactate dehydrogenase A promotes the invasion and proliferation of pituitary adenoma. Sci Rep. 2017;7:4734. doi:10.1038/s41598-017-04366-5
8. Tanya B, Troup DB, Wilhite SE, et al. NCBI GEO: archive for functional genomics data sets–10 years on. Nucleic Acids Res. 2013;39:1005–1010. doi:10.1093/nar/gks1193
9. Helen P, Ugis S, Nikolay K, et al. ArrayExpress update–an archive of microarray and high-throughput sequencing-based functional genomics experiments. Nucleic Acids Res. 2011;39:1002–1004. doi:10.1093/nar/gkq1040
10. Donati S, Sander T, Link H. Crosstalk between transcription and metabolism: how much enzyme is enough for a cell? Wiley Interdiscip Rev Syst Biol Med. 2018;10:e1396. doi:10.1002/wsbm.1396
11. Rosario SR, Long MD, Affronti HC, Rowsam AM, Eng KH, Smiraglia DJ. Pan-cancer analysis of transcriptional metabolic dysregulation using The Cancer Genome Atlas. Nat Commun. 2018;9:5330. doi:10.1038/s41467-018-07232-8
12. Gautier L, Cope L, Bolstad BM, Irizarry RA. affy–analysis of Affymetrix GeneChip data at the probe level. Bioinformatics. 2004;20:307–315. doi:10.1093/bioinformatics/btg405
13. Smyth GK. limma: linear models for microarray data. Bioinf Comput Biol Solutions R Bioconductor. 2011;397–420. doi:10.1007/0-387-29362-0_23
14. Dunning MJ, Smith ML, Ritchie ME, Tavare S. beadarray: R classes and methods for Illumina bead-based data. Bioinformatics. 2007;23:2183–2184. doi:10.1093/bioinformatics/btm311
15. Leek JT, Johnson WE, Parker HS, Jaffe AE, Storey JD. The sva package for removing batch effects and other unwanted variation in high-throughput experiments. Bioinformatics. 2012;28:882–883. doi:10.1093/bioinformatics/bts034
16. Chen H, Boutros PC. VennDiagram: a package for the generation of highly-customizable Venn and Euler diagrams in R. BMC Bioinformatics. 2011;12:35. doi:10.1186/1471-2105-12-35
17. Dennis G, Sherman BT, Hosack DA, et al. DAVID: database for annotation, visualization, and integrated discovery. Genome Biol. 2003;4(9):R60. doi:10.1186/gb-2003-4-9-r60
18. Yu G, Wang L-G, Han Y, He Q-Y. clusterProfiler: an R package for comparing biological themes among gene clusters. Omics-A J Integr Biol. 2012;16:284–287. doi:10.1089/omi.2011.0118
19. Walter W, Sanchez-Cabo F, Ricote M. GOplot: an R package for visually combining expression data with functional analysis. Bioinformatics. 2015;31:2912–2914. doi:10.1093/bioinformatics/btv300
20. Nie X, Wei J, Hao Y, et al. Consistent biomarkers and related pathogenesis underlying asthma revealed by systems biology approach. Int J Mol Sci. 2019;20:4037. doi:10.3390/ijms20164037
21. Csermely P. Protein-protein interaction networks. Cell. 2012;144:
22. Kohl M, Wiese S, Warscheid BJMMB. Cytoscape: software for visualization and analysis of biological networks. Methods Mol Biol. 2011;696:291–303. doi:10.1007/978-1-60761-987-1_18
23. Bader GD, Hogue CW. An automated method for finding molecular complexes in large protein interaction networks. BMC Bioinformatics. 2003;4:2. doi:10.1186/1471-2105-4-2
24. Peng X, Alfoldi J, Gori K, et al. The draft genome sequence of the ferret (Mustela putorius furo) facilitates study of human respiratory disease. Nat Biotechnol. 2014;32:1250–1255. doi:10.1038/nbt.3079
25. Monsalves E, Juraschka K, Tateno T, et al. The PI3K/AKT/mTOR pathway in the pathophysiology and treatment of pituitary adenomas. Endocr Relat Cancer. 2014;21:R331–R344. doi:10.1530/ERC-14-0188
26. Lebrun JJ. Activin, TGF-beta and menin in pituitary tumorigenesis. Adv Exp Med Biol. 2009;668:69–78. doi:10.1007/978-1-4419-1664-8_7
27. Zhou C, Jiao Y, Wang R, Ren SG, Wawrowsky K, Melmed S. STAT3 upregulation in pituitary somatotroph adenomas induces growth hormone hypersecretion. J Clin Invest. 2015;125:1692–1702. doi:10.1172/JCI78173
28. Cakir M, Grossman AB. Targeting MAPK (Ras/ERK) and PI3K/Akt pathways in pituitary tumorigenesis. Expert Opin Ther Targets. 2009;13:1121–1134. doi:10.1517/14728220903170675
29. Lu M, Wang Y, Zhan X. The MAPK pathway-based drug therapeutic targets in pituitary adenomas. Front Endocrinol (Lausanne). 2019;10:330. doi:10.3389/fendo.2019.00330
30. Xekouki P, Lodge EJ, Matschke J, et al. Non-secreting pituitary tumours characterised by enhanced expression of YAP/TAZ. Endocr Relat Cancer. 2019;26:215–225. doi:10.1530/ERC-18-0330
31. Qian S, Zhan X, Lu M, et al. Quantitative analysis of ubiquitinated proteins in human pituitary and pituitary adenoma tissues. Front Endocrinol (Lausanne). 2019;10:328. doi:10.3389/fendo.2019.00328
32. Wu S, Gu Y, Huang Y, et al. Novel biomarkers for non-functioning invasive pituitary adenomas were identified by using analysis of microRNAs expression profile. Biochem Genet. 2017;55:253–267. doi:10.1007/s10528-017-9794-9
33. Zhao P, Hu W, Wang H, et al. Identification of differentially expressed genes in pituitary adenomas by integrating analysis of microarray data. Int J Endocrinol. 2015;2015:164087. doi:10.1155/2015/164087
34. Kuchenbauer F, Hopfner U, Stalla J, Arzt E, Stalla GK, Paez-Pereda M. Extracellular matrix components regulate ACTH production and proliferation in corticotroph tumor cells. Mol Cell Endocrinol. 2001;175:141–148.
35. Paez-Pereda M, Kuchenbauer F, Arzt E, Stalla GK. Regulation of pituitary hormones and cell proliferation by components of the extracellular matrix. Braz J Med Biol Res. 2005;38:1487–1494. doi:10.1590/s0100-879x2005001000005
36. Seyfried TN, Flores RE, Poff AM, D’Agostino DP. Cancer as a metabolic disease: implications for novel therapeutics. Carcinogenesis. 2013;35:515–527.
37. Bordbar A, Monk JM, King ZA, Palsson BO. Constraint-based models predict metabolic and associated cellular functions. Nat Rev Genet. 2014;15:107–120. doi:10.1038/nrg3643
38. Günal S, Hardman R, Kopriva S, Mueller JW. Sulfation pathways from red to green. J Biol Chem. 2019;294(33):12293–12312. doi:10.1074/jbc.REV119.007422
39. Pecori Giraldi F, Ambrogio AG, Andrioli M, et al. Potential role for retinoic acid in patients with Cushing’s disease. J Clin Endocrinol Metab. 2012;97:3577–3583. doi:10.1210/jc.2012-2328
40. Vilar L, Albuquerque JL, Lyra R, et al. The role of isotretinoin therapy for Cushing’s disease: results of a prospective study. Int J Endocrinol. 2016;2016:8173182. doi:10.1155/2016/8173182
41. Leclerc D, Pham DNT, Lévesque N, et al. Oncogenic role of PDK4 in human colon cancer cells. Br J Cancer. 2017;116:930–936. doi:10.1038/bjc.2017.38
42. Zhu L, Shen Y, Sun WJB. Biomedecine, p.; pharmacotherapie. Paraoxonase 3 promotes cell proliferation and metastasis by PI3K/Akt in oral squamous cell carcinoma. Biomed Pharmacother. 2017;85:712–717. doi:10.1016/j.biopha.2016.11.084
43. Gao Y, Liu B, Feng L, et al. Targeting JUN, CEBPB, and HDAC3: a novel strategy to overcome drug resistance in hypoxic glioblastoma. Front Oncol. 2019;9:33. doi:10.3389/fonc.2019.00033
44. Li Y, Luo S, Ma R, et al. Upregulation of cytosolic phosphoenolpyruvate carboxykinase is a critical metabolic event in melanoma cells that repopulate tumors. Cancer Res. 2015;75:1191–1196. doi:10.1158/0008-5472.CAN-14-2615
45. Moser C, Ruemmele P, Gehmert S, et al. STAT5b as molecular target in pancreatic cancer–inhibition of tumor growth, angiogenesis, and metastases. Neoplasia. 2012;14:915–925. doi:10.1593/neo.12878
46. Klammt J, Neumann D, Gevers EF, et al. Dominant-negative STAT5B mutations cause growth hormone insensitivity with short stature and mild immune dysregulation. Nat Commun. 2018;9:2105. doi:10.1038/s41467-018-04521-0
47. de Araujo LJ, Lerario AM, de Castro M, et al. Transcriptome analysis showed a differential signature between invasive and non-invasive corticotrophinomas. Front Endocrinol (Lausanne). 2017;8:55. doi:10.3389/fendo.2017.00055
48. Cassarino MF, Ambrogio AG, Cassarino A, et al. Gene expression profiling in human corticotroph tumours reveals distinct, neuroendocrine profiles. J Neuroendocrinol. 2018;30:e12628. doi:10.1111/jne.12628
49. Lekva T, Berg JP, Fougner SL, Olstad OK, Ueland T, Bollerslev J. Gene expression profiling identifies ESRP1 as a potential regulator of epithelial mesenchymal transition in somatotroph adenomas from a large cohort of patients with acromegaly. J Clin Endocrinol Metab. 2012;97:E1506–E1514. doi:10.1210/jc.2012-1760
50. Yu SY, Hong LC, Feng J, Wu YT, Zhang YZ. Integrative proteomics and transcriptomics identify novel invasive-related biomarkers of non-functioning pituitary adenomas. Tumour Biol. 2016;37:8923–8930. doi:10.1007/s13277-015-4767-2
51. Tong Y, Zheng Y, Zhou J, Oyesiku NM, Koeffler HP, Melmed S. Genomic characterization of human and rat prolactinomas. Endocrinology. 2012;153:3679–3691. doi:10.1210/en.2012-1056
52. Michaelis KA, Knox AJ, Xu M, et al. Identification of growth arrest and DNA-damage-inducible gene beta (GADD45beta) as a novel tumor suppressor in pituitary gonadotrope tumors. Endocrinology. 2011;152:3603–3613. doi:10.1210/en.2011-0109
53. Wu ZR, Yan L, Liu YT, et al. Inhibition of mTORC1 by lncRNA H19 via disrupting 4E-BP1/Raptor interaction in pituitary tumours. Nat Commun. 2018;9:4624. doi:10.1038/s41467-018-06853-3
54. Mertens F, Gremeaux L, Chen J, et al. Pituitary tumors contain a side population with tumor stem cell-associated characteristics. Endocr Relat Cancer. 2015;22:481–504. doi:10.1530/ERC-14-0546
55. Hernandez-Ramirez LC, Morgan RML, Barry S, D’Acquisto F, Prodromou C, Korbonits M. Multi-chaperone function modulation and association with cytoskeletal proteins are key features of the function of AIP in the pituitary gland. Oncotarget. 2018;9:9177–9198. doi:10.18632/oncotarget.24183
 © 2019 The Author(s). This work is published and licensed by Dove Medical Press Limited. The full terms of this license are available at https://www.dovepress.com/terms.php and incorporate the Creative Commons Attribution - Non Commercial (unported, v3.0) License.
By accessing the work you hereby accept the Terms. Non-commercial uses of the work are permitted without any further permission from Dove Medical Press Limited, provided the work is properly attributed. For permission for commercial use of this work, please see paragraphs 4.2 and 5 of our Terms.
© 2019 The Author(s). This work is published and licensed by Dove Medical Press Limited. The full terms of this license are available at https://www.dovepress.com/terms.php and incorporate the Creative Commons Attribution - Non Commercial (unported, v3.0) License.
By accessing the work you hereby accept the Terms. Non-commercial uses of the work are permitted without any further permission from Dove Medical Press Limited, provided the work is properly attributed. For permission for commercial use of this work, please see paragraphs 4.2 and 5 of our Terms.