")
Back to Journals » Clinical, Cosmetic and Investigational Dermatology » Volume 14
Identification of the Role of Wnt/β-Catenin Pathway Through Integrated Analyses and in vivo Experiments in Vitiligo
Authors Zhao SJ, Jia H, Xu XL, Bu WB, Zhang Q, Chen X, Ji J, Sun JF
Received 7 May 2021
Accepted for publication 14 July 2021
Published 1 September 2021 Volume 2021:14 Pages 1089—1103
DOI https://doi.org/10.2147/CCID.S319061
Checked for plagiarism Yes
Review by Single anonymous peer review
Peer reviewer comments 3
Editor who approved publication: Dr Jeffrey Weinberg
Si-Jia Zhao,1 Hong Jia,2 Xiu-Lian Xu,1 Wen-Bo Bu,3 Qian Zhang,3 Xi Chen,4 Juan Ji,2 Jian-Fang Sun1
1Department of Pathology, Institute of Dermatology, Chinese Academy of Medical Sciences and Peking Union Medical College, Nanjing, Jiangsu, People’s Republic of China; 2Department of Dermatology, Institute of Dermatology, Chinese Academy of Medical Sciences and Peking Union Medical College, Nanjing, Jiangsu, People’s Republic of China; 3Department of Dermatologic Surgery, Institute of Dermatology, Chinese Academy of Medical Sciences and Peking Union Medical College, Nanjing, Jiangsu, People’s Republic of China; 4Department of Medicine 3, Universitätsklinikum Erlangen, Friedrich Alexander University Erlangen Nuremberg, Erlangen, Bavaria, Germany
Correspondence: Jian-Fang Sun
Institute of Dermatology, Chinese Academy of Medical Sciences and Peking Union Medical College, Nanjing, 210042, People’s Republic of China
Tel +86 25 8547 8015
Fax +86 25 8541 4477
Email [email protected]
Purpose: Vitiligo is an acquired depigmentation skin disease, which affects an average of 1% of the world’s population. The purpose of this study is to identify the key genes and pathways responsible for vitiligo and find new therapeutic targets.
Methods: The datasets GSE65127, GSE53146, and GSE75819 were downloaded from the Gene Expression Omnibus (GEO) database. R language was used to identify the differentially expressed genes (DEGs) between lesional skin of vitiligo and non-lesional skin. Next, the key pathways were obtained by Gene Ontology (GO) and Kyoto Encyclopedia of Genes and Genomes (KEGG) enrichment analyses. The protein–protein interaction (PPI) networks were conducted by STRING database and Cytoscape software. Subsequently, module analysis was performed by Cytoscape. Among these results, the Wnt/β-catenin pathway and melanogenesis pathway caught our attention. The expression level of β-catenin, microphthalmia-associated transcription factor (MITF) and tyrosinase (TYR) was detected by immunofluorescence in vitiligo lesions and healthy skin. Moreover, zebrafish was treated with XAV-939, an inhibitor of the Wnt/β-catenin pathway. After that, the area of melanin granules as a percentage of the head area was measured. The mRNA expression of β-catenin, lymphoid-enhancing factor 1(lef1), tyr and mitf were detected by q-PCR (quantitative polymerase chain reaction) in zebrafish (Danio rerio).
Results: A total of 2442 DEGs were identified, including 1068 upregulated and 1374 downregulated DEGs. The key pathways were identified by GO and KEGG analyses, such as “NOD-like receptor signaling pathway”, “Wnt signaling pathway”, “Melanogenesis”, “mTOR signaling pathway”, “PI3K-Akt signaling pathway”, “Calcium signaling pathway” and “Rap1 signaling pathway”. The immunofluorescence results showed that the level of β-catenin, MITF and TYR was significantly downregulated in vitiligo lesional skin. In zebrafish, the mean percentage area of melanin granules and the expression of β-catenin, lef1, tyr and mitf were decreased after treated with XAV-939.
Conclusion: The present study identified key genes and signaling pathways associated with the pathophysiology of vitiligo. Among them, the Wnt/β-catenin pathway played an essential role in pigmentation and could be a breakthrough point in vitiligo treatment.
Keywords: vitiligo, zebrafish, melanogenesis, Wnt/β-catenin, calcium signaling, Rap1
Introduction
Vitiligo is a chronic skin disease characterized by progressive depigmentation of skin and mucosa. Currently, the prevalence of vitiligo ranges from 0.1% to 8% worldwide.1 Although vitiligo is not life-threatening, these disfiguring lesions often appear on exposed areas of the bodies, such as faces and arms, cause huge psychological and financial burden to the patients.2 Studies showed that 33% of patients with vitiligo had depressive symptoms and 8% of them could be diagnosed as clinical depression.3 According to the study, hospitalization for mental health disorders, such as anxiety, depression, schizophrenia, suicidal risk, substance use disorder and childhood and adolescent psychiatric illnesses, was more common in those with vitiligo compared to those without vitiligo (4.17% vs 2.18%), which resulted in excess costs from hospitalization with mental health disorders as 10.5 million dollars, annually.4 Traditional treatments for vitiligo include glucocorticoids, calcineurin inhibitor, phototherapy and so on. However, few curative or satisfactory treatments are available for some patients, such as ones with extensive lesion involvement and long course of disease. Therefore, exploring more key genes and pathways responsible for vitiligo and finding new therapeutic targets are hot topics in this field.
Previous studies suggested that the pathogenesis of vitiligo could be associated with genetics, oxidative stress, autoimmunity, melanocyte apoptosis and neurological theories.5–9 In vitiligo, melanocytes have difficulty coping with oxidative stress, resulting in the secretion of exosomes containing melanocyte-specific antigens, such as miRNAs, heat shock proteins and damage-related molecular patterns. These antigens induce nearby dendritic cells to mature antigen-presenting cells.10,11 Activated DCs display melanocyte auto-antigens of melanocytes to CD4+ T lymphocytes. Following different cytokine production, CD4+ T cells differentiate into Th1 or Th17 lymphocytes, which secrete cytokines such as IFN-gamma, TNF-α and IL-17, affecting the melanocyte damage in different ways.12–14 Following the activation of CD4+ T cell and TNF-α production, B lymphocytes produce antibodies against tyrosinase, tyrosine hydroxylase, Sox10 and other auto-antigens.15–17 DCs or skin-resident LCs represent auto-antigens to CD8+ T cells and result in CTL activation. Through three mechanisms: Perforin/Granzyme B, TNF-α production or Fas/FasL interaction activated CTL finally destroys melanocytes.18,19 However, the specific signaling pathways and molecules involved in these pathogenic processes remain unclear.
With the development of high-throughput sequencing and bioinformatics analysis methods, gene chips have become large scale and efficient means of obtaining genes differently expressed between diseases and healthy controls.20 So far, the Gene Expression Omnibus (GEO) database has been the world’s largest and most comprehensive public gene expression data resource, containing gene expression data on a variety of diseases, such as cancers, metabolic diseases and immune diseases. Moreover, the database includes data on differentially expressed DNAs, mRNAs, genomic methylation patterns, single nucleotide polymorphisms and molecular chemistry in various diseases.21
Several vitiligo transcriptome analyses studies from the GEO database revealed some key genes and pathways involved in the pathogenesis of vitiligo. The analysis of vitiligo dataset ‘GSE75819’ showed that cellular processes such as oxidative stress, stress response, immune response, SCF-KIT signaling, apoptosis and vitamin D receptor could be associated with the pathogenesis.22 The pathway analysis of vitiligo dataset ‘GSE65127’ revealed deregulated pathways in vitiligo lesions, such as pigmentation signaling, melanocyte development and circadian signaling pathways.23 The vitiligo dataset 'GSE53147’ identified CXCL10 as an important mediator of vitiligo pathogenesis.24
These sequencing datasets have provided much insight into the pathogenesis of vitiligo. However, because vitiligo specimens are difficult to obtain resulting in the small sample size for sequencing, these analysis results may neglect some important signaling pathways. The integrated analyses of multiple microarray datasets from the GEO database in this study allow for a larger sample size and access to obtain better understanding of the pathogenesis of vitiligo. The study design was created in the form of the flow diagram (Figure 1).
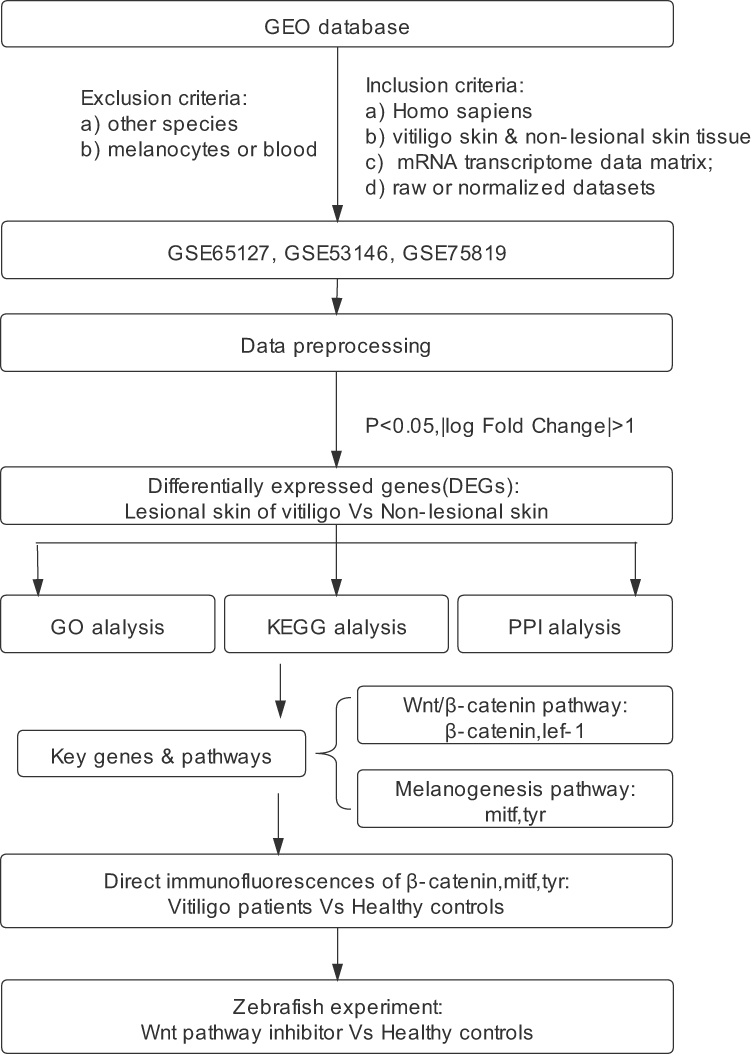 |
Figure 1 Flow diagram of the study. Abbreviations: GO, Gene Ontology; KEGG, Kyoto Encyclopedia of Genes and Genomes; PPI, protein–protein interaction. |
Materials and Methods
Microarray Data Collection
We searched the GEO database (https://www.ncbi.nlm.nih.gov/geo/) by “(vitiligo) AND Homo sapiens [Organism]”. A total of 14 datasets were obtained. Other inclusion criteria for this study included: a) The dataset must be mRNA transcriptome data matrix; b) The data were obtained from the skin tissue samples of vitiligo skin and non-lesioned skin. c) Both raw and normalized datasets were acceptable. The exclusion criteria were: a) The data were obtained from melanocytes or blood of patients; b) The data were from other species, such as mouse. Ultimately, three microarray datasets of vitiligo (GSE75819, GSE53146, GSE65127) were selected. The control groups were normal skin samples from healthy volunteers (in the GSE53146 and GSE65127 datasets) or non-lesional skin from vitiligo patients (in the GSE75819 dataset). Both the series matrix and platform TXT files were downloaded from the GEO database. Log2 transformation was performed on each expression matrix using R language commands. After that, the gene probe IDs were transformed into gene symbols by R language commands.
Data Preprocessing and DEGs Screening
In order to reduce the heterogeneity between each dataset, the raw data were normalized by the “limma” package of R language (http://www.bioconductor.org). Quantile normalization was applied by the “normalizeBetweenArrays” function of the “limma” package. Batch effects of raw data were eliminated using the ComBat function by the “sva” package.25,26 The number of gene symbols was visualized using the “Venn Diagram” package of R language. The genes included in all three datasets were used for subsequent analyses. Next, DEGs were then identified by the multiple linear regression using “limma” package.25 The cut-off values for DEGs identified were adjusted P-value < 0.05 and |log fold change (FC)|>1. After that, we used the “ggplot2” package to display DEGs by log fold change and adjusted P-value in a volcano plot. The package of “ggplots” was used for hierarchical clustering analysis of the top 100 DEGs sorted by log fold change.
GO Functional Term and KEGG Pathway Enrichment Analyses
Metascape (http://metascape.org/) is a web-based portal commonly used for functional enrichment.27 To explore the biological functions and signaling pathways associated with DEGs, GO and KEGG enrichment analyses were performed by Metascape. The upregulated and downregulated DEGs were analysed separately. The results were considered statistically significant if the P-value < 0.05.
PPI Networks and Hub Modules Analyses
In order to identify the interaction between DEGs-encoded proteins, we used the STRING database (http://www.string‐db.org/), a systems biology tool to develop a protein–protein interaction (PPI) network.28 The lists of all upregulated DEGs and all downregulated DEGs were input to the STRING database, respectively. The corresponding results were analyzed and visualized by Cytoscape software 3.7.2 (https://cytoscape.org). Meanwhile, the MCODE app in Cytoscape software was used to select the hub modules in PPI networks.29 The parameters were set as False Degree Cutoff=2, Node Score Cutoff=0.2, Haircut=true, Fluff=false, K-Core=2, Max. Depth from Seed=100. The GO term and KEGG pathway enrichment analyses of the hub modules were performed by Metascape.
Patients Information
Skin samples were acquired from vitiligo patients (n=6) and healthy volunteers (n=6) in Institute of Dermatology of Chinese Academy of Medical Sciences and Peking Union Medical College (Nanjing, China) from August 2020 to January 2021. The patients were diagnosed according to clinical and histologic manifestation. For each patient, a 4-mm-skin biopsy of lesional skin was taken. The biopsies of normal skin were taken from the healthy volunteers matched for gender and age. The clinical information of the vitiligo patients and the healthy controls are shown in Table S1 and Table S2. In accordance with the Code of Ethics of the World Medical Association (Declaration of Helsinki), written informed consent was signed by each subject. The research protocol was approved by the Ethics Committee of the Chinese Academy of Medical Sciences & Peking Union Medical College.
Immunofluorescence Staining Assay
Direct immunofluorescence staining for β-catenin, MITF and TYR protein was implemented. The primary antibodies used in this study were: anti-β-catenin (1:250, Abcam, Cambridge, MA, USA), anti-MITF (1:200, Abcam, Cambridge, MA, USA), and anti-TYR antibody (1:100, Abcam, Cambridge, MA, USA). The skin biopsy samples were fixed in 4% paraformaldehyde for 24h at 4°C. After that, they were embedded in paraffin and sectioned at 2–4μm. Then the sections were blocked using 3% bovine serum albumin (Beyotime Biotechnology, Shanghai, China) for 30 min and incubated with the primary antibody overnight at 4°C. After that, the secondary antibodies (Beyotime Biotechnology, Shanghai, China) at a dilution of 1:500 were incubated for 50min at room temperature. AIX81 fluorescence microscope (Olympus, Tokyo, Japan) was used for image collection. The signal intensity of β-catenin was quantified using Image J software (National Institutes of Health, Bethesda, MA, USA).
Zebrafish Culture and Treatments
In this study, wild-type, AB strain zebrafish was purchased from the China Zebrafish Resource Center (CZRC). The experimental protocol was approved by the Animal Ethics Committee of the Chinese Academy of Medical Sciences & Peking Union Medical College. The zebrafish embryos were cultured at 28°C with 14h light/10h darkness photoperiod. At 24 hour post fertilization (hpf), they were randomly divided into two groups as 60 fish per group and continuously treated with medium with DMSO (Sigma-Aldrich, St. Louis, MO, USA) or 10μM XAV-939 (Selleck Chemicals, Houston, TX, USA). At 48hpf and 72hpf, the distribution of melanin granules was observed and photographed by an inverted microscope (Nikon, Tokyo, Japan). The area of melanin granules was measured by Image J software. Pigmentation area (%) was defined as the area of melanin granules as a percentage of area of the head of zebrafish.
RNA Extraction and q-PCR
Total RNA from thirty 72 hpf larvae per group was extracted using Trizol (Invitrogen, Carlsbad, CA, USA) according to the manufacturer’s protocol. The purity and concentration of RNA were detected using a NanoDrop 2000 spectrophotometer (Thermo Fisher Scientific, Waltham, MA, USA). After that, the RNA was reverse transcribed into cDNA using PrimeScript™ RT Master Mix (Takara Bio, Otsu, Japan), according to the manufacturer’s protocol. To detect the mRNA expression levels of β-catenin, lef1, mitf and tyr gene, q-PCR (quantitative polymerase chain reaction) was performed. The q-PCR reactions were run in Light Cycler 480 system (Roche Applied Science, Mannheim, Germany) according to the AceQ®q-PCR SYBR Green Master Mix (Vazyme Biotech, Nanjing, Jiangsu, China) protocol. The total reaction volume was 10 µL, which included 5 µL 2 × AceQ®q-PCR SYBR Green Master Mix, 0.5 µL cDNA, 0.2 µM of each primer and sterile distilled water. The cycling conditions were shown in Table S3. Melt-curve analysis verified that specific products were produced with each set of the primer pairs. Primer sequences of β-catenin, lef1 mitf, tyr, and β-actin are listed in Table S4. The zebrafish β-actin gene was used as a reference. The 2(-Delta Delta C(T)) method was used for data analysis.30
Statistical Analyses
For two groups, data were analyzed by unpaired t-test and presented as mean ± SD. Differences were considered statistically significant when the P-value was less than 0.05. Statistical analysis and graphing of data were completed by GraphPad Prism (GraphPad software Inc., San Diego, CA, USA).
Results
Batch Effects Elimination and DEGs Identification
The batch effects of datasets GSE65127, GSE53146 and GSE75819 were eliminated by the “sva” R package (Figure 2A). The number of gene symbols of each dataset was visualized by Venn Diagram (Figure 2B). By integrated analyses, a total of 2442 DEGs were identified using the “limma” R package, including1068 upregulated DEGs and1374 downregulated DEGs (adjusted P-value < 0.05, |log Fold change| >1). The DEGs are shown in the volcano plot (Figure 3A). The top 100 DEGs sorted by |log fold change| value are shown in the cluster heatmap (Figure 3B).
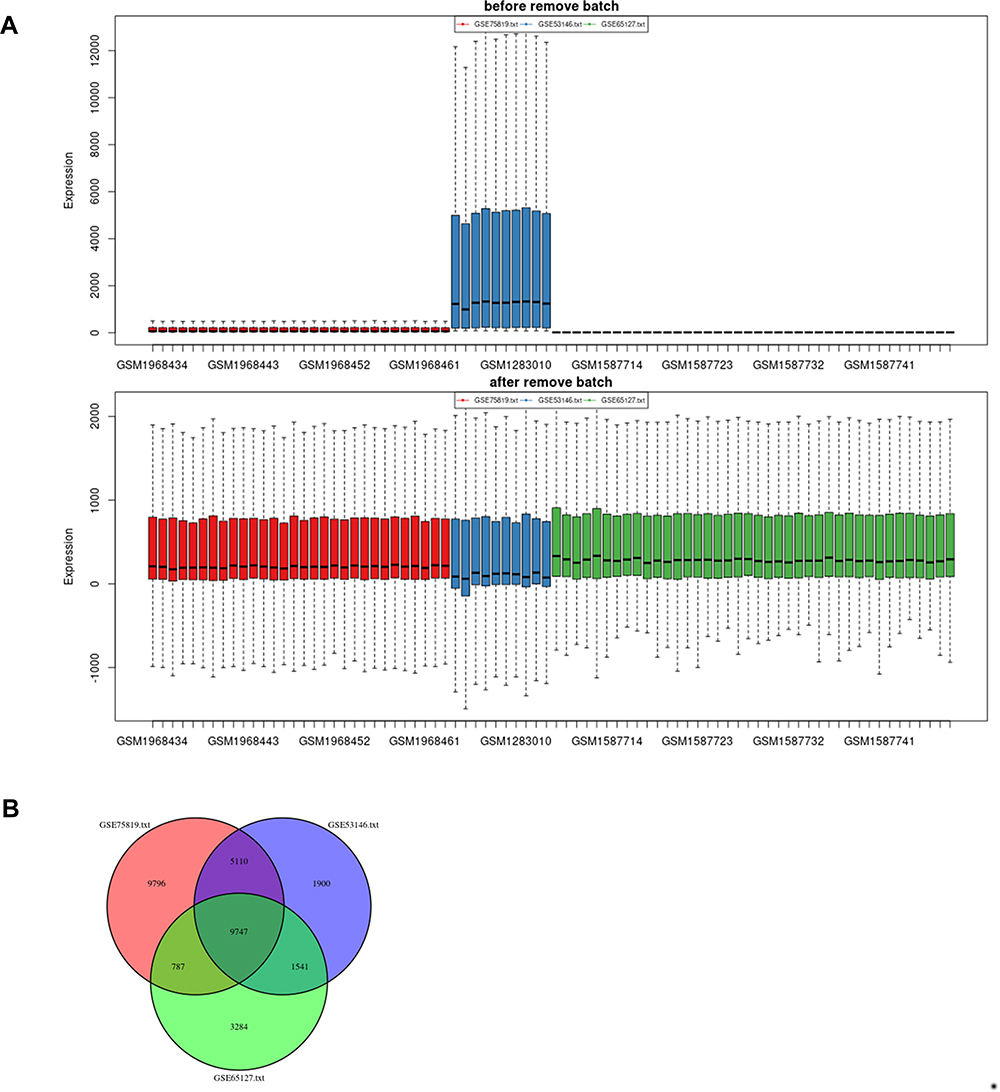 |
Figure 2 Batch effects elimination and Venn plot. (A) Batch effects elimination of datasets GSE65127, GSE53146 and GSE75819. (B) Venn plot revealed the number of overlapping genes among the three datasets. |
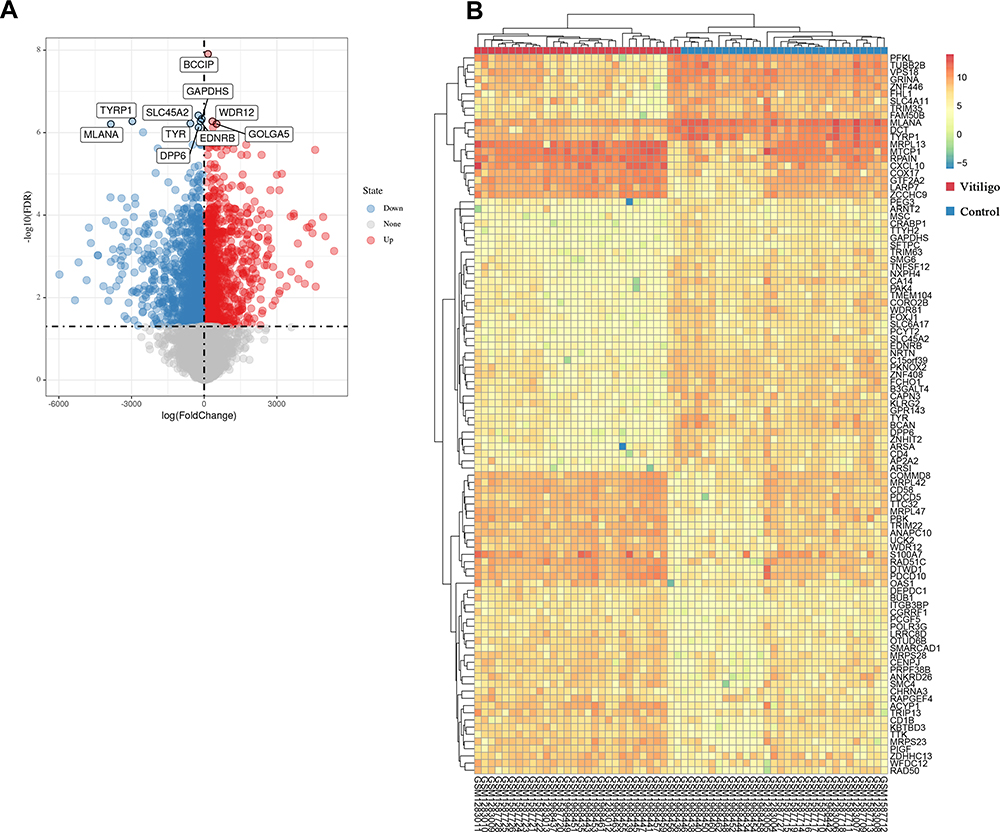 |
Figure 3 Differentially expressed genes (DEGs) between the vitiligo lesional skin group and non-lesional skin group among three datasets. (A) Volcano plot of DEGs for GSE75819, GSE53146 and GSE65127 datasets. The red and blue spots represented relative upregulated and downregulated DEGs based on |log fold change| >1 and adjusted P-value <0.05. The gray dots represented the genes with no statistically significant differences. The names of the top 10 DEGs are shown in the volcano plot. (B) Cluster heat map of the top 100 DEGs sorted by |log fold change| value. The color in heat maps from green to red shows the progression from low to high levels of gene expression. |
GO Functional and KEGG Pathway Analyses
GO functional annotation terms of DEGs were divided into the biological process (BP), cellular component (CC) and molecular function (MF) categories.
In BP category, the upregulated DEGs were mainly enriched in “cell cycle phase transition”, “mitotic cell cycle phase transition” and “regulation of cell cycle process” (Figure 4A). Meanwhile, the downregulated DEGs were mainly enriched in “actin cytoskeleton organization”, “transmembrane receptor protein tyrosine kinase signaling pathway” and “lipid biosynthetic process” (Figure 4B).
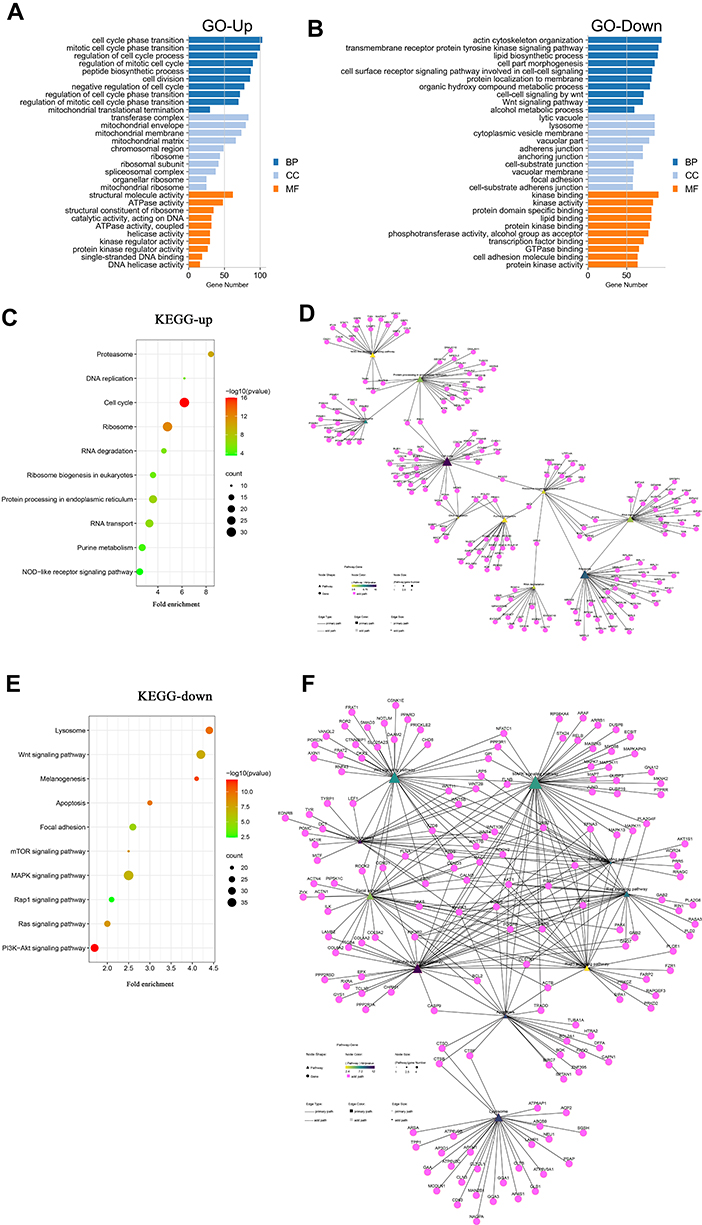 |
Figure 4 GO and KEGG enrichment results of the vitiligo datasets. (A) For upregulated DEGs, the top 30 enriched GO terms sorted by adjusted P-value. (B) For downregulated DEGs, the top 30 enriched GO terms sorted by adjusted P-value. (C) For upregulated DEGs, the top 10 enriched KEGG pathway sorted by gene number. (D) Pathway–gene interaction network of the top 10 enriched KEGG pathways and upregulated DEGs. (E) For downregulated DEGs, the top 10 enriched KEGG pathways sorted by gene number. (F) Pathway–gene interaction network of the top 10 enriched KEGG pathways and downregulated DEGs. Abbreviations: DEGs, differentially expressed genes; GO, Gene Ontology; BP, biological processes; CC, cellular component; MF, molecular function; KEGG, Kyoto Encyclopedia of Genes and Genomes. |
In CC category, the upregulated DEGs were primarily enriched in “transferase complex”, “mitochondrial envelope”, “mitochondrial membrane” and “mitochondrial matrix” (Figure 4A). The downregulated DEGs were primarily enriched in “lytic vacuole”, “lysosome” and “cytoplasmic vesicle membrane” (Figure 4B).
In MF category, the upregulated DEGs were significantly enriched in “structural molecule activity”, “ATPase activity” and “structural constituent of ribosome” (Figure 4A). The downregulated genes were mainly associated with “kinase binding”, ”kinase activity” and “protein domain specific binding” (Figure 4B).
The results of KEGG enrichment showed that the upregulated DEGs were involved in 99 pathways, such as “Proteasome”, “Cell cycle”, “Ribosome” and “NOD-like receptor signaling pathway” (Figure 4C and D). On the other hand, the downregulated DEGs were enriched in 209 KEGG pathways, such as “Wnt signaling pathway”, “Melanogenesis”, “mTOR signaling pathway”, “MAPK signaling pathway”, “Calcium signaling pathway”, “PI3K-Akt signaling pathway”, and “Rap1 signaling pathway” (Figure 4E and F). The DEGs involved in the ”Wnt signaling pathway” and “Melanogenesis” are shown in Figure S1 and Figure S2.
PPI Networks and Hub Modules Analyses
Using the STRING database and Cytoscape software, 1068 upregulated DEGs were filtered into a PPI network containing 1029 nodes and 11,689 edges. Using the MCODE plug-in, a total of 25 clusters were detected from this PPI network. The top four clusters ranked by the scores evaluated by MCODE were selected as hub modules. The top 3 KEGG and GO enrichment terms associated with the hub modules of upregulated DEGs are shown in Table 1.
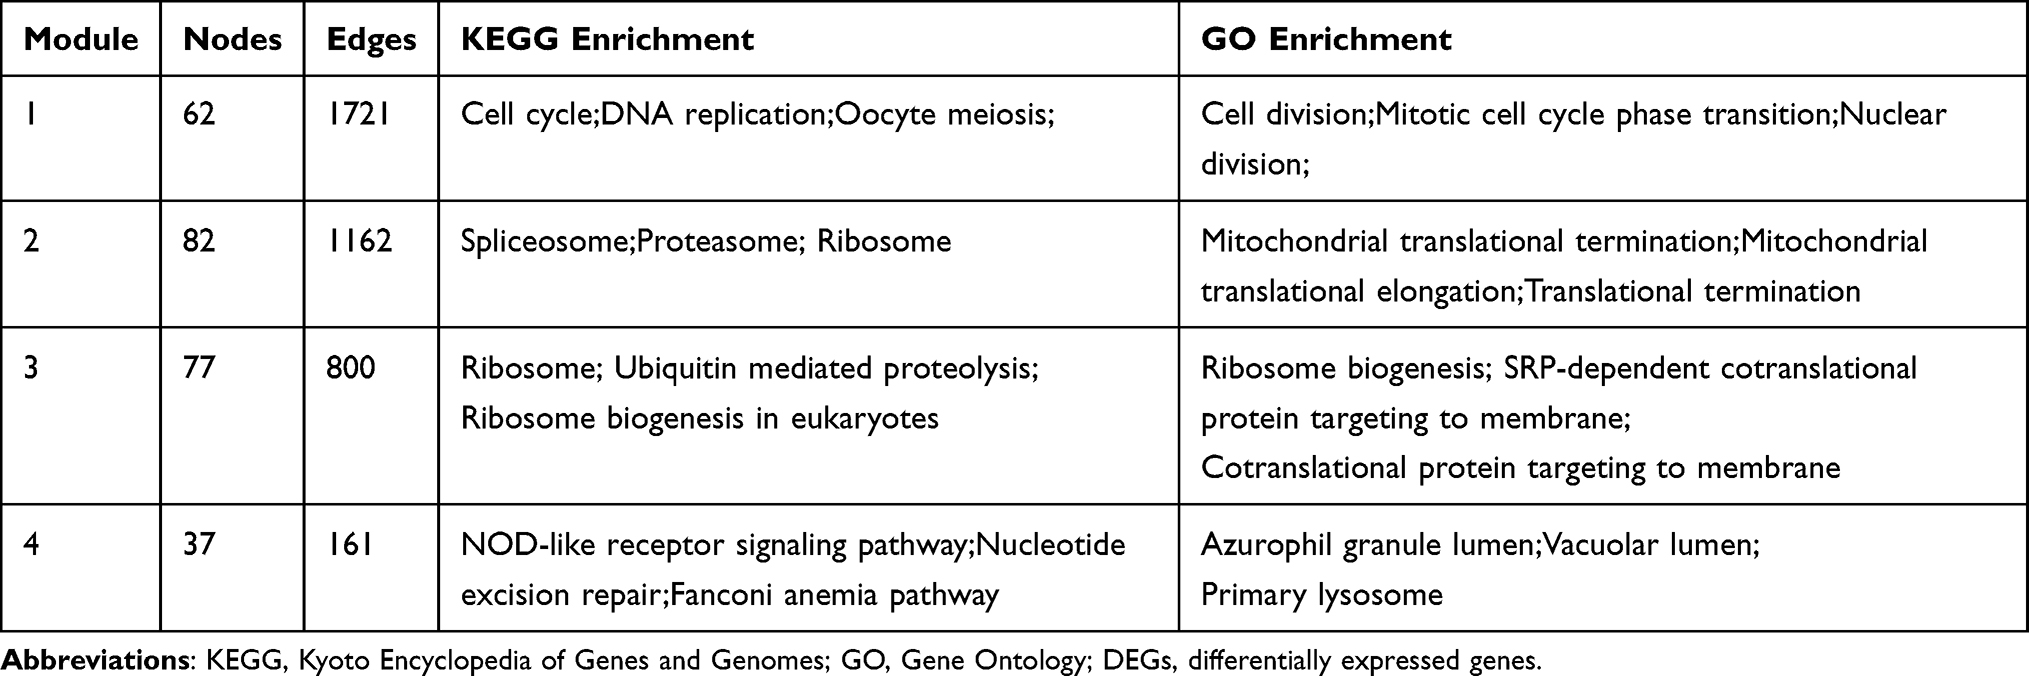 |
Table 1 Top 3 KEGG and GO Enrichment Terms Associated with the Hub Modules of Upregulated DEGs |
On the other hand, 1374 downregulated DEGs were filtered into a PPI network consisting of 1332 nodes and 3435 edges. A total of 30 clusters were identified from this PPI network. The top four clusters were selected as hub modules by the scores evaluated by MCODE. The top 3 KEGG and GO terms associated with the hub modules of downregulated DEGs are shown in Table 2.
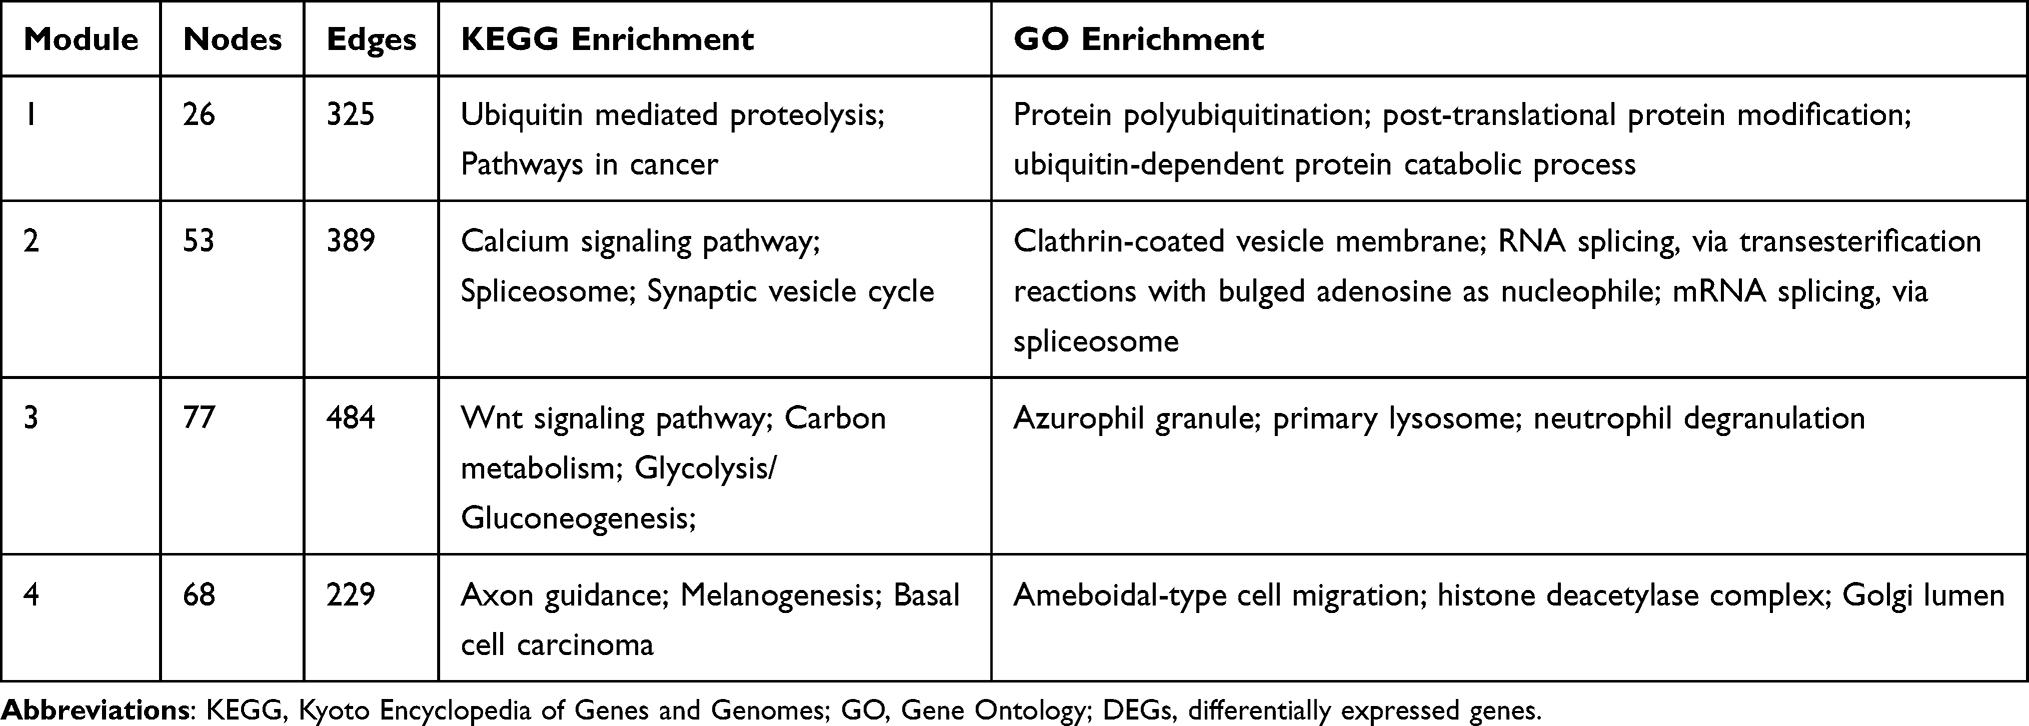 |
Table 2 Top 3 KEGG and GO Enrichment Terms Associated with the Hub Modules of Downregulated DEGs |
Impaired β-Catenin Expression in Vitiligo Lesions
To further confirm the expression level of β-catenin in vitiligo skin, we collected the skin lesions from vitiligo patients (n=6) and normal skin samples from the healthy volunteers (n=6). The expression of β-catenin, MITF and TYR were detected by immunofluorescence staining assay. Firstly, MITF and TYR were concurrently stained to identify the melanocytes (Figure 5A).31,32 Compared with the normal skin, the melanocytes in vitiligo lesions were almost completely lost (P=0.0007, Figure 5C). Secondly, MITF and β-catenin were concurrently stained. Compared with the healthy skin, the signal intensity of β-catenin was diminished in the whole epidermal layer of vitiligo lesions (P=0.0024, Figure 5B and D). These findings showed that the expression of β-catenin was reduced in the whole epidermal layers of the vitiligo lesions, suggested that the defect of the Wnt/β-catenin pathway could be involved in the pathogenesis of vitiligo.
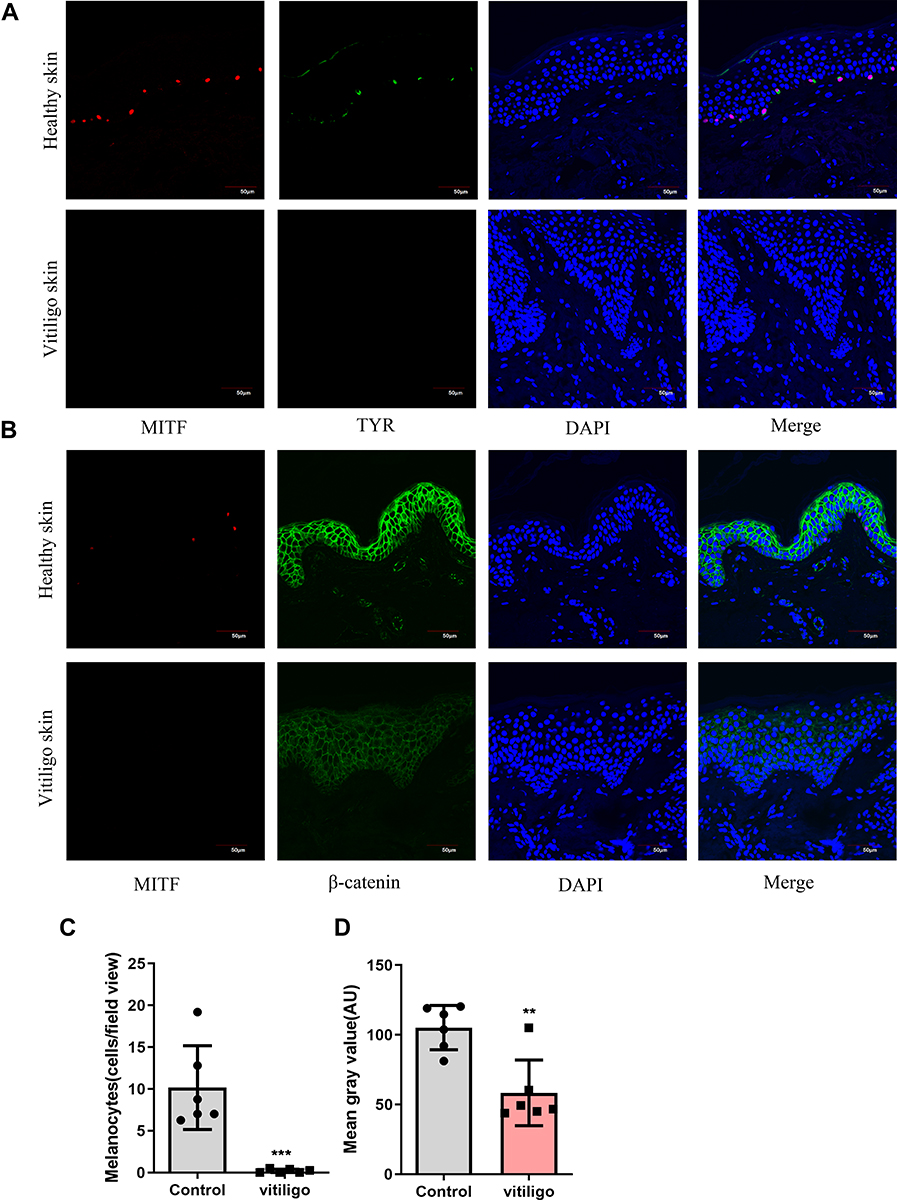 |
Figure 5 Melanocytes deficiency in vitiligo lesions; Impaired β-catenin expression in vitiligo lesions. (A) Representative images of the melanocytes in healthy skin samples (n = 6) and vitiligo lesions (n = 6) detected by immunofluorescence. Melanocytes were stained with antibody to TYR(green) and MITF(red). Nuclei were counterstained with DAPI(blue). Scale bar = 50μm; (B) Representative images of the expression of β-catenin (green) in healthy skin (n = 6) and vitiligo lesions (n = 6) detected using immunofluorescence. Melanocytes were stained with antibody to MITF(red). Nuclei were counterstained with DAPI(blue). Scale bar = 50 μm; (C) Each bar graph represents an average number of melanocytes per view field (20x) in one group (control, Mean±SD=10.17±2.049; vitiligo, Mean±SD=0.19±0.10). For each sample, five fields of view were randomly selected for counting. (D) Signal intensity of β-catenin was quantified by ImageJ software. Each bar graph represents the Mean±SD value of one group (control, Mean±SD=105.2±6.50 vitiligo, Mean±SD=58.37±9.64). For each sample, five fields of view were randomly selected for counting. P-values were calculated by unpaired t-test. (**P < 0.01,***P<0.001). |
Deficiency of Wnt/β-Catenin Pathway Reduced Melanogenesis in Zebrafish
To investigate whether the Wnt/β-catenin pathway could regulate melanogenesis in vivo, we had treated zebrafish with either DMSO or XAV-939, a specific inhibitor of the Wnt/β-catenin pathway, since 24hpf. At 48hpf, a reduction of the melanin granules was observed in the XAV-939 group compared with the control group (Figure 6A). Measured by ImageJ, the mean area percentage of melanin granules in head regions was decrease in the XAV-939 group (P=0.0062, Figure 6B). At 72hpf, a more significant reduction of melanin granules was observed in the XAV-939 group (Figure 6A). The difference in area percentage of melanin granules between groups was more pronounced (P < 0.0001, Figure 6C). These results suggested that the inhibition of the Wnt/β-catenin pathway could reduce melanin production in zebrafish since early stage (24–48hpf). The effect became more pronounced as zebrafish grows (48–72hpf).
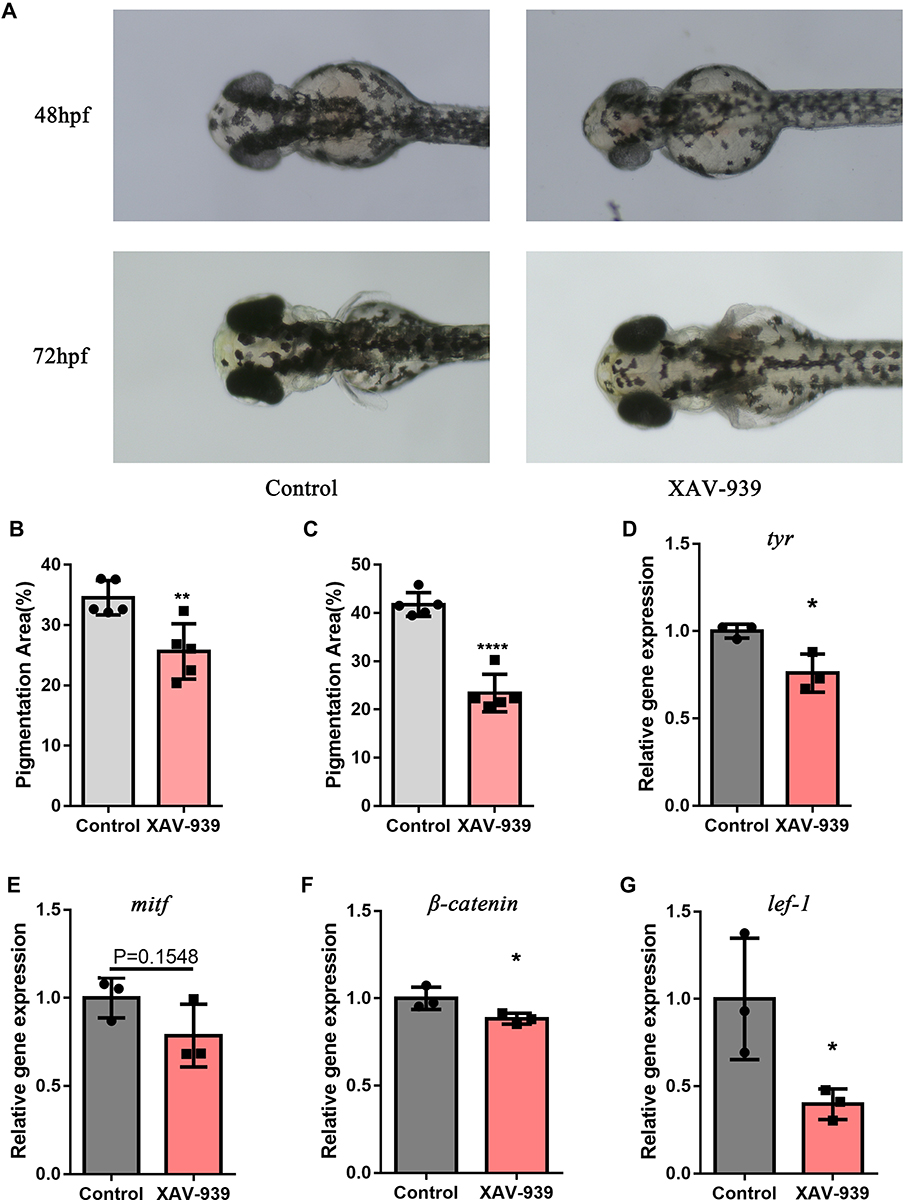 |
Figure 6 Wnt/β-catenin pathway inhibitor reduced melanogenesis and gene expression of β-catenin, lef1, mitf and tyr in zebrafish. (A) Melanin granules in the heads of zebrafish at 48hpf and 72hpf. (B) Using ImageJ, the area of melanin granules as a percentage of the head area was measured at 48hpf. Each bar graph represents the Mean±SD value of one group (control, Mean±SD=34.53±1.27;XAV-939, Mean±SD=25.63±2.05). (C) The area of melanin granules as a percentage of the head area was measured at 72hpf. Each bar graph represents the Mean±SD value of one group (control, Mean±SD=41.76±1.10;XAV-939, Mean±SD=23.41±1.75). (D–G) The relative expression of four genes were confirmed with q-PCR. The fold change values of each gene were: tyr(control, Mean±SD=1.00± 0.02;XAV-939, Mean±SD=0.76±0.06), mitf(control, Mean±SD=1.00±0.07;XAV-939, Mean±SD=0.79±0.10), β-catenin(control, Mean±SD=1.00± 0.04;XAV-939, Mean±SD=0.88± 0.02) and lef1(control, Mean±SD=1.00±0.20;XAV-939, Mean±SD=0.40±0.05). Pigmentation area (%) was defined as the area of melanin granules as a percentage of area of the head of zebrafish; hpf, hour post fertilization; q-PCR, Quantitative polymerase chain reaction. (*P<0.05,**P<0.01,****P<0.0001). |
Inhibition of Wnt/β-Catenin Pathway Downregulated Genes in Melanogenesis Pathway
To reveal the mechanism by which XAV-939 reduce melanocyte generation, the zebrafish had been treated with XAV-939 (10 µM) or DMSO-containing medium since 24hpf. At 72hpf, we examined the mRNA expression of β-catenin and lef1 in the Wnt/β-catenin pathway and tyr and mitf in the melanogenesis pathway by q-PCR. The melting curves were single peaks, suggesting that the amplification products were specific (Figure S3). The expression level of tyr was significantly downregulated by XAV-939 (P=0.0230, Figure 6D). A decrease of mRNA level of mitf was observed (P=0.1548, Figure 6E). Furthermore, the expression of β-catenin, lef1 were significantly decreased in XAV-939 group (*P=0.0458, Figure 6F and P=0.0434, Figure 6G). These results suggested that deletion of the Wnt/β-catenin pathway was associated with the downregulation of mitf and tyr expression in the melanogenesis pathway.
Discussion
Through a comprehensive analysis of the vitiligo datasets (GSE75819, GSE53146, GSE65127) from the GEO database, we identified several key pathways that could be responsible for vitiligo, such as “NOD-like receptor signaling pathway”, “Wnt signaling pathway”, “Melanogenesis”, “mTOR signaling pathway”, “PI3K-Akt signaling pathway”, “Calcium signaling pathway” and “Rap1 signaling pathway”.
Some pathways play important roles in the immune response, such as “Calcium signaling pathway” and “Rap1 signaling pathway”. However, there are no relevant studies on these pathways in vitiligo. The results of this study may provide new thoughts to explain the pathogenesis of vitiligo.
In this study, 26 genes in Calcium signaling pathway were downregulated in vitiligo lesions compared to the controls. Among them, the log fold change value of the STIM1 gene was −211.90, which indicated significantly reduction. In the immune system, calcium signal plays a central role in various cellular functions, such as proliferation, differentiation, apoptosis, and numerous gene transcriptions.33 During immune responses, the engagement of T-cell and B-cell antigen receptors results in the decrease in ER Ca2+ concentrations. The latter is the trigger for conformational changes of STIM1 and its homolog STIM2 that allow both proteins to bind to and open Ca2+ release-activated Ca2+ (CRAC) channels.34 The resulting Ca2+ influx is called store-operated Ca2+ entry (SOCE), which is essential for Treg development in the thymus, post-thymic differentiation and function, and the ability of Treg cells to maintain immune self-tolerance.35–37 On the other hand, Tregs have been found to be less abundant in vitiligo skin, and their functional activity is compromised.38–40 The downregulation of genes in calcium signaling may explain the decreased number and impaired function of Treg cells in vitiligo.
Interestingly, patients with CRAC channelopathy can develop autoantibodies such as antinuclear antibodies (ANA).41 In Stim1 fl/fl Stim2 fl/fl Cd4cre deficient mice, the loss of SOCE in T cells leads to the presence of multiple auto-antibodies against nuclear antigens (ANA), double stranded DNA, as well as Ro(SSA) and La(SSB) antigens.42 More research is needed to explore whether the increased susceptibility of vitiligo patients to autoimmune diseases (such as lupus erythematosus) is related to the abnormalities in calcium signaling pathway.
In the analysis of this study, multiple down-regulated genes were enriched in the Rap1 signaling pathway. Ring et al43 showed that Treg can attract DCs through the activation of the Epac1-Rap1-dependent pathway. The formation of DC-Treg clusters and their interaction leads to decreased T cell stimulatory capacity and secretion of suppressive cytokines in DCs. Moreover, the study of Abreu et al44 shows that during collagen-induced arthritis (CIA), the percentage of CD8+ T cells secreting tumor necrosis factor α was significantly decreased in RapV12-transgenic mice, which express an active mutant of Rap1 in the T cell compartment. This leads to a hypothesis that the downregulated genes in the Rap1 signaling pathway may explain the mechanism of the compromised functional activity of Treg and the increase of the percentage of CD8+ T cells in vitiligo.
Interestingly, in synovial fluid T lymphocytes from the rheumatoid arthritis patients, Remans et al45 found a high rate of endogenous ROS production associated with Ras activation and Rap1 inhibition. Introduction of dominant-negative Ras into synovial fluid T cells restored redox homeostasis, suggesting that the dysregulation of Ras and Rap1 signaling underlies oxidative stress and the altered T cell function in rheumatoid arthritis. In rats, overexpression of constitutively active Rap1b G12V significantly ameliorated STZ-induced renal mitochondrial dysfunction, oxidative stress and apoptosis, indicating that Rap1b can ameliorate renal tubular injury and slow the progression of diabetic nephropathy by modulating mitochondrial dysfunction.46 It can be speculated that the decrease of Rap1 signaling pathway may contribute to its oxidative stress imbalance in vitiligo.
In this study, several terms related to mitochondria were identified in the GO and PPI analyses, such as “mitochondrial translational termination”, “mitochondrial membrane” and “mitochondrial matrix”. Dell’ Anna et al47 found that the mitochondrial function is abnormal in vitiligo lesions. It is well known that mitochondria are the major site of the production of reactive oxygen species (ROS), an important oxidative stress factor. Regazzetti et al23 found that in an ex vivo skin model, oxidative stress inhibited the activity of the Wnt pathway in melanocytes and keratinocytes. Therefore, oxidative stress damage caused by mitochondrial dysfunction may be responsible for the downregulation of Wnt/β-catenin pathway in vitiligo.
From the previous inference, Wnt pathway can be the downstream of rap1 signaling pathway and oxidative stress pathway. Meanwhile, among the downregulate pathways, Wnt pathway was the top 1 pathway ranked by P values. We inferred that Wnt pathway may be a potential therapeutic target for vitiligo. Thus, we chose Wnt signaling pathway for experimental validation of vitiligo skin samples and zebrafish. To date, no comparative report on the differences in β-catenin expression in vitiligo lesions versus healthy skin is available. Immunohistochemical results by Reichert Faria et al48 showed no significant difference in β-catenin expression between lesional and non-lesional skin from the same vitiligo patient. The present study showed that the expression of β-catenin was significantly reduced in the whole epidermal layer of vitiligo lesions, which suggested that the Wnt/β-catenin pathway played an important role in the pathogenesis of vitiligo.
Due to the transparent body surface of zebrafish, researchers can visually observe pigmentation changes, making zebrafish a widely used animal model of pigmentation studies.49 To further investigate the effect of the Wnt/β-catenin pathway on melanin production and its mechanism in vivo, we treated 24hpf zebrafish with XAV-939, a specific inhibitor of the Wnt pathway.50 The inhibition of the Wnt/β-catenin pathway resulted in decreased melanin granule production since early stage (24–48hpf) of zebrafish. Moreover, this effect became more significant as zebrafish grows (48–72hpf). Similarly, Vibert et al51 found that activating the Wnt signaling pathway from 15hpf to 30hpf increased the number of melanocytes in zebrafish. However, the number of melanocytes did not increase after activating the Wnt signaling from 24hpf to 48 hpf.
The molecular mechanism by which the Wnt/β-catenin pathway affects pigmentation remains unclear. Interestingly, according to the Pathway–Gene interaction network analysis of this study, LEF1 gene was closely linked to both the Wnt pathway and melanogenesis pathway. Researches showed that the activation of the Wnt/β-catenin signaling pathway was mainly accomplished through the binding of Wnt protein to its transmembrane receptor, Frizzled, which blocked GSK-3β-dependent phosphorylation of β-catenin, thereby preventing β-catenin degradation in the cytoplasm. After that, β-catenin was translocated to the nucleus and acted as a transcriptional activator cooperating with the co-activator, LEF-1.52,53 Ultimately, the Wnt signaling pathway increased melanin production and promoted melanocyte proliferation and differentiation.54–56
In melanoma cells, activation of the Wnt/β-catenin pathway lead to activation of MITF and TYR transcripts and an increase in melanin production.56 We performed q-PCR with RNA extracted from 72hpf zebrafish. The mRNA expression of β-catenin, lef1, tyr and mitf were reduced in the XAV-939 group. These results suggested that the Wnt pathway may influence pigmentation through MITF and TYR gene in vivo. Studies showed that MITF controlled almost all aspects of melanocyte biology, such as melanocyte survival, development and melanogenesis.57–59 The TYR gene, on the other hand, encodes the enzyme that catalyzes multiple steps in the conversion of tyrosine to melanin and is a key enzyme in melanin synthesis.60
Conclusion
In summary, by combined analyses of three vitiligo microarrays, we identified several key pathways which could be involved in the pathophysiological mechanisms of vitiligo, such as “NOD-like receptor signaling pathway”, “Wnt signaling pathway”, “Melanogenesis”, “mTOR signaling pathway”, “PI3K-Akt signaling pathway”, “Calcium signaling pathway” and “Rap1 signaling pathway”. Among them, “Calcium signaling pathway” and “Rap1 signaling pathway” were firstly noticed in vitiligo. This may provide new ideas to explain the pathogenesis of vitiligo since they play important roles in immune response and oxidative stress. As a downstream pathway of the Rap1 pathway and oxidative stress, as well as the top ranked pathway among the downregulated pathways in KEGG analysis, the Wnt signaling pathway has attracted our focused attention. We verified the role of the Wnt pathway in vivo. The immunofluorescence staining assay demonstrated for the first time that β-catenin protein was significantly downregulated in the whole epidermal layer of vitiligo lesions compared with the healthy skin. In zebrafish, the inhibition of the Wnt pathway significantly downregulated the production of melanin granules and expression of β-catenin, lef1, mitf and tyr genes. These results suggested that the Wnt/β-catenin pathway played an important role in the pathogenesis of vitiligo and could be a breakthrough point in vitiligo treatment.
Abbreviations
BP, biological processes; CC, cellular component; DEGs, differentially expressed genes; DMSO, dimethyl sulfoxide; GEO, Gene Expression Omnibus; GO, Gene Ontology; hpf, hour post fertilization; FC, fold change; KEGG, Kyoto Encyclopedia of Genes and Genomes; MCC, Maximal Clique Centrality; MF, molecular function; MITF, microphthalmia-associated transcription factor; LEF-1, lymphoid-enhancing factor 1; PPI, protein–protein interaction; q-PCR, quantitative polymerase chain reaction; TYR, tyrosinase.
Acknowledgments
The present study was supported by the Nanjing Incubation Program for National Clinical Research Center (No. 2019060001) and the National Natural Science Foundation of China (No. 81772916). The authors thank Key Laboratory of Molecular Biology for Skin Diseases and STIs for equipment support.
Disclosure
The authors report no conflicts of interest in this work.
References
1. Ezzedine K, Lim HW, Suzuki T, et al.; Vitiligo Global Issue Consensus Conference Panelists. Revised classification/nomenclature of vitiligo and related issues: the Vitiligo Global Issues Consensus Conference. Pigment Cell Melanoma Res. 2012;25(3):E1–13. doi:10.1111/j.1755-148X.2012.00997.x
2. Rodrigues M, Ezzedine K, Hamzavi I, Pandya AG, Harris JE, Vitiligo Working Group. New discoveries in the pathogenesis and classification of vitiligo. J Am Acad Dermatol. 2017;77(1):1–13. doi:10.1016/j.jaad.2016.10.048.
3. Wang G, Qiu D, Yang H, Liu W. The prevalence and odds of depression in patients with vitiligo: a meta-analysis. J Eur Acad Dermatol Venereol. 2018;32(8):1343–1351. doi:10.1111/jdv.14739
4. Patel KR, Singam V, Rastogi S, Lee HH, Silverberg NB, Silverberg JI. Association of vitiligo with hospitalization for mental health disorders in US adults. J Eur Acad Dermatol Venereol. 2019;33(1):191–197. doi:10.1111/jdv.15255
5. Speeckaert R, van Geel N. Vitiligo: an update on pathophysiology and treatment options. Am J Clin Dermatol. 2017;18(6):733–744. doi:10.1007/s40257-017-0298-5
6. Malhotra N, Dytoc M. The pathogenesis of vitiligo. J Cutan Med Surg. 2013;17(3):153–172. doi:10.2310/7750.2012.12005
7. Khan R, Satyam A, Gupta S, Sharma VK, Sharma A. Circulatory levels of antioxidants and lipid peroxidation in Indian patients with generalized and localized vitiligo. Arch Dermatol Res. 2009;301(10):731–737. doi:10.1007/s00403-009-0964-4
8. Wu CS, Yu HS, Chang HR, Yu CL, Yu CL, Wu BN. Cutaneous blood flow and adrenoceptor response increase in segmental-type vitiligo lesions. J Dermatol Sci. 2000;23(1):53–62. doi:10.1016/s0923-1811(99)00090-0
9. Westerhof W, d’Ischia M. Vitiligo puzzle: the pieces fall in place. Pigment Cell Res. 2007;20(5):345–359. doi:10.1111/j.1600-0749.2007.00399.x
10. Bergqvist C, Ezzedine K. Vitiligo: a Review. Dermatology. 2020;236(6):571–592. doi:10.1159/000506103
11. Mosenson JA, Zloza A, Nieland JD, et al. Mutant HSP70 reverses autoimmune depigmentation in vitiligo. Sci Transl Med. 2013;5(174):174ra28. doi:10.1126/scitranslmed.3005127
12. Zhen Y, Yao L, Zhong S, Song Y, Cui Y, Li S. Enhanced Th1 and Th17 responses in peripheral blood in active non-segmental vitiligo. Arch Dermatol Res. 2016;308(10):703–710. doi:10.1007/s00403-016-1690-3
13. Harris JE. IFN-γ in Vitiligo, Is It the Fuel or the Fire? Acta Derm Venereol. 2015;95(6):643–644. doi:10.2340/00015555-2137
14. Singh RK, Lee KM, Vujkovic-Cvijin I, et al. The role of IL-17 in vitiligo: a review. Autoimmun Rev. 2016;15(4):397–404. doi:10.1016/j.autrev.2016.01.004
15. Baharav E, Merimski O, Shoenfeld Y, et al. Tyrosinase as an autoantigen in patients with vitiligo. Clin Exp Immunol. 1996;105(1):84–88. doi:10.1046/j.1365-2249.1996.d01-727.x
16. Kemp EH, Emhemad S, Akhtar S, Watson PF, Gawkrodger DJ, Weetman AP. Autoantibodies against tyrosine hydroxylase in patients with non-segmental (generalised) vitiligo. Exp Dermatol. 2011;20(1):35–40. doi:10.1111/j.1600-0625.2010.01181.x
17. Hedstrand H, Ekwall O, Olsson MJ, et al. The transcription factors SOX9 and SOX10 are vitiligo autoantigens in autoimmune polyendocrine syndrome type I. J Biol Chem. 2001;276(38):35390–35395. doi:10.1074/jbc.M102391200
18. Jimbo H, Nagai H, Fujiwara S, Shimoura N, Nishigori C. Fas-FasL interaction in cytotoxic T cell-mediated vitiligo: the role of lesional expression of tumor necrosis factor-α and interferon-γ in Fas-mediated melanocyte apoptosis. Exp Dermatol. 2020;29(1):61–70. doi:10.1111/exd.14053
19. van den Wijngaard R, Wankowicz-Kalinska A, Pals S, Weening J, Das P. Autoimmune melanocyte destruction in vitiligo. Lab Invest. 2001;81(8):1061–1067. doi:10.1038/labinvest.3780318
20. Zhang R, Yang X, Wang J, et al. Identification of potential biomarkers for differential diagnosis between rheumatoid arthritis and osteoarthritis via integrative genome-wide gene expression profiling analysis. Mol Med Rep. 2019;19(1):30–40. doi:10.3892/mmr.2018.9677
21. Jiang P, Liu XS. Big data mining yields novel insights on cancer. Nat Genet. 2015;47(2):103–104. doi:10.1038/ng.3205
22. Singh A, Gotherwal V, Junni P, et al. Mapping architectural and transcriptional alterations in non-lesional and lesional epidermis in vitiligo. Sci Rep. 2017;7(1):9860. doi:10.1038/s41598-017-10253-w
23. Regazzetti C, Joly F, Marty C, et al. Transcriptional Analysis of Vitiligo Skin Reveals the Alteration of WNT Pathway: a Promising Target for Repigmenting Vitiligo Patients. J Invest Dermatol. 2015;135(12):3105–3114. doi:10.1038/jid.2015.335
24. Rashighi M, Agarwal P, Richmond JM, et al. CXCL10 is critical for the progression and maintenance of depigmentation in a mouse model of vitiligo. Sci Transl Med. 2014;6(223):223ra23. doi:10.1126/scitranslmed.3007811
25. Phipson B, Lee S, Majewski IJ, Alexander WS, Smyth GK. Robust hyperparameter estimation protects against hypervariable genes and improves power to detect differential expression. Ann Appl Stat. 2016;10(2):946–963. doi:10.1214/16-AOAS920
26. Leek JT, Johnson WE, Parker HS, Jaffe AE, Storey JD. The sva package for removing batch effects and other unwanted variation in high-throughput experiments. Bioinformatics. 2012;28(6):882–883. doi:10.1093/bioinformatics/bts034
27. Zhou Y, Zhou B, Pache L, et al. Metascape provides a biologist-oriented resource for the analysis of systems-level datasets. Nat Commun. 2019;10(1):1523. doi:10.1038/s41467-019-09234-6
28. Szklarczyk D, Gable AL, Lyon D, et al. STRING v11: protein-protein association networks with increased coverage, supporting functional discovery in genome-wide experimental datasets. Nucleic Acids Res. 2019;47(D1):D607–D613. doi:10.1093/nar/gky1131
29. Bandettini WP, Kellman P, Mancini C, et al. MultiContrast Delayed Enhancement(MCODE) improves detection of subendocardial myocardial infarction by late gadolinium enhancement cardiovascular magnetic resonance: a clinical validation study. J Cardiovasc Magn Reson. 2012;14(1):83. doi:10.1186/1532-429X-14-83
30. Livak KJ, Schmittgen TD. Analysis of relative gene expression data using real-time quantitative PCR and the 2(-Delta Delta C(T)) Method. Methods. 2001;25(4):402–408. doi:10.1006/meth.2001.1262
31. Regazzetti C, Sormani L, Debayle D, et al. Melanocytes sense blue light and regulate pigmentation through opsin-3. J Invest Dermatol. 2018;138(1):171–178. doi:10.1016/j.jid.2017.07.833
32. Basrur V, Yang F, Kushimoto T, et al. Proteomic analysis of early melanosomes: identification of novel melanosomal proteins. J Proteome Res. 2003;2(1):69–79. doi:10.1021/pr025562r
33. Park YJ, Yoo SA, Kim M, Kim WU. The Role of Calcium-Calcineurin-NFAT Signaling Pathway in Health and Autoimmune Diseases. Front Immunol. 2020;11:195. doi:10.3389/fimmu.2020.00195
34. Vaeth M, Kahlfuss S, Feske S. CRAC Channels and Calcium Signaling in T Cell-Mediated Immunity. Trends Immunol. 2020;41(10):878–901. doi:10.1016/j.it.2020.06.012
35. Oh-Hora M, Yamashita M, Hogan PG, et al. Dual functions for the endoplasmic reticulum calcium sensors STIM1 and STIM2 in T cell activation and tolerance. Nat Immunol. 2008;9(4):432–443. doi:10.1038/ni1574
36. Vaeth M, Wang YH, Eckstein M, et al. Tissue resident and follicular Treg cell differentiation is regulated by CRAC channels. Nat Commun. 2019;10(1):1183. doi:10.1038/s41467-019-08959-8
37. Oh-Hora M, Komatsu N, Pishyareh M, et al. Agonist-selected T cell development requires strong T cell receptor signaling and store-operated calcium entry. Immunity. 2013;38(5):881–895. doi:10.1016/j.immuni.2013.02.008
38. Ben Ahmed M, Zaraa I, Rekik R, et al. Functional defects of peripheral regulatory T lymphocytes in patients with progressive vitiligo. Pigment Cell Melanoma Res. 2012;25(1):99–109. doi:10.1111/j.1755-148X.2011.00920.x
39. Lin M, Zhang BX, Shen N, et al. Regulatory T cells from active non-segmental vitiligo exhibit lower suppressive ability on CD8+CLA+ T cells. Eur J Dermatol. 2014;24(6):676–682. doi:10.1684/ejd.2014.2436
40. Dwivedi M, Kemp EH, Laddha NC, Mansuri MS, Weetman AP, Begum R. Regulatory T cells in vitiligo: implications for pathogenesis and therapeutics. Autoimmun Rev. 2015;14(1):49–56. doi:10.1016/j.autrev.2014.10.002
41. Vaeth M, Eckstein M, Shaw PJ, et al. Store-Operated Ca(2+) Entry in Follicular T Cells Controls Humoral Immune Responses and Autoimmunity. Immunity. 2016;44(6):1350–1364. doi:10.1016/j.immuni.2016.04.013
42. Lian J, Cuk M, Kahlfuss S, et al. ORAI1 mutations abolishing store-operated Ca2+ entry cause anhidrotic ectodermal dysplasia with immunodeficiency. J Allergy Clin Immunol. 2018;142(4):1297–1310. doi:10.1016/j.jaci.2017.10.031
43. Ring S, Pushkarevskaya A, Schild H, et al. Regulatory T cell-derived adenosine induces dendritic cell migration through the Epac-Rap1 pathway. J Immunol. 2015;194(8):3735–3744. doi:10.4049/jimmunol.1401434
44. Abreu JR, Krausz S, Dontje W, et al. Sustained T cell Rap1 signaling is protective in the collagen-induced arthritis model of rheumatoid arthritis. Arthritis Rheum. 2010;62(11):3289–3299. doi:10.1002/art.27656
45. Remans PH, Gringhuis SI, van Laar JM, et al. Rap1 signaling is required for suppression of Ras-generated reactive oxygen species and protection against oxidative stress in T lymphocytes. J Immunol. 2004;173(2):920–931. doi:10.4049/jimmunol.173.2.920
46. Xiao L, Zhu X, Yang S, et al. Rap1 ameliorates renal tubular injury in diabetic nephropathy. Diabetes. 2014;63(4):1366–1380. doi:10.2337/db13-1412
47. Dell’Anna ML, Urbanelli S, Mastrofrancesco A, et al. Alterations of mitochondria in peripheral blood mononuclear cells of vitiligo patients. Pigment Cell Res. 2003;16(5):553–559. doi:10.1034/j.1600-0749.2003.00087.x
48. Reichert Faria A, Jung JE, Silva de Castro CC, de Noronha L. Reduced immunohistochemical expression of adhesion molecules in vitiligo skin biopsies. Pathol Res Pract. 2017;213(3):199–204. doi:10.1016/j.prp.2016.12.019
49. Crawford NG, Kelly DE, Hansen MEB, et al. Loci associated with skin pigmentation identified in African populations. Science. 2017;358(6365):eaan8433. doi:10.1126/science.aan8433
50. Tenbaum SP, Ordóñez-Morán P, Puig I, et al. β-catenin confers resistance to PI3K and AKT inhibitors and subverts FOXO3a to promote metastasis in colon cancer. Nat Med. 2012;18(6):892–901. doi:10.1038/nm.2772
51. Vibert L, Aquino G, Gehring I, et al. An ongoing role for Wnt signaling in differentiating melanocytes in vivo.. Pigment Cell Melanoma Res. 2017;30(2):219–232. doi:10.1111/pcmr.12568
52. Barker N. The canonical Wnt/beta-catenin signalling pathway. Methods Mol Biol. 2008;468:5–15. doi:10.1007/978-1-59745-249-6_1
53. Kofahl B, Wolf J. Mathematical modelling of Wnt/β-catenin signalling. Biochem Soc Trans. 2010;38(5):1281–1285. doi:10.1042/BST0381281
54. Sun Q, Rabbani P, Takeo M, et al. Dissecting Wnt Signaling for Melanocyte Regulation during Wound Healing. J Invest Dermatol. 2018;138(7):1591–1600. doi:10.1016/j.jid.2018.01.030
55. Yamada T, Hasegawa S, Inoue Y, et al. Wnt/β-catenin and kit signaling sequentially regulate melanocyte stem cell differentiation in UVB-induced epidermal pigmentation. J Invest Dermatol. 2013;133(12):2753–2762. doi:10.1038/jid.2013.235
56. Li L, Liang Y, Zhang D, et al. The 308-nm excimer laser stimulates melanogenesis via the wnt/β-Catenin signaling pathway in B16 cells. J Dermatolog Treat. 2019;30(8):826–830. doi:10.1080/09546634.2019.1572861
57. Levy C, Khaled M, Fisher DE. MITF: master regulator of melanocyte development and melanoma oncogene. Trends Mol Med. 2006;12(9):406–414. doi:10.1016/j.molmed.2006.07.008
58. Widlund HR, Fisher DE. Microphthalamia-associated transcription factor: a critical regulator of pigment cell development and survival. Oncogene. 2003;22(20):3035–3041. doi:10.1038/sj.onc.1206443
59. Cheli Y, Ohanna M, Ballotti R, Bertolotto C. Fifteen-year quest for microphthalmia-associated transcription factor target genes. Pigment Cell Melanoma Res. 2010;23(1):27–40. doi:10.1111/j.1755-148X.2009.00653.x
60. Forshew T, Khaliq S, Tee L, et al. Identification of novel TYR and TYRP1 mutations in oculocutaneous albinism. Clin Genet. 2005;68(2):182–184. doi:10.1111/j.1399-0004.2005.00460.x
 © 2021 The Author(s). This work is published and licensed by Dove Medical Press Limited. The full terms of this license are available at https://www.dovepress.com/terms.php and incorporate the Creative Commons Attribution - Non Commercial (unported, v3.0) License.
By accessing the work you hereby accept the Terms. Non-commercial uses of the work are permitted without any further permission from Dove Medical Press Limited, provided the work is properly attributed. For permission for commercial use of this work, please see paragraphs 4.2 and 5 of our Terms.
© 2021 The Author(s). This work is published and licensed by Dove Medical Press Limited. The full terms of this license are available at https://www.dovepress.com/terms.php and incorporate the Creative Commons Attribution - Non Commercial (unported, v3.0) License.
By accessing the work you hereby accept the Terms. Non-commercial uses of the work are permitted without any further permission from Dove Medical Press Limited, provided the work is properly attributed. For permission for commercial use of this work, please see paragraphs 4.2 and 5 of our Terms.