")
Back to Journals » OncoTargets and Therapy » Volume 12
Identification of the Different Roles and Potential Mechanisms of T Isoforms in the Tumor Recurrence and Cell Cycle of Chordomas
Authors Ma J, Chen W, Wang K, Tian K, Li Q , Zhao T, Zhang L, Wang L, Wu Z, Zhang J
Received 26 September 2019
Accepted for publication 19 December 2019
Published 3 January 2020 Volume 2019:12 Pages 11777—11791
DOI https://doi.org/10.2147/OTT.S232526
Checked for plagiarism Yes
Review by Single anonymous peer review
Peer reviewer comments 2
Editor who approved publication: Dr Sanjay Singh
Junpeng Ma,1 Wei Chen,2 Ke Wang,1 Kaibing Tian,1 Qi Li,3 Tianna Zhao,4 Liwei Zhang,1,3,5,6 Liang Wang,1,5,6 Zhen Wu,1,3,5,6 Junting Zhang1,5,6
1Department of Neurosurgery, Beijing Tiantan Hospital, Capital Medical University, Beijing, People’s Republic of China; 2Key Laboratory of Genomic and Precision Medicine, Beijing Institute of Genomics, Chinese Academy of Sciences, Beijing, People’s Republic of China; 3China National Clinical Research Center for Neurological Diseases, Beijing, People’s Republic of China; 4Department of Neurosurgery, Johns Hopkins University School of Medicine, Baltimore, MD, USA; 5Center of Brain Tumor, Beijing Institute for Brain Disorders, Beijing, People’s Republic of China; 6Beijing Key Laboratory of Brian Tumor, Beijing, People’s Republic of China
Correspondence: Junting Zhang; Liang Wang
Beijing Tiantan Hospital, Capital Medical University, No. 119 South 4th Ring West Road, Fengtai District, Beijing 100070, People’s Republic of China
Tel +86-10-59978431
Fax +86-10-59971377
Email [email protected]; [email protected]
Purpose: The roles of T (brachyury) isoforms in chordomas remain unclear. This study aimed to investigate the different roles and mechanisms of them in chordomas.
Patients and methods: The expression of T isoforms mRNAs in 57 chordomas was assessed, and a prognosis analysis was conducted. Cell apoptosis, proliferation and cell cycle assays were performed after specific T isoform mRNA knockdown. Whole-transcriptome sequencing, Gene Set Enrichment Analysis, Gene Ontology analysis, Kyoto Encyclopedia of Genes and Genomes analysis and competing endogenous RNA (ceRNA) analysis were conducted.
Results: As revealed in this study, the T-long isoform was a significant risk factor (hazard ratio [HR], 1.09; P=0.018) and the T-short isoform was a protective factor (HR, 0.24; P=0.012) associated with tumor recurrence. After T-long isoform knockdown, the cell cycle was arrested at G0/G1 phase and cell proliferation was significantly inhibited. A bioinformatic analysis revealed that the upregulation of H19, P21 and GADD45B; downregulation of SKP2 and CDK2; and accompanying changes in the P53 signaling pathway consistently contributed to G0/G1 arrest. After T-short isoform knockdown, the cell cycle was arrested at G2/M phase and cell apoptosis tended to increase slightly (P=0.067). The upregulation of YWHAZ and downregulation of E2F1 and its target genes might contribute to cell cycle arrest in G2/M phase and apoptosis. In addition, the ceRNA network, consisting of long noncoding RNAs, mRNAs and microRNAs, was established.
Conclusion: The T-long isoform was a risk factor and the T-short isoform was a protective factor for chordoma recurrence. In addition, the cell cycle was the main target of T isoforms knockdown, and the changes in the downstream transcriptome may contribute to the different effects of specific T isoform knockdown on the changes in the cell cycle distributions and apoptosis and proliferation of chordoma cells.
Keywords: brachyury, ceRNA, cell cycle, chordoma, prognosis, whole-transcriptome sequencing
Plain Language Summary
Currently, doctors and patients are facing an extremely difficult situation when treating chordoma, a malignant bone cancer. Brachyury (encoded by the T gene), which is expressed in approximately all chordomas, has been a diagnostic marker and molecular target for this disease. However, the roles of T isoforms in the carcinogenesis of chordoma and their prognostic values remain unclear. In the present study, we investigated the different roles and potential mechanisms of T isoforms in determining the prognosis and cellular functions of chordoma for the first time. The T-long isoform was a risk factor and the T-short isoform was a protective factor for chordoma recurrence. Additionally, the cell cycle was the main target of T isoforms knockdown, while different phases were affected by the knockdown of different T isoforms. Whole-transcriptome sequencing was conducted after specific T isoforms were knocked down. The downstream transcriptomes were also different, which contributed to the differences in cell cycle changes. In addition, the competing endogenous RNA network after T isoform knockdown was established for the first time. As brachyury is becoming a main target of various diseases, this paper might also reveal a promising research topic regarding the investigation of the roles of T isoforms in the development and degeneration of the notochord, carcinogenesis and the treatment of various cancers, developmental defect diseases, etc.
Introduction
Chordomas are rare malignant bone tumors located in the central axis of the human body.1 The incidence of chordoma is estimated to be approximately 1 per million, and it grows slowly but tends to recur repeatedly.2 Additionally, these tumors display aggressiveness towards surrounding structures, which causes severe symptoms and makes radical resection difficult to achieve.3–5 Chordomas are also resistant to radiation therapy and systemic drug therapy.6 Patients can exhibit partial remission after treatment with targeted therapies but then rapidly progress.7 Doctors and patients currently face an extremely difficult situation.
Chordomas are thought to arise from notochord remnants.8 The notochord, which is located in the central axis of the embryo, degenerates to form the fetal nucleus pulposus in humans at approximately the 7th to 12th week (roughly 9th week with the establishment of a fetus) after fertilization.9–11 A vital role of the T gene, which is consistently expressed in the notochord, and its remnants has been revealed in mesoderm formation.12,13 This gene is also expressed in nearly all chordomas and functions as a diagnostic marker for chordoma.14 Three transcripts of T have been identified (https://www.ncbi.nlm.nih.gov/gene/6862). The brachyury protein translated from T isoform 1 is similar to T isoform 3 except for two aa located outside the DNA-binding domain. According to the length of the proteins, isoform 1 and isoform 3 are classified as the T-long isoform, and isoform 2 is classified as the T-short isoform.15 We previously showed the different expression patterns of T isoforms among chordomas and notochord remnants (age of 16–26 weeks).15 The T-long/T-short ratio was different between chordomas and notochord remnants. Additionally, T isoforms were expressed at significantly lower levels in notochord remnants than in chordomas. However, the roles of these two kinds of isoforms in notochord development and the carcinogenesis of chordoma and their prognostic values remain unclear.
In the present study, we aimed to investigate the different roles of T isoforms in determining the prognosis and cellular functions of chordoma. In addition, whole-transcriptome sequencing was performed to explore the downstream genetic regulatory network after the knockdown of specific T isoforms.
Materials and Methods
This study was conducted in accordance with the Declaration of Helsinki, and the protocol was approved by the Institution Review Board of the Beijing Tiantan Hospital affiliated with Capital Medical University. Signed informed consent forms were acquired from all patients or their guardians before surgery.
Analysis of T Isoform Expression in Human Chordoma Samples
The expression of T isoform mRNAs was analyzed in 57 frozen skull base chordoma samples collected between 2008 and 2015. Tumor samples were stored in liquid nitrogen immediately after resection. TRIzol (Invitrogen) was used to extract RNA from those samples. Reverse transcription was performed with the PrimeScript RT Reagent Kit (Takara, Dalian, China) according to the manufacturer’s instructions. The relative mRNA level was determined in triplicate using real-time quantitative PCR (qPCR) with SYBR green quantitation and Takara instrumentation (TaKaRa Bio, Japan). The primer sequences were the same as those previously described.15 The mean value of the threshold cycle (Ct) was calculated, and 2−ΔCt (ΔCt=Cttarget–CtGAPDH) was used to calculate the expression of the target gene for subsequent statistical analysis.16,17
Clinical information, tumor characteristics and follow-up information were carefully collected. Statistical analyses were performed using SPSS software version 23.0 (IBM, Armonk, USA). The significance level was a two-sided P value ≤ 0.05.
Cell Line and Cell Culture
The U-CH1 cell line was provided by The Chordoma Foundation and certificated by the American Type Culture Collection. Cells were cultured in IMDM:RPMI 1640 (4:1) medium (Invitrogen) supplemented with 10% FBS (Invitrogen), penicillin and streptomycin (100 mg/mL; Invitrogen). Cells were maintained in a humidified incubator containing 5% CO2 and 95% air atmosphere at 37°C.
Knockdown of T Isoforms
Specific knockdown of T isoforms was performed by transfecting cells with small interfering RNAs (siRNAs). The human nonspecific siRNA oligonucleotides (sense: 5ʹ- GCGACGAUCUGCCUAAGAUdTdT-3ʹ, antisense: 5ʹ- AUCUUAGGCAGAUCGUCGCdTdT-3ʹ; GenePharm) were used as a negative control (NC). A total of 4×10⁵ chordoma cells were seeded in each well of 6-well plates and incubated with complete growth medium without antibiotics. Cells were transfected with 37.5 nmol/L synthetic siRNAs targeting human T isoforms (T-long isoform siRNA, the target sequence: GAACAATTCTCCAACCTAT, sense:
5ʹ- GAACAAUUCUCCAACCUAUdTdT-3ʹ, antisense: 5ʹ- AUAGGUUGGAGAAUUGUUCdTdT-3ʹ; T-short isoform siRNA, the target sequence: CTCCCAATCCTATTCTGAC, sense: 5ʹ-CUCCCAAUCCUAUUCUGACdTdT-3ʹ, antisense: 5ʹ- GUCAGAAUAGGAUUGGGAGdTdT-3ʹ; GenePharm) or NC siRNA (37.5 nmol/L) using the Lipofectamine RNAiMax Reagent (Invitrogen) according to the manufacturer’s instructions.
Flow Cytometry Assays of Cell Apoptosis, Proliferation and the Cell Cycle
Cancer is characterized by uncontrolled proliferation resulting from aberrant activity of various cell cycle proteins.18 Deregulated proliferation and inhibition of apoptosis lie at the heart of all tumor genesis and progression, they present two obvious targets for therapeutic intervention in all cancers.19 So we conducted assays of cell apoptosis, proliferation and the cell cycle. Cells were exposed to siRNAs targeting the T isoforms or the NC siRNA for 48 hrs and harvested according to the manufacturer’s protocols. For apoptosis, cells were washed twice with cold PBS and then resuspended in 1 mL of Binding Buffer (BD Biosciences) at a density of 1×10⁶ cells/mL. After 100 µL of the solution (1×10⁵ cells) was transferred to a 5-mL culture tube, 5 μL of phycoerythrin (PE) Annexin V (BD Biosciences) was added. Then, 5 μL of 7-amino-actinomycin (7-AAD, BD Biosciences) was added, and the cells were vortexed and subsequently incubated for 15 mins at room temperature in the dark. Four hundred microliters of Binding Buffer was added to each tube, and the cells were analyzed using flow cytometry (BD AriaII, BD Biosciences). For proliferation assays, 10 µM BrdU was added 4 hrs before harvest, and the following procedures were performed according to the instructions of the APC BrdU Flow Kit (BD Biosciences). Briefly, cells were resuspended in 100 µL of BD Cytofix/Cytoperm Buffer and incubated for 15 mins at room temperature before 1 mL of 1X BD Perm/Wash Buffer was added, and cells were centrifuged for 5 mins at 200 g for washing. Then, the cells were resuspended in 100 µL of BD Cytoperm Permeabilization Buffer Plus and incubated for 10 mins on ice before 1 mL of 1X BD Perm/Wash Buffer was added again. Next, cells were resuspended in 100 µL of BD Cytofix/Cytoperm Buffer and incubated for 5 mins at room temperature before being washed again as described above. Cells in each tube were resuspended in 100 µL of diluted DNase (diluted to 300 µg/mL in DPBS) and incubated for 1 hr at 37°C before being washed as described above. Then, the cells were resuspended in 50 µL of BD Perm/Wash Buffer containing 1 µL of a fluorescently labelled anti-BrdU antibody and incubated for 20 mins at room temperature before being washed again as described above. The cells were resuspended in 20 µL of the 7-AAD solution. Four hundred microliters of Binding Buffer was added to each tube, and the cells were analyzed using flow cytometry. Data were analyzed using FlowJo V.10 software (BD Biosciences). The percentage of early apoptotic cells and the BrdU labelling index were respectively calculated as cell apoptosis rate and proliferation rate for further analysis. The distribution of cells in G0/G1 phase, S phase and G2/M phase were compared among different groups. The flow cytometry assays described above were biologically repeated three times.
Whole-Transcriptome Sequencing and Transcriptome Assembly
To find the potential mechanisms of the function impact of different isoforms of T, whole-transcriptome sequencing was performed. First, 5×10⁵ cells were seeded into 6-well plates and transfected with siRNAs targeting specific T isoforms or the NC siRNA for 48 hrs. RNA purity was assessed using the K5500® spectrophotometer (Kaiao, Beijing, China). RNA integrity and concentrations were measured using the RNA Nano 6000 Assay Kit and the Bioanalyzer 2100 system (Agilent Technologies, CA, USA). Before sequencing, qPCR was performed to verify the knockdown efficacy of siRNAs targeting specific T isoforms. Three biological replicates were conducted, and 9 samples were finally analyzed.
Two different libraries were prepared for sequencing. Library preparation for lncRNA sequencing: Three micrograms of RNA from each sample was used as the initial material to prepare the RNA samples. Ribosomal RNA was removed using Epicentre Ribo-Zero™ Gold Kits (Epicentre, Madison, WI, USA). Subsequently, the sequencing libraries were generated with varied index labels using the NEBNext® Ultra™ Directional RNA Library Prep Kit for Illumina (NEB, Ipswich, MA, USA) according to the manufacturer’s instructions. A detailed description of the procedures used for library construction is provided below. First, the ribosomal RNA was removed using kits, and then the RNA was fragmented, and short RNA strands were prepared using the NEB Next First Strand Synthesis Reaction Buffer at high temperatures. Subsequently, first-strand cDNAs were synthesized using random hexamer primers and RNA fragments as the template. Second-strand cDNA synthesis was subsequently performed using buffer, dNTPs, DNA polymerase I and RNase H. The library fragments were purified with QiaQuick PCR kits and eluted with EB buffer; then, terminal repair and the addition of the poly(A) tail and adapters were performed. Library fragments were purified, and the UNG enzyme was used to digest the second strand of cDNA templates to preferentially select 300 bp cDNA fragments. PCR was performed, products were purified, and the library was completed. The RNA concentration of the library was measured using a Qubit® RNA Assay Kit with a Qubit® 2.0 instrument to preliminarily quantify the samples, which were then diluted to 1 ng/μL. The insert size was measured using the Agilent Bio Analyzer 2100 system (Agilent Technologies), and the qualified insert size was accurately quantitated using a TaqMan fluorescence probe and the AB Step One Plus Real-Time PCR system (valid library concentration>10 nM). The index-coded samples were clustered with a cBot cluster generation system using the TruSeq PE Cluster Kit v4-cBot-HS (Illumina, San Diego, CA, USA) according to the manufacturer’s instructions. After cluster generation, the libraries were sequenced on the Illumina platform, and 150 bp paired-end reads were generated.
Library preparation for small RNA sequencing: Total RNA was separated on 15% agarose gels to extract the small RNA (18–30 nt). After precipitation with ethanol and centrifugal enrichment of small RNA samples, the library was prepared according to the methods described in the Small RNA Sample Preparation Kit (Illumina, RS-200-0048). First, the 3ʹ adaptor was attached to the separated small RNA. The 5ʹ adaptor was then attached to the separated small RNA, followed by RT-PCR and the recycling of strips of 145–160 bp (22–30 nt RNA). The RNA concentration of the library was measured using a Qubit® RNA Assay Kit with a Qubit 2.0 instrument to preliminarily quantify the samples, which were then diluted to 1 ng/μL. The insert size was assessed using the Agilent Bioanalyzer 2100 system (Agilent Technologies), and after the insert size was confirmed to be consistent with our expectations, the qualified insert size was accurately quantitated using a TaqMan fluorescence probe and the AB Step One Plus Real-Time PCR system (valid library concentration>2 nM). The qualified libraries were sequenced on the Illumina platform, and 50 bp single-end reads were generated.
Raw data (lncRNA sequencing data) were processed with Perl scripts to ensure the quality of data used in subsequent analyses. The following filter criteria were employed: filter out adaptor-polluted reads, filter out low-quality reads, and filter out reads with greater than 5% N bases. For paired-end sequencing data, reads from two ends were filtered out if any read of the paired-end reads should be filtered out according to the aforementioned criteria. Clean data were obtained after filtering, and statistical analyses were performed to assess the quantity and quality, including Q30 statistics, data quantity statistics, base content statistics, etc. The reference genomes and the annotation file were downloaded from the ENSEMBL database (Homo_sapiens.GRCh38.91.chr). Clean data were mapped to the reference genome using HISAT2.
For miRNA sequencing, raw data were processed with Perl scripts. The filtering criteria were to remove the reads without the 3ʹ adapter, remove the reads without the insert fragment, remove the reads with an excess A/T content, remove the reads with a length out of range, and remove the low-quality reads. Bowtie1 was used to build the reference genome index and then map the clean reads to the genome.
The accession number of the source data is CRA001667 (https://bigd.big.ac.cn/gsa).
Analysis of Differentially Expressed (DE) Genes
Read counts for each gene (mRNA and lncRNA) in each sample were determined using HTSeq. The miRNAs were identified using miRDeep2. R 3.5.1 software, and R packages (GDCRNATools,20 edgeR,21 ggplot2, clusterProfiler,22 pathview23) were used for further bioinformatic analyses. Genes with q≤0.05 and |log2FC|≥1.2 were identified as DE genes.
Gene Enrichment Analysis
A gene set enrichment analysis (GSEA)24 was performed to compare differences in hallmark gene sets after the knockdown of specific T isoforms. Additionally, GO and KEGG analyses of signaling pathways were performed to explore the functions of the DE protein-coding RNAs (pcRNAs). Gene sets or pathways with q<0.05 were considered significantly enriched.
Competing Endogenous RNA (ceRNA) Regulatory Network
We examined whether these DE genes were present in a ceRNA regulatory network mediated by lncRNAs and microRNAs (miRNAs) by using GDCRNATools.20 StarBase25 was used to identify the miRNA targets of DE lncRNAs and DE pcRNAs. The ceRNA network was visualized using Cytoscape.26
Results
Different Roles of T Isoforms in Predicting Tumor Recurrence
In this study, 29 women and 28 men were included. The mean volume of the tumors was 28.42 cm3. Gross total resection was achieved in 5 patients, subtotal resection was achieved in 25 patients, and partial resection was achieved in 27 patients. The pathological grades of the tumors were conventional subtype in 35 patients and chondroid in 22 patients. Among the 57 tumors, 16 were recurrent lesions, and 41 were primary tumors. In addition, 5 of 16 recurrent patients and 3 of 41 primary patients had received radiotherapy before the current operation. After the operation, 11 of 57 patients received radiotherapy. The mean follow-up period was 27.61 months. Among all patients included in this study, 38 suffered from tumor recurrence, and 9 died. The average preoperative Karnofsky Performance Status Scale (KPS), postoperative KPS and follow-up KPS were 76.49, 75.61 and 67.89, respectively. Detailed clinical characteristics are shown in Tables 1 and 2.
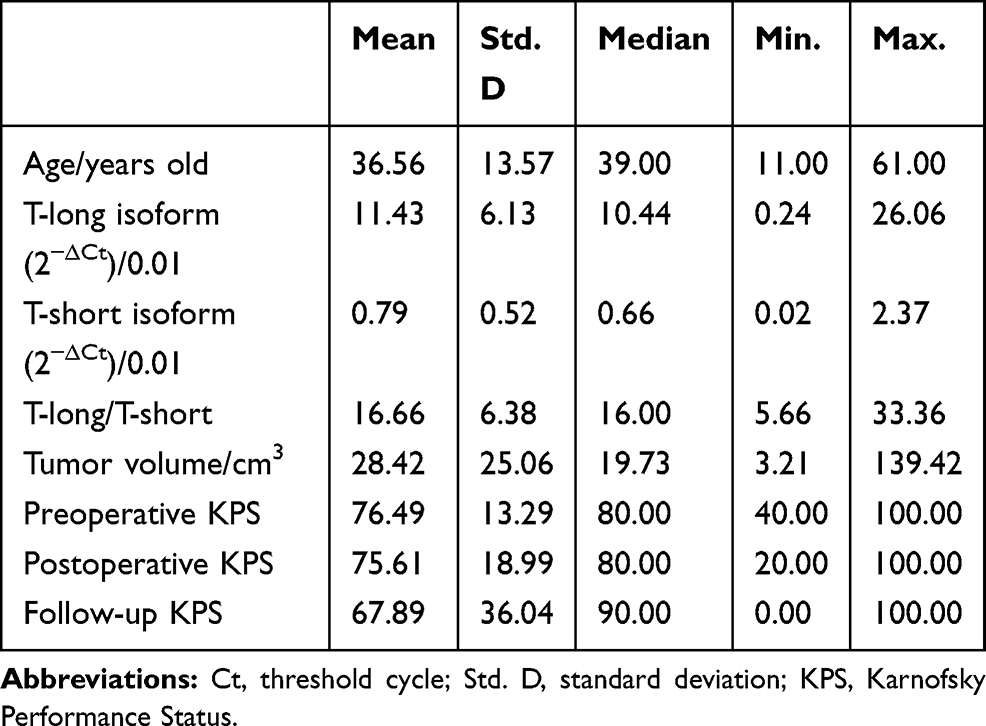 |
Table 1 Continuous Variables for Patients with Skull Base Chordomas |
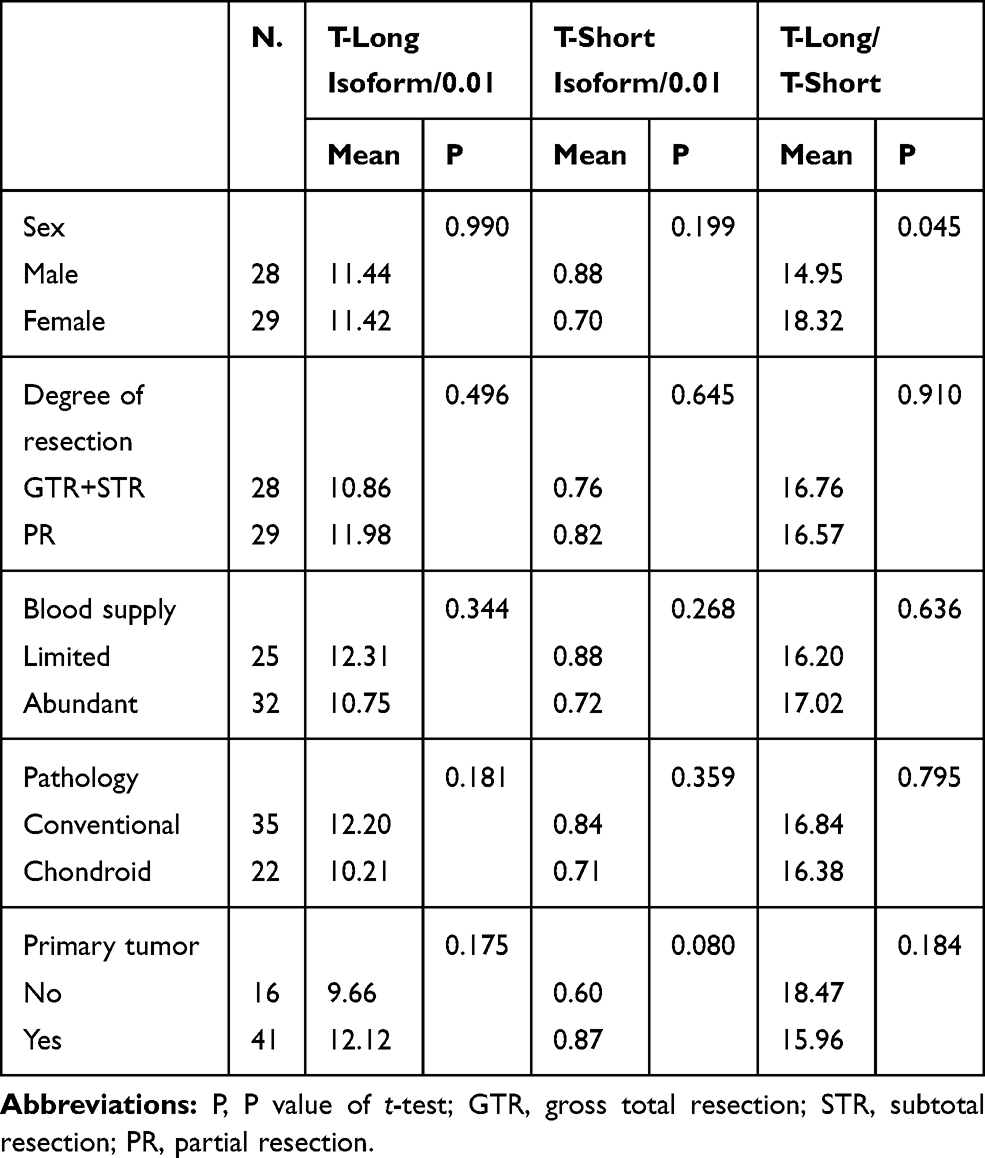 |
Table 2 The Relationships Between the Expression of T Isoforms and Some Clinical Features |
The average expression level of the T-long isoform was 11.43x10⁻². As shown in Table 2, there was no significant difference in T-long isoform expression among patients based on sex, pathological subtypes, degrees of resection and recurrent tumors. The average expression level of the T-short isoform was 0.79x10⁻². The mean T-short isoform expression level in primary tumors was 0.87, which tended to be higher than that of recurrent tumors with a mean value of 0.60. However, the difference was not statistically significant (t-test, P=0.080). In addition, the mean T-long/T-short ratio was 16.66. The ratio was significantly higher in female patients than in males (P=0.045). Details are shown in Tables 1 and 2.
Then, we included tumor volume, degree of resection, pathological subtype and recurrent tumors, all of which were prognostic factors mentioned in various articles, along with T isoforms expression levels in a Cox proportional hazards regression analysis regarding tumor recurrence. The results are shown in Table 3. The T-long isoform was a significant risk factor for tumor recurrence [hazard ratio (HR), 1.09; 95% confidence interval (CI), 1.02–1.18; P=0.018], while the T-short isoform was a significant protective factor (HR, 0.24; 95% CI, 0.08–0.73; P=0.012). As T isoforms exhibited different prognostic values, we calculated another variable, the T-long/T-short ratio. When all variables were included in the Cox analysis, the T-long/T-short ratio (HR, 1.09; 95% CI, 1.03–1.14; P=0.001) and recurrent tumor (HR, 3.69; 95% CI, 1.69–8.06; P=0.001) were independent risk factors for tumor recurrence.
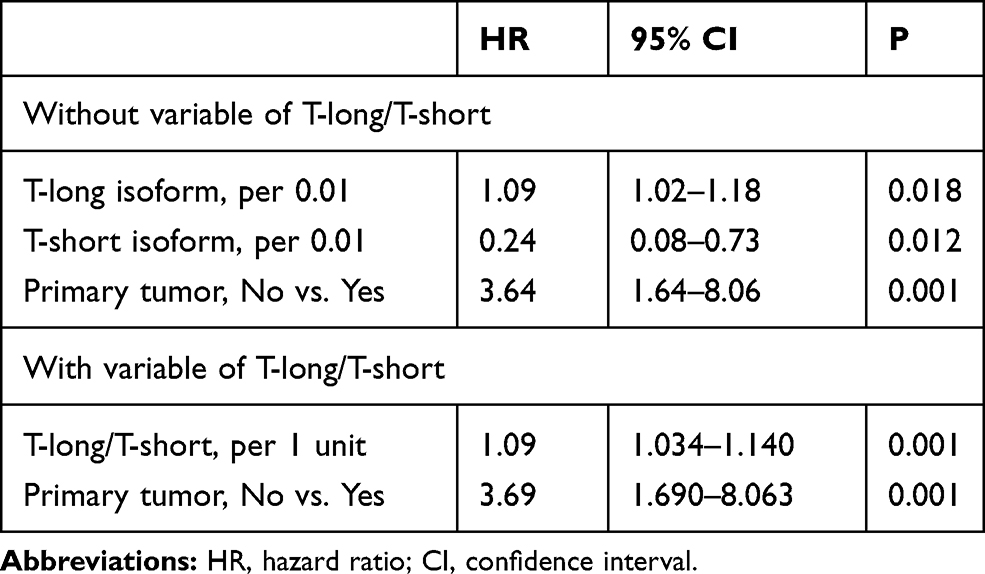 |
Table 3 The Multivariate Cox Analysis of Tumor Recurrence |
Specificity and Efficacy of Knockdown of Specific T Isoforms
To investigate the roles of T isoforms in cell function, we conducted T isoform knockdown experiments in the chordoma cell line U-CH1. After incubation with siRNAs targeting specific T isoforms or the NC siRNA for 48 hrs, the knockdown efficacy and specificity were confirmed using qPCR. As shown in Figure 1A, the T-long isoform siRNA was designed to bind mainly to exon 7 of the T-long isoform mRNA, while this sequence is missing in the T-short isoform mRNA. The T-short isoform siRNA was designed to bind the junction of exon 6 and exon 8 of the T-short isoform mRNA, which was a continuous sequence in the T-short isoform mRNA but separated by a long sequence (exon 7) in the T-long isoform mRNA. As shown in Figure 1B, the knockdown efficacy of the T-long isoform siRNA was as high as 80.93%, and the knockdown efficacy of the T-short isoform siRNA was 78.39%. Theoretically, there was no doubt about the specificity of the T-long isoform siRNA, as no effective sequence of it could be bound to the T-short isoform. In addition, the specificity of the T-short isoform siRNA needed to be validated, as the whole sequence of the T-short isoform could be found in the T-long isoform. Practically, the specificity of the T-short isoform siRNA was well verified, as less than 1% of the T-long isoform was knocked down. However, after T-long isoform siRNA interference, the T-short isoform was also downregulated by approximately 34%. As the T-short isoform was generated by alternative splicing, the siRNA targeting the T-long isoform might also target the precursors of the T-short isoform and contribute to the reduction of the latter. Nevertheless, the mechanism of precise control of alternative splicing remains unclear. As the expression level of the T-long isoform was much more than 4 times that of the T-short isoform and the T-long isoform siRNA could make as high as 80.93% knockdown of the T-long isoform and only 34.18% knockdown of the T-short isoform, the effect of T-long isoform siRNA interference was still regarded as the influence of T-long isoform knockdown (LongTKD).
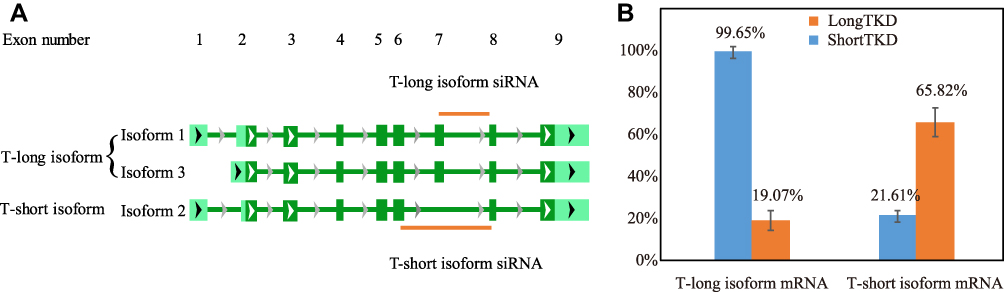 |
Figure 1 Targets, knockdown efficacy and specificity of siRNAs targeting specific T isoforms. (A) The T-long isoform siRNA was designed to mainly bind to exon 7 of the T-long isoform mRNA. The T-short isoform siRNA was designed to bind the junction of exon 6 and exon 8 in the T-short isoform mRNA, which was a continuous sequence in the T-short isoform mRNA. (B) The qPCR assay confirmed the knockdown efficacy and specificity of siRNAs targeting specific T isoforms. LongTKD: T-long isoform knockdown; ShortTKD: T-short isoform knockdown. |
Different Roles of T Isoforms in Cell Apoptosis and Proliferation
After T-short isoform knockdown (ShortTKD), the percentage of early apoptotic cells increased to 4.20%, a value that was slightly higher than the NC (3.27%), but the difference was not significant (P=0.067). After LongTKD, the BrdU labeling index decreased to 4.35%, a value that was significantly lower than the NC (13.20%, P<0.001). The detailed results are presented in Figure 2A–H.
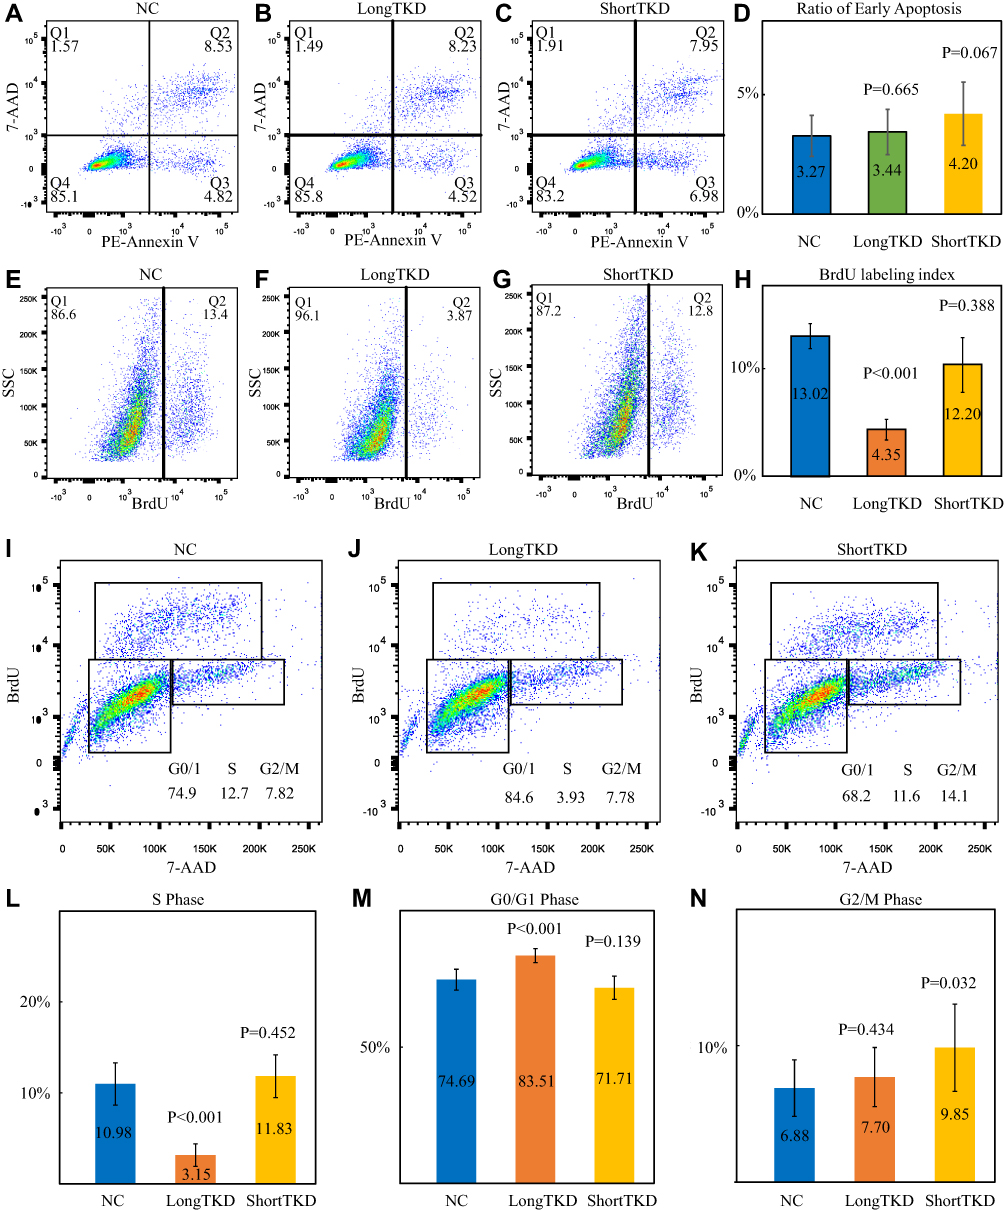 |
Figure 2 Cell apoptosis, proliferation and cell cycle changes after the knockdown of specific T isoforms. (A–D) Early apoptotic cells labelled with PE-Annexin V but not 7-AAD. The percentage of early apoptotic cells (Q3) was slightly increased after T-short isoform knockdown (ShortTKD) compared with the negative control (NC) (P=0.067). (E–H) Proliferating cells were labelled with BrdU. Proliferation (BrdU labeling index) was significantly inhibited after T-long isoform knockdown (LongTKD). (I–N) Analysis of the cell cycle after labeling with BrdU and 7-AAD. A significantly greater percentage of cells in G0/G1 phase was observed after LongTKD than in the NC. A significantly lower percentage of cells in S phase was observed after LongTKD. A significantly greater percentage of cells in G2/M phase was observed after ShortTKD. |
Changes in the Cell Cycle After T Isoform Knockdown
The cell cycle distribution of NC was 74.69% in G0/G1 phase, 10.98% in S phase, and 6.88% in G2/M phase. After LongTKD, the percentage of cells in G0/G1 phase significantly increased to 83.51% (P<0.001), and the percentage of cells in S phase significantly decreased to 3.15% (P<0.001). After ShortTKD, the percentage of cells in G2/M phase was 9.85% (P=0.032). The detailed results are presented in Figure 2I–N.
Analysis of DE Genes
Venn plots of DE genes and detailed information are shown in Figure 3 and Table S1. One hundred thirty-nine DE pcRNAs were commonly downregulated, 137 DE pcRNAs were commonly upregulated, and 10 common DE pcRNAs (HUNK, CX3CR1, SLC4A11, EPHB1, HVCN1, GHR, TRIL, UGP2, DPYSL2, and CAMK2B) were upregulated in the LongTKD group compared with the NC group but downregulated in the ShortTKD group compared with the NC group. Additionally, SNHG16 was a commonly upregulated lncRNA, whereas AL590004.4 and TMPO-AS1 were commonly downregulated lncRNAs. Moreover, miR-137-3p was the only commonly downregulated miRNA.
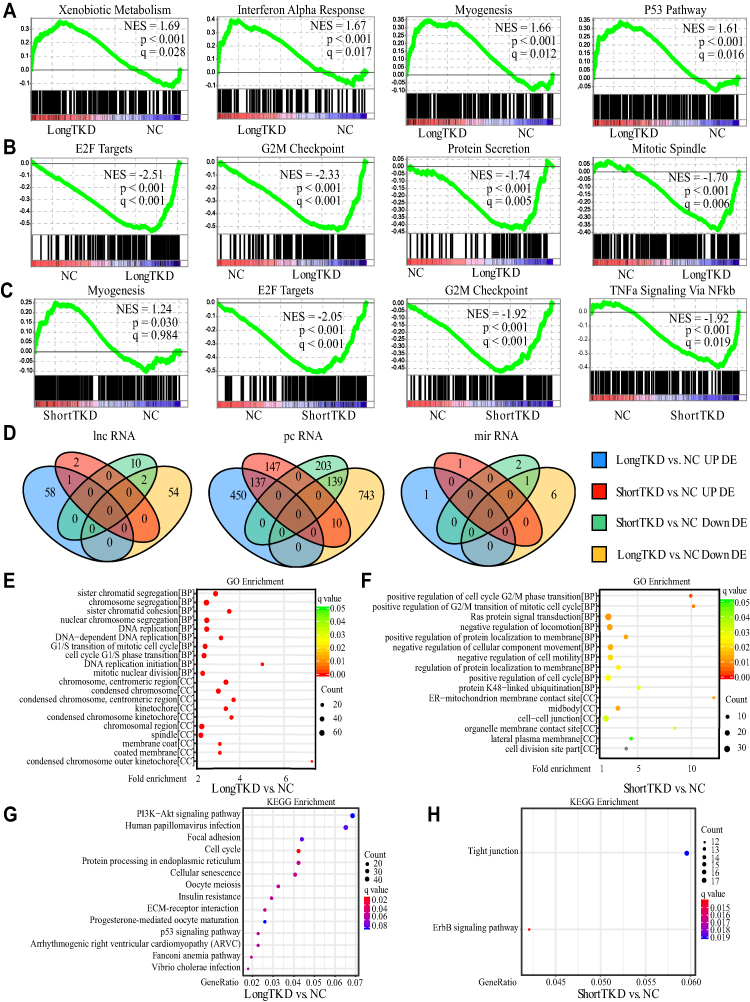 |
Figure 3 Gene set enrichment analysis (GSEA) analysis, differentially expressed (DE) genes and enrichment analysis. (A, B) GSEA of hallmark gene sets after T-long isoform knockdown (LongTKD). Interferon alpha response, xenobiotic metabolism, myogenesis and P53 pathway gene sets were significantly enriched upregulated gene sets. Additionally, E2F targets, G2/M checkpoint, protein secretion and mitotic spindle gene sets were the top four enriched downregulated gene sets. (C) GSEA of hallmark gene sets after T-short isoform knockdown (ShortTKD). The myogenesis gene set was the top enriched upregulated gene set. E2F targets, G2/M checkpoint and TNFa signaling via NF-kB gene sets were the top three significantly enriched downregulated gene sets. (D) Venn plots of DE genes. In the comparison between LongTKD and NC, 1479 DE protein-coding RNAs (pcRNAs, 892 downregulated), 8 DE microRNAs (miRNAs, 7 downregulated) and 115 DE long noncoding RNAs (lncRNAs, 56 downregulated) were identified. In the comparison between ShortTKD and NC, 636 DE pcRNAs (342 downregulated), 4 DE miRNAs (3 downregulated) and 15 DE lncRNAs (12 downregulated) were identified. (E). GO enrichment analysis of DE genes after LongTKD. G1/S phase transition, DNA replication, chromosome and sister chromatid segregation were the main enriched terms in the biological process (BP) category, while condensed chromosome, kinetochore, and membrane coat were the main enriched terms in the cellular component (CC) category. (F) GO enrichment analysis of DE genes after ShortTKD. Cell cycle G2/M phase transition, Ras protein signal transduction, regulation of locomotion, protein K48-linked ubiquitination and other terms significantly enriched in the BP category, while midbody, cell-cell junction, membrane contact site were significantly enriched CC terms. However, no significantly enriched terms were identified in the MF category. (G) KEGG enrichment analysis of DE genes after LongTKD. Cell cycle, the P53 signaling pathway and PI3K-Akt signaling pathway (q = 0.083) were enriched. (H) KEGG enrichment analysis of DE genes after ShortTKD. The ErbB signaling pathway and tight junction were enriched. |
Enrichment Analysis
The results of the GSEA are shown in Figure 3A–C. E2F targets and the G2/M checkpoint were the top two enriched downregulated gene sets after LongTKD or ShortTKD. Additionally, the P53 pathway gene set was significantly upregulated after LongTKD.
The results of the GO analysis are shown in Figure 3E and F and Table S1. After LongTKD, the G1/S phase transition, DNA replication, chromosome or sister chromatid segregation were the main enriched terms in the biological process (BP) category. In terms of the G1/S phase transition, 40 genes were downregulated, and 8 genes were upregulated. After ShortTKD, the cell cycle G2/M phase transition was a significantly enriched BP term. In this term, DTL, CDC25A, CCND1, RAD51C, and CDC7 were downregulated, while BRD4, SMARCD3, and RAB11A were upregulated.
The results of the KEGG enrichment analysis are shown in Figure 3G and H and Table S1. After LongTKD, the P53 signaling pathway and PI3K-Akt signaling pathway were enriched. After ShortTKD, the ErbB signaling pathway was enriched.
As many cell cycle-related gene sets and pathways were enriched, a KEGG analysis of the cell cycle pathway was further conducted using clusterProfiler and pathview. The DE genes in the cell cycle pathway were very different between groups in which the two isoforms were specifically knocked down. CDKN1A and GADD45B were upregulated, and CDK2 and SKP2 were downregulated after LongTKD, while the expression of these genes was not altered after ShortTKD. On the other hand, YWHAH was downregulated after LongTKD, while YWHAZ was upregulated after ShortTKD. Additionally, E2F1 and E2F5 were downregulated after ShortTKD, while E2F7 and E2F5 were downregulated after LongTKD.
ceRNA Regulatory Network
The ceRNA regulatory network was well established after LongTKD, as shown in Figure 4. The lncRNA H19 participated in 12 interactions with miRNAs, while KCNQ1OT1 interacted with 18 miRNAs. Additionally, 19 pcRNAs were downregulated, and 45 pcRNAs were upregulated. The pcRNA NFIB interacted with 11 miRNAs, while CALU interacted with 10 miRNAs. Moreover, miR-29a-3p, miR-29b-3p and miR-29c-3p participated in interactions with more than 30 pcRNAs or lncRNAs. The ceRNA regulatory network established after T isoform knockdown was only a point-to-point connection: SNHG16 to miR-485-5p to CHD3.
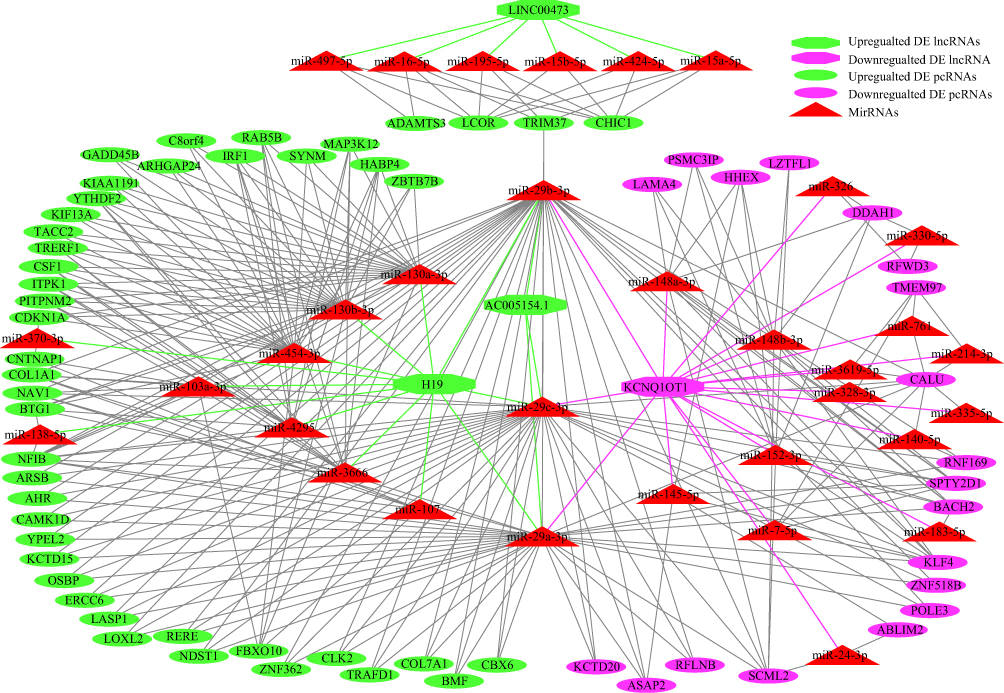 |
Figure 4 ceRNA regulatory network after T-long isoform knockdown. The lncRNA (long noncoding RNA) H19 interacted with 12 miRNAs (microRNAs), while KCNQ1OT1 interacted with 18 miRNAs. Additionally, 19 pcRNAs (protein-coding RNAs) were downregulated and 45 pcRNAs were upregulated. The pcRNA NFIB interacted with 11 miRNAs, while CALU interacted with 10 miRNAs. Moreover, miR-29a-3p, miR-29b-3p and miR-29c-3p interacted with more than 30 pcRNAs or lncRNAs. Notably, miR-130a-3p, miR-130b-3p and miR-454-3p participated in more than 20 interactions with pcRNAs or lncRNAs. Additionally, miR-3666, miR-4295, miR-148b-3p, miR-152-3p, miR-148a-3p participated in 10 interactions with pcRNAs or lncRNAs. |
Discussion
To the best of our knowledge, this study was the first to investigate the different roles of T isoforms in chordoma.
Prognostic Values of T and T Isoforms
Brachyury regulates mesoderm development in the early mammalian embryo and is not expressed in the majority of normal adult tissue.14,27 Brachyury was recently reported to be expressed in the majority of chordoma samples and various types of human cancers.28–33 While its prognostic value has been revealed in various cancers, the prognostic role of brachyury in chordomas has not been conclusively determined.34 Most studies exploring brachyury status in chordoma have not revealed a prognostic implication.35,36 In contrast, positive expression of the brachyury protein (30 of 37 samples) correlates with a shorter progression-free survival of patients with skull base chordomas.37 Additionally, the expression of brachyury mRNA is correlated with a shorter progression-free survival of patients with skull base chordomas.3 The small sample size, the difference in categorization, the choice of experimental technique, and inter-laboratory and inter-observer variability in immunohistochemistry interpretation may explain the conflicting results. Further studies are required to obtain definitive conclusions regarding the prognostic relevance of brachyury. As brachyury has been detected in virtually all chordoma tumors and cell lines evaluated, study designs investigating the presence or absence of its expression must be abnegated. No studies have investigated the prognostic roles of T isoforms.
In the present study, the expression of T isoforms was evaluated using qPCR, which provided relatively quantitative results and was much more objective than immunohistochemistry experiments. Both T isoforms were included as continuous variables in the last Cox proportional hazards regression model and showed diametrically opposite prognostic roles in determining tumor recurrence. When the T-long/T-short ratio was included in the Cox analysis, the T-long/T-short ratio (HR, 1.09; per 1; P=0.001) and recurrent tumor (HR, 3.69; yes vs. no; P=0.001) were independent risk factors for tumor recurrence. The T-long/T-short ratio, which was calculated using the 2−ΔCt method (ΔCt=CtT-long-CtT-short), could easily be used in clinical practice.
Apoptosis, Proliferation and Cell Cycle Changes and Potential Mechanisms
After LongTKD, the cell cycle was arrested at G0/G1 phase and cell proliferation was significantly inhibited. After ShortTKD, the cell cycle was arrested in G2/M phase and cell apoptosis increased slightly (1% percent, P=0.067).
We performed whole-transcriptome sequencing and bioinformatic analyses to identify the potential mechanisms. E2F targets and G2/M checkpoint gene sets, which are both associated with cell cycle progression, were commonly the top two downregulated hallmark gene sets after LongTKD or ShortTKD.38 This result was validated in a recent study showing the enrichment of these two gene sets after a single-guide RNA targeting T was transduced into another chordoma cell line.39 As a result, the cell cycle was the main target of T isoform knockdown.
Then, a GO analysis revealed the enrichment of the cell cycle G1/S phase transition after LongTKD. Meanwhile, positive regulation of the cell cycle G2/M phase transition was enriched after ShortTKD. These results were consistent with the differences in cell cycle changes after the knockdown of specific T isoforms. Additionally, the detailed pattern of DE genes involved in the cell cycle pathway was very different between groups in which the two isoforms were specifically knocked down. These genes may be the key downstream genes that were regulated by T isoforms.
The expression of CDKN1A (also called P21) is tightly controlled by the tumor suppressor protein P53, and this protein mediates the P53-dependent cell cycle G1 phase arrest by inhibiting CDK activity.40–43 In addition, GADD45 proteins interact with P21, leading to cell cycle arrest at the G1/S transition.44–46 Moreover, the activity of CDK2 is particularly critical during the G1 to S phase transition. At the end of mitosis, cells decide to either start the next cell cycle by immediately increasing CDK2 activity or to enter a transient G0-like state by suppressing CDK2 activity.47 A double-negative feedback regulatory network (CDK2 → SCF/SKP2 →| P21 →| CDK2) between P21 and CDK2 exists.48 In the present study, the P53 signaling pathway was also enriched after LongTKD. In the ceRNA network, CDKN1A and GADD45B shared several common miRNAs with H19, which also functions as a tumor suppressor in several cancer types.49,50 As a result, the upregulation of H19, P21 and GADD45B, downregulation of SKP2 and CDK2, and accompanying changes in the P53 signaling pathway consistently contributed to inducing G0/G1 arrest after LongTKD.
YWHAZ (encoding 14-3-3 ζ) and YWHAH (encoding 14-3-3 η) are both members of the 14-3-3 family, which comprises 7 isoforms in mammals, and have been implicated in a wide variety of cellular processes, including signal transduction, cell cycle regulation and transcriptional regulation.51 The 14-3-3 proteins induce G2/M checkpoint initiation and cell cycle arrest.52 Additionally, the E2F transcription factor family, which comprises at least 8 members, is of paramount importance in coordinating cell cycle progression.53,54 The expression of CDC25A, CCND1, RAD51C and CDC7, which are E2F target genes, was downregulated in this study.53 E2F1, an E2F activator, is a potent cell cycle regulator. Strategies targeting E2F1 promote apoptosis in various cancers.55,56 The upregulation of YWHAZ and downregulation of E2F1 and its target genes might contribute to cell cycle arrest in G2/M phase and apoptosis after ShortTKD.
Potential Mechanisms of Different Roles of T Isoforms in Tumor Recurrence and Tumorigenesis
Cancer is characterized by uncontrolled proliferation resulting from aberrant activity of various cell cycle proteins.18 In the present study, LongTKD caused the cell cycle arrest at G0/G1 phase and the decreased proliferation of chordoma cells, which means low expression of T-long isoform may indicate the decreased proliferation of chordoma entity. Accordingly, high expression of T-long isoform may also indicate the increased proliferation of chordoma entity and then tumor progression could be seen in radiological images of patients. Impressively, in chordoma samples, we also found that the high expression of T-long isoform was a risk factor of local recurrence. Therefore, we could get knowledge about why high expression of T-long isoform was a risk factor of local recurrence after we revealed the downstream mechanism after LongTKD in chordoma cells.
In addition, as compared with normal tissues, tumors are characterized by increased rates of both proliferation and death, with tumor mass increasing if the rate of proliferation exceeds that of death.57 In the present study, ShortTKD caused cell cycle arrest in G2/M phase and the increased cell apoptosis. It seems that T-short isoform should also play a role as risk factor of tumor progression as high expression of T-short isoform should indicate decreased cell apoptosis. However, our study revealed that high expression of T-short isoform was a protective factor of tumor recurrence. In understanding this paradox, it is crucial to view a tumor not simply as a clone of malignant cells, but rather as a complex and highly organized structure in which there exists a multidirectional flow of information between the cancer cells themselves and the multiple other cell types and extracellular matrix components of which the tumor is comprised.57 As revealed in recent studies, in a tumor entity, apoptotic cells are a rich source of signals that profoundly affect their cellular environment, including mitogens that instruct proliferation and regeneration.58 For example, dying tumor cells could use the apoptotic process to generate potent growth-stimulating signals to stimulate the repopulation of tumors undergoing radiotherapy.59 In addition, apoptotic glioblastoma cells paradoxically promote proliferation and therapy resistance of surviving tumor cells by secreting apoptotic extracellular vesicles enriched with various components of spliceosomes.60 As a result, the impressive phenomenon revealed in our present study could be explained easily. ShortTKD caused the increased apoptosis of chordoma cells, which means low expression of T-short isoform may indicate the increased apoptosis of chordoma cells in tumor entity. Apoptotic chordoma cells may also induce more surrounding cells proliferation in tumor entity and then tumor recurrence would emerge. So, low expression of T-short isoform would be a risk factor of local recurrence. Accordingly, high expression of T-short isoform could be a protective factor of local recurrence, which has been revealed in our present study. Therefore, after we revealed the downstream mechanism after T-short isoform knockdown, we could also get knowledge about why high expression of T-short isoform was a protective factor of local recurrence of chordoma.
Brachyury is expressed at high levels during embryonic development, and its expression decreases soon after the establishment of a fetus.9,13 The notochord also shows a similar pattern.15 In fact, the process of downregulation is somewhat similar to the findings observed in our study. LongTKD induced G0/G1 arrest and inhibited proliferation, while ShortTKD induced G2/M arrest and promoted apoptosis. Although the downregulation of gene expression in the embryo is precisely programmed, an error might occur, and a tumor might form. The disturbance of programmed downregulation of brachyury expression may contribute to this process.
In the future, it will be interesting to examine apoptosis-induced proliferation in different human cancers, and to explore dual-agent therapies designed to kill cancer cells while simultaneously blocking mitogens that might induce proliferation.58 Knockdown of brachyury inhibits the growth of chordoma cell lines.61,62 In addition, CDK inhibitors reduce the proliferation of chordoma in a patient-derived xenograft mouse model in which downregulation of brachyury is also involved.39 However, the tumor grew slowly but did not shrink, which is similar to the changes observed after LongTKD. Cells in G2/M phase are more sensitive to chemotherapy and radiotherapy. Intermittent administration of LongTKD and ShortTKD combined with radiotherapy might be an effective method of treating this intractable disease, which is resistant to routine radiotherapy, chemotherapy and even targeted therapy.
Limitation
Although this study is the first to attempt to clarify the different roles and mechanisms of T isoforms in determining the prognosis and cellular functions of chordoma, some limitations must be acknowledged. First, the prognostic analysis of T isoforms was a retrospective investigation with all the associated limitations. Second, although there was no doubt about the specificity of the siRNA targeting the T-long isoform, it practically reduced the T-short isoform mRNA by 34.18%. After the mechanism of precise control of alternative splicing is revealed in the future, a much more precise study design could be conducted in the future.
Conclusion
The T-long isoform was a risk factor and the T-short isoform was a protective factor for chordoma recurrence. In addition, the cell cycle was the main target of T isoforms knockdown, and the changes in the downstream transcriptome may contribute to the different effects of specific T isoform knockdown on the changes in the cell cycle distributions and apoptosis and proliferation of chordoma cells.
Abbreviations
7-AAD, 7-amino-actinomycin; BP, biological process; ceRNA, competing endogenous RNA; Ct, threshold cycle; DE, differentially expressed; GSEA, gene set enrichment analysis; HR, hazard ratio; KPS, Karnofsky Performance Status Scale; lncRNA, long noncoding RNA; LongTKD, T-long isoform knockdown; miRNA, microRNA; NC, negative control; pcRNA, protein-coding RNA; PE, phycoerythrin; qPCR, real-time quantitative PCR; ShortTKD, T-short isoform knockdown; siRNA, small interfering RNA.
Ethics Approval and Informed Consent
The study was conducted in accordance with the Declaration of Helsinki, and the protocol was approved by the Institution Review Board of the Beijing Tiantan Hospital affiliated with Capital Medical University. Signed informed consent forms were acquired from all patients or their guardians before surgery.
Consent for Publication
No details, images, or videos relating to individual participants are included in the manuscript.
Data Sharing Statement
The accession number for the sequencing source data is CRA001667 (https://bigd.big.ac.cn/gsa). The clinical datasets used during the current study are available from the corresponding author on a reasonable request.
Acknowledgments
We are grateful for the help of Haowen Li, Chengya Dong and Junhua Li regarding the instructions of experimental skills and conservation of specimens.
Author Contributions
All authors contributed to data analysis, drafting or revising the article, gave final approval of the version to be published, and agree to be accountable for all aspects of the work.
Funding
This study was funded by the National Natural Science Foundation of China (81472370, Dr. Junting Zhang; 81672506, Dr. Zhen Wu; 81802683, Dr. Kaibing Tian).
Disclosure
The authors declare no conflicts of interest in this work.
References
1. Stacchiotti S, Sommer J; Chordoma Global Consensus G. Building a global consensus approach to chordoma: a position paper from the medical and patient community. Lancet Oncol. 2015;16(2):e71–e83. doi:10.1016/S1470-2045(14)71190-8
2. Mcmaster ML, Goldstein AM, Bromley CM, Ishibe N, Parry DM. Chordoma: incidence and survival patterns in the United States, 1973–1995. Cancer Causes Control. 2001;12(1):1–11. doi:10.1023/A:1008947301735
3. Otani R, Mukasa A, Shin M, et al. Brachyury gene copy number gain and activation of the PI3K/Akt pathway: association with upregulation of oncogenic brachyury expression in skull base chordoma. J Neurosurg. 2018;128(5):1428–1437. doi:10.3171/2016.12.JNS161444
4. Wang L, Wu Z, Tian K, et al. Clinical features and surgical outcomes of patients with skull base chordoma: a retrospective analysis of 238 patients. J Neurosurg. 2017;127(6):1257–1267. doi:10.3171/2016.9.JNS16559
5. Brito da Silva H, Straus D, Barber JK, Rostomily RC, Ferreira M
6. Hao S, Song H, Zhang W, et al. Protein phosphatase 2A inhibition enhances radiation sensitivity and reduces tumor growth in chordoma. Neuro-Oncology. 2018;20(6):799–809. doi:10.1093/neuonc/nox241
7. Meng T, Jin J, Jiang C, et al. Molecular targeted therapy in the treatment of chordoma: a systematic review. Front Oncol. 2019;9:30. doi:10.3389/fonc.2019.00030
8. Salisbury JR. The pathology of the human notochord. J Pathol. 1993;171(4):253–255. doi:10.1002/path.1711710404
9. Babic MS. Development of the notochord in normal and malformed human embryos and fetuses. Int J Dev Biol. 1991;35(3):345–352.
10. Santegoeds RG, Yakkioui Y, Jahanshahi A, et al. Notochord isolation using laser capture microdissection. J Chem Neuroanat. 2017;80:37–43. doi:10.1016/j.jchemneu.2016.12.004
11. Pazzaglia UE, Salisbury JR, Byers PD. Development and involution of the notochord in the human spine. J R Soc Med. 1989;82(7):413–415. doi:10.1177/014107688908200714
12. Goodfellow PN. Developmental genetics: a long story and a short tail. Nature. 1990;343(6259):597–598. doi:10.1038/343597a0
13. Herrmann BG, Labeit S, Poustka A, King TR, Lehrach H. Cloning of the T gene required in mesoderm formation in the mouse. Nature. 1990;343(6259):617–622. doi:10.1038/343617a0
14. Vujovic S, Henderson S, Presneau N, et al. Brachyury, a crucial regulator of notochordal development, is a novel biomarker for chordomas. J Pathol. 2006;209(2):157–165. doi:10.1002/(ISSN)1096-9896
15. Wang K, Hu Q, Wang L, et al. T gene isoform expression pattern is significantly different between chordomas and notochords. Biochem Biophys Res Commun. 2015;467(2):261–267. doi:10.1016/j.bbrc.2015.09.178
16. Schmittgen TD, Livak KJ. Analyzing real-time PCR data by the comparative C(T) method. Nat Protoc. 2008;3(6):1101–1108. doi:10.1038/nprot.2008.73
17. Livak KJ, Schmittgen TD. Analysis of relative gene expression data using real-time quantitative PCR and the 2(-delta delta C(T)) method. Methods. 2001;25(4):402–408. doi:10.1006/meth.2001.1262
18. Otto T, Sicinski P. Cell cycle proteins as promising targets in cancer therapy. Nat Rev Cancer. 2017;17(2):93–115. doi:10.1038/nrc.2016.138
19. Evan GI, Vousden KH. Proliferation, cell cycle and apoptosis in cancer. Nature. 2001;411(6835):342–348. doi:10.1038/35077213
20. Li R, Qu H, Wang S, et al. GDCRNATools: an R/bioconductor package for integrative analysis of lncRNA, miRNA and mRNA data in GDC. Bioinformatics. 2018;34(14):2515–2517. doi:10.1093/bioinformatics/bty124
21. Robinson MD, McCarthy DJ, Smyth GK. edgeR: a bioconductor package for differential expression analysis of digital gene expression data. Bioinformatics. 2010;26(1):139–140. doi:10.1093/bioinformatics/btp616
22. Yu G, Wang LG, Han Y, He QY. clusterProfiler: an R package for comparing biological themes among gene clusters. OMICS. 2012;16(5):284–287. doi:10.1089/omi.2011.0118
23. Luo W, Brouwer C. Pathview: an R/bioconductor package for pathway-based data integration and visualization. Bioinformatics. 2013;29(14):1830–1831. doi:10.1093/bioinformatics/btt285
24. Subramanian A, Tamayo P, Mootha VK, et al. Gene set enrichment analysis: a knowledge-based approach for interpreting genome-wide expression profiles. Proc Natl Acad Sci U S A. 2005;102(43):15545–15550. doi:10.1073/pnas.0506580102
25. Li JH, Liu S, Zhou H, Qu LH, Yang JH. StarBase v2.0: decoding miRNA-ceRNA, miRNA-ncRNA and protein-RNA interaction networks from large-scale CLIP-seq data. Nucleic Acids Res. 2014;42(Database issue):D92–D97. doi:10.1093/nar/gkt1248
26. Shannon P, Markiel A, Ozier O, et al. Cytoscape: a software environment for integrated models of biomolecular interaction networks. Genome Res. 2003;13(11):2498–2504. doi:10.1101/gr.1239303
27. Bernardo AS, Faial T, Gardner L, et al. BRACHYURY and CDX2 mediate BMP-induced differentiation of human and mouse pluripotent stem cells into embryonic and extraembryonic lineages. Cell Stem Cell. 2011;9(2):144–155. doi:10.1016/j.stem.2011.06.015
28. Pinto F, Pertega-Gomes N, Pereira MS, et al. T-box transcription factor brachyury is associated with prostate cancer progression and aggressiveness. Clin Cancer Res. 2014;20(18):4949–4961. doi:10.1158/1078-0432.CCR-14-0421
29. Bettegowda C, Yip S, Lo SL, et al. Spinal column chordoma: prognostic significance of clinical variables and T (brachyury) gene SNP rs2305089 for local recurrence and overall survival. Neuro-Oncology. 2017;19(3):405–413. doi:10.1093/neuonc/now156
30. Miettinen M, Wang Z, Lasota J, Heery C, Schlom J, Palena C. Nuclear brachyury expression is consistent in chordoma, common in germ cell tumors and small cell carcinomas, and rare in other carcinomas and sarcomas: an immunohistochemical study of 5229 cases. Am J Surg Pathol. 2015;39(10):1305–1312. doi:10.1097/PAS.0000000000000462
31. Pinto F, Campanella NC, Abrahao-Machado LF, et al. The embryonic brachyury transcription factor is a novel biomarker of GIST aggressiveness and poor survival. Gastric Cancer. 2016;19(2):651–659. doi:10.1007/s10120-015-0505-0
32. Du R, Wu S, Lv X, Fang H, Wu S, Kang J. Overexpression of brachyury contributes to tumor metastasis by inducing epithelial-mesenchymal transition in hepatocellular carcinoma. J Exp Clin Cancer Res. 2014;33:105. doi:10.1186/s13046-014-0105-6
33. Palena C, Roselli M, Litzinger MT, et al. Overexpression of the EMT driver brachyury in breast carcinomas: association with poor prognosis. J Natl Cancer Inst. 2014;106(5):dju054. doi:10.1093/jnci/dju054
34. Zhong H, Zhou Z, Lv GH, Li J, Zou MX. Letter to the Editor. Brachyury as prognostic biomarker in chordoma. J Neurosurg. 2018;129(1):273–275. doi:10.3171/2017.9.JNS172108
35. Zhang L, Guo S, Schwab JH, et al. Tissue microarray immunohistochemical detection of brachyury is not a prognostic indicator in chordoma. PLoS One. 2013;8(9):e75851. doi:10.1371/journal.pone.0075851
36. Wang K, Tian K, Wang L, et al. Brachyury: a sensitive marker, but not a prognostic factor, for skull base chordomas. Mol Med Rep. 2015;12(3):4298–4304. doi:10.3892/mmr.2015.3976
37. Kitamura Y, Sasaki H, Kimura T, et al. Molecular and clinical risk factors for recurrence of skull base chordomas: gain on chromosome 2p, expression of brachyury, and lack of irradiation negatively correlate with patient prognosis. J Neuropathol Exp Neurol. 2013;72(9):816–823. doi:10.1097/NEN.0b013e3182a065d0
38. Kent LN, Leone G. The broken cycle: E2F dysfunction in cancer. Nat Rev Cancer. 2019;19(6):326–338. doi:10.1038/s41568-019-0143-7
39. Sharifnia T, Wawer MJ, Chen T, et al. Small-molecule targeting of brachyury transcription factor addiction in chordoma. Nat Med. 2019;25(2):292–300. doi:10.1038/s41591-018-0312-3
40. Barr AR, Cooper S, Heldt FS, et al. DNA damage during S-phase mediates the proliferation-quiescence decision in the subsequent G1 via p21 expression. Nat Commun. 2017;8:14728. doi:10.1038/ncomms14728
41. el-Deiry WS, Tokino T, Velculescu VE, et al. WAF1, a potential mediator of p53 tumor suppression. Cell. 1993;75(4):817–825. doi:10.1016/0092-8674(93)90500-P
42. Xiong Y, Hannon GJ, Zhang H, Casso D, Kobayashi R, Beach D. p21 is a universal inhibitor of cyclin kinases. Nature. 1993;366(6456):701–704. doi:10.1038/366701a0
43. Harper JW, Adami GR, Wei N, Keyomarsi K, Elledge SJ. The p21 Cdk-interacting protein Cip1 is a potent inhibitor of G1 cyclin-dependent kinases. Cell. 1993;75(4):805–816. doi:10.1016/0092-8674(93)90499-G
44. Tamura RE, de Vasconcellos JF, Sarkar D, Libermann TA, Fisher PB, Zerbini LF. GADD45 proteins: central players in tumorigenesis. Curr Mol Med. 2012;12(5):634–651. doi:10.2174/156652412800619978
45. Vairapandi M, Balliet AG, Fornace AJ
46. Sajadian SO, Tripura C, Samani FS, et al. Vitamin C enhances epigenetic modifications induced by 5-azacytidine and cell cycle arrest in the hepatocellular carcinoma cell lines HLE and Huh7. Clin Epigenetics. 2016;8:46. doi:10.1186/s13148-016-0213-6
47. Spencer SL, Cappell SD, Tsai FC, Overton KW, Wang CL, Meyer T. The proliferation-quiescence decision is controlled by a bifurcation in CDK2 activity at mitotic exit. Cell. 2013;155(2):369–383. doi:10.1016/j.cell.2013.08.062
48. Overton KW, Spencer SL, Noderer WL, Meyer T, Wang CL. Basal p21 controls population heterogeneity in cycling and quiescent cell cycle states. Proc Natl Acad Sci U S A. 2014;111(41):E4386–E4393. doi:10.1073/pnas.1409797111
49. Hao Y, Crenshaw T, Moulton T, Newcomb E, Tycko B. Tumour-suppressor activity of H19 RNA. Nature. 1993;365(6448):764–767. doi:10.1038/365764a0
50. Zhang A, Shang W, Nie Q, Li T, Li S. Long non-coding RNA H19 suppresses retinoblastoma progression via counteracting miR-17-92 cluster. J Cell Biochem. 2018;119(4):3497–3509. doi:10.1002/jcb.v119.4
51. Dougherty MK, Morrison DK. Unlocking the code of 14-3-3. J Cell Sci. 2004;117(Pt 10):1875–1884. doi:10.1242/jcs.01171
52. Gardino AK, Yaffe MB. 14-3-3 proteins as signaling integration points for cell cycle control and apoptosis. Semin Cell Dev Biol. 2011;22(7):688–695. doi:10.1016/j.semcdb.2011.09.008
53. Yuan R, Vos HR, van Es RM, et al. Chk1 and 14-3-3 proteins inhibit atypical E2Fs to prevent a permanent cell cycle arrest. EMBO J. 2018;37(5):e97877. doi:10.15252/embj.201797877
54. He J, Zhao Y, Zhao E, et al. Cancer-testis specific gene OIP5: a downstream gene of E2F1 that promotes tumorigenesis and metastasis in glioblastoma by stabilizing E2F1 signaling. Neuro-Oncology. 2018;20(9):1173–1184. doi:10.1093/neuonc/noy037
55. Lu HJ, Jin PY, Tang Y, et al. microRNA-136 inhibits proliferation and promotes apoptosis and radiosensitivity of cervical carcinoma through the NF-kappaB pathway by targeting E2F1. Life Sci. 2018;199:167–178. doi:10.1016/j.lfs.2018.02.016
56. Han R, Chen X, Li Y, Zhang S, Li R, Lu L. MicroRNA-34a suppresses aggressiveness of hepatocellular carcinoma by modulating E2F1, E2F3, and caspase-3. Cancer Manag Res. 2019;11:2963–2976. doi:10.2147/CMAR.S202664
57. Ucker DS, Levine JS. Exploitation of apoptotic regulation in cancer. Front Immunol. 2018;9:241. doi:10.3389/fimmu.2018.00241
58. Fuchs Y, Steller H. Live to die another way: modes of programmed cell death and the signals emanating from dying cells. Nat Rev Mol Cell Biol. 2015;16(6):329–344. doi:10.1038/nrm3999
59. Huang Q, Li F, Liu X, et al. Caspase 3-mediated stimulation of tumor cell repopulation during cancer radiotherapy. Nat Med. 2011;17(7):860–866. doi:10.1038/nm.2385
60. Pavlyukov MS, Yu H, Bastola S, et al. Apoptotic cell-derived extracellular vesicles promote malignancy of glioblastoma via intercellular transfer of splicing factors. Cancer Cell. 2018;34(1):119–135.e10. doi:10.1016/j.ccell.2018.05.012
61. Hsu W, Mohyeldin A, Shah SR, et al. Generation of chordoma cell line JHC7 and the identification of brachyury as a novel molecular target. J Neurosurg. 2011;115(4):760–769. doi:10.3171/2011.5.JNS11185
62. Nelson AC, Pillay N, Henderson S, et al. An integrated functional genomics approach identifies the regulatory network directed by brachyury (T) in chordoma. J Pathol. 2012;228(3):274–285. doi:10.1002/path.2012.228.issue-3
 © 2020 The Author(s). This work is published and licensed by Dove Medical Press Limited. The full terms of this license are available at https://www.dovepress.com/terms.php and incorporate the Creative Commons Attribution - Non Commercial (unported, v3.0) License.
By accessing the work you hereby accept the Terms. Non-commercial uses of the work are permitted without any further permission from Dove Medical Press Limited, provided the work is properly attributed. For permission for commercial use of this work, please see paragraphs 4.2 and 5 of our Terms.
© 2020 The Author(s). This work is published and licensed by Dove Medical Press Limited. The full terms of this license are available at https://www.dovepress.com/terms.php and incorporate the Creative Commons Attribution - Non Commercial (unported, v3.0) License.
By accessing the work you hereby accept the Terms. Non-commercial uses of the work are permitted without any further permission from Dove Medical Press Limited, provided the work is properly attributed. For permission for commercial use of this work, please see paragraphs 4.2 and 5 of our Terms.