")
Back to Journals » International Journal of Chronic Obstructive Pulmonary Disease » Volume 17
Identification of Small Airway Epithelium-Related Hub Genes in Chronic Obstructive Pulmonary Disease
Authors Lin L, Lin G, Chen X, Lin H, Lin Q, Zeng Y, Xu Y
Received 22 June 2022
Accepted for publication 11 October 2022
Published 30 November 2022 Volume 2022:17 Pages 3001—3015
DOI https://doi.org/10.2147/COPD.S377026
Checked for plagiarism Yes
Review by Single anonymous peer review
Peer reviewer comments 3
Editor who approved publication: Dr Richard Russell
Lanlan Lin1,2 *, Guofu Lin1,2 *, Xiaohui Chen,1,2 Hai Lin,1,2 Qinhui Lin,1,2 Yiming Zeng,1– 3 Yuan Xu1– 3
1Department of Pulmonary and Critical Care Medicine, The Second Affiliated Hospital of Fujian Medical University, Quanzhou, People’s Republic of China; 2Respiratory Medicine Center of Fujian Province, Quanzhou, People’s Republic of China; 3Clinical Research Center, The Second Affiliated Hospital of Fujian Medical University, Quanzhou, People’s Republic of China
*These authors contributed equally to this work
Correspondence: Yuan Xu; Yiming Zeng, Department of Pulmonary and Critical Care Medicine, Clinical Research Center, The Second Affiliated Hospital of Fujian Medical University; Respiratory Medicine Center of Fujian Province, Quanzhou, People’s Republic of China, Email [email protected]; [email protected]
Background: Pulmonary small airway epithelia are the primary site of cellular and histological alterations in chronic obstructive pulmonary disease (COPD), while the potential therapeutic hub genes of pulmonary epithelia are rarely identified to elucidate profound alterations in the progression of the disease.
Methods: Microarray dataset of GSE11906 containing small airway epithelia from 34 healthy non-smokers and 33 COPD patients was applied to screen differentially expressed genes (DEGs). Weighted gene correlation network analysis (WGCNA) was further used to identify the hub genes related to clinical features. Moreover, single-cell RNA sequencing data from GSE173896 and GSE167295 dataset were applied to explore the expression and distribution of the hub genes. The expression levels of hub genes in epithelial cells stimulated by cigarette smoke extract (CSE) were detected by RT-qPCR.
Results: Ninety-eight DEGs correlated with clinical features of COPD were identified via limma and WGCNA. Eight hub genes (including AKR1C3, ALDH3A1, AKR1C1, CYP1A1, GPX2, CBR3, AKR1B1 and GSR) that might exert an antioxidant role in COPD process were identified. Single-cell transcriptomic analysis indicated that the expressions of AKRAC3, ALDH3A1, GPX2, CBR3 and AKR1B1 were significantly increased in the COPD group when compared with the normal group. Moreover, we found that the expression of ALDH3A1 was the most abundantly expressed in ciliated cells. RT-qPCR results indicated that the majority of candidate novel genes were significantly elevated when the epithelial cells were exposed to CSE.
Conclusion: Through integrating limma, WGCNA, and protein-protein interaction (PPI) analysis, a total of eight candidate hub genes of pulmonary airway epithelia were identified in COPD. Moreover, single-cell transcriptomic analysis indicated that ALDH3A1 was enriched in ciliated cells, which may provide a new insight into the pathogenesis and treatment of COPD.
Keywords: COPD, pulmonary airway epithelium, hub genes, cigarette smoke
Introduction
Chronic obstructive pulmonary disease (COPD) is a chronic inflammatory disease characterized by progressive airflow obstruction, mucus hypersecretion, and chronic airway inflammation,1,2 accounting for the fourth leading cause of death (126,000 deaths per year). Long-term exposure to cigarette smoke may induce an airway epithelium inflammatory response and alveolar wall destruction in COPD.3
Pulmonary small airway epithelia are the primary site of cellular and histological alterations in COPD,4 which are mainly lined by pseudostratified epithelial cells including secretory club cells, ciliated cells and basal cells.5,6 It has been reported that airway epithelial cells exposed to tobacco might induce inflammation, oxidative stress, and protease/antiprotease imbalance.7 Emerging evidences have indicated that inflammation and imbalance of antioxidant defense systems were the major predisposing factors in the pathogenesis of COPD and acted as excellent targets for COPD therapies.8,9 Therefore, essential biomarkers of pulmonary epithelium are urgent to be identified to elucidate profound alterations in the progression of the disease.
Previous studies have reported a correlation between susceptibility to COPD and gene expression.10 High-throughput microarray and in silico analysis may provide gene-expression profiling to identify differentially expressed genes (DEGs) associated with COPD patients.11 Lin et al have ever identified candidate genetic biomarkers in COPD process via in silico analysis.12 Herein, we applied an integrated analysis of GEO dataset containing COPD and control subjects by multiple bioinformatics approaches to investigate the potential biomarkers and molecular mechanisms for COPD.
In the current study, DEGs were preliminarily identified via “limma” package and WGCNA. Moreover, protein-protein interaction (PPI) network and Cytoscape were constructed to identify cluster modules related to COPD. The expressions and distributions of hub genes associated with clinical phenotype of COPD were identified via single-cell analysis and further confirmed in vitro. Our study may further promote the understanding of the potential molecular mechanisms of pulmonary small airway epithelium in COPD.
Materials and Methods
Dataset Preparation
The raw gene expression profile datasets were screened from Gene Expression Omnibus (GEO, http://www.ncbi.nlm.nih.gov/geo). The datasets search was performed using the keywords “airway epithelium or airway epithelia”, “COPD”, “smoking”. The selection criteria were as follows: 1) Pulmonary airway epithelium samples from healthy non-smoker and COPD patients were included; 2) All datasets contained clinical information of healthy and COPD patients, such as age, gender, ethnic, smoking status; 3) Datasets contained at least 30 normal and COPD cases. Based on the above criteria, the GSE11906 and GSE128708 datasets (containing 84 healthy non-smokers and 124 COPD samples) were obtained. The characteristic of the datasets was presented in Table S1. GSE11906 contained small airway epithelium obtained by fiberoptic bronchoscopy of 34 healthy non-smokers and 33 COPD patients. GSE11906 was used to screen DEGs and for WGCNA. GSE128708 was used for external validation of hub genes. In addition, single-cell RNA sequencing data of three COPD samples (GSE167295) and three control donor lungs (GSE173896) were collected to verify the distribution, expression and potential function of hub genes in COPD.
DEGs Screening and Enrichment Analysis
The R package “limma” was used to identify DEGs between healthy non-smoker samples and COPD airway epithelium samples. Genes with an adjusted P value <0.05 and log2 fold-change >2 were considered as being differentially expressed. The volcano plot was generated to visualize the distribution of the identified DEGs. The enrichment analysis of DEGs was executed by the KEGG and on the basis of the Hallmark gene sets collection in MsigDB databases (http://software.broadinstitute.org/gsea/msigdb/).
WGCNA
To identify whether the hub genes were related to the clinical features of healthy subjects and COPD patients, WGCNA of GSE11906 dataset was performed by using R package.13 Firstly, Pearson’s correlation analysis of all DEGs was conducted to construct an adjacency matrix. Subsequently, the adjacency matrix was transformed into a topological overlap matrix (TOM) when the power of β = 7. Genes with similar gene expression profiles were placed in the same module. A cluster dendrogram was created based on the TOM with a minimum cluster size of 30.
PPI Network Construction and Hub Gene Confirmation
After screening for genes associated with the response to GOLD classification based on module connectivity, the genes were uploaded to the Search Tool for the Retrieval of Interacting Genes (STRING) database to study the interactions among DEGs. The interaction data for the above-mentioned genes were downloaded from STRING and analyzed using Cytoscape (version 3.5.1) to construct a PPI network. Furthermore, CytoHubba software was used to identify the hub genes in the PPIs and the analysis was performed using the default parameters.14
scRNA-Seq Data Processing and Analysis
Single-cell analysis was performed to validate the expression and distribution of hub genes between healthy and COPD patients. In GSE167295 and GSE173896 datasets, Seurat R package v4.0 was applied to perform quality control, normalization, integration of samples, batch correction and cell clustering. Combined with the CellMarker database, single R package and relevant literature, cell clusters were annotated.15,16 Analysis of differentially expressed genes and Partition-based graph abstraction (PAGA) were performed using R package and OmniAnalyzer software.
Cigarette Smoke Extract Preparation
Cigarette smoke extract (CSE) was prepared as follows: Two non-filtered cigarettes (containing 0.8 mg of nicotine and 10 mg of tar per cigarette, Shishi, China) were burned with a vacuum pump. Smoke was slowly bubbled through the 20 mL serum-free medium to collect CSE. The media was regarded as the 100% CSE solution. Subsequently, the pH of CSE was adjusted to 7.4 and filtered through a 0.22-μm filter (MilliporeSigma, Burlington, USA). The CSE solutions were stored at -80 °C until use.
Cell Culture
BEAS-2B cell line was purchased from the American Type Culture Collection (ATCC, www.atcc.org). Cells were cultured in DMEM medium containing 10% fetal bovine serum (FBS, Invitrogen, USA) and 1% penicillin-streptomycin (Gibco, CA) at 37 °C in the atmosphere containing 5% CO2. The ethical approval of cell line application is not needed because the cell lines are available commercially.
CCK-8 Assay
CCK-8 assays were applied to assess cell viability (Meilun Biotechnology, Dalian, China). BEAS-2B cells were seeded in 96-well plates at a density of 4.0×10³ cells/well overnight and treated with different concentrations of CSE (0, 2.5%, 5%, 10%, 20%, 40%) for 24h. After incubation, 100µL mixture of CCK-8 and serum-free medium at a volume ratio of 1:10 was added and incubated for additional 1h at 37°C. The optical density was measured at 450 nm using a microplate reader (Thermo Fisher Scientific). Cell inhibition rate (%) = [(Ac−As)/(Ac−Ab)] × 100; As=absorbance of the experimental well, Ab=blank well absorbance and Ac=control well absorbance.
Reverse Transcription‑quantitative PCR (RT‑qPCR)
RNA was extracted using TRIzol® reagent (Invitrogen, Thermo Fisher Scientific, Inc.) according to the manufacturer’s protocol. After quantification and RNA purity were confirmed, the extracted RNA was reverse transcribed into cDNA using Reverse Transcription Kit (Takara). Then, RT-qPCR was conducted on ABI 7300 Real-Time PCR system (Applied Biosystems, Foster City, CA, USA) with a SYBR Green PCR Kit (Thermo Fisher Scientific, Inc.) according to the following primer sequences. The corresponding gene primer sequences were listed in Table 1. The relative gene expression level was measured using the 2−ΔΔCt method.
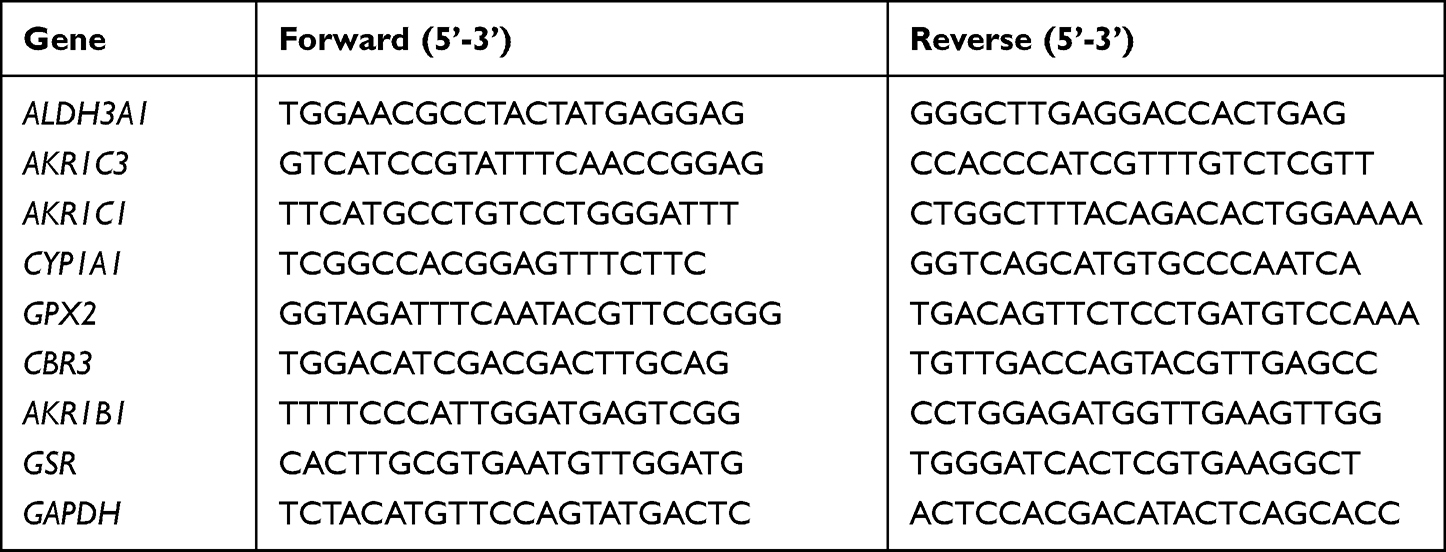 |
Table 1 Primer Sequences Information |
Statistical Analysis
The non-parametric Wilcoxon rank-sum test was used to examine the relationship of continuous variables between the two groups. Statistical difference between control and CSE groups was conducted with Student’s t-test. Pearson’s correlation analysis was performed to identify the correlation between the two variables. All analyses were conducted in R software package (version 4.1.1). Statistical significance was defined when the P value was less than 0.05.
Results
Identification of DEGs in GSE11906
The overall study design was presented in Figure 1. The microarray dataset was obtained from GEO database to analyze the DEGs of COPD epithelium samples with a threshold of P <0.05 and log2 fold change >2. As shown in the volcano plot, 1130 DEGs (1099 up-regulated and 31 down-regulated) were identified in the GSE11906 dataset (Figure 2A). Heatmap of the top 20 upregulated and downregulated DEGs was shown in Figure 2B. GO analysis indicated that the DEGs were mainly enriched in intrinsic/integral component of membrane, endomembrane system, quinone metabolic process, alcohol dehydrogenase (NADP+) activity, polyketide metabolic process (Figure 2C). KEGG analysis demonstrated that the DEGs were mainly enriched in metabolic pathways, cytokine-cytokine receptor interaction, arachidonic acid metabolism, metabolism of xenobiotics by cytochrome P450 (Figure 2D). Therefore, we hypothesize that the epithelial DEGs might participate in the pathogenesis of COPD by regulating the above biological functions and pathways.
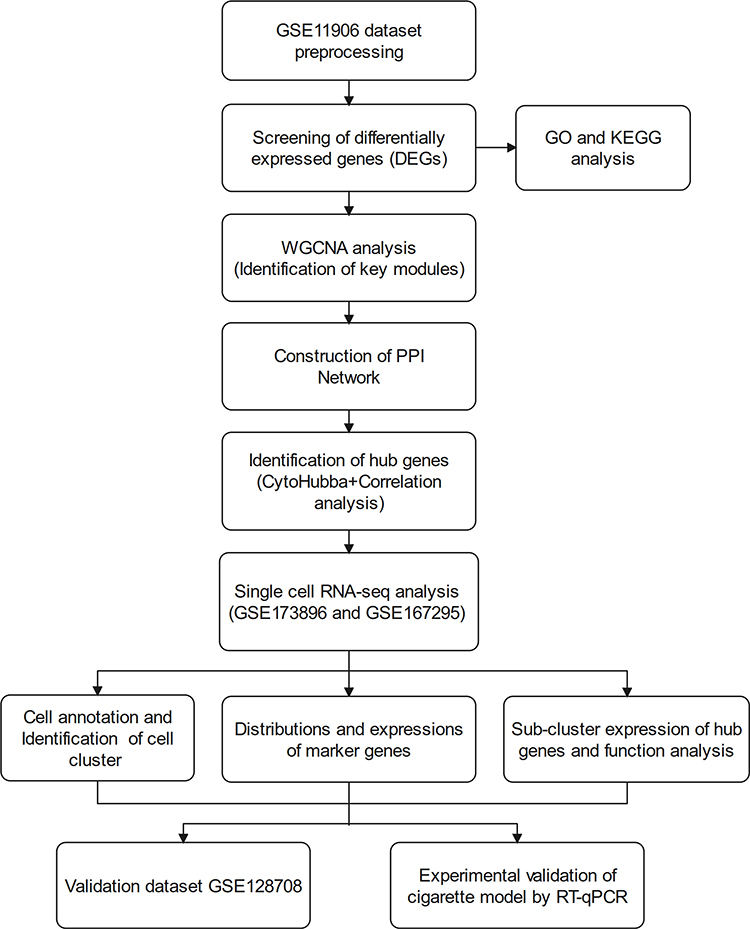 |
Figure 1 Flow chart of the study design. |
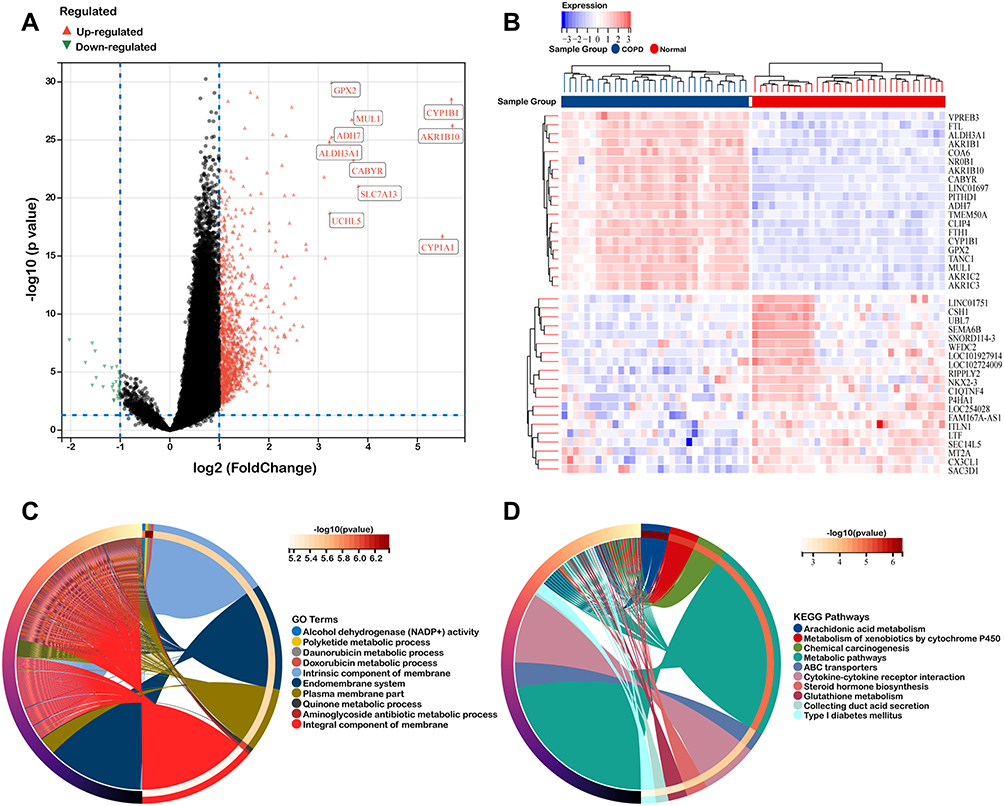 |
Figure 2 Identification of DEGs in GSE11906. (A and B) Volcano plot and heat map of DEGs. (C and D) GO functional annotation and KEGG enrichment analysis of DEGs. |
WGCNA Construction and Gene Module Identification
WGCNA was applied to analyze gene co-expression modules based on the clinical characteristics and gene expression profiles. As shown in Figures 3A, soft threshold power of β = 7 was selected in our study and the corresponding R2 was 0.86, which satisfied scale-free topology of network. After removing outliers, the sample dendrogram and trait heatmap of COPD and healthy non-smoker subjects were drawn (Figure 3B). A total of nine modules were identified via hierarchical clustering analysis of adjacency value difference, and each module was presented using a different color in Figure 3C. As shown in Figure 3D, the midnightblue module was found to have a strong connection with COPD GOLD classification. Figure 3E illustrated the correlation between gene significance of COPD, GOLD and smoking pack-year and module membership in midnightblue module, which can be seen as highly correlated.
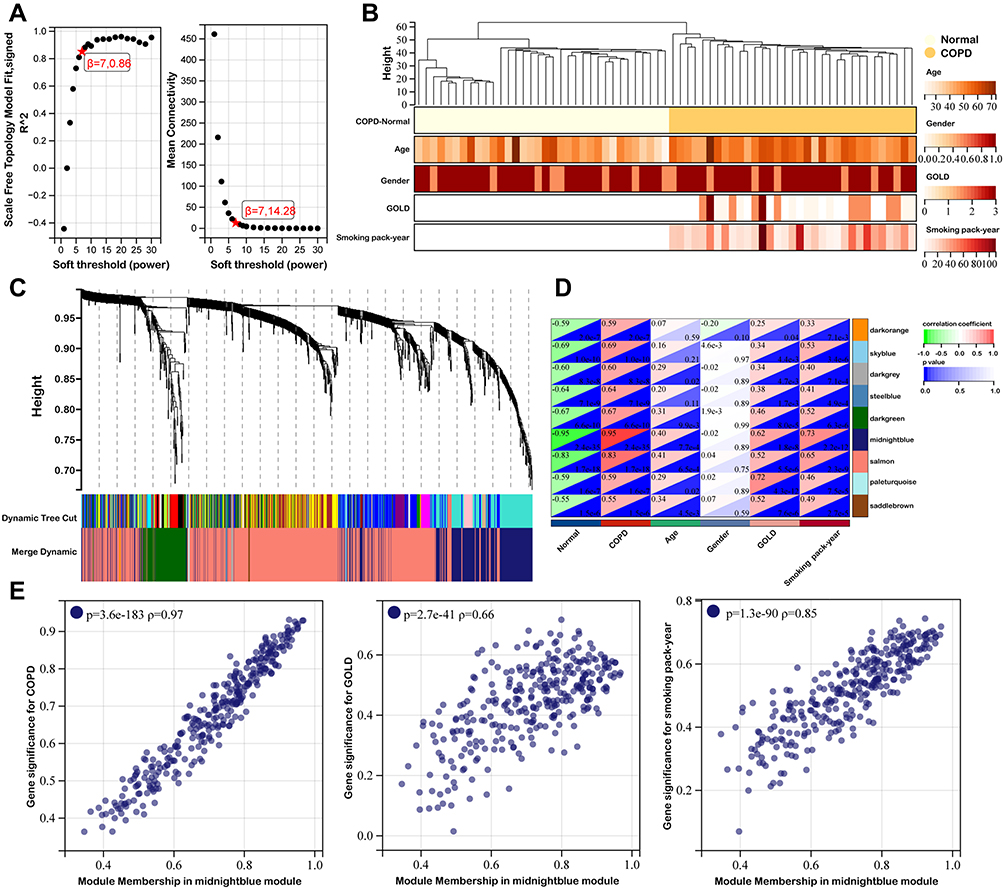 |
Figure 3 WGCNA network and module detection. (A) Scale Independence and mean network connectivity of soft-threshold power. A soft threshold of 7 is the optimal value. (B) Hierarchical clustering tree based on WGCNA. (C) Cluster dendrogram of differential genes represented the co-expression modules identified by WGCNA. (D) Module-trait weighted correlations and corresponding P values for the identified gene module and clinical features. (E) Correlation between gene significance of COPD, GOLD and smoking pack-year and module membership. |
Construction of PPI Network and Screening of Hub Genes
The 98 key genes in midnightblue module were uploaded to STRING to analyze their interactions and the PPI network was presented in Figure 4A. Subsequently, we downloaded the genes interaction data and uploaded it to Cytoscape tool - Cytohubba plugin for screening hub genes. As shown in Figure 4B, we eventually obtained the top eight hub genes (AKR1C3, ALDH3A1, AKR1C1, CYP1A1, GPX2, CBR3, AKR1B1, GSR). Furthermore, the Pearson correlation coefficient analysis was calculated across these hub genes. The results indicated that there was significant correlation among these key genes (Figure 4C). According to the above results and literature reported, all of these hub genes were involved in antioxidant related actions. Therefore, we investigated the relationship between these hub genes and oxidative stress-related genes. As shown in Figure 4D, we found that the eight hub genes were significantly correlated with NQO1, RPE, ANG, ATM, CYP2E1, G6PD. Consistently, the results of Hallmark gene sets indicated that the eight genes were significantly correlated with reactive oxygen species pathway, apoptosis and fatty acid metabolism (Figure 4E).
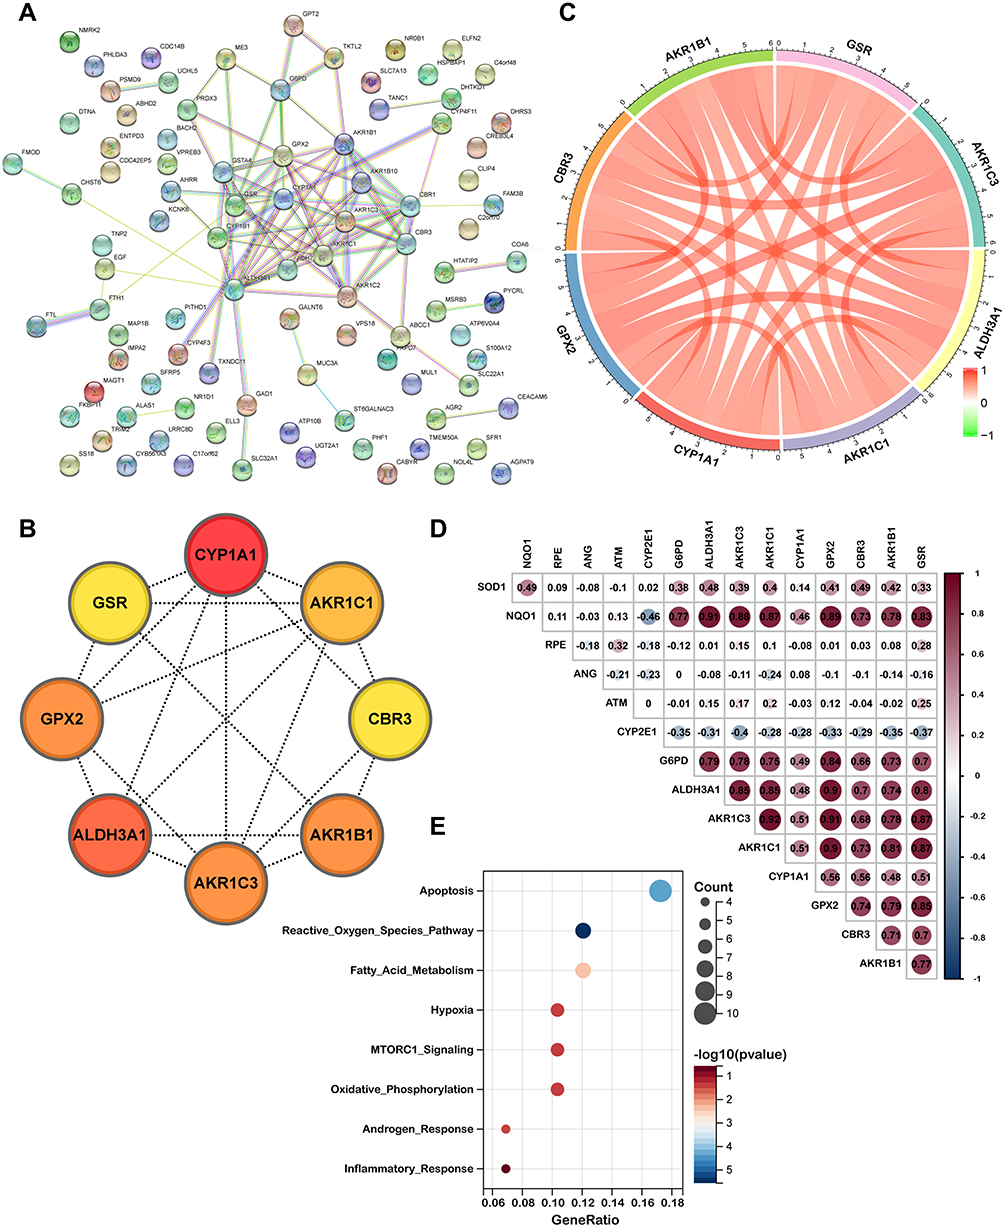 |
Figure 4 Identification of eight hub genes. (A) Protein-protein interaction network of 98 genes correlated with COPD clinical features were obtained from STRING database. (B) Top eight hub genes identified by Cytohubba. (C) Pearson correlation coefficient analysis of eight hub genes. (D) The relationship between hub gene and oxidative stress related genes. (E) Enrichment plot of Hallmark gene sets with eight hub genes. |
Single-Cell Transcriptomic Analysis
To further verify the relationship between the hub genes and airway epithelium in COPD, we obtained single-cell RNA-seq data from the GSE173896 and GSE167295 dataset, which comprised the data from three normal and three COPD tissues. The clinical characteristics of the datasets were shown in Tables S1 and S2. The dataset contained 12,692 cells from normal and 12,502 cells from COPD lung tissues with 13 cell types identified based on representative marker genes (Figure 5A and B). As shown in Figure 5C, we found that the percentage of T lymphocytes subset in the COPD group (42.67%) was significantly higher than that in the control group (19.19%), while there was no significant difference of epithelial cells between normal (9.25%) and COPD groups (7.99%). We further annotated and identified the epithelial cells into six cell sub-clusters, including ciliated cells, club cells, basal cells, goblet cells, alveolar epithelial cell type 1 and alveolar epithelial cell type 2 (Figure 5D). We then used the violin plot to illustrate the expressions of AGER, LAMP3, KRT5, FOXJ1, SCGB1A2, MUC5B in each subset, which further validated the correctness of identification in these epithelial cell subsets (Figure 5E).
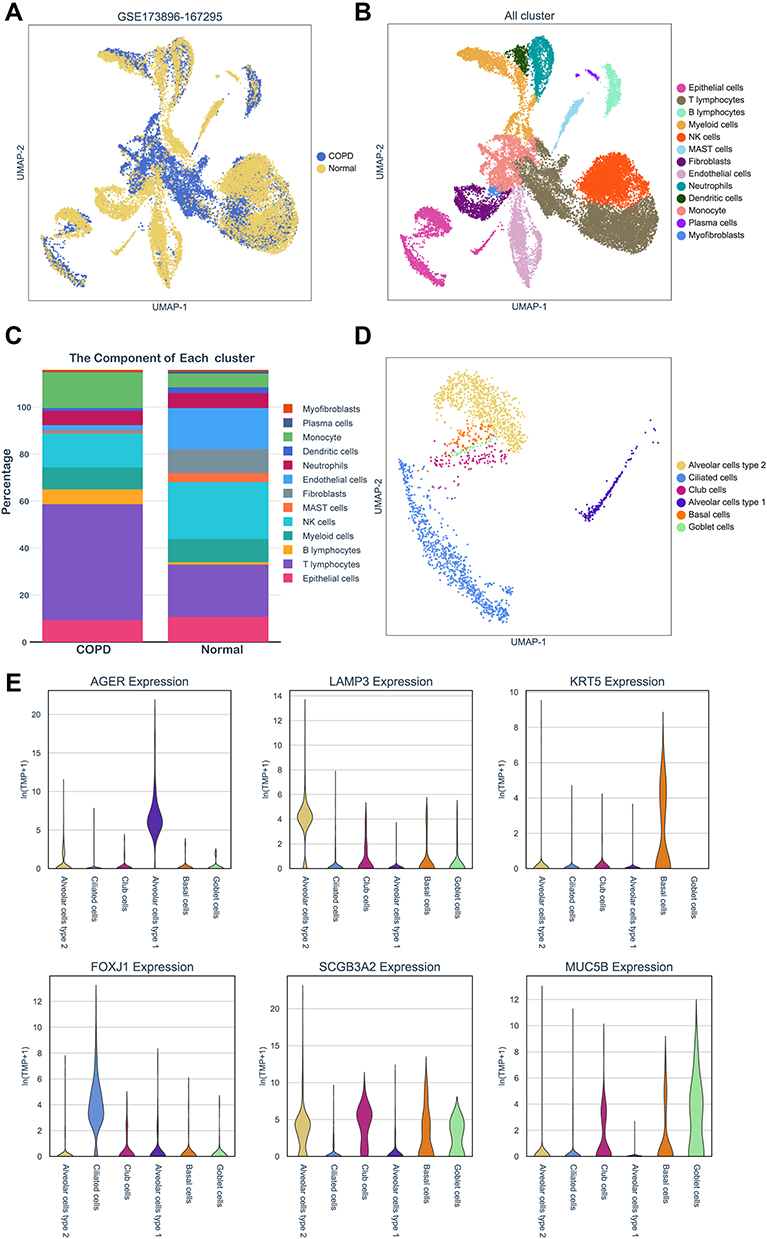 |
Figure 5 Profiling of cell types in COPD using scRNA seq data. (A) Uniform Manifold Approximation and Projection (UMAP) representation of 25,194 cells from 3 COPD and 3 control donor lungs. (B) Visualization of clustering by UMAP plot with 13 distinct cell types identified. (C) Relative proportion of each cell subset between normal and COPD tissues. (D) UMAP plot of epithelial cells colored according to identified clusters. (E) Violin plots of normalized expression values for canonical cell specific marker genes for alveolar epithelial cell type 1, alveolar epithelial cell type 2, basal cells, ciliated cells and goblet cells. |
Subsequently, we explored the enrichment and expressions of the above eight hub genes in each subtype of epithelial cells. However, only six hub genes, including AKR1C3, ALDH3A1, GPX2, CBR3, AKR1B1 and GSR, were expressed in the single-cell dataset. In the Figure 6A, we found that the expressions of AKRAC3, ALDH3A1, GPX2, CBR3 and AKR1B1 were significantly increased in the COPD group when compared with the normal group, while GSR expression showed the inverse trend. Further analysis of epithelial cell subpopulations demonstrated the different expression levels of these hub genes in different epithelial sub-clusters. Interestingly, we found that only ALDH3A1 was higher expressed in all subtypes of epithelial cells (Figure 6B). Gene-wise correlation heatmap indicated that ALDH3A1 was closely related to GSR and AKR1C3 (Figure 6C). The above evidence indicated the hub genes were differentially expressed in epithelial cells of the COPD group. Hence, we further illustrated the distribution and expressions of these hub genes in epithelial sub-clusters of the COPD group. Notably, we found that the expression of ALDH3A1 was enriched in ciliated cells (Figure 6D), which indicated that ALDH3A1 may exert important function on ciliated cells in COPD patients. To further explore the topology of epithelial cells, we applied PAGA, an algorithm that maps discrete connected and continuous connected cell-to-cell variation.17 In the PAGA plots, we found that ciliated cells were most closely related to basal cells when ALDH3A1 was expressed (Figure 7A and B). Moreover, according to the expression of ALDH3A1, ciliated cells were further subdivided into two subtypes. We conducted differential gene expression analysis between ALDH3A1+ ciliated cells and ALDH3A1− ciliated cells (Figure 7C). KEGG pathway enrichment analysis showed that these DEGs were significantly enriched in P53 signaling pathway (Figure 7D).
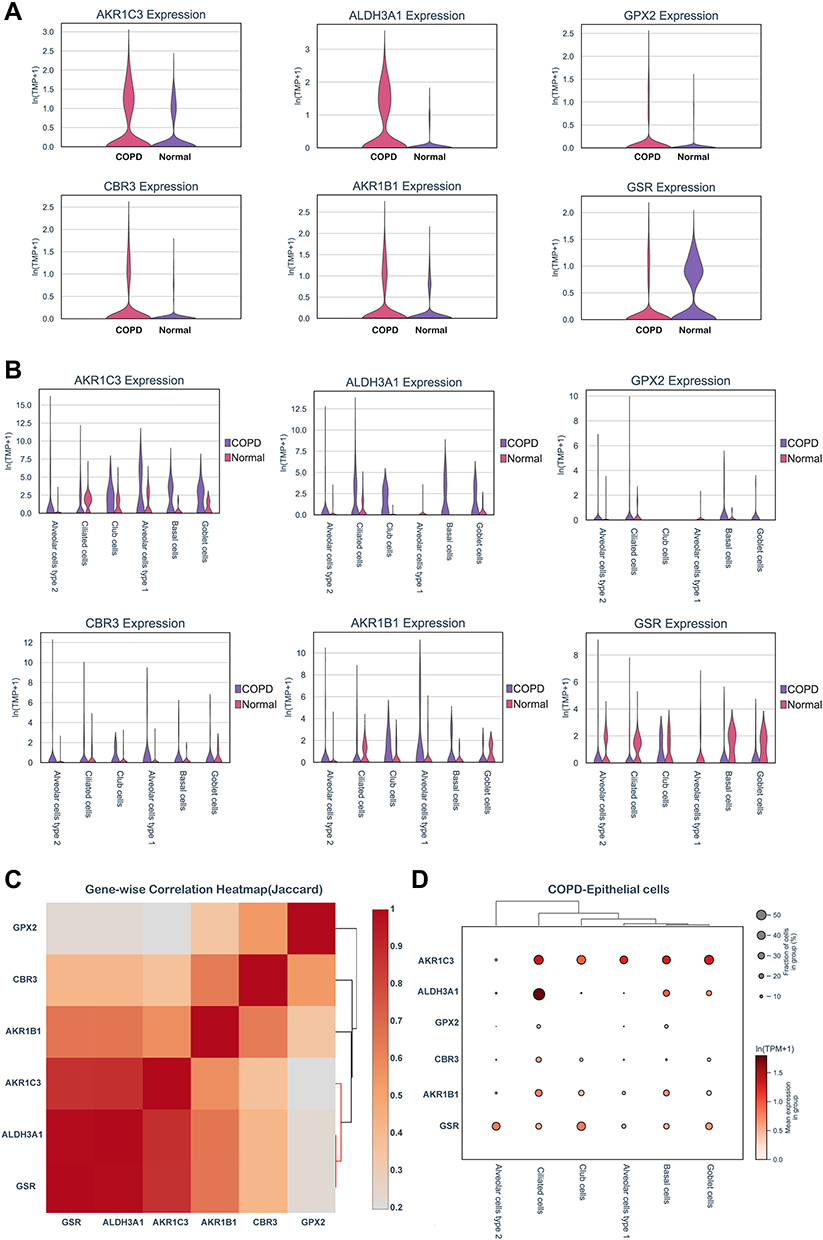 |
Figure 6 Hub genes expressions in COPD epithelial cells. (A) Hub genes expressions in epithelium were assessed by scRNA-seq from COPD and non-smokers. (B) Hub genes expressions in pulmonary epithelial cell subpopulations. (C) Gene-wise correlation heatmap of six hub genes. (D) Distribution and expression levels of hub genes in epithelial cells of COPD patients. |
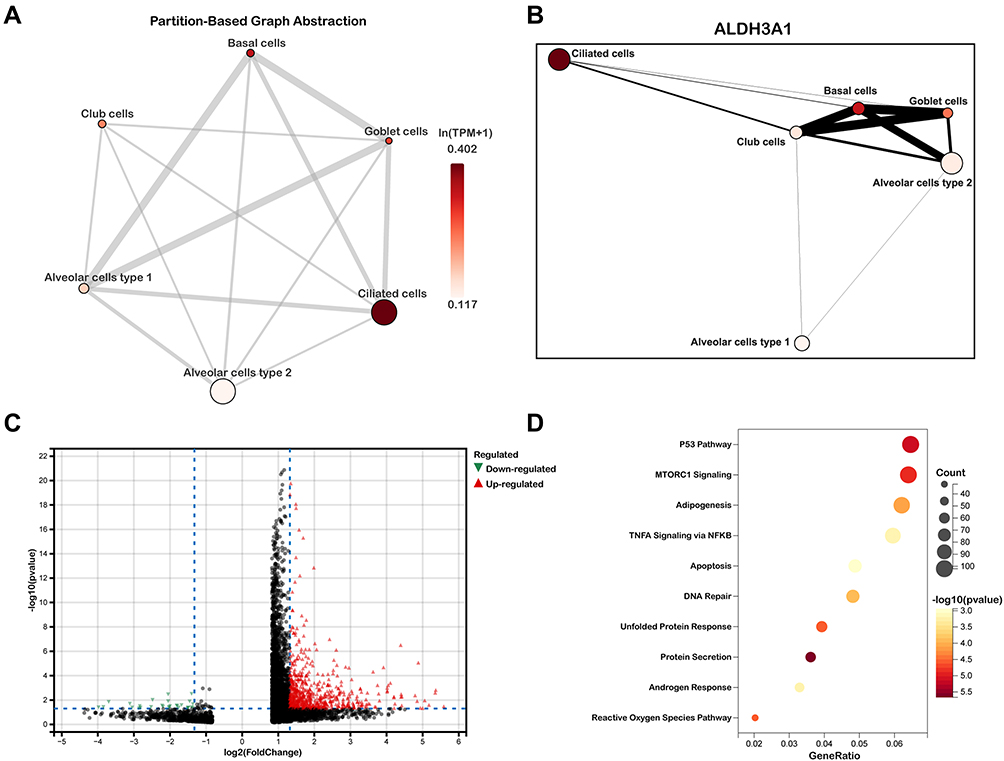 |
Figure 7 Single-cell RNA transcriptomic analysis of ALDH3A1 in epithelium. (A and B) Partition-based graph abstraction (PAGA) indicated ALDH3A1 was related to ciliated cells. (C) volcano plots of DEGs between ALDH3A1+ ciliated cells and ALDH3A1- ciliated cells. (D) KEGG pathway enrichment analysis of DEGs in ALDH3A1 ± ciliated cells. |
Verification of Hub Genes
To assess the robustness of hub genes, we downloaded another dataset (GSE128708) for verification. The results demonstrated that these eight hub genes were markedly increased in epithelium of the COPD group when compared with the normal group (Figure 8A). Moreover, we detected their mRNA expression levels in human pulmonary epithelial cells lines (BEAS-2B cells) after CSE incubation for 24h. CSE IC50 was further calculated, and the result was presented in Figure 8B. The IC50 was approximately 3% CSE. Subsequently, we applied the concentration to BEAS-2B and detected the mRNA expression of the hub genes. The results indicated that the expressions of AKR1C3, ALDH3A1, AKR1C1, CYP1A1, GPX2, CBR3, GSR were significantly elevated when the cells were exposed to CSE, while the expression of AKR1B1 was downregulated (Figure 8C).
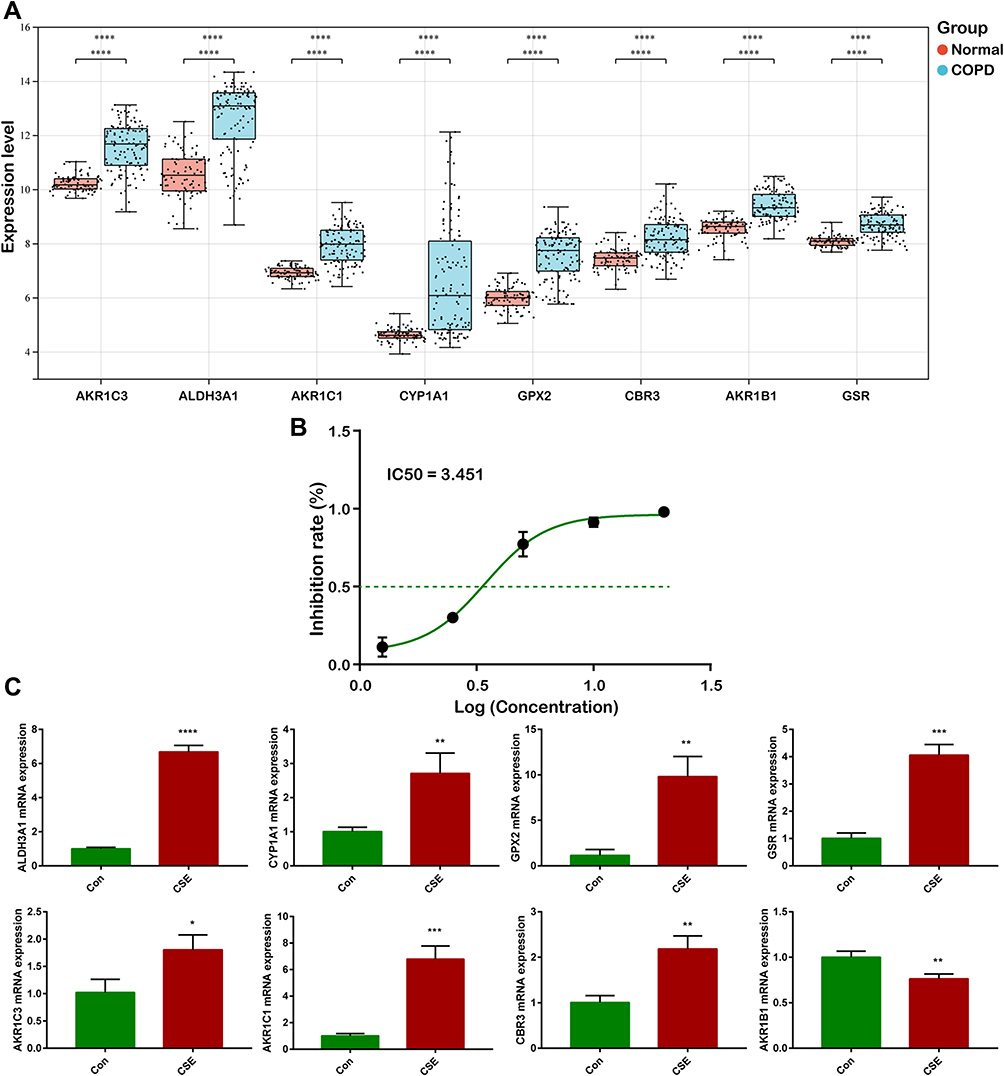 |
Figure 8 Verification of hub genes. (A) External validation of eight hub genes in GSE128708. (B) IC50 of cigarette smoke extract. (C) mRNA expression levels of eight hub genes were detected via RT-qPCR (*P<0.05, **P<0.01, ***P<0.001, ****P<0.0001). |
Discussion
Vascular inflammation and oxidative stress are implicated as essential factors in the pathogenesis and progression of COPD.18,19 Previous studies have reported that cigarette smoke exposure may induce redox imbalance by shifting the balance between oxidants and antioxidants.20 The airway epithelium is the first protective barrier between the pulmonary tissues and air, making it extremely susceptible to the stimulation of harmful substances, such as PM2.5 and smoke.21,22 Therefore, the present in silico analysis was conducted to identify hub genes in pulmonary airway epithelium exposed to cigarettes in COPD patients.
In the present study, we preliminarily identified DEGs of GSE11906 and eventually confirmed eight hub genes associated with airway epithelial cells via WGCNA and PPI network, including ALDH3A1, AKR1C3, AKR1C1, CYP1A1, GPX2, CBR3, AKR1B1, GSR. The above molecules were regarded as metabolic regulators that participate in catabolic redox reactions, especially ALDH3A1.23–26 The KEGG enrichment result also supported the evidence that the eight hub genes were enriched in reactive oxygen species (ROS) pathway and fatty acid metabolism. Consistently, the correlation coefficient map demonstrated that the hub genes were correlated with essential molecules in the regulation of oxidative stress, including SOD1, NQO1, G6PD.27–29
The underlying mechanism of the above candidate genes in COPD remains to be investigated. Previous studies have reported that AKRs, including AKR1C3, AKR1C1 and AKR1B1, might catalyze the reduction of lipid peroxidation products, such as 4-hydroxynonenal (4-HNE), and their glutathione (GSH) conjugates.30–32 Moreover, ALDH metabolized other aldehydes generated during the process of oxidative stress, including 4-HNE.33 Reactive 4-HNE was the toxic products of lipid peroxidation,34 which acted as the oxidative degradation of polyunsaturated fatty acids and may further induce cellular apoptosis in COPD pathogenesis.35 GPX2 is believed to regulate cancer progression by regulating the level of hydroperoxides inside cells.36 In addition, its antioxidant effect may protect epithelial tissue from harmful substances, such as hydrogen peroxide, free radicals, tumor necrosis factor.37 Vecchio et al reported that cigarette smoke-exposed mouse was more prone to show a higher baseline production of GPX2 in alveolar macrophages,38 which was consistent with our results. Additionally, CYP1A1 induced ROS production and was also correlated with the generation of lipid peroxidation products.39,40
The specific expression distribution and underlying mechanism of ALDH3A1 have not been fully elucidated. Herein, we found that ALDH3A1 served as an essential role in the oxidative stress of COPD. ALDH3A1 is a metabolic enzyme responsible for the oxidation of various aldehydes.41 Previous studies have indicated that ALDH3A1 was associated with external environmental stress, and the metabolic role of ALDH3A1 was related to resistance to oxidative stress. Additionally, the expression of ALDH3A1 robustly increased in the fluid lining the epithelial cells of smokers or primary human bronchial epithelial cells after exposing to cigarette smoke.42,43 In addition, KEGG enrichment analysis demonstrated that ALDH3A1-associated DEGs in ciliated cells were significantly enriched in P53 pathway. Similarly, previous studies also found that ALDH3A1 was regulated by P53 protein in HBE cell lines.44 Therefore, we speculated that ALDH3A1 might exert underlying function of metabolism and oxidative stress on ciliated cells through P53 pathway. However, whether ALDH3A1 played a potential role via P53 pathway needed further experimental verifications.
The present study revealed candidate genes on the metabolism and oxidative stress of COPD. While we have to acknowledge that our study has several limitations. Firstly, the sample size was relatively small and the clinical information was not sufficient, resulting in a less profound investigation of WGCNA. Secondly, although we performed RT-qPCR to validate the expressions of the eight hub genes in BEAS-2B cell stimulated by CSE, further biological function and potential mechanism have not been verified. Therefore, the specific molecular regulatory mechanism and how these genes interact to regulate corticosteroid resistance still need to be clarified in future experiments.
Conclusion
In the present study, we identified eight hub genes related to the GOLD classification by integrating the microarray data of COPD, including AKR1C3, ALDH3A1, AKR1C1, CYP1A1, GPX2, CBR3, AKR1B1, GSR. Moreover, functional enrichment analysis indicated that the expressions of the above genes were significantly correlated with metabolism and antioxidant stress in COPD process. Single-cell transcriptomic analysis indicated that five hub genes, including AKR1C3, ALDH3A1, GPX2, CBR3 and AKR1B1, were elevated in pulmonary airway epithelium. Moreover, ALDH3A1 was significantly elevated in all subtypes of epithelial cells, especially in ciliated cells.
Data Sharing Statement
All data generated or analyzed in the present study are included in this published article.
Funding
The study was supported by Health Research Program for Talent Training Project of Fujian Province (2019-ZQNB-7).
Disclosure
The authors declare that they have no conflict of interest.
References
1. Vogelmeier C, Criner G, Martinez F, et al. Global strategy for the diagnosis, management, and prevention of Chronic Obstructive Lung Disease 2017 Report. GOLD Executive Summary. Am J Respir Crit Care Med. 2017;195(5):557–582. doi:10.1164/rccm.201701-0218PP
2. van Geffen W, Kerstjens H, Slebos D. Emerging bronchoscopic treatments for chronic obstructive pulmonary disease. Pharmacol Ther. 2017;179:96–101. doi:10.1016/j.pharmthera.2017.05.007
3. Tamimi A, Serdarevic D, Hanania N. The effects of cigarette smoke on airway inflammation in asthma and COPD: therapeutic implications. Respir Med. 2012;106(3):319–328. doi:10.1016/j.rmed.2011.11.003
4. Wistuba I, Mao L, Gazdar A. Smoking molecular damage in bronchial epithelium. Oncogene. 2002;21(48):7298–7306. doi:10.1038/sj.onc.1205806
5. Mercer R, Russell M, Roggli V, Crapo J. Cell number and distribution in human and rat airways. Am J Respir Cell Mol Biol. 1994;10(6):613–624. doi:10.1165/ajrcmb.10.6.8003339
6. Xing X, Yang F, Huang Q, et al. Decoding the multicellular ecosystem of lung adenocarcinoma manifested as pulmonary subsolid nodules by single-cell RNA sequencing. Sci Adv. 2021;7(5). doi:10.1126/sciadv.abd9738
7. Do-Umehara H, Chen C, Zhang Q, et al. Miz1Epithelial cell-specific loss of function of causes a spontaneous COPD-like phenotype and up-regulates expression in mice. Sci Adv. 2020;6(33):eabb7238. doi:10.1126/sciadv.abb7238
8. Kachuri L, Johansson M, Rashkin S, et al. Immune-mediated genetic pathways resulting in pulmonary function impairment increase lung cancer susceptibility. Nat Commun. 2020;11(1):27. doi:10.1038/s41467-019-13855-2
9. Xu Y, Liu H, Song L. Novel drug delivery systems targeting oxidative stress in chronic obstructive pulmonary disease: a review. J Nanobiotechnol. 2020;18(1):145. doi:10.1186/s12951-020-00703-5
10. Zhao J, Cheng W, He X, et al. Chronic Obstructive Pulmonary Disease molecular subtyping and pathway deviation-based candidate gene identification. Cell Journal. 2018;20(3):326–332. doi:10.22074/cellj.2018.5412
11. Chu W, Ghahramani Z, Falciani F, Wild D. Biomarker discovery in microarray gene expression data with Gaussian processes. Bioinformatics. 2005;21(16):3385–3393. doi:10.1093/bioinformatics/bti526
12. Lin J, Xue Y, Su W, Zhang Z, Wei Q, Huang T. Identification of dysregulated mechanisms and candidate gene markers in Chronic Obstructive Pulmonary Disease. Int J Chron Obstruct Pulmon Dis. 2022;17:475–487. doi:10.2147/COPD.S349694
13. Langfelder P, Horvath S. WGCNA: an R package for weighted correlation network analysis. BMC Bioinform. 2008;9(1):559. doi:10.1186/1471-2105-9-559
14. Chin C, Chen S, Wu H, Ho C, Ko M, Lin C. cytoHubba: identifying hub objects and sub-networks from complex interactome. BMC Syst Biol. 2014;8(S4):S11. doi:10.1186/1752-0509-8-S4-S11
15. MacParland S, Liu J, Ma X, et al. Single cell RNA sequencing of human liver reveals distinct intrahepatic macrophage populations. Nat Commun. 2018;9(1):4383. doi:10.1038/s41467-018-06318-7
16. Deczkowska A, David E, Ramadori P, et al. XCR1 type 1 conventional dendritic cells drive liver pathology in non-alcoholic steatohepatitis. Nat Med. 2021;27(6):1043–1054. doi:10.1038/s41591-021-01344-3
17. Wolf F, Hamey F, Plass M, et al. graph abstraction reconciles clustering with trajectory inference through a topology preserving map of single cells. Genome Biol. 2019;20(1):59. doi:10.1186/s13059-019-1663-x
18. Jiang S, Quan D, Sung J, Lee M, Ha H. Cigarette smoke inhalation aggravates diabetic kidney injury in rats. Toxicol Res. 2019;8(6):964–971. doi:10.1039/c9tx00201d
19. Saunders R, Biddle M, Amrani Y, Brightling C. Stressed out - The role of oxidative stress in airway smooth muscle dysfunction in asthma and COPD. Free Radic Biol Med. 2022;185:97–119. doi:10.1016/j.freeradbiomed.2022.04.011
20. Allen-Gipson D, Zimmerman M, Zhang H, et al. Smoke extract impairs adenosine wound healing: implications of smoke-generated reactive oxygen species. Am J Respir Cell Mol Biol. 2013;48(5):665–673. doi:10.1165/rcmb.2011-0273OC
21. Krunkosky T, Jarrett C. Selective regulation of MAP kinases and chemokine expression after ligation of ICAM-1 on human airway epithelial cells. Respir Res. 2006;7(1):12. doi:10.1186/1465-9921-7-12
22. Wang Y, Li D, Song L, Ding H. Ophiopogonin D attenuates PM2.5-induced inflammation via suppressing the AMPK/NF-κB pathway in mouse pulmonary epithelial cells. Exp Ther Med. 2020;20(6):139. doi:10.3892/etm.2020.9268
23. Koppaka V, Thompson D, Chen Y, et al. Aldehyde dehydrogenase inhibitors: a comprehensive review of the pharmacology, mechanism of action, substrate specificity, and clinical application. Pharmacol Rev. 2012;64(3):520–539. doi:10.1124/pr.111.005538
24. Rižner T. Enzymes of the AKR1B and AKR1C subfamilies and uterine diseases. Front Pharmacol. 2012;3:34. doi:10.3389/fphar.2012.00034
25. Wang Y, Cao P, Alshwmi M, et al. GPX2 suppression of HO stress regulates cervical cancer metastasis and apoptosis via activation of the β-catenin-WNT pathway. Oncotargets Ther. 2019;12:6639–6651. doi:10.2147/OTT.S208781
26. Li Y, Cui J, Jia J. The activation of procarcinogens by CYP1A1/1B1 and related chemo-preventive agents: a review. Curr Cancer Drug Targets. 2021;21(1):21–54. doi:10.2174/1568009620666201006143419
27. Shafiq K, Sanghai N, Guo Y, Kong J. Implication of post-translationally modified SOD1 in pathological aging. GeroScience. 2021;43(2):507–515. doi:10.1007/s11357-021-00332-2
28. D’Alessandro A, Howie H, Hay A, et al. Hematologic and systemic metabolic alterations due to Mediterranean class II G6PD deficiency in mice. JCI Insight. 2021;6(14). doi:10.1172/jci.insight.147056.
29. Pauletto M, Giantin M, Tolosi R, et al. Curcumin mitigates AFB1-induced hepatic toxicity by triggering cattle antioxidant and anti-inflammatory pathways: a whole transcriptomic in vitro study. Antioxidants. 2020;9(11):1059. doi:10.3390/antiox9111059
30. Penning T. The aldo-keto reductases (AKRs): overview. Chem Biol Interact. 2015;234:236–246. doi:10.1016/j.cbi.2014.09.024
31. Ramana K. ALDOSE REDUCTASE: new Insights for an old enzyme. Biomol Concepts. 2011;2(1–2):103–114. doi:10.1515/bmc.2011.002
32. Kabututu Z, Manin M, Pointud J, et al. Prostaglandin F2alpha synthase activities of aldo-keto reductase 1B1, 1B3 and 1B7. J Biochem. 2009;145(2):161–168. doi:10.1093/jb/mvn152
33. Ueta C, Campos J, Albuquerque R, et al. Cardioprotection induced by a brief exposure to acetaldehyde: role of aldehyde dehydrogenase 2. Cardiovasc Res. 2018;114(7):1006–1015. doi:10.1093/cvr/cvy070
34. Hu J, Xu X, Li W, et al. Ginsenoside Rk1 ameliorates paracetamol-induced hepatotoxicity in mice through inhibition of inflammation, oxidative stress, nitrative stress and apoptosis. J Ginseng Res. 2019;43(1):10–19. doi:10.1016/j.jgr.2017.07.003
35. Lakshmi S, Reddy A, Kodidhela L, Varadacharyulu N. Epigallocatechin gallate diminishes cigarette smoke-induced oxidative stress, lipid peroxidation, and inflammation in human bronchial epithelial cells. Life Sci. 2020;259:118260. doi:10.1016/j.lfs.2020.118260
36. Brigelius-Flohé R, Kipp A. Glutathione peroxidases in different stages of carcinogenesis. Biochim Biophys Acta. 2009;1790(11):1555–1568. doi:10.1016/j.bbagen.2009.03.006
37. Canizal-García M, Olmos-Orizaba B, Moreno-Jiménez M, Calderón-Cortés E, Saavedra-Molina A, Cortés-Rojo C. Glutathione peroxidase 2 (Gpx2) preserves mitochondrial function and decreases ROS levels in chronologically aged yeast. Free Radic Res. 2021;55(2):165–175. doi:10.1080/10715762.2021.1882677
38. Vecchio D, Arezzini B, Pecorelli A, Valacchi G, Martorana P, Gardi C. Reactivity of mouse alveolar macrophages to cigarette smoke is strain dependent. Am J Physiol Lung Cell Mol Physiol. 2010;298(5):L704–713. doi:10.1152/ajplung.00013.2009
39. Mao Y, Yang L, Chen Q, et al. The influence of CYP1A1 and CYP1A2 polymorphisms on stroke risk in the Chinese population. Lipids Health Dis. 2020;19(1):221. doi:10.1186/s12944-020-01370-z
40. Cernigliaro C, D’Anneo A, Carlisi D, et al. Ethanol-mediated stress promotes autophagic survival and aggressiveness of colon cancer cells via activation of Nrf2/HO-1 pathway. Cancers. 2019;11(4):505. doi:10.3390/cancers11040505
41. Voulgaridou G, Tsochantaridis I, Mantso T, Franco R, Panayiotidis M, Pappa A. Human aldehyde dehydrogenase 3A1 (ALDH3A1) exhibits chaperone-like function. Int J Biochem Cell Biol. 2017;89:16–24. doi:10.1016/j.biocel.2017.05.017
42. Iskandar A, Titz B, Sewer A, et al. in vitroSystems toxicology meta-analysis of assessment studies: biological impact of a candidate modified-risk tobacco product aerosol compared with cigarette smoke on human organotypic cultures of the aerodigestive tract. Toxicol Res (Camb). 2017;6(5):631–653. doi:10.1039/C7TX00047B
43. Jang J, Bruse S, Liu Y, et al. Aldehyde dehydrogenase 3A1 protects airway epithelial cells from cigarette smoke-induced DNA damage and cytotoxicity. Free Radic Biol Med. 2014;68:80–86. doi:10.1016/j.freeradbiomed.2013.11.028
44. Huang R, Liu X, Li H, Zhou Y, Zhou P. Integrated analysis of transcriptomic and metabolomic profiling reveal the p53 associated pathways underlying the response to ionizing radiation in HBE cells. Cell Biosci. 2020;10(1):56. doi:10.1186/s13578-020-00417-z
 © 2022 The Author(s). This work is published and licensed by Dove Medical Press Limited. The full terms of this license are available at https://www.dovepress.com/terms.php and incorporate the Creative Commons Attribution - Non Commercial (unported, v3.0) License.
By accessing the work you hereby accept the Terms. Non-commercial uses of the work are permitted without any further permission from Dove Medical Press Limited, provided the work is properly attributed. For permission for commercial use of this work, please see paragraphs 4.2 and 5 of our Terms.
© 2022 The Author(s). This work is published and licensed by Dove Medical Press Limited. The full terms of this license are available at https://www.dovepress.com/terms.php and incorporate the Creative Commons Attribution - Non Commercial (unported, v3.0) License.
By accessing the work you hereby accept the Terms. Non-commercial uses of the work are permitted without any further permission from Dove Medical Press Limited, provided the work is properly attributed. For permission for commercial use of this work, please see paragraphs 4.2 and 5 of our Terms.