")
Back to Journals » OncoTargets and Therapy » Volume 12
Identification of seven-gene signature for prediction of lung squamous cell carcinoma
Authors Wang Z , Wang Z , Niu X, Liu J, Wang Z, Chen L, Qin B
Received 20 December 2018
Accepted for publication 13 April 2019
Published 24 July 2019 Volume 2019:12 Pages 5979—5988
DOI https://doi.org/10.2147/OTT.S198998
Checked for plagiarism Yes
Review by Single anonymous peer review
Peer reviewer comments 2
Editor who approved publication: Dr Yao Dai
Zhe Wang,1,* Zhongmiao Wang,1,* Xing Niu,2 Jie Liu,3 Zhuning Wang,2 Lijie Chen,4 Baoli Qin1
1Department of Gastrointestinal Oncology, Cancer Hospital of China Medical University, Liaoning Cancer Hospital & Institute, Shenyang 110042, Liaoning Province, People’s Republic of China; 2Department of Second Clinical College, Shengjing Hospital affiliated to China Medical University, Shenyang 110004, Liaoning Province, People’s Republic of China; 3Science Experiment Center of China Medical University, China Medical University, Shenyang 110122, Liaoning Province, People’s Republic of China; 4Department of Third Clinical College, China Medical University, Shenyang 110122, Liaoning Province, People’s Republic of China
*These authors contributed equally to this work
Background and aim: Lung squamous cell carcinoma (LUSC), is a pathological subtype of lung cancer, accounting for 30% of the lung cancers. A reliable model was constructed, based on the whole gene expression profiles, to predict the prognosis of patients with LUSC.
Methods: The RNA-Seq data of LUSC was downloaded from the TCGA database, and differentially expressed genes (p<0.05, |log2fold change| >1) were screened out. By univariate and multivariate Cox regression analysis, we identified seven prognosis-related genes. Then, we established a risk score staging system to predict the prognosis of patients with LUSC. Compared with other clinical parameters, the risk score was an independent prognostic factor and had a better performance in predicting prognosis. Finally, GSEA analysis was carried out to determine the enrichment pathway significantly. The risk score models were established by Cox proportional hazard regression analysis; the ROC curve was applied to test the performance of risk score model. All the statistical analysis was accomplished by R packages.
Results: In this study, a model was constructed to predict prognosis, which contains seven genes: CSRNP1, CLEC18B, MIR27A, AC130456.4, DEFA6, ARL14EPL, and ZFP42. Based on the model, the risk score of each patient was calculated with LUSC (hazard ratio [HR]=2.673, 95% CI=1.871–3.525). It was found that the risk score can distinguish high-risk and low-risk groups in prognosis of LUSC patients, independently. Furthermore, the model was validated by ROC curves in the testing dataset and the whole dataset. Lastly, by gene set enrichment analysis (GSEA), we showed the main enrichment pathways were DNA damage stimulus, DNA repair, and DNA replication. It was suggested that the risk score may provide a new and reliable method for prognosis prediction.
Conclusion: The results of this study suggested that the risk score based on seven-genes could indicate a promising and independent prognostic biomarker for LUSC patients.
Keywords: lung squamous cell carcinoma, prognosis, gene set enrichment analysis, Cox regression model, risk score
Introduction
Lung cancer is the most commonly diagnosed cancer (11.6% of the total cases) and the leading cause of cancer death, which made it a big concern for human public health worldwide.1 About 80% of primary lung cancers are non-small cell lung cancer (NSCLC), which can be further classified into adenocarcinoma and squamous cell carcinoma.2 Lung squamous cell carcinoma (LUSC) comprises ∼30% of all lung cancers.3,4 Primary treatments of advanced lung squamous cell carcinoma are surgery, radiotherapy, and chemotherapy. Although molecularly targeted agents and immunotherapy have played a major role in the treatment of lung adenocarcinoma, there have been few approved targeted therapies and effective chemotherapeutic options beyond the first line of therapy for LUSC. However, its 5-year survival rate is still less than 15%.5 Thus, it is important to find effective and reliable predictors for early detection.
Previous studies have identified the correlation between aberrant expressed genes and human cancers, and revealed promise of these genes as biomarkers in predicting patients’ survival.6–8 Similarly, the abnormality of RNA has also been reported as having impact on the survival. Overexpressed HUWE1 was found to be associated with poor patient outcome.9 VPS9D1-AS1 serves as a promising biomarker to predict the prognosis of NSCLC.10 These studies demonstrate that changes in single gene expression and in RNA expression are meaningful for predicting the prognosis of lung cancer. However, there is no independent element which can predict the prognosis of lung cancer based on a multi-gene model.
In this research, we presented the risk score based on seven genes as a dependent prognostic biomarker for LUSC; the risk score contained all genes information which was included in the model. Additionaly, we found that these genes are mainly enriched in the DNA damage stimulus pathway, DNA repair pathway, and DNA replication pathway. In summary, we identified a new element (risk score) to predict the prognosis of LUSC patients. Compared to the existing studies of predictor, our work offered a new risk model as an independent prognostic biomarker in risk stratification for LUSC patients.
Materials and methods
Data source and preprocessing
Gene expression profiles and the clinical dataset of patients with LUSC were downloaded from the TCGA data portal.11 The gene expression profiles were chosen based on the criteria as follows: median expression in LUSC >0 and in adjacent-normal tissue >0. Then, all the genes were normalized by DESeq2 package. Clinical information, including the total number of patients (n=551), sex, age, TNM stage, T stage, N stage, M stage, survival time, and survival state were included in this research. A total of 551 LUSC patients were randomly divided into a training data set (n=363) and a testing data set (n=188).
Identifcation of prognosis-associated genes
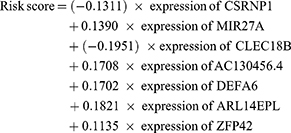
Differential expression genes (DEGs) were chosen according to the criteria of P<0.05, |log2fold change| >1 in the training dataset using the R package edge, and analysed by univariate analysis. Then, 24 genes (p<0.001) were selected to build a Cox proportional hazards regression model.12 Finally, the model was carried out by stepwise regression method. Therefore, seven independent genes were chosen via the Cox regression model (Table 1). Based on this independent prognositc model, the survival risk of each LUSC patient was evaluated as follows:
 |
Table 1 The seven prognosis-associated genes to establish the risk score system |
K-M survival analysis
The risk score of each LUSC sample was calculated according to the risk score formula, and all the LUSC patients were divided into low-risk and high-risk groups using the median value of the risk score as the cut-off value. Then the K-M survival curves of high-risk and low-risk groups were mapped using survival package. Lastly, the follow-up time of patients was shown in a scatter plot.
Correlation analysis between risk score system and clinical factors
All patients were grouped by age, gender, race, smoking status, and stage. The risk score between the two groups was calculated with the purpose of observing the difference between each feature.
Gene set enrichment analysis
Gene Set Enrichment Analysis (GSEA) was carried out to analyze the differences between two groups: high-risk group and low-risk group. The gene sets were adopted from The Molecular Signatures Database. The phenotype label was high-risk score vs. low-risk score. The number of permutations was set to 1,000, and a false discovery rate (FDR) <0.25 was recognized as statistically significant.
Statistical analysis
We invested DEGs using edgeR package, the principle of which is fitting generalized linear models and using likelihood ratio tests to identify DEGs. Next, we used the Cox regression model to do the multivariable survival analysis. Based on the median value of risk score, we divide the population into high-risk and low-risk groups. To further confirm the model, we used the Kaplan-Meier method to analyze the correlation between risk score and overall survival, and the log-rank test to compare survival curves. We used R software version 3.5.1 and the “survival” package to do the receiver operating characteristic (ROC) curve analysis. Moreover, we conducted 3-fold cross-validation to further confirm the efficacy of the model. The area under the curve (AUC) was also calculated. We compared two groups in different clinical parameters (age, gender, race, smoking status, and stage) using the t-test for continuous variables and χ2 test for categorical variables. With regard to both log-rank test and Cox proportional hazards regression model, the signifcance was set at p <0.05.
Results
Identification of prognostic gene signature
To identify new genetic prognostic markers for LUSC, we screened 24 prognostic related differential expression genes using univariate analysis. These prognostic significant genes were included in the Cox multivariate regression model, and the seven-gene prognosis prediction model (Table 1) was finally determined by stepwise regression.
Based on the model, the risk score of each sample was obtained, and, based on the median value of the risk score, LUSC patients were divided into high-risk group and low-risk group. In the training set, we found that the survival curves of the high-low risk group were significantly different, and the low-risk group had a better survival period (Figure 1A). The training population were ranked according to the risk score from low to high, and we showed the population follow-up time and genes heat map by the ranking (Figures 1C–E). Notably, the gene expression trend of CLEC18B is opposite to the others (Figure 1E). To verify the performance of the model, the ROC curve was described and the area under the ROC was 0.765 (Figure 1B). Furthermore, 3-fold cross-validation was carried out to validate the model, and the optimal AUC area was 0.66 (Figure 2).
 |
Figure 1 Outcomes of the seven-gene model in the training cohort. (A) Kaplan-Meier survival curve demonstrates the differences between the high-risk group and low-risk group about survival rate in the training sample. (B) ROC curve shows the performance of the model. (C) The distribution of follow-up time in the training sample. (D) The distributions of the risk scores in the training sample. (E) The distributions of the seven-gene expression profiles of patients in the training sample. |
 |
Figure 2 Outcomes of seven-gene model in the validation cohort. (A) Kaplan-Meier survival curve illustrates the differences between the high-risk group and low-risk group concerning the survival rate in the validation samples. (B) The distribution of follow-up time in the validation samples. (C) The distributions of the risk scores in the validation samples. (D) The distributions of the seven-gene expression profiles of patients in the validation samples. |
Validation of the seven-gene signature in predicting survival using Kaplan–Meier curves
In order to further prove the accuracy of the model and the classification effect of the risk score, we further applied the K-M analysis to display the survival curve of the high-risk group and the low-risk group in the validation dataset and the whole dataset. We found the survival of the two groups is significantly different in each dataset ( p<0.05) (Figures 3A and 4A). This result further demonstrated the effective performance of the model for classifying patients into two groups with different prognoses. Meanwhile, we showed the follow-up time of the validation dataset and the whole dataset by ascending ranking with risk score (Figures 3B and 4B). Consistently, the seven-gene expression heatmap sorted by risk score was also shown in the figures (Figures 3C and D and 4C and D).
 |
Figure 3 Outcomes of seven-gene model in the all samples. (A) Kaplan-Meier survival curve illustrates the differences between the high-risk group and low-risk group about survival rate in all samples. (B) The distribution of follow-up time in the all samples. (C) The distributions of the risk scores in the all samples. (D) The distributions of the seven-gene expression profiles of patients in the all samples. |
 |
Figure 4 The effects of clinical factors and risk score in all samples. The clinical importance of clinical factor and risk score.Abbreviations: CI, confidence interval; HR, hazard ratio. |
The seven-gene signature is an independent prognostic factor of survival
To compare the risk score with conventional clinical factors, we performed univariate and multivariate Cox hazard regression analysis to evaluate the importance of these indictors in the patients’ prognosis, which included risk score, age, sex, and TNM stage. We found that the risk score was an independent prognostic factor (Figure 5) (hazard ratio [HR]=2.673; 95% confidence interval [CI]=1.871~3.525; p<0.05). This result suggested the risk score was a robust indicator in predicting the prognosis of the LUSC cohort.
 |
Figure 5 The association between risk score and clinical factors (age (A), gender, (B) race (C), smoking-pack years (D), stage (E)) in all samples. |
Clinical staging is reported relating to prognosis in NSCLC.13 However, when it was analyzed together with the risk score in our research, the result in the model did not show significance. This was because each factor in the model was assigned a weight, and this made the function of the staging non-significant. These results suggest that the risk score is a more robust element in predicting the prognosis in the LUSC cohort. Furthermore, it is noteworthy that the seven-gene signature is competitive for survival prediction compared with clinical parameters.
By Cox regression analysis, we showed that the risk score is an independent prognostic factor. However, whether there is a difference in risk score for gender, age, race, stage, and smoking-pack years is unknown. In order to explore this issue, we tested the risk scores in different groups dividing by the parameters (gender, age, race, stage, and smoking-pack years), but there were no difference found (Figure 6).
 |
Figure 6 GSEA revealed that genes with higher risk subgroup were enriched in pathways of (A) DNA damage stimulus, (B) DNA repair, and (C) DNA replication. |
Identification of the eight‐gene signature-related biological processes and pathways
Based on the risk scores of the seven-gene expression, the population was divided into a high-risk group and a low-risk group, and there were significant differences in the prognosis between the two groups. To explore the mechanism of the seven-gene model, we examined the whole gene expression profiles by GSEA analysis. The GSEA analysis revealed that the mainly enrichment pathways were DNA damage stimulus pathway, DNA repair pathway, and DNA replication pathway, and the results suggested that the poor prognosis is related to the DNA damage repair pathway (Figure 7).
 |
Figure 7 The dataset was divided into three parts by caret package, and two parts of them were taken as the train dataset and one part as the testing dataset in turn. By 3-fold cross-validation, the area under the curve was 0.6604. |
Discussion
The prediction of prognosis is of great significance for treatment choice. A large number of studies have explored prognosis-related biomakers, and gene expression profiles have been found to play an important role in prognosis.14–16
In this research, we obtained a seven-gene prognostic model by Cox regression analysis and calculated the risk score of the LUSC patients. Our results suggested that the risk score is an independent prognostic factor. Furthermore, we explored the mechanism of the seven-gene predicting model by GSEA analysis. These findings suggested that the patient’s prognosis and molecular genetic background are inter-related, and prognostic assessment, including genetic background, will be more accurate. To the best of our knowledge, this is the first time that the seven-gene model was identified, and was found to be a candidate prognostic biomarker in LUSC.
Many studies have found that changes in gene expression affect prognosis, and there are reports that combine this analysis to predict prognosis of lung adenocarcinoma, kidney cancer, and pancreatic cancer.17–19 Multi-gene prediction of LUSC has not been reported. In our study; we obtained the prognosis-related seven-gene model by the Cox hazard regression analysis. Some of the seven genes (CSRNP1, CLEC18B, MIR27A, AC130456.4, DEFA6, ARL14EPL, and ZFP42) were reported in relation to tumorigenesis. CSRNP1 has been reported as a hub gene correlating to the prognosis of liver cancer.20 Similarly, it has been reported to be involved in the promotion of carcinogenesis through the eQTL mechanism in renal cancer.21 TGF-β1 could induce CSRNP1 expression, while SMAD3 was activated.22 A meta-analysis reported that the rs13275170 locus of DEFA6 increased 1.3-fold in gastric cancer, suggesting that DEFA6 is associated with tumorgenesis.22 ZFP42 is an oncogene, and a study reported a combined methylation model can accurately predict the occurrence of lung cancer, including SOX17, TAC1, HOXA7, CDO1, HOXA9, and ZFP42, which highly suggests the role of ZFP42 in the development of lung cancer.23 In this seven-gene model, MIR27A, AC130456.4, and ARL14EPL have not been reported in the relationship with tumors. It was interesting to find the increasing expression of CLEC18B has a negative correlation with the risk score in the heatmap. CLEC18B is a member of the CLEC superfamily and expressed in a variety of cancer cells. It was reported as strongly negatively correlated with total survival in GBM, and it was found to promote proliferation, invasion, and migration in GBM tumor cells. The high expression of CLEC18B can activate the activity of Wnt/β-catenin signaling pathway.24 Our study has proven that the genes in the model are related to the DNA damage pathway. In addition, Wnt signaling and DNA damage do have crosstalk.25 Referring to ZFP42, there has been little known about the ZFP42 gene in lung cancer. In summary, the seven genes have not been reported to predict the prognosis of lung cancer individually. We obtained the risk score of the sample by the combined prediction model of the seven genes, and verified the risk score was an independent prognostic factor.
In order to understand the mechanism of prognosis prediction of this gene set. We proformed GSEA analysis; GSEA is a computational method to evaluate whether a defined set of genes shows statistically significant, concordant differences between two biological states.26 We found the associated biological signaling pathways were the DNA damage stimulus pathway, DNA repair pathway, and DNA replication pathway. Consistent with previous reports, DNA damage repair genes affect prognosis of tumor patients.27 These results also suggested that poor prognosis may be associated with abnormal DNA damage pathways. However, the risk score as a comprehensive evaluation indicator reducing the genetic dimension can independently predict the LUSC patient’s prognosis.
The model built by this study was validated by an internal dataset. However, it also required more clinical data validation to reinforce the conclusion. Taken together, this study suggests that the integrated genetic information included with the clinical evaluation parameters to analyze prognosis will lead to more accurate predictions and provide more accurate treatment options.
Conclusion
Our study proposed a novel seven-gene model to predict the prognosis of patients with LUSC. We also further validated the feasibility of this model. In addition, genes in this model were mainly associated with the DNA damage stimulus, DNA repair, and DNA replication. Therefore, our study provided a reliable way to analyze the prognosis of patients with lung squamous cancer.
Abbreviation list
SCLC, small-cell lung cancer; NSCLC, non-small cell lung cancer; LUSC, lung squamous carcinoma; ROC, receiver operating characteristic; GSEA, Gene Set Enrichment Analysis; TCGA, The Cancer Genome Atlas; CI, confidence interval; HR, hazard ratio; CSRNP-1, cysteine-serine-rich nuclear protein-1.
Availability of data and material
The datasets analyzed during the current study are available from the corresponding author on reasonable request.
Acknowledgment
This work was funded by Science and Technology Project of Shenyang (F16-102-4-00).
Author contributions
All authors contributed to data analysis, drafting and revising the article, gave final approval of the version to be published, and agree to be accountable for all aspects of the work.
Disclosure
The authors report no conflicts of interest in this work.
References
1. Bray F, Ferlay J, Soerjomataram I, Siegel RL, Torre LA, Jemal A. Global cancer statistics 2018: GLOBOCAN estimates of incidence and mortality worldwide for 36 cancers in 185 countries. CA Cancer J Clin. 2018;68(6):394–424. doi:10.3322/caac.21492
2. Travis WD. Pathology of lung cancer. Clin Chest Med. 2011;32(4):669–692. doi:10.1016/j.ccm.2011.08.005
3. The Cancer Genome Atlas Research Networ.kComprehensive genomic characterization of squamous cell lung cancers. Nature. 2012;489(7417):519–525. doi:10.1038/nature11404
4. Siegel R, Naishadham D, Jemal A. Cancer statistics, 2013. CA Cancer J Clin. 2013;63(1):11–30. doi:10.3322/caac.21166
5. Heist RS, Mino-Kenudson M, Sequist LV, et al. FGFR1 amplification in squamous cell carcinoma of the lung. J Thorac Oncol. 2012;7(12):1775–1780. doi:10.1097/JTO.0b013e31826aed28
6. Liu C, Li Y, Wei M, Zhao L, Yu Y, Li G. Identification of a novel glycolysis-related gene signature that can predict the survival of patients with lung adenocarcinoma. Cell Cycle. 2019;18(5):568–579.
7. Zhang M, Liu X, Li H, Li R, Liu X, Qu Y. Elevated mRNA levels of AURKA, CDC20 and TPX2 are associated with poor prognosis of smoking related lung adenocarcinoma using bioinformatics analysis. Int J Med Sci. 2018;15(14):1676–1685. doi:10.7150/ijms.28728
8. Song Y, Tan J, Gao X, Wang L. Integrated analysis reveals key genes with prognostic value in lung adenocarcinoma. Cancer Manag Res. 2018;10:6097–6108.
9. Yang D, Cheng D, Tu Q, et al. HUWE1 controls the development of non-small cell lung cancer through down-regulation of p53. Theranostics. 2018;8(13):3517–3529. doi:10.7150/thno.24401
10. Tan J, Yang L. Long noncoding RNA VPS9D1-AS1 overexpression predicts a poor prognosis in non-small cell lung cancer. Biomed Pharmacother. 2018;106:1600–1606. doi:10.1016/j.biopha.2018.07.113
11. National Cancer Institute [home page on the Internet]. The CancerGenome Atlas. Available from: https://cancergenome.nih.gov/
12. Therneau T. A package for survival analysis. R package 2.37-2. 2012.
13. Choi HS, Jeong BK, Jeong H, et al. Application of the new 8th TNM staging system for non-small cell lung cancer: treated with curative concurrent chemoradiotherapy. Radiat Oncol. 2017;12(1). doi:10.1186/s13014-017-0848-2
14. Jia Y, Gao Y, Li J, Chang Z, Yan J, Qin Y. Prognostic implications of MYBL2 in resected Chinese gastric adenocarcinoma patients. Onco Targets Ther. 2019;12:1129–1135. doi:10.2147/OTT.S188820
15. Zuo S, Zhang X, Wang L. A RNA sequencing-based six-gene signature for survival prediction in patients with glioblastoma. Sci Rep-UK. 2019;9(1): 2615.
16. Zhou J, Zhong H, Zhang J, Jin S, Roudi R, Ma H. Development and validation of a prognostic signature for malignant pleural mesothelioma. Front Oncol. 2019;9. doi:10.3389/fonc.2019.00078
17. Gao Z, Zhang D, Duan Y, et al. A five-gene signature predicts overall survival of patients with papillary renal cell carcinoma. PLoS One. 2019;14(3):e211491. doi:10.1371/journal.pone.0211491
18. Song Q, Shang J, Yang Z, et al. Identification of an immune signature predicting prognosis risk of patients in lung adenocarcinoma. J Transl Med. 2019;17(1). doi:10.1186/s12967-019-1824-4
19. Liu Y, Zhu D, Xing H, Hou Y, Sun Y. A 6-gene risk score system constructed for predicting the clinical prognosis of pancreatic adenocarcinoma patients. Oncol Rep. 2019;41(3):1521–1530. doi:10.3892/or.2019.6979
20. Xu B, Lv W, Li X, Zhang L, Lin J. Prognostic genes of hepatocellular carcinoma based on gene coexpression network analysis. J Cell Biochem. 2019. doi:10.1002/jcb.28441
21. Yang MQ, Li D, Yang W, Zhang Y, Liu J, Tong W. A gene module-based eQTL analysis prioritizing disease genes and pathways in kidney cancer. Comput Struct Biotechnol J. 2017;15:463–470. doi:10.1016/j.csbj.2017.09.003
22. Park SK, Yang JJ, Oh S, et al. Innate immunity and Non-Hodgkin’s Lymphoma (NHL) related genes in a nested case-control study for gastric cancer risk. PLoS One. 2012;7(9):e45274. doi:10.1371/journal.pone.0045274
23. Hulbert A, Jusue-Torres I, Stark A, et al. Early detection of lung cancer using DNA promoter hypermethylation in plasma and sputum. Clin Cancer Res. 2017;23(8):1998–2005. doi:10.1158/1078-0432.CCR-16-1371
24. Guo R, Zhao C, Li P, Zhang L, Zang S, Yang B. Overexpression of CLEC18B associates with the proliferation, migration, and prognosis of glioblastoma. ASN Neuro. 2018;10:166335922. doi:10.1177/1759091418781949
25. Karimaian A, Majidinia M, Bannazadeh Baghi H, Yousefi B. The crosstalk between Wnt/-catenin signaling pathway with DNA damage response and oxidative stress: implications the crosstalk between Wnt/β-catenin signaling pathway with DNA damage response and oxidative stress: implications in cancer therapy. DNA Repair (Amst). 2017;51:14–19. doi:10.1016/j.dnarep.2017.01.003
26. Subramanian A, Kuehn H, Gould J, Tamayo P, Mesirov JP. GSEA-P: a desktop application for Gene Set Enrichment Analysis. Bioinformatics. 2007;23(23):3251–3253. doi:10.1093/bioinformatics/btm369
27. Teo MY, Bambury RM, Zabor EC, et al. DNA damage response and repair gene alterations are associated with improved survival in patients with platinum-treated advanced urothelial carcinoma. Clin Cancer Res. 2017;23(14):3610–3618. doi:10.1158/1078-0432.CCR-16-2520
 © 2019 The Author(s). This work is published and licensed by Dove Medical Press Limited. The full terms of this license are available at https://www.dovepress.com/terms.php and incorporate the Creative Commons Attribution - Non Commercial (unported, v3.0) License.
By accessing the work you hereby accept the Terms. Non-commercial uses of the work are permitted without any further permission from Dove Medical Press Limited, provided the work is properly attributed. For permission for commercial use of this work, please see paragraphs 4.2 and 5 of our Terms.
© 2019 The Author(s). This work is published and licensed by Dove Medical Press Limited. The full terms of this license are available at https://www.dovepress.com/terms.php and incorporate the Creative Commons Attribution - Non Commercial (unported, v3.0) License.
By accessing the work you hereby accept the Terms. Non-commercial uses of the work are permitted without any further permission from Dove Medical Press Limited, provided the work is properly attributed. For permission for commercial use of this work, please see paragraphs 4.2 and 5 of our Terms.