")
Back to Journals » Clinical, Cosmetic and Investigational Dermatology » Volume 15
Identification of Serum Biomarkers and Pathways of Systemic Lupus Erythematosus with Skin Involvement Through GC/MS-Based Metabolomics Analysis
Received 1 November 2021
Accepted for publication 23 December 2021
Published 18 January 2022 Volume 2022:15 Pages 77—86
DOI https://doi.org/10.2147/CCID.S345372
Checked for plagiarism Yes
Review by Single anonymous peer review
Peer reviewer comments 2
Editor who approved publication: Dr Jeffrey Weinberg
Yongyi Xie,* Baoyi Liu,* Zhouwei Wu
Department of Dermatology, Shanghai General Hospital, Shanghai Jiao Tong University School of Medicine, Shanghai, 200080, People’s Republic of China
*These authors contributed equally to this work
Correspondence: Zhouwei Wu
Department of Dermatology, Shanghai General Hospital, Shanghai Jiao Tong University School of Medicine, Shanghai, 200080, People’s Republic of China
Email [email protected]
Purpose: Skin involvement is the second most common symptom of systemic lupus erythematosus (SLE), and the prevention of skin lesion development might benefit to lessen the system inflammation burden in SLE. However, the mechanisms of skin lesion in SLE remain unclear.
Patients and Methods: Metabolome based on gas chromatography-mass spectrometry (GC-MS) was used for comparison of serum metabolism among 11 SLE patients with skin lesion (SL), 10 SLE patients without skin lesion (SNL), and 16 healthy controls (HC). The analysis of metabolism profiles was through LUG database, Human Metabolome Database (HMDB) as well as Kyoto Encyclopedia of Genes and Genomes (KEGG).
Results: A total of 14 most meaningful metabolites were found in SL patients compared to SNL patients, and 19 metabolic pathways were enriched. Meanwhile, L-alpha-aminobutyric acid, dehydroascorbic acid, glycine, and L-tyrosine achieved an area under receiver-operating characteristic (ROC) curve of 0.8636, 0.8091, 0.7727, and 0.7636, respectively, indicating their diagnostic potential for SL patients. In addition, the combined model of L-alpha-aminobutyric acid and dehydroascorbic acid provided better diagnostic accuracy.
Conclusion: The metabolomic features of SLE patients with skin lesion could be detected by GC/MS assay. Our study tried to provide new insights into the mechanism of SLE skin injury. Further validation of these findings through larger sample size studies may contribute to the use of metabolic profile analysis.
Keywords: metabolism, systemic lupus erythematosus, biomarker
Introduction
Systemic lupus erythematosus (SLE) is a complex and inflammatory autoimmune disease, resulting in multiple system damage.1 Followed by kidney, skin is the second most common organ affected in SLE patients.2 Approximately 72% to 85% of SLE patients have skin manifestation.3 It has been reported that nuclear antigen released by aberrant apoptotic keratinocytes in skin lesion could into the circulation, cause inflammatory response in different organs, and initiate the systemic disease flares.2,4 Our previous study also suggested that the severity of skin inflammation in cutaneous LE was associated with the progress of CLE to SLE.5 These data imply that the prevention of skin lesion development might benefit to lessen the system inflammation burden in SLE.
Several studies have tried to elucidate the mechanism of skin inflammatory development in SLE patients. Previous study found that injection of lupus serum could cause skin inflammation in wide-type mice, which could not be observed by IgG-depleted lupus serum,6 indicating that IgG might be involved in the skin lesion development in SLE. Meanwhile, abnormal plasmacytoid dendritic cells were found to be accumulated in SLE skin lesion. Furthermore, cytokines such as TNF, interleukin-1 (IL-1), IL-12 also contributed to the development of skin lesion in SLE.2 In addition to aberrant autoantibodies, immune cells, and cytokines, the ratio of aryl hydrocarbon receptor (AhR) in T cells also have been reported to be associated with skin injury by regulating the balance of Th17 and Treg cells.7 These evidences suggest that the exact pathogenesis of skin lesion development in SLE are much more complicated than expected.
Recently, metabolic profiling which can detect and quantify low molecular weight molecules (metabolites) in biological fluids has great value in identifying biomarkers in different diseases, including SLE. Zhang et al8 have reported that serum L-pyroglutamic acid could act as a potential diagnostic biomarker to distinguish SLE patients from healthy people. Other studies demonstrated that dysregulated metabolic pathways, such as aminoacyl-tRNA biosynthesis, was observed in fecal samples of SLE patients.9,10 In addition, Kalantari et al11 identified different metabolomics associated with lupus nephritis (LN), which could be used for non-invasive diagnosis of LN. Whereas, there is no published studies focusing on the metabolic changes between SLE patients with and without skin lesion.
In the present study, we investigated the metabolome of serum samples from SLE patients with or without skin lesion and healthy controls through gas chromatography-mass spectrometry (GC-MS). We aimed to identify the disturbed metabolic features and provide novel insights into the pathogenesis of skin lesion in SLE patients, as well as finding potential biomarkers.
Materials and Methods
Sample Collection
Twenty-one SLE patients and 16 gender- and age-matched healthy controls (HC) were enrolled in. The patients were recruited from Shanghai General hospital from January 2020 to December 2020 and all of them are Chinese Han population. The inclusion criteria included: (1) patients diagnosed by the 1997 American College of Rheumatology (ACR) revised criteria12 for classification of SLE; (2) patients and healthy controls avoided high-fat and high-protein diet before sampling which aimed to eliminate the influence of different diets on metabolomic. The exclusion criteria included: (1) patients with infections or malignancies; (2) patients and healthy controls received systemic antibiotics treatment in the 1 month before enrollment. Of 21 patients, six patients were newly diagnosed and without any treatment whereas 15 patients were diagnosed before and treated with different medications. These 15 patients could be divided into three groups according to different treatment options. Disease activity was estimated by the SLE disease activity index (SLEDAI), while active disease was defined as an SLEDAI score ≥5. Smoking is an important driver of cutaneous activity in SLE and would influence the metabolome profile significantly.13 In the present study, we confirmed that no patient smoked in each group. Meanwhile, SLE patients in the present study had no serious comorbidities, such as cardiovascular disease, infections and malignancies which could affect metabolic profile. Erythrocyte sedimentation rate (ESR), complements, C reactive protein (CRP) and autoantibodies were recorded at the time of sample collection. Fasting blood samples were taken in the morning. Then, serum samples were treated by centrifuging at 2200 rpm for 10 min and stored at −80°C immediately. This study was approved by the ethics committee of Shanghai General Hospital and all patients signed informed consent. This study was conducted in accordance with the Declaration of Helsinki.
Serum Sample Preparation
About 20 μL mixed internal standards (2-chloro-l-phenylalanine, 0.3 mg/mL in methanol) were added into 80 μL thawed serum sample, shaking for 10 s. Next, 240 μL of ice-cold methanol and acetonitrile (2:1, v/v) was added. The sample was vortexed for 30 s and sonicated by ultrasound for 10 min, and then incubated at −20 °C for 30 min. Subsequently, the mixture was centrifuged at 13,000 rpm, 4 °C for 10 min. About 150 μL of supernatant was collected and dried under vacuum at room temperature. A two-step procedure was performed to derivatize the residue before GC-MS analysis. First, the sample was redissolved with 80 μL methoxyamine, followed by vortexed and kept at 37°C for 90 min. Second, the sample was mixed with 20 μL n-hexane and 50 μL BSTFA (with 1% TMCS), vortexed vigorously and derivatized for 1 h at 70 °C. The quality control samples (QCs) were made by equal amounts of supernatant from each sample.
Instrumentation and Analytical Conditions
The pretreated samples were detected by an Agilent 7890B gas chromatography system coupled with an Agilent 5977A MSD system (Agilent Technologies Inc, CA, USA). A DB-5MS fused-silica capillary column (30 m × 0.25 mm × 0.25 μm, Agilent J & W Scientific, Folsom, CA, USA) was used to separate samples. The processed sample (1μL) was injected in splitless mode, with pure helium as the carrier gas (1.0 mL/min). GC was conducted in the temperature programming mode and injector temperature was 260 °C. The parameters of MS were as follows: ion source temperature of 230°C, MS quadrupole temperature of 150°C, collision energy of 70 eV. A full scan MS data (m/z 50–500) was acquired. The QCs were used every 10 runs to provide repeatable data.
Metabolomics Profiling
The raw data from GC-MS were processed by the MS-DIAL software and Analysis Base File Converter software. Metabolites were identified via LUG database (Lumingbio Untargeted database of GC-MS). A three-dimensional matrix was acquired by removing pseudo positive peaks and all internal standards. For multivariate statistical analysis, orthogonal partial least squares-discriminant analysis (OPLS-DA), as well as partial least squares-discriminant analysis (PLS-DA) were performed by SIMCA 12.0 software (Umetrics, Sweden). Metabolic pathway analysis was carried out through MetaboAnalyst 4.0, Human Metabolome Database (HMDB) and the Kyoto Encyclopedia of Genes and Genomes (KEGG).
Statistical Analysis
The clinical features were expressed as median (mean) or median (range). The Shapiro–Wilk test was used to test the normality of the data distribution. Ordinary one-way ANOVA was used to compare the age and BMI of three data sets, while unpaired t-test was used for other clinical features. Differential metabolites were defined as the variable importance in the projection (VIP) threshold (VIP > 1.0) and two-tailed Student’s t-test (p < 0.05). Receiver operating characteristic (ROC) curve analysis was performed to estimate the diagnostic value of significant differential metabolites. Unpaired t-test and Mann–Whitney test were used to analyze the effect of drugs on metabolites by GraphPad Prism 8.0.
Results
Clinical Features of Participants
Twenty-one SLE patients participated in the study were divided into two groups: including patients with skin lesion (SL, n = 11) and patients without skin lesion (SNL, n = 10). The median age of SL patients was 40 years, and 91% of them were female. Meanwhile, the median age of SNL patients was 39.5 years, with 90% being female. Other manifestations include renal damage, arthralgia, thrombocytopenia, oral ulcers and fever. Moreover, no significant differences in ESR, complements levels, CRP, and autoantibodies were observed between SL and SNL patients, respectively. In 21 SLE patients, 11 patients (52.4%) were active, and 10 (47.6%) were inactive. In subgroups, the frequency of active patients was 54.5% in SL group, while that of SNL patients was 50%. The classifications of medication treatments were as follows: untreated (n = 6), hydroxychloroquine alone (n = 4), hydroxychloroquine and glucocorticoid (n = 6), hydroxychloroquine, glucocorticoid combined with cyclophosphamide (n = 5). Clinical features of participants are shown in Table 1. The details of specific drugs, dose of each patient are listed in Table S1.
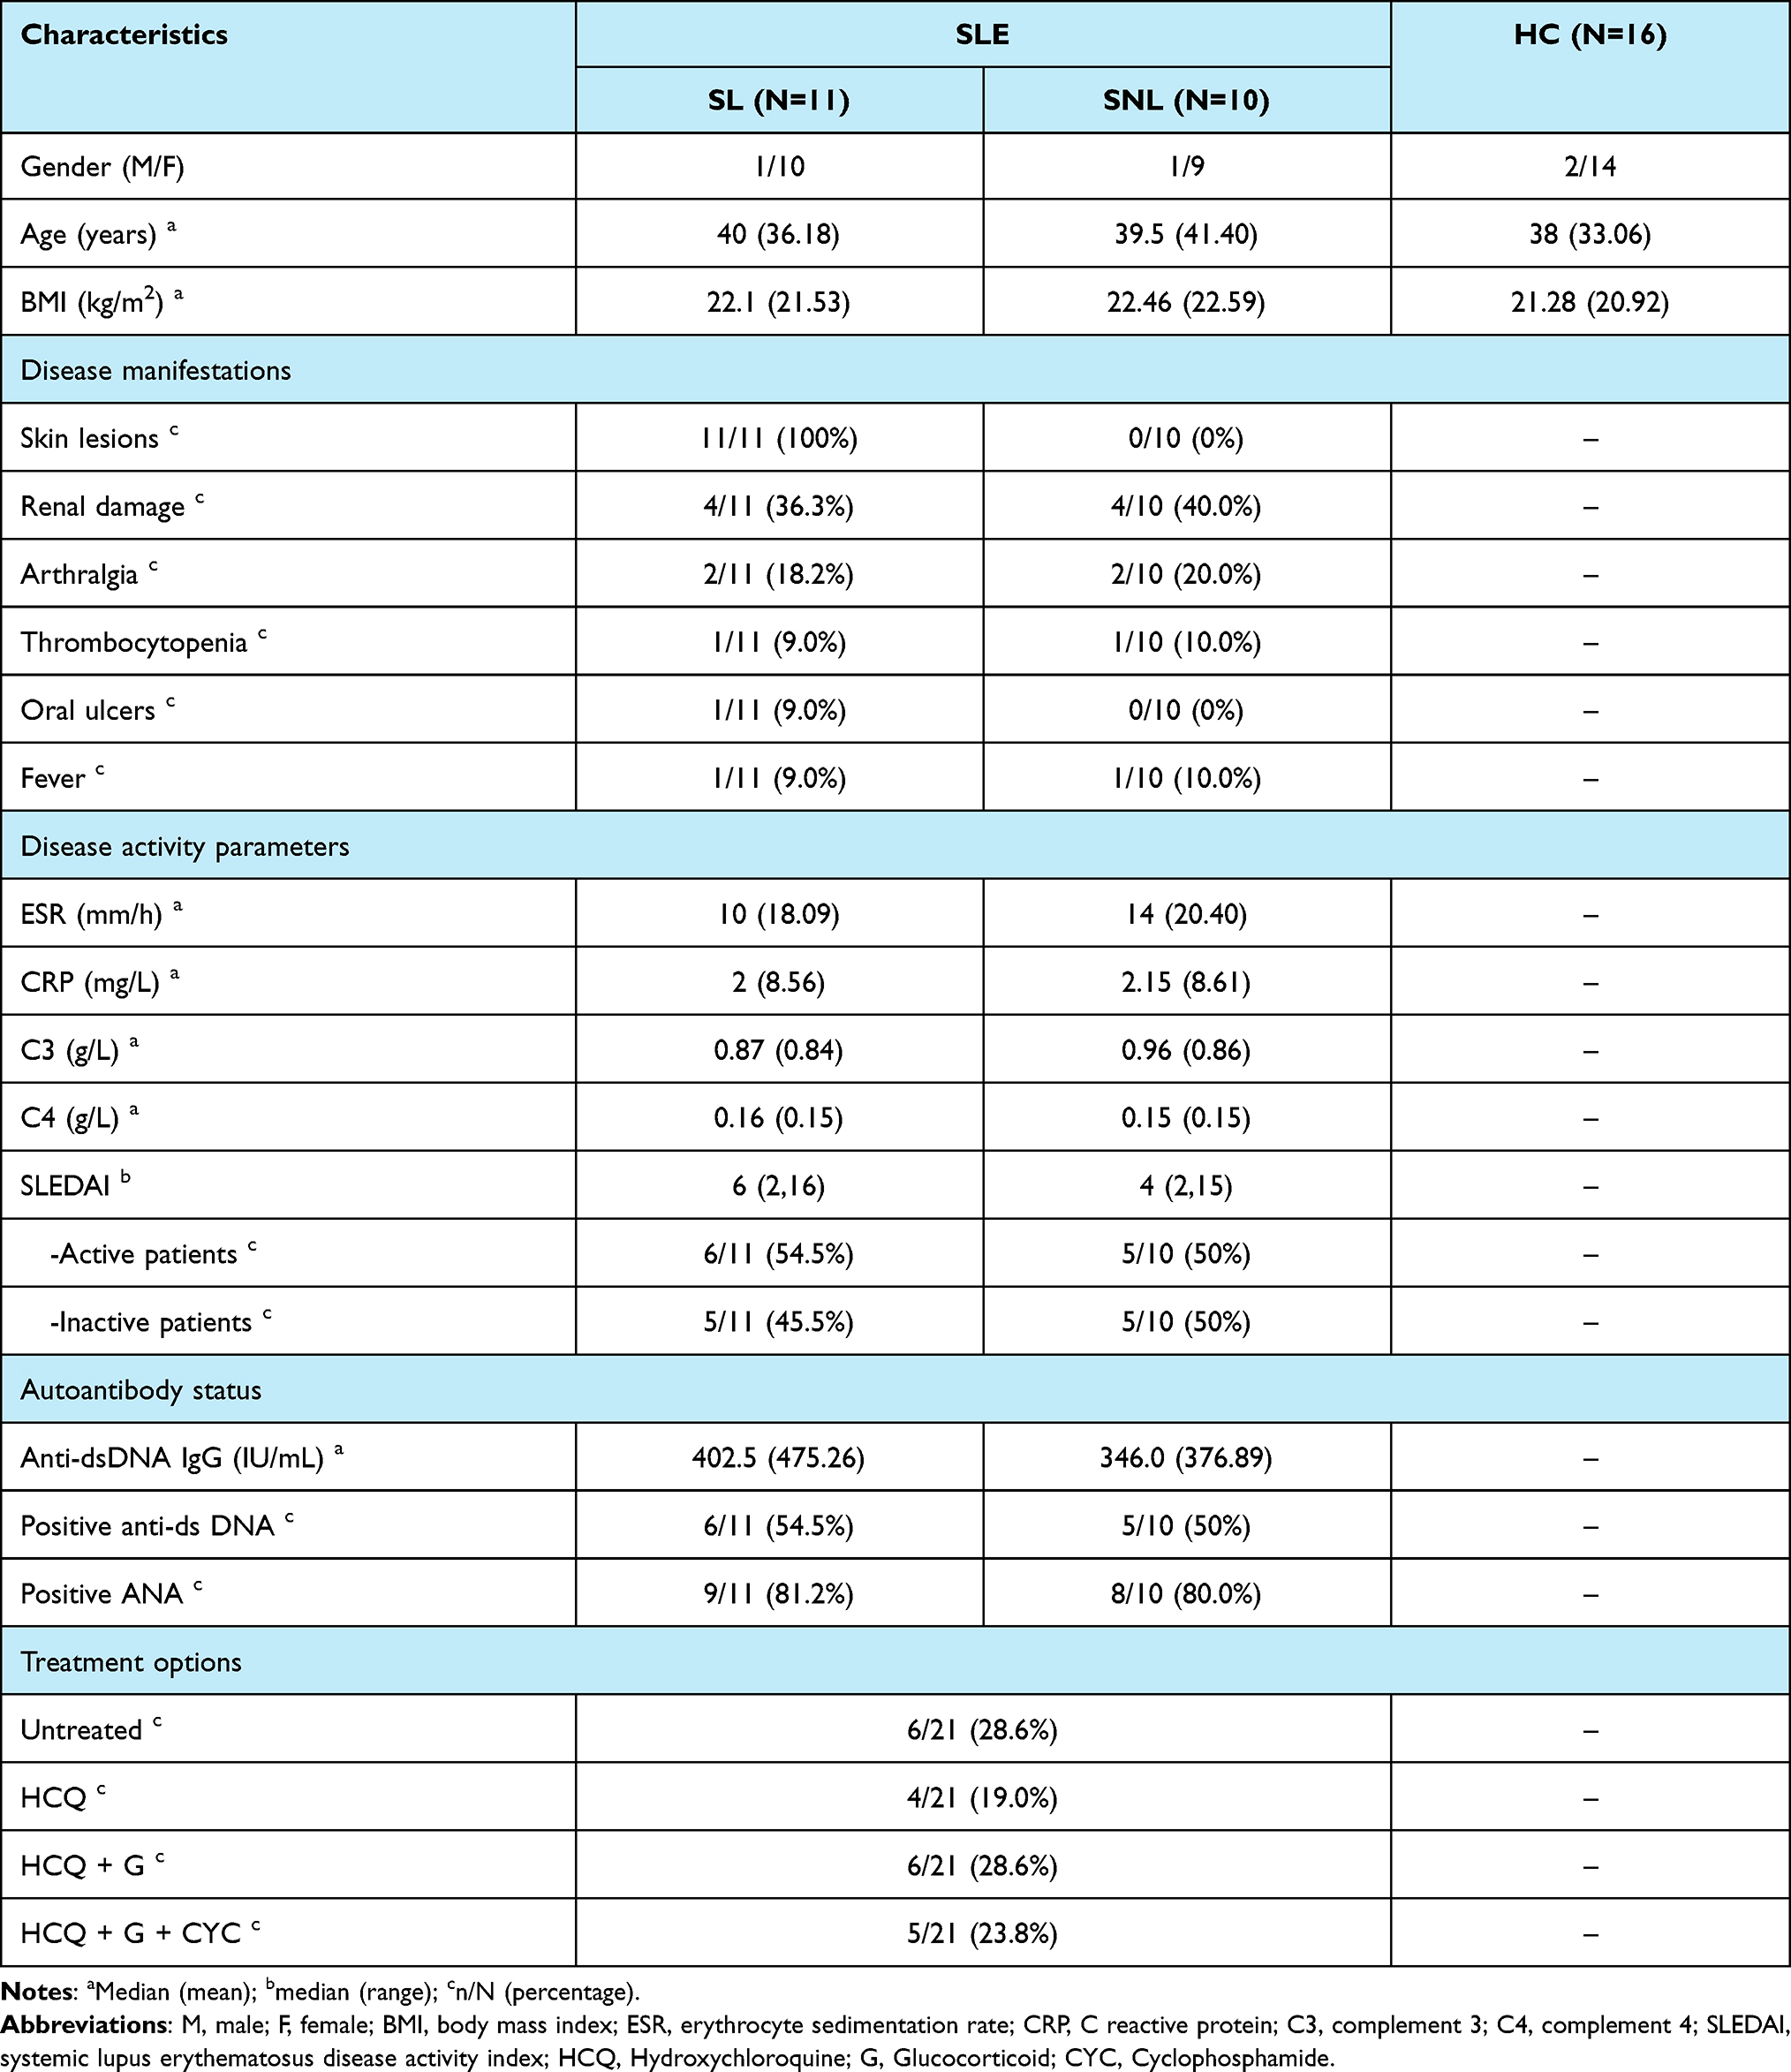 |
Table 1 Characteristics of the Study Participants |
Serum Metabolome Profiles Can Distinguish Different Groups
To identify the metabolome features, a total of 37 serum samples from SLE patients (n = 21) and HC (n = 16) were examined by GC-MS. In PLS-DA model, the SLE patients were clearly distinguished from HC, showing that there were different metabolites between SLE patients and HC (Figure 1). Next, OPLS-DA models were constructed to discriminate different subgroups. The results showed that clear separations between SL and SNL patients (Figure 2A), SL patients and HC (Figure 2B), SNL patients and HC (Figure 2C) were detected by OPLS-DA, respectively. Based on the S-plot of SL and SNL patients, we selected L-alpha-aminobutyric acid and dehydroascorbic acid for potential use of biomarkers in distinguishing these two subgroups (Figure 2D).
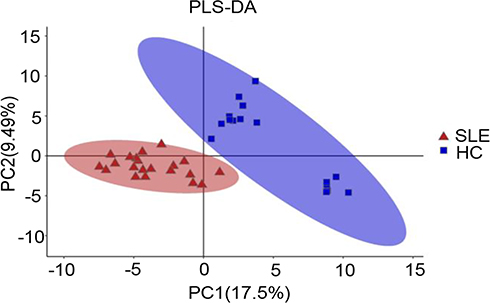 |
Figure 1 PLS-DA of serum metabolomics data distinguished total SLE patients (n= 21) from HC (n=16). The red triangles represented total SLE patients while the blue squares represented HC in the PLS-DA score plots. Abbreviations: PLS-DA, partial least squares discriminant analysis; SLE, systemic lupus erythematosus; HC, healthy controls. |
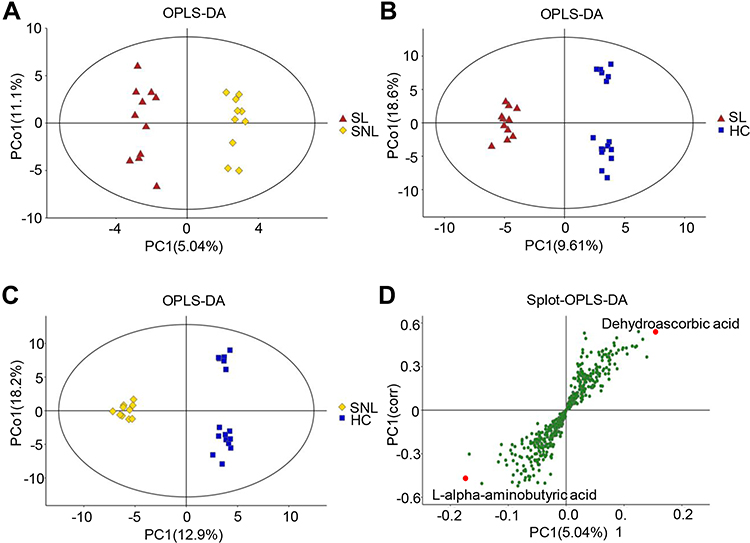 |
Figure 2 OPLS-DA could distinguish different subgroups and S-plot helps to select the potential biomarkers. (A) SL patients (red triangles) compared with SNL patients (yellow rhombus); (B) SL patients (red triangles) compared with HC (blue squares); (C) SNL patients (yellow rhombus) compared with HC (blue squares); (D) L-alpha-aminobutyric acid and dehydroascorbic acid were considered as potential biomarkers based on the S-plot. Abbreviations: OPLS-DA, orthogonal projection latent to structure discriminant analysis; SL patients, SLE patients with skin lesions; SNL, SLE patients without skin lesions. |
Altered-Metabolites in SL Patients, SNL Patients and HC Were Significantly Different
We further investigated the different distribution of metabolites among SL patients, SNL patients and HC. Features with VIP scores >1.0 and p values <0.05 were considered as the most significant metabolites. When comparing SL patients with SNL patients, a total of 14 differential metabolites were found (Table 2). Levels of L-alpha-aminobutyric acid, acrylic acid, glycine, L-aspartic, indolelactic acid, L-tyrosine, nicotinic acid, glucosamine, O-phosphoethanolamine, and rhamnose were increased in SL group. In addition, levels of dehydroascorbic acid, gluconic acid lactone, and putrescine were decreased in SL group. Moreover, beta-alanine and L-threonine were decreased in both SL and SNL patients compared to HC.
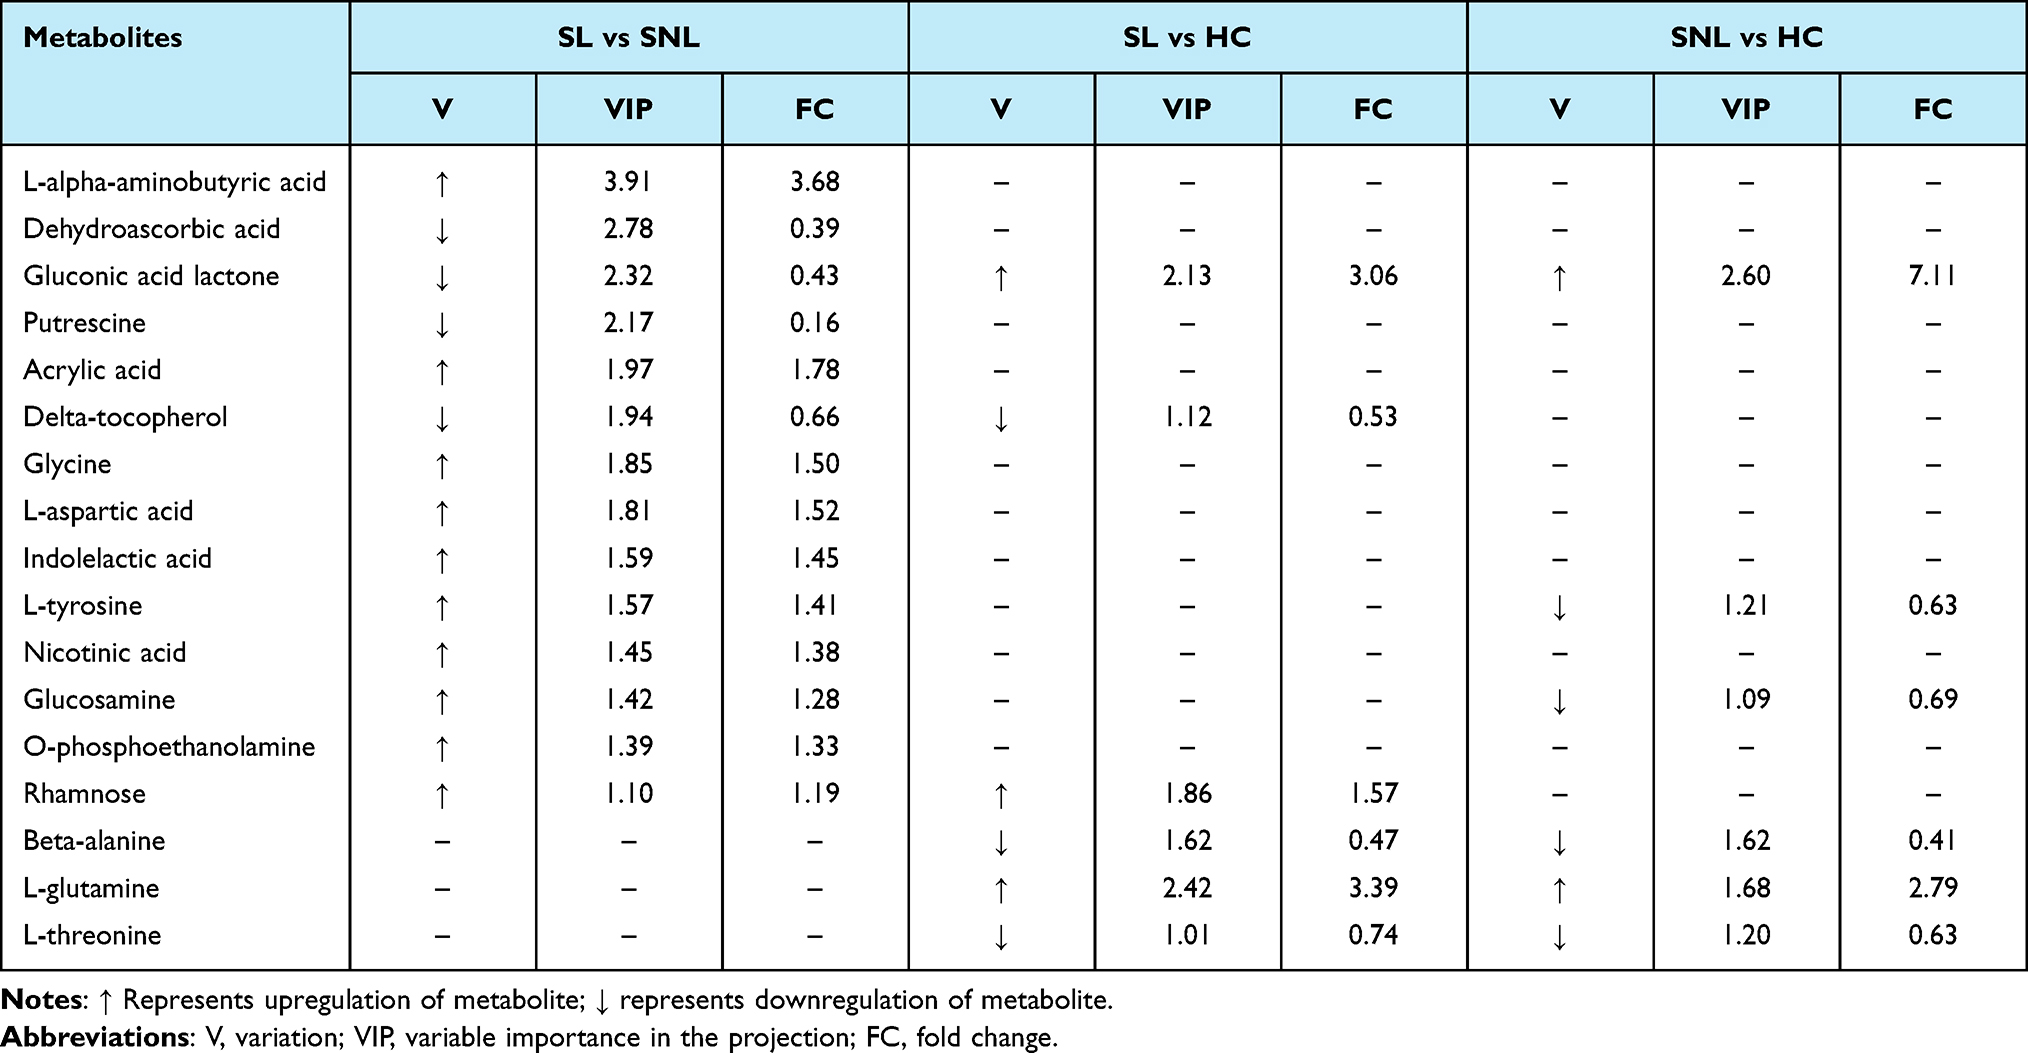 |
Table 2 Serum Identified Differential Metabolites Between Groups |
Metabolic Pathway Analysis
To identify the distinguished pathways in SL patients, analysis was performed through KEGG metabolic library. Nineteen significant pathways with p values <0.05 were detected (Figure 3A). Glutathione metabolism (p = 0.0003) was the most altered pathway in SL patients. The other top nine metabolic pathways included four amino-related pathways: aminoacyl-tRNA biosynthesis, protein digestion and absorption, glycine, serine and threonine metabolism, cysteine and methionine metabolism, and five other important pathways: central carbon metabolism in cancer, thiamine metabolism, neuroactive ligand-receptor interaction, nicotinate and nicotinamide metabolism, melanogenesis.
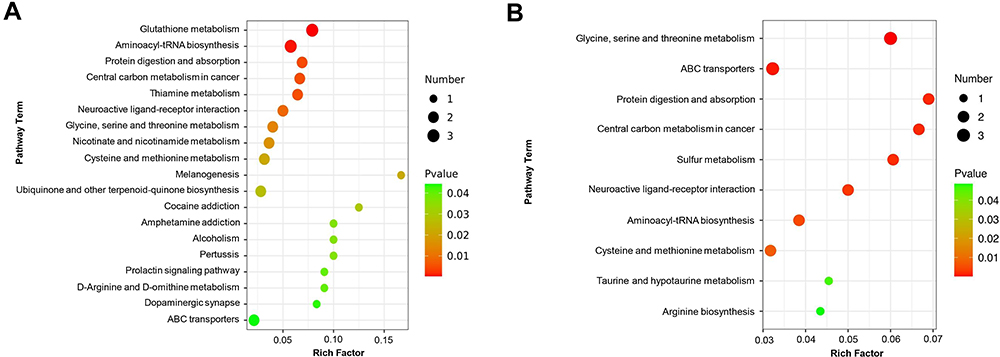 |
Figure 3 Pathway enrichment of altered metabolites. (A) Metabolites pathway enrichment between SL and SNL patients showed glutathione metabolism and aminoacyl-tRNA biosynthesis were significantly disturbed (p<0.01). (B) Pathway enrichment of altered metabolites between active and inactive patients. Circle colors represented pathway enrichment significance. Circle size indicated the number of metabolites in the specific pathway. The X-axis represented the rich factor, while the Y-axis represented pathways. |
The decreased dehydroascorbic acid and putrescine, and increased glycine were involved in glutathione metabolism. Meanwhile, increased glycine, L-aspartic acid, L-tyrosine were enriched in aminoacyl-tRNA biosynthesis.
Considering the metabolomics might be different between active (SLEDAI ≥ 5) and inactive patients (SLEDAI ≤ 4), we carried out further analysis. The result of OPLS-DA (Figure S1) showed that metabolomics could distinguish active patients from inactive patients. Meanwhile, several significant pathways, such as glycine, serine and threonine metabolism, cysteine and methionine pathway, as well as taurine and hypotaurine metabolism were enriched (Figure 3B).
Several Serum Metabolites Showed Diagnostic Potential for SLE Patients with Skin Involvement
To reveal the differential capacity of metabolites in distinguishing SL patients from SNL patients, ROC curve analysis was performed. In addition to L-alpha-aminobutyric acid and dehydroascorbic acid, the other top eight significant metabolites ranked by VIP scores between the SL and SNL group were also analyzed. The results demonstrated that an area under the ROC curve (AUC) of four metabolites, L-alpha-aminobutyric acid (AUC = 0.8636), dehydroascorbic acid (AUC = 0.8091), glycine (AUC = 0.7727), and L-tyrosine (AUC = 0.7636), respectively, indicating their good differential performance (Figure 4A–D). Furthermore, to enhance the differential capacity for SL patients, a combined model was established. The combination of L-alpha-aminobutyric acid and dehydroascorbic acid achieved an AUC of 0.9273, with specificity of 0.9 and sensitivity of 0.82, showing increased predictive capacity (Figure 4E).
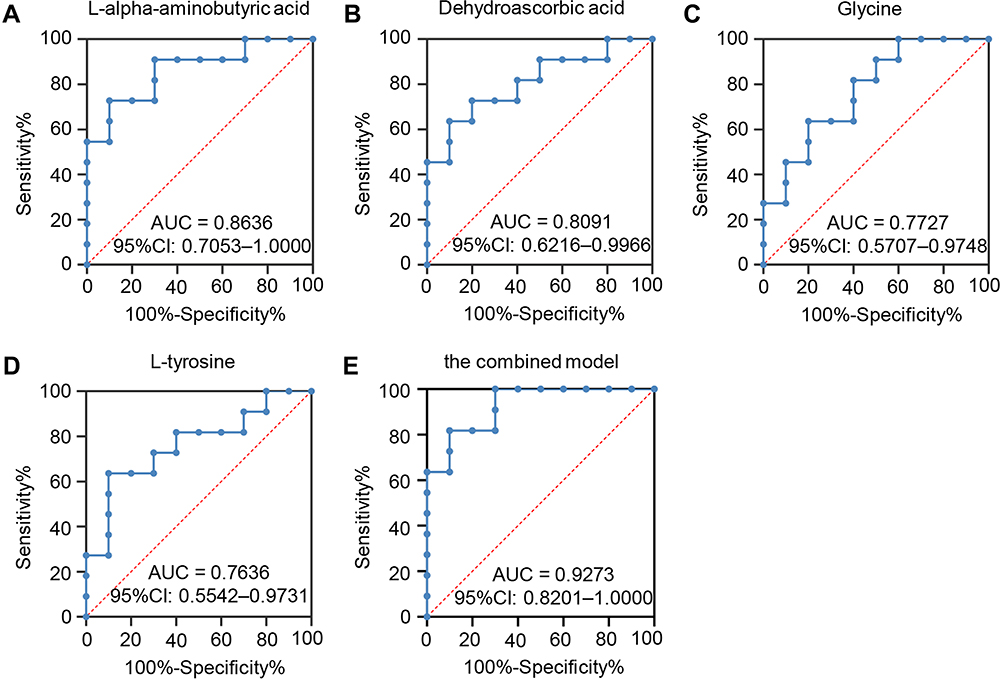 |
Figure 4 ROC analysis of potential biomarkers for differentiating SLE patients with or without rashes. (A) L-alpha-aminobutyric acid showed an AUC of 0.8636 (95% CI: 0.7053–1.000, p = 0.0049). (B) Dehydroascorbic acid presented an AUC of 0.8091 (95% CI: 0.6216–0.9966, p = 0.0167). (C) Glycine revealed an AUC of 0.7727 (95% CI: 0.5707–0.9748, p = 0.0346) and the AUC value of L-tyrosine (D) was 0.7636 (95% CI: 0.5542–0.9731, p =0.0411). (E) The combined model of L-alpha-aminobutyric acid and dehydroascorbic acid achieved an AUC of 0.9273. Abbreviation: ROC, receiver operating characteristic. |
Effects of Medications on Metabolites
Drugs usually have huge impacts on the metabolite profile, and some of our patients were under different medication treatment when collected serum samples (Table 1). Therefore, we examined whether L-alpha-aminobutyric acid and dehydroascorbic acid were influenced by medications. Different medication groups were compared to each other. The results showed that hydroxychloroquine, glucocorticoid, as well as cyclophosphamide had no effects on L-alpha-aminobutyric acid (Figure 5A–C). Likewise, dehydroascorbic acid (Figure 5D–F) was also not influenced by these medications.
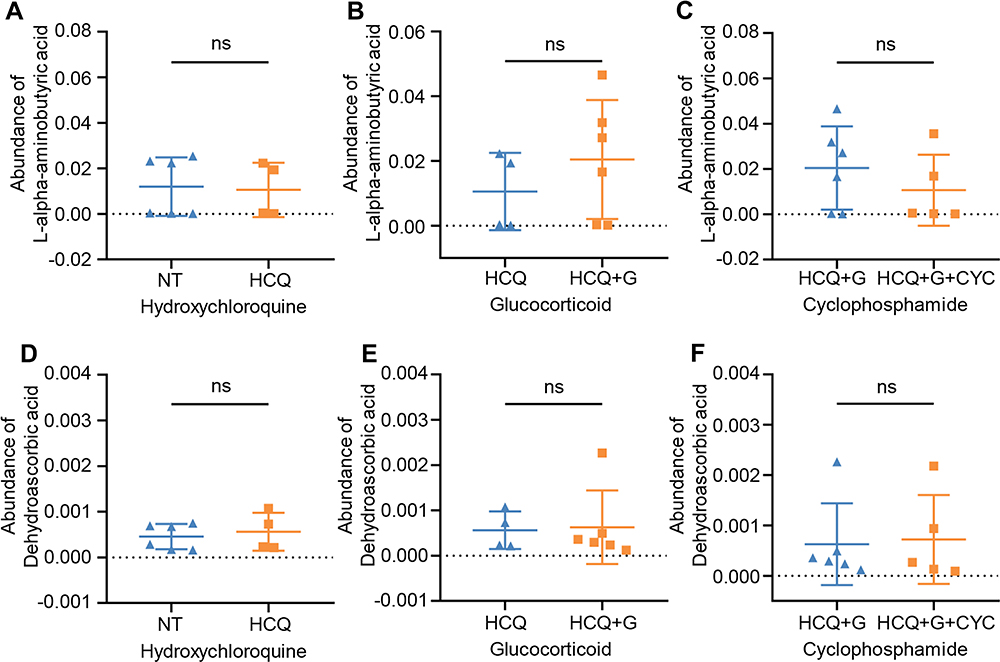 |
Figure 5 The effect of different medications on L-alpha-aminobutyric acid and dehydroascorbic acid. Treatment of hydroxychloroquine (A and D), glucocorticoid (B and E) and cyclophosphamide (C and F) did not provoke considerable variation of L-alpha-aminobutyric acid and dehydroascorbic acid. Statistical significance was performed by Mann–Whitney test and unpaired t-test. Abbreviations: ns, not significant; NT, not treated with specific drugs; HCQ, hydroxychloroquine; G, glucocorticoid; CYC, cyclophosphamide. |
Discussion
As a rapidly emerging science, metabolomes have been attracting the attention of scientific studies because of high resolution and sensitivity of spectrometry. Other metabolomics studies in SLE have revealed discrimination between SLE and normal controls using the samples of urine, fecal or blood.8–11,14 In the current study, we demonstrated that serum metabolome profiles based on GC/MS could distinguish SLE patients with skin lesion from those without lesion and healthy controls. We demonstrated that fourteen metabolites were markedly altered in SL patients compared to SNL patients. Meanwhile, a total of nineteen metabolism pathways were perturbed. Furthermore, we identified that the combination of L-alpha-aminobutyric acid and dehydroascorbic acid might predict the development of skin involvement in SLE patients. To our knowledge, this is the first study focused on changes of metabolomics in SLE patients with skin involvement.
According to published studies, L-threonine, a kind of amino acid, was reduced in SLE plasma compared with HCs.15 Moreover, Zhou et al14 revealed that SLE sera samples were characterized by decreased Beta-alanine using 1H NMR spectroscopy-based metabolomics. Consistently with their results, the reduced serum L-threonine and Beta-alanine were detected in our study indicating our results were solid and stable.
Dehydroascorbic acid (DHA, VIP = 2.78, FC = 0.39) is the oxidized form of vitamin C.16 Previous study indicated that vitamin C was involved in immune response by modulating cytokine secretion and T cell proliferation. Moreover, Th1-shifting effects of vitamin C had also been observed.17–20 T cells intake vitamin C mostly in its oxidized form, DHA.19 Our data demonstrated that the level of DHA in SL patients was lower than SNL patients, indicating that T cells of SL patients might intake more serum DHA and maybe shift into Th1. According to previous studies, Th1 might contribute to the development of SLE skin inflammation.21 Therefore, the regulatory mechanism of DHA on immune needs further investigation, which may be useful to research new therapeutic targets for SLE patients with skin injury.
Another significant altered metabolite was L-alpha-aminobutyric acid (VIP = 3.91, FC = 3.68), which was involved in cysteine and methionine metabolism, and we showed it was unregulated in SL patients compared to SNL patients. The abnormal cysteine and methionine metabolism was also observed in vitiligo patients compared to HC by Liu et al.22 It was reported that aberrant homocysteine metabolism may lead to increased oxidative damage, excessive IL-6 production, and then trigger autoimmunity and the development of vitiligo.23,24 Likewise, excessive oxidative damage was also a characteristic of SLE.25 Meanwhile, high IL-6 expression was identified in skin lesion of SLE patients,26 and the increased IL-6 expression might amplify the inflammation in lupus.27 These findings implied that the enriched cysteine and methionine metabolism pathways found in our study might contribute to the skin lesion in SLE patients via oxidative damage and IL-6 production.
The glutathione metabolism pathway was the most significant perturbed pathway in SL patients in our study, indicating skin injury in SLE was related with oxidative damage furtherly. Consistently, a previous study28 has identified the dysregulated glutathione metabolism in SLE. Yan et al15 also showed that glutamate was related to SLE skin injury, providing the evidence of oxidant/antioxidant imbalance in the pathogenesis of SLE skin involvement.
Furthermore, nicotinamide metabolism pathway which is related with DNA repair was enriched in this study. Previous evidence demonstrated that oxidized DNA damage was increased in skin lesion of SLE patients, due to the exposure of ultraviolet light and the less expression of oxoguanine glycosylase 1 (OGG1).29 Thereby, this enriched pathway may be results of cumulative DNA damage in skin, suggesting that organ damage may lead to the changes of overall metabolism. Glycine, serine and threonine metabolism and cysteine and methionine pathway were detected when active and inactive patients were compared, suggesting these pathways might be involved in the development of SLE and related with the disease activity. Meanwhile, Li et al30 revealed that taurine metabolism could enhance pDC-mediated type I IFN production and was involved in the development of SLE. We also found that taurine and hypotaurine metabolism pathway was enriched implying this pathway might be correlated with disease activity.
Individual and combined metabolites could be potential good biomarkers for different diseases. It was reported that the AUC value of combination of 2,2-dimethylsuccinic acid, beta-alanine and DOPAL was 0.89, exhibited good predictive ability of SLE.11 Similarly, we found that the AUC values of individual L-alpha-aminobutyric acid, dehydroascorbic acid, were 0.8636, 0.8091, respectively. Furthermore, the combination of L-alpha-aminobutyric acid and dehydroascorbic acid (AUC = 0.9273) predicted the skin involvement in SLE patients better.
Metabolites could be influenced by different medications. Previous studies had revealed that hydroxychloroquine could affect lipid metabolism in SLE patients.31,32 However, Zhang et al8 found hydroxychloroquine and glucocorticoid were not correlated with serum metabolite, L-pyroglutamic. Consistently, in our study, hydroxychloroquine, glucocorticoid and cyclophosphamide had no significant effect on L-alpha-aminobutyric acid and dehydroascorbic acid, indicating these metabolites were stable biomarkers.
There are some limitations in this study. Firstly, the present study was relatively limited by small sample sizes and studies with larger number of samples are required. Moreover, in order to validate clinical utility and specificity of metabolites as biomarkers for SLE patients with skin lesion, additional control groups with other inflammatory or autoimmune diseases also need to be considered. In this study, we identified differential metabolites and metabolites-related pathways in SLE patients with or without skin lesion. Meanwhile, a panel of four candidate biomarkers was proposed and a combined model might achieve a good predictive performance for SLE patients with skin lesion. These results open a new avenue to investigate the mechanism of SLE skin involvement, and might provide potential targets for treating skin lesion and prevent systemic flare.
Funding
This work was supported by NSFCGrant (Grant Number, 81773310 and 81402587).
Disclosure
The authors have declared that there is no conflict of interest.
References
1. Tsokos GC. Systemic lupus erythematosus. N Engl J Med. 2011;365(22):2110–2121. doi:10.1056/NEJMra1100359
2. Deng GM, Tsokos GC. Pathogenesis and targeted treatment of skin injury in SLE. Nat Rev Rheumatol. 2015;11:663–669. doi:10.1038/nrrheum.2015.106
3. Yell JA, Mbuagbaw J, Burge SM. Cutaneous manifestations of systemic lupus erythematosus. Br J Dermatol. 1996;135(3):355–362. doi:10.1046/j.1365-2133.1996.d01-1004.x
4. Kuhn A, Wenzel J, Weyd H. Photosensitivity, apoptosis, and cytokines in the pathogenesis of lupus erythematosus: a critical review. Clin Rev Allergy Immunol. 2014;47(2):148–162. doi:10.1007/s12016-013-8403-x
5. Xie Y, Liu B, Wu Z. Increased interleukin-9 levels in skin lesion from cutaneous lupus erythematosus patients may predict the progression to systemic lupus erythematosus. J Dermatol Sci. 2021;101:78–80. doi:10.1016/j.jdermsci.2020.10.016
6. Deng GM, Liu L, Kyttaris VC, Tsokos GC. Lupus serum IgG induces skin inflammation through the TNFR1 signaling pathway. J Immunol. 2010;184:7154–7161. doi:10.4049/jimmunol.0902514
7. Yu H, Jiang L, Liu R, et al. Association between the ratio of aryl hydrocarbon receptor (AhR) in Th17 cells to AhR in treg cells and SLE skin lesions. Int Immunopharmacol. 2019;69:257–262. doi:10.1016/j.intimp.2019.01.039
8. Zhang Q, Li X, Yin X, et al. Metabolomic profiling reveals serum L-pyroglutamic acid as a potential diagnostic biomarker for systemic lupus erythematosus. Rheumatology. 2021;60:598–606. doi:10.1093/rheumatology/keaa126
9. Yan R, Jiang H, Gu S, et al. Fecal metabolites were altered, identified as biomarkers and correlated with disease activity in patients with systemic lupus erythematosus in a GC-MS-based metabolomics study. Front Immunol. 2020;11:2138. doi:10.3389/fimmu.2020.02138
10. Zhang Q, Yin X, Wang H, et al. Fecal metabolomics and potential biomarkers for systemic lupus erythematosus. Front Immunol. 2019;10:976. doi:10.3389/fimmu.2019.00976
11. Kalantari S, Chashmniam S, Nafar M, Zakeri Z, Parvin M. Metabolomics approach reveals urine biomarkers and pathways associated with the pathogenesis of lupus nephritis. Iran J Basic Med Sci. 2019;22:1288–1295. doi:10.22038/ijbms.2019.38713.9178
12. Hochberg MC. Updating the American college of rheumatology revised criteria for the classification of systemic lupus erythematosus. Arthritis Rheum. 1997;40(9):1725. doi:10.1002/art.1780400928
13. Hsu P-C, Lan RS, Brasky TM. Metabolomic profiles of current cigarette smokers. Mol Carcinog. 2017;56(2):594–606. doi:10.1002/mc.22519
14. Zhou YJ, Li LS, Sun JL, Guan K, Wei JF. (1)H NMR-based metabolomic study of metabolic profiling for pollinosis. World Allergy Organ J. 2019;12:100005. doi:10.1016/j.waojou.2018.11.005
15. Yan B, Huang J, Zhang C, et al. Serum metabolomic profiling in patients with systemic lupus erythematosus by GC/MS. Mod Rheumatol. 2016;26:914–922. doi:10.3109/14397595.2016.1158895
16. Baldermann S, Homann T, Neugart S, et al. Selected plant metabolites involved in oxidation-reduction processes during bud dormancy and ontogenetic development in sweet cherry buds (Prunus avium L.). Molecules. 2018;23(5):1197. doi:10.3390/molecules23051197
17. Jeong YJ, Hong SW, Kim JH, et al. Vitamin C-treated murine bone marrow-derived dendritic cells preferentially drive naïve T cells into Th1 cells by increased IL-12 secretions. Cell Immunol. 2011;266:192–199. doi:10.1016/j.cellimm.2010.10.005
18. Kennes B, Dumont I, Brohee D, Hubert C, Neve P. Effect of vitamin C supplements on cell-mediated immunity in old people. Gerontology. 1983;29:305–310. doi:10.1159/000213131
19. Maeng HG, Lim H, Jeong YJ, et al. Vitamin C enters mouse T cells as dehydroascorbic acid in vitro and does not recapitulate in vivo vitamin C effects. Immunobiology. 2009;214:311–320. doi:10.1016/j.imbio.2008.09.003
20. Wintergerst ES, Maggini S, Hornig DH. Immune-enhancing role of vitamin C and zinc and effect on clinical conditions. Ann Nutr Metab. 2006;50:85–94. doi:10.1159/000090495
21. Carneiro JR, Fuzii HT, Kayser C, et al. IL-2, IL-5, TNF-α and IFN-γ mRNA expression in epidermal keratinocytes of systemic lupus erythematosus skin lesion. Clinics. 2011;66:77–82. doi:10.1590/s1807-59322011000100014
22. Liu W, Liu XY, Qian YT, et al. Urinary metabolomic investigations in vitiligo patients. Sci Rep. 2020;10:17989. doi:10.1038/s41598-020-75135-0
23. Silverberg JI, Silverberg NB. Serum homocysteine as a biomarker of vitiligo vulgaris severity: a pilot study. J Am Acad Dermatol. 2011;64:445–447. doi:10.1016/j.jaad.2010.08.025
24. Tsai TY, Kuo CY, Huang YC. Serum homocysteine, folate, and vitamin B (12) levels in patients with vitiligo and their potential roles as disease activity biomarkers: a systematic review and meta-analysis. J Am Acad Dermatol. 2019;80:646–654.e645. doi:10.1016/j.jaad.2018.08.029
25. Lightfoot YL, Blanco LP, Kaplan MJ. Metabolic abnormalities and oxidative stress in lupus. Curr Opin Rheumatol. 2017;29:442–449. doi:10.1097/bor.0000000000000413
26. Pflegerl P, Vesely P, Hantusch B, et al. Epidermal loss of JunB leads to a SLE phenotype due to hyper IL-6 signaling. Proc Natl Acad Sci U S A. 2009;106(48):20423–20428. doi:10.1073/pnas.0910371106
27. Robinson ES, Werth VP. The role of cytokines in the pathogenesis of cutaneous lupus erythematosus. Cytokine. 2015;73:326–334. doi:10.1016/j.cyto.2015.01.031
28. Gergely P
29. Tumurkhuu G, Chen S, Montano EN, et al. Oxidative DNA damage accelerates skin inflammation in pristane-induced lupus model. Front Immunol. 2020;11:554725. doi:10.3389/fimmu.2020.554725
30. Li J, Ding H, Meng Y. Taurine metabolism aggravates the progression of lupus by promoting the function of plasmacytoid dendritic cells. Arthritis Rheumatol. 2020;72(12):2106–2117. doi:10.1002/art.41419
31. Hage MP, Al-Badri MR, Azar ST. A favorable effect of hydroxychloroquine on glucose and lipid metabolism beyond its anti-inflammatory role. Ther Adv Endocrinol Metab. 2014;5(4):77–85. doi:10.1177/2042018814547204
32. Kavanaugh A, Adams-Huet B, Jain R, Denke M, McFarlin J. Hydroxychloroquine effects on lipoprotein profiles (the HELP trial): a double-blind, randomized, placebo-controlled, Pilot Study in patients with systemic lupus erythematosus. J Clin Rheumatol. 1997;3(1):3–8. doi:10.1097/00124743-199702000-00002
 © 2022 The Author(s). This work is published and licensed by Dove Medical Press Limited. The full terms of this license are available at https://www.dovepress.com/terms.php and incorporate the Creative Commons Attribution - Non Commercial (unported, v3.0) License.
By accessing the work you hereby accept the Terms. Non-commercial uses of the work are permitted without any further permission from Dove Medical Press Limited, provided the work is properly attributed. For permission for commercial use of this work, please see paragraphs 4.2 and 5 of our Terms.
© 2022 The Author(s). This work is published and licensed by Dove Medical Press Limited. The full terms of this license are available at https://www.dovepress.com/terms.php and incorporate the Creative Commons Attribution - Non Commercial (unported, v3.0) License.
By accessing the work you hereby accept the Terms. Non-commercial uses of the work are permitted without any further permission from Dove Medical Press Limited, provided the work is properly attributed. For permission for commercial use of this work, please see paragraphs 4.2 and 5 of our Terms.