")
Back to Journals » HIV/AIDS - Research and Palliative Care » Volume 7
Identification of risk factors for hepatitis B and C in Peshawar, Pakistan
Authors Shafiq M, Nadeem M , Sattar Z, Mohammad Khan S, Faheem SM, Ahsan I, Naheed R, Mehmood Khattak T, Akbar S, Talha Khan M, Ilyas Khan M, Zubair Khan M
Received 9 May 2014
Accepted for publication 27 June 2014
Published 17 August 2015 Volume 2015:7 Pages 223—231
DOI https://doi.org/10.2147/HIV.S67429
Checked for plagiarism Yes
Review by Single anonymous peer review
Peer reviewer comments 3
Muhammad Shafiq,1 Muhammad Nadeem,2 Zeeshan Sattar,3 Sohaib Mohammad Khan,2 Sheikh Muhammad Faheem,4 Irfan Ahsan,5 Rabia Naheed,6 Tahir Mehmood Khattak,2 Shahzad Akbar,7 Muhammad Talha Khan,3 Muhammad Ilyas Khan,1 Muhammad Zubair Khan8
1Department of Internal Medicine, Khyber Teaching Hospital, University Town, Peshawar, 2Department of General Surgery, Nishtar Medical College and Hospital, Dera Ghazi Khan, Punjab, 3Department of Internal Medicine, Khyber Medical College, University Campus, Peshawar, 4Department of Neurology, King Edward Medical University, Anarkali, Lahore, Pakistan; 5Department of Internal Medicine, Mayo Hospital, Phoenix, AZ, USA; 6Department of Internal Medicine, Fatima Memorial Hospital, Lahore, 7Department of Internal Medicine, Lady Reading Hospital, Andar Shehr, Peshawar, 8Department of Internal Medicine, Hayatabad Medical Complex, Hayat Abad, Pakistan
Background: Hepatitis B and C need immediate worldwide attention as the infection rates are too high. More than 240 million people have chronic (long-term) liver infections. Every year, about 600,000 people die globally due to the acute or chronic consequences of hepatitis B and more than 350,000 people die from hepatitis C-related liver diseases.
Methods: Our study was designed as a case-control, descriptive study. It was conducted through formal interviews by using structured questionnaires. A total of 100 cases were included, with four controls for each case.
Results: This study confirms household contact, history of dental work, history of surgery, sexual contact, and history of transfusion (blood and its components) as the main risk factors which are responsible for the increased prevalence of hepatitis.
Conclusion: The important risk factors, responsible for the high prevalence of hepatitis B and C in our society are household contact, history of dental work, history of surgery, sexual contact, and history of transfusion (blood and its components). The odds ratio of probability for these risk factors are: 4.2 for household contact history, 4.1 for history of dental work, 3.9 for sexual contact, 2.7 for history of surgery, and 2.1 for history of transfusion. Associations of other predictor variables (diabetes status, education level, profession, contact sports, intravenous drug abuse, residence, immunosuppression, and skin tattoos) were not statistically significant.
Keywords: hepatitis B, hepatitis C, IV drug abuse, transfusion, dental work, surgery, sexual contact
Introduction
Hepatitis B and C viruses can lead to hepatocellular carcinoma1,2 and cirrhosis-related end-stage liver disease,2,3 which are potentially life-threatening liver diseases.4 Hepatitis B and C need immediate worldwide attention as the infection rates are too high.5 More than 240 million people globally have chronic (long-term) liver infections. Every year, about 600,000 people die because of the acute or chronic consequences of hepatitis B,6 and more than 350,000 people die from hepatitis C-related liver diseases worldwide.7
In the Middle East and the Indian subcontinent, an estimated 2%–5% of the general population is chronically infected with hepatitis B.6 Countries with the highest reported prevalence rates of hepatitis C are located in Africa and Asia; areas with lower prevalence rates of hepatitis C include industrialized nations in North America and Northern and Western Europe.8 Studies9–25 have been conducted in Pakistan to assess the prevalence as well as identify the various risk factors associated with hepatitis B and C. A meta-analysis26 indicates that the prevalence of hepatitis B and C in the general population in Pakistan is 2.4% (range, 1.4%–11.0%) and 3.0% (range, 0.3%–31.9%), respectively.
In most of these studies, however, very few risk factors were included in one study at a time. Many risk factors have been identified worldwide, eg, blood transfusion,27 IV drug abuse,28 profession (health care workers, barbers, etc),29 household contact,30 sexual contact,31 surgical procedures,32 dental procedures,33 immune-compromised34,35 hemodialysis,36 skin tattoos,37 etc, but the ones responsible for the high prevalence of hepatitis B and C in our cities need to be identified. For this purpose, this study takes into account 13 variables (potential risk factors) all at once to find the association as well as the probability odds ratio.
Research design and methodology
Study design
Our study was designed as a case-control, descriptive study, and was conducted through formal interviews using structured questionnaires. A total of 100 cases (either hepatitis B or hepatitis C positive) were included, with four controls for each case.
Study population
Both outpatients and inpatients of Khyber Teaching Hospital, Peshawar, KPK, Pakistan, were included in the study.
Sampling method
For cases
Inclusion criteria were: aged 18 years and above; diagnosed for either hepatitis B or C through ICT/ELISA. Exclusion criteria were: anyone not in the Khyber Teaching Hospital, Peshawar.
For controls
Inclusion criteria were: aged: 18 years and above; Hepatitis B and C negative. Exclusion criteria were: anyone not in the Khyber Teaching Hospital, Peshawar.
Data collection
Data were collected from respondents (patients) in Khyber Teaching Hospital using a questionnaire over a 5-month period (from October 2013 to February 2014). After verbal consent was obtained, a structured questionnaire was used to conduct face-to-face interviews. The questionnaire had closed-ended questions. It was translated into the mother tongue of the respondent and then retranslated into English, and due corrections were made.
Defining variables
Profession
Based on the established facts, professions were categorized as:
- Health care professionals
- Barbers
- Sewage cleaners
- Others
Education level
The respondents were grouped into the following categories based on educational level.
- 0–4th grade: below primary
- 5th–9th grade: primary
- 10th grade: matric
- 11th–14th grade: above matric
- 15th grade or above: higher education
Diabetes
Respondents were considered to have diabetes if they had been told by a health care professional that they were diabetic. The criteria for this was to ask the individual respondents themselves and to cross-question them about the time of appearance of the symptoms and when the health care professional had diagnosed their diabetic condition. Accordingly, the respondents were categorized as:
- Diabetics
- Nondiabetics
Transfusion history
It included transfusion of whole blood or any of its components, eg, fresh frozen plasma.
Accordingly, they were categorized as:
- Transfusion history – positive
- Transfusion history – negative
Surgical history
In this category, only major surgeries that involve general anesthesia and respiratory assistance were considered.
They were categorized as:
- Surgical history– positive
- Surgical history – negative
Dental history
Anyone who had done professional cleansing, tooth filling, or tooth extraction, or had undergone dental surgery was considered as having positive dental history.
They were categorized as:
- Dental history – positive
- Dental history – negative
Contact sports
A contact sport is a sport such as football, hockey, or boxing that involves physical contact between players as part of normal play. Those who had a history of contact sports in the past 5 years were considered as having positive contact sports history.
Intravenous drug abuse
Anyone who disclosed a positive history of drug abuse was then assessed for injection drug abuse, and categorized as:
- Injection drug abuse – yes
- Injection drug abuse – no
Household contact
If someone had a family member (other than spouse) who was hepatitis B or C positive, then household contact was considered positive; otherwise negative.
Sexual contact
If someone’s spouse was infected with hepatitis B or C, sexual contact was considered positive; otherwise negative.
Rural/urban
Rural areas are places away from cities/towns. On the other hand, towns/cities are called urban areas. Depending on where the respondents lived, they were categorized as:
- Those living in places away from cities/towns – rural inhabitants
- Those living in cities/towns – urban inhabitants
Sex
People were categorized as either male or female.
Immunosuppression
Respondents were considered immunosuppressed, if they had obvious signs and symptoms of immunosuppression (eg, opportunistic infections) and the following blood counts.
Skin tattoos
Tattoos are designs on the skin made with needles and colored ink. The criterion was to ask and then see the skin tattoo objectively.
Statistical analysis
The data were sampled and entered into the SPSS worksheet for analysis. The alpha criterion was set at 0.05 (95% confidence interval [CI]). After constructing a 2×2 contingency table, chi-square without Yates correction was used to find the association between the potential risk factors and hepatitis status.
Whenever the assumption (of expected count being not less than five in each cell) did not meet the chi-square without Yates correction, Fischer’s exact test was used to find the association. Binary logistic regression was used (after meeting the assumptions) to find the influence of each statistically significant predictor variable in terms of the “odds ratio of probability”.
Results
The two-tailed P-value for Fischer’s exact test of profession: “Barber and others” and “hepatitis status” equals 0.061. Thus, the association between professions: “Barber and others” and “hepatitis status” is not considered to be statistically significant (Figure 1, Tables 1 and 2). The two-tailed P-value for Fischer’s exact test of profession: “health care professionals and others” and “hepatitis status” equals 1. Thus, the association between professions: “health care professionals and others” and “hepatitis status” is not considered to be statistically significant (Figure 1, Tables 2 and 3). The two-tailed P-value for Fischer’s exact test of profession: “savage cleaners and others” and “hepatitis status” equals 0.59. Thus, the association between professions: “savage cleaners and others” and “hepatitis status” is not considered to be statistically significant (Figure 1 and Tables 1–3).
 | Figure 1 Profession versus hepatitis status. |
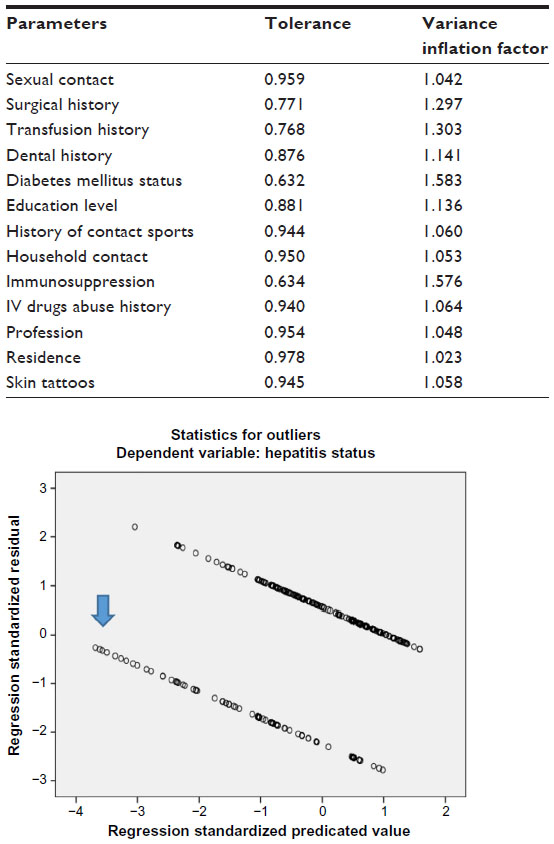 | Table 1 Collinearity diagnostics for ruling out related predictor variables |
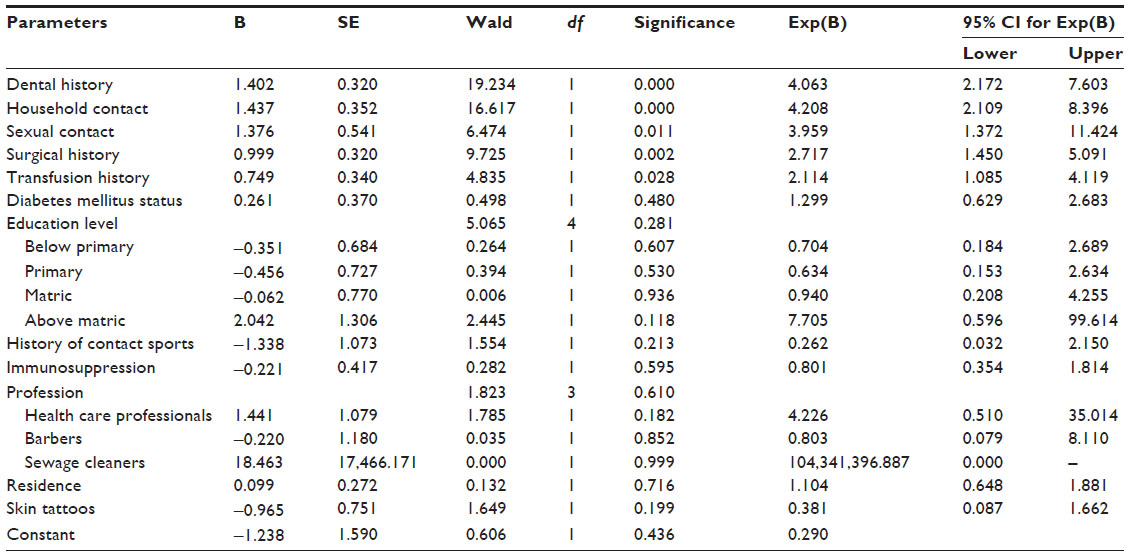 | Table 2 Variables in the equation for the binary logistic regression |
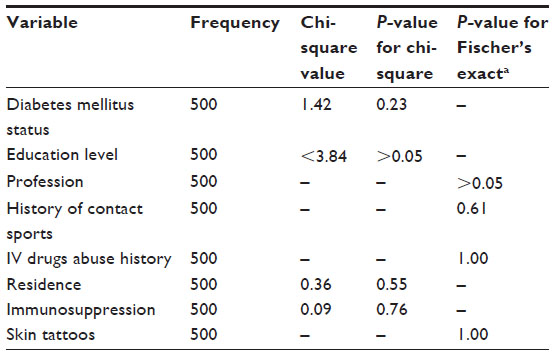 | Table 3 Variables having no association with the Hepatitis B/C as per this study |
Applying Pearson’s chi-square without Yates correction test on education level: “illiterate and primary” and “hepatitis status” shows chi-square equals 0.69 with 1 degree of freedom. The two-tailed P-value equals 0.41. Thus, the association between education level: “illiterate and primary” and “hepatitis status” is not considered to be statistically significant. Applying Pearson’s chi-square without Yates correction test on education level: “illiterate and matric” and “hepatitis status” shows chi-square equals 1.74 with 1 degree of freedom. The two-tailed P-value equals 0.19. Thus, the association between education level: “illiterate and matric” and “hepatitis status” is not considered to be statistically significant (Tables 1, 2, and 4). Applying Pearson’s chi-square without Yates correction test on education level: “illiterate and above matric” and “hepatitis status” showed chi-square equals 10.05 with 1 degree of freedom. The two-tailed P-value equals 0.002. Thus, the association between education level: “illiterate and above matric” and “hepatitis status ” is considered to be statistically significant (Tables 1, 2, and 4). Applying Pearson’s chi-square without Yates correction test on education level: “illiterate and higher education” and “hepatitis status” showed chi-square equals 2.61 with 1 degree of freedom. The two-tailed P-value equals 0.11. Thus, the association between education level: “illiterate and higher education” and “hepatitis status” is not considered to be statistically significant (Tables 1, 2, and 4).
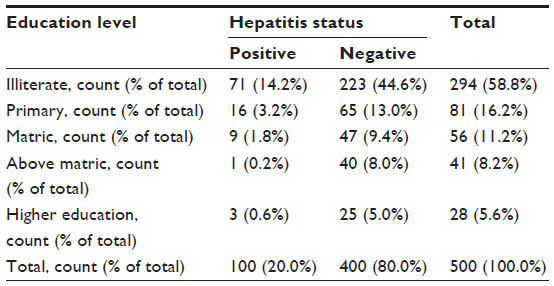 | Table 4 Education level versus hepatitis level |
Applying Pearson’s chi-square without Yates correction test on diabetes and hepatitis showed chi-square equals 1.42 with 1 degree of freedom and the two-tailed P-value equals 0.23. Thus, the association between diabetes and hepatitis status is not statistically significant (Tables 1–3, and 5).
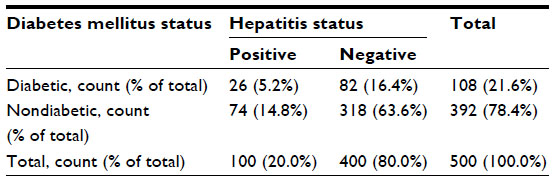 | Table 5 Diabetes mellitus status versus hepatitis status |
Applying Pearson’s chi-square without Yates correction test on transfusion history and hepatitis status shows chi-square equals 29.72 with 1 degree of freedom. The two-tailed P-value equals less than 0.001. Thus, the association between transfusion history and hepatitis status is considered to be statistically significant with an odds ratio of 3.98 (95% CI: 2.36–6.71) (Figure 2, Tables 1, 2, and 6).
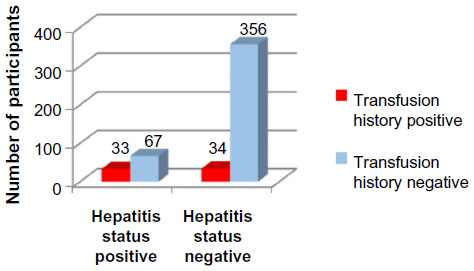 | Figure 2 Transfusion history versus hepatitis status. |
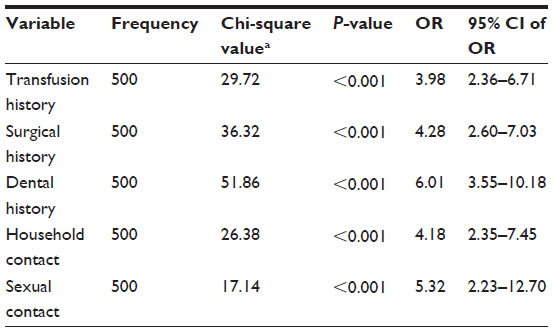 | Table 6 Significant variables |
Applying Pearson’s chi-square without Yates correction test on surgical history and hepatitis status shows chi-square equals 36.32 with 1 degree of freedom. The two-tailed P-value equals less than 0.001. Thus, the association between surgical history and hepatitis status is considered to be statistically significant with an odds ratio of 4.28 (95% CI: 2.60–7.03) (Figure 3, Tables 1, 2, and 6).
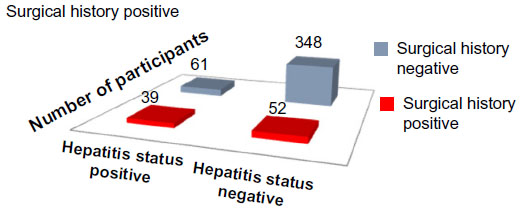 | Figure 3 Surgical history versus hepatitis status. |
Applying Pearson’s chi-square without Yates correction test on dental history and hepatitis status shows chi-square equals 51.86 with 1 degree of freedom. The two-tailed P-value equals less than 0.001. Thus, the association between dental history and hepatitis status is considered to be statistically significant with an odds ratio of 6.01 (95% CI: 3.55–10.18). (Figure 4, Tables 1, 2, and 7).
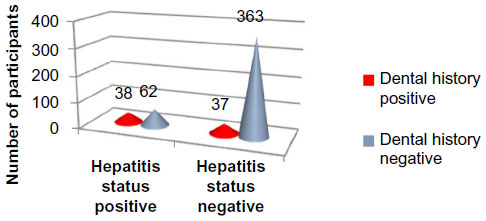 | Figure 4 Dental history versus hepatitis status. |
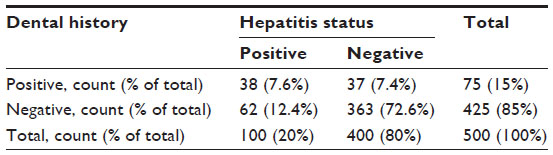 | Table 7 Dental history versus hepatitis status |
Applying Pearson’s chi-square without Yates correction test on household contact and hepatitis status shows chi-square equals 26.38 with 1 degree of freedom. The two-tailed P-value equals less than 0.001. Thus, the association between household contact and hepatitis status is considered to be statistically significant with an odds ratio of 4.18 (95% CI: 2.35–7.45) (Figure 5, Tables 1, 2, and 6).
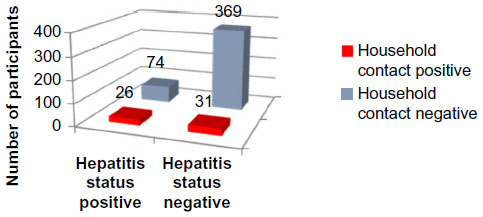 | Figure 5 Household contact history versus hepatitis status. |
Applying Pearson’s chi-square without Yates correction test on sexual contact and hepatitis status shows chi-square equals 17.14 with 1 degree of freedom. The two-tailed P-value equals less than 0.001. Thus, the association between sexual contact and hepatitis status is considered to be statistically significant with an odds ratio of 5.32 (95% CI: 2.23–12.70) (Figure 6, Tables 1, 2, and 6).
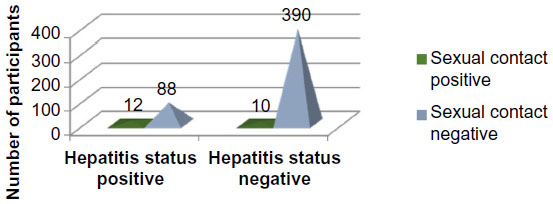 | Figure 6 Sexual contact history versus hepatitis status. |
The two-tailed P-value for Fischer’s exact test of contact sports and hepatitis status equals 0.61. Thus, the association between contact sports and hepatitis status is not considered to be statistically significant (Figure 7 and Tables 1–3).
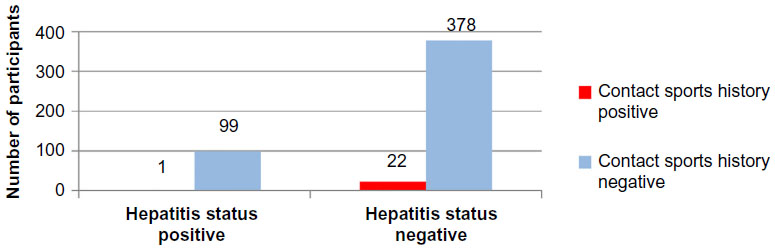 | Figure 7 Contact sports history versus hepatitis status. |
The two-tailed P-value for Fischer’s exact test of injection drug abuse and hepatitis status equals 1. Thus, the association between injection drug abuse and hepatitis status is not considered to be statistically significant (Figure 8 and Tables 1–3).
 | Figure 8 Injection drug abuse history versus hepatitis status. |
Applying Pearson’s chi-square without Yates correction test on residence and hepatitis status shows chi-square equals 0.36 with 1 degree of freedom. The two-tailed P-value equals 0.55. Thus, the association between residence and hepatitis status is not considered to be statistically significant (Figure 9 and Tables 1–3).
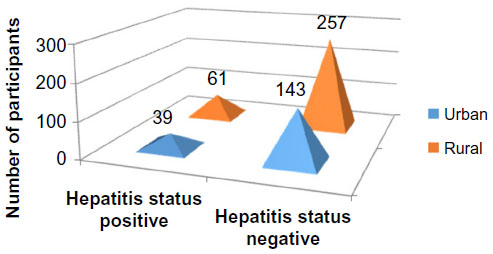 | Figure 9 Residence versus hepatitis status. |
Applying Pearson’s chi-square without Yates correction test on immunosuppression and hepatitis status shows chi-square equals 0.09 with 1 degree of freedom. The two-tailed P-value equals 0.76. Thus, the association between immunosuppression and hepatitis status is not considered to be statistically significant (Figure 10 and Tables 1–3).
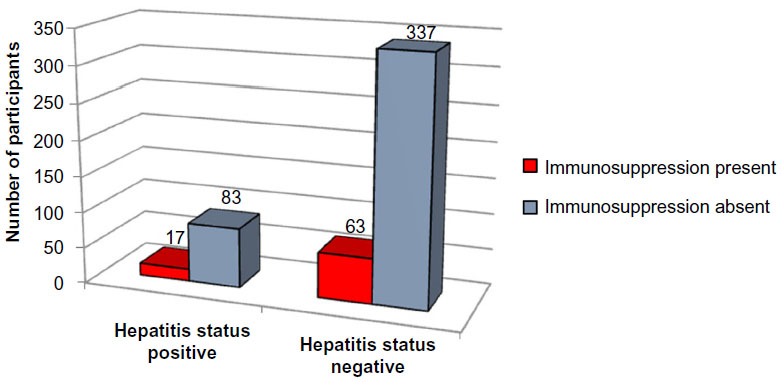 | Figure 10 Immunosuppression versus hepatitis status. |
The two-tailed P-value equals 1.0 for Fischer’s exact test of skin tattoos and hepatitis. Thus, the association between skin tattoos and hepatitis status is not considered to be statistically significant (Figure 11 and Tables 1–3).
 | Figure 11 Skin tattoos versus hepatitis status. |
Binary logistic regression
As not a single value in “tolerance” is less than 0.10 and not a single value in “variance inflation factor” is greater than 10, it signifies that there is no collinearity between the independent variables. Hence, the assumption of multicollinearity has been met for the binary logistic regression (Table 4). The assumption for outliers has also been met.
Based on the results obtained from binary logistic regression, the odds ratios of probability (Table 5) for the statistically significant predictor variables are as follows:
- Dental history: 4.063 (95% CI =2.172–7.603)
- Household contact: 4.208 (95% CI =2.109–8.396)
- Sexual contact: 3.959 (95% CI =1.372–11.424)
- Surgical history: 2.717 (95% CI =1.450–5.091)
- Transfusion history: 2.114 (95% CI =1.085–4.119)
Discussion
We found that in our society, the important risk factors for hepatitis B and C are household contact, history of dental work, history of surgery, sexual contact, and history of transfusion (blood and its components).
The individual risk factor was stratified to know the degree of its influence using binary logistic regression. It was found that the odds ratio of probability for household contact is 4.2 (this means that if a person has a history of household contact, then he is 4.2 times more likely to have the disease as compared with a person without a history of household contact). For history of dental work, sexual contact, history of surgery, and history of transfusion, the odds ratios of probability are 4.1, 3.9, 2.7, and 2.1, respectively. In the past, studies14–18,21,23,26 were conducted in Pakistan to find the prevalence of disease or to find the association of a single risk factor.9–13,20–22,24,25 However, very few studies26 have been conducted in Pakistan to include many possible risk factors in one study, even then the individual risk factor was not stratified (to find the degree of its influence).
We took many predictor variables all at once and identified the risk factors for our region. Based on the results, a targeted approach can be adopted in health prevention implementation. The predictive ability of our logistic model is 83%, which makes it a very good model.
Our study had funding limitations, and data collection was done by interns and final-year students along with their busy schedules. Because of deficiencies in the medical records, hepatitis B-positive patients and hepatitis C-positive patients were not separated during the analysis, and both were labeled as hepatitis positive. Because of the strict social norms in the city, data on sexual behavior (use or not of condoms, number of sexual partners) were not collected.
This study confirms household contact, history of dental work, history of surgery, sexual contact, and history of transfusion (blood and its components) as the main risk factors responsible for the increased prevalence of hepatitis. Therefore, all necessary precautions (eg, screening before dental and surgical procedures) should be taken not only at the individual level but also at the level of the whole population, and awareness should be increased in the general population to ensure the safety of precious lives.
Conclusion
The important risk factors responsible for the high prevalence of hepatitis B and C in our society are household contact, history of dental work, history of surgery, sexual contact, and history of transfusion (blood and its components). The odds ratio of probability for these risk factors are: 4.2 for household contact history, 4.1 for history of dental work, 3.9 for sexual contact, 2.7 for history of surgery, and 2.1 for history of transfusion. Associations of other predictor variables (diabetes status, education level, profession, contact sports, IV drug abuse, residence, immunosuppression, and skin tattoos) were not statistically significant.
Acknowledgment
We wish to thank the Khyber Teaching Hospital authorities for giving us permission to do this study.
Disclosure
The authors report no conflicts of interest in this work.
References
Sundquist K, Sundquist J, Ji J. Risk of hepatocellular carcinoma and cancers at other sites among patients diagnosed with chronic hepatitis B virus infection in Sweden. J Med Virol. 2014;86(1):18–22. | |
Shrivastava S, Mukherjee A, Ray RB. Hepatitis C virus infection, microRNA and liver disease progression. World J Hepatol. 2013;5(9):479–486. | |
Zhong LH, Jiang YM, Lou GQ, et al. The relationship between serum HBsAg levels and liver inflammation and fibrosis in patients with chronichepatitis B. Zhonghua Shi Yan He Lin Chuang Bing Du Xue Za Zhi. 2013;27(2):92–94. | |
Papadakis MA, McPhee SJ, Rabow MW. Current Medical Diagnosis and Treatment. New York, NY: McGraw Hill; 2013. | |
World Health Organization. Immunizations, vaccines and biologicals. Available from: http://www.who.int/immunization/topics/hepatitis/en/. Accessed May 20, 2015. | |
World Health Organization. Hepatitis B. Available from: http://www.who.int/mediacentre/factsheets/fs204/en/index.html. Accessed May 20, 2015. | |
World Health Organization. Hepatitis C. Available from: http://www.who.int/mediacentre/factsheets/fs164/en/index.html. Accessed May 20, 2015. | |
Shepard CW, Finelli L, Alter MJ. Global epidemiology. Lancet Infect Dis. 2005;5:558–567. | |
Khattak MF, Salamat N, Bhatti FA, Qureshi TZ. Seroprevalence of hepatitis B, C and HIV in blood donors in northern Pakistan. J Pak Med Assoc. 2002;52:398–402. | |
Akhtar S, Younus M, Adil S, Hassan F, Jafri SH. Epidemiologic study of chronic hepatitis B virus infection in male volunteer blood donors in Karachi, Pakistan. BMC Gastroenterol. 2005;5:26. | |
Abdul MS, Nanan D, Sabir S, Altaf A, Kadir M. Hepatitis B and C infection in first-time blood donors in Karachi – a possible subgroup for sentinel surveillance. East Mediterr Health J. 2006;12:735–741. | |
Sultan F, Mehmood T, Mahmood MT. Infectious pathogens in volunteer and replacement blood donors in Pakistan: a ten-year experience. Int J Infect Dis. 2007;11:407–412. | |
Luby SP, Qamruddin K, Shah AA, et al. The relationship between therapeutic injections and high prevalence of hepatitis C infection in Hafizabad, Pakistan. Epidemiol Infect. 1997;119:349–356. | |
Khokhar N, Gill ML, Malik GJ. General seroprevalence of hepatitis C and hepatitis B virus infections in population. J Coll Physicians Surg Pak. 2004;14:534–536. | |
Abbas Z, Shazi L, Jafri W. Prevalence of hepatitis B in individuals screened during a countrywide campaign in Pakistan. J Coll Physicians Surg Pak. 2006;16:497–498. | |
Mirza IA, Kazmi SM, Janjua AN. Frequency of hepatitis B surface antigen and anti-HCV in young adults – experience in southern Punjab. J Coll Physicians Surg Pak. 2007;17:114–115. | |
Parker SP, Khan HI, Cubitt WD. Detection of antibodies to hepatitis C virus in dried blood spot samples from mothers and their offspring in Lahore, Pakistan. J Clin Microbiol. 1999;37:2061–2063. | |
Aslam M, Aslam J. Seroprevalence of the antibody to hepatitis C in select groups in the Punjab region of Pakistan. J Clin Gastroenterol. 2001;33:407–417. | |
Mujeeb SA, Shahab S, Hyder AA. Geographical display of health information: study of hepatitis C infection in Karachi, Pakistan. Public Health. 2000;114:413–415. | |
Akhtar S, Younus M, Adil S, Jafri SH, Hassan F. Hepatitis C virus infection in asymptomatic male volunteer blood donors in Karachi, Pakistan. J Viral Hepat. 2004;11:527–535. | |
Muhammad N, Jan MA. Frequency of hepatitis C in Buner, NWFP. J Coll Physicians Surg Pak. 2005;15:11–14. | |
Pasha O, Luby SP, Khan AJ, Shah SA, McCormick JB, Fisher-Hoch SP. Household members of hepatitis C virus-infected people in Hafizabad, Pakistan: infection by injections from health care providers. Epidemiol Infect. 1999;123:515–518. | |
Akhtar S, Moatter T, Azam SI, Rahbar MH, Adil S. Prevalence and risk factors for intrafamilial transmission of hepatitis C virus in Karachi, Pakistan. J Viral Hepat. 2002;9:309–314. | |
Akhtar S, Moatter T. Intra-household clustering of hepatitis C virus infection in Karachi, Pakistan. Trans R Soc Trop Med Hyg. 2004;98:535–539. | |
Qureshi H, Arif A, Ahmed W, Alam SE. HCV exposure in spouses of the index cases. J Pak Med Assoc. 2007;57:175–177. | |
Ali SA, Donahue RM, Qureshi H, Vermund SH. Hepatitis B and hepatitis C in Pakistan: prevalence and risk factors. Int J Infect Dis. 2009;13(1):26. | |
Gresens CJ, Holland PV. Current risks of viral hepatitis from blood transfusions. J Gastroenterol Hepatol. 1998;13(4):443–449. | |
Tofigi H, Ghorbani M, Akhlaghi M, et al. Incidence of hepatitis B and HIV virus at cadaver of IV drug abusers in Tehran. Acta Med Iran. 2011;49(1):59–63. | |
Afridi AA, Kumar A, Sayani R. Needle stick injuries – risk and preventive factors: a study among health care workers in tertiary care hospitals in Pakistan. Glob J Health Sci. 2013;5(4):85–92. | |
Brasil LM, da Fonseca JC, de Souza RB, Braga WS, de Toledo LM. Prevalence of hepatitis B virus markers within household contacts in the State of Amazonas. Rev Soc Bras Med Trop. 2003;36(5):565–570. | |
Tahan V, Karaca C, Yildirim B, et al. Sexual transmission of HCV between spouses. Am J Gastroenterol. 2005;100:821–824. | |
Huma Q, Arif A, Riaz K, Alam SE, Ahmed W, Mujeeb SM. Determination of risk factors for hepatitis B and C in male patients suffering from chronic hepatitis. BMC Res Notes. 2009;2:212. | |
Mahboobi N, Porter SR, Karayiannis P, Alavian SM. Dental treatment as a risk factor for hepatitis B and C viral infection. J Gastrointestin Liver Dis. 2013;22(1):79–86. | |
Goossens N, Negro F. Reactivation of hepatitis B associated with immunosuppression. Rev Med Suisse. 2013;9(396):1566, 1568–1571. | |
Zachou K, Sarantopoulos A, Gatselis NK, et al. Hepatitis B virus reactivation in hepatitis B virus surface antigen negative patients receiving immunosuppression: a hidden threat. World J Hepatol. 2013;5(7):387–392. | |
Fontenele AM, Filho NS, Ferreira AS. Occult hepatitis B in patients on hemodialysis. Ann Hepatol. 2013;12(4):527–531. | |
Carney K, Dhalla S, Aytaman A, Tenner CT, Francois F. Association of tattooing and hepatitis C virus infection: a multicenter case-control study. Hepatology. 2013;57(6):2117–2123. | |
Clinical Center, National Institute of Health. Available from: http://www.cc.nih.gov/ccc/patient_education/pepubs/cbc.pdf. Accessed: June 24, 2015 | |
US Department of Health and Human Services. Available from: https://aidsinfo.nih.gov/education-materials/fact-sheets/print/21/52/0/0. Accessed May 20, 2015. |
 © 2015 The Author(s). This work is published and licensed by Dove Medical Press Limited. The full terms of this license are available at https://www.dovepress.com/terms.php and incorporate the Creative Commons Attribution - Non Commercial (unported, v3.0) License.
By accessing the work you hereby accept the Terms. Non-commercial uses of the work are permitted without any further permission from Dove Medical Press Limited, provided the work is properly attributed. For permission for commercial use of this work, please see paragraphs 4.2 and 5 of our Terms.
© 2015 The Author(s). This work is published and licensed by Dove Medical Press Limited. The full terms of this license are available at https://www.dovepress.com/terms.php and incorporate the Creative Commons Attribution - Non Commercial (unported, v3.0) License.
By accessing the work you hereby accept the Terms. Non-commercial uses of the work are permitted without any further permission from Dove Medical Press Limited, provided the work is properly attributed. For permission for commercial use of this work, please see paragraphs 4.2 and 5 of our Terms.