")
Back to Journals » International Journal of General Medicine » Volume 14
Identification of Prognosis-Related RNA-Binding Proteins to Reveal the Role of RNA-Binding Proteins in the Progression and Prognosis of Colon Cancer
Authors Ding Y, Fang L, Yang XP, Zou Q
Received 23 July 2021
Accepted for publication 20 September 2021
Published 14 October 2021 Volume 2021:14 Pages 6795—6805
DOI https://doi.org/10.2147/IJGM.S330863
Checked for plagiarism Yes
Review by Single anonymous peer review
Peer reviewer comments 2
Editor who approved publication: Dr Scott Fraser
Yue Ding,1,* Lei Fang,2,* Xiao-Ping Yang,3 Qi Zou1
1Department of General Surgery, Shanghai Pudong Hospital, Fudan University Pudong Medical Center, Shanghai, 201399, People’s Republic of China; 2Department of Radiology, Shanghai Pudong Hospital, Fudan University Pudong Medical Center, Shanghai, 201399, People’s Republic of China; 3Department of Hepatobiliary Pancreatic Surgery, First Hospital of Ningbo City, Ningbo, 315010, People’s Republic of China
*These authors contributed equally to this work
Correspondence: Qi Zou
Department of General Surgery, Shanghai Pudong Hospital, Fudan University Pudong Medical Center, Shanghai, 201399, People’s Republic of China
Tel +86 18918355163
Fax +86 021-68035001
Email [email protected]
Xiao-Ping Yang
Department of Hepatobiliary Pancreatic Surgery, First Hospital of Ningbo City, No. 59 of Liuting Street, Haishu District, Ningbo, 315010, People’s Republic of China
Tel +86 18757177966
Fax +86 0574-87085588
Email [email protected]
Background: RNA binding proteins (RBPs) are now under discussion as novel promising bio-markers for patients with colon cancer. The purpose of our study is to identify several RBPs related to the progression and prognosis of colon cancer and to further investigate the mechanism of their influence on tumor progression.
Methods: The transcriptome data of colon cancer and clinical characteristics were downloaded from The Cancer Genome Atlas (TCGA) database. Gene ontology (GO), Kyoto Encyclopedia of Genes and Genomes (KEGG) analysis, and Gene Set Enrichment Analysis (GSEA) were performed to elucidate the gene functions and relative pathways. Cox and Lasso regression analyses were used to analyze the effect of immune genes on the prognosis of colon cancer. An immune risk scoring model was constructed based on the statistical correlation between hub immune genes and survival. Meanwhile, multivariate Cox regression analysis was utilized to investigate whether the immune gene risk score model was an independent factor for predicting the prognosis of colon cancer. A nomogram was constructed to comprehensively predict the survival rate of colon cancer. P < 0.05 was considered statistically significant.
Results: The results showed that 473 RBPs exhibited differential expression between normal and colon cancer tissues (P < 0.05). Univariate Cox regression analysis revealed 25 RBPs statistically correlated with colon cancer-related survival risk (P < 0.05). In addition, a 10-RBPs based risk scoring model was constructed through multivariate Cox regression analysis. A K–M curve indicated that high-risk patients were associated with poor outcomes (P < 0.001). A ROC curve indicated that the immune risk score model was reliable in predicting survival risk (5-year overall survival (OS), area under curve (AUC) = 0.782). Our model showed satisfying AUC and survival correlation in the validation dataset (5-year OS, AUC = 0.744). Furthermore, multivariate Cox regression analysis confirmed that the immune risk score model was an independent factor for predicting the prognosis of colon cancer. Finally, we found that 10-RBPs and risk scores were significantly associated with clinical factors and prognosis and were involved in multiple oncogenic pathways.
Conclusion: Collectively, RBPs play an essential role in the progression and prognosis of colon cancer by regulating multiple biological pathways. Furthermore, the RBP risk score was an independent predictive factor of colon cancer, indicating poor survival.
Keywords: RNA binding proteins, RBPs, colon cancer, prognosis, risk model
Introduction
Colon cancer, a major malignancy of the alimentary canal, ranked third among malignant tumors in terms of morbidity worldwide.1 A relevant study revealed that more than one million people develop colon cancer each year, and the disease-specific mortality rate in developed countries was approximately 33%.2 The mortality of colon cancer is on the rise due to changes in diet and lifestyle.3 Although colon cancer treatment options (eg, surgery, chemoradiotherapy, and immunotherapy) have greatly improved, the 5-year survival rate remains in a low level.
RNA binding proteins (RBPs) are a variety of proteins that interact with RNA, which are widely expressed in cells.4–6 Through high-throughput screening, 1542 RBPs were identified, accounting for 7.5% of all protein-coding genes.7 These RBPs affect post-transcriptional events and regulate the physiological events of cells, thus, involved in many biological processes, such as RNA splicing, mRNA stabilization, and protein translation.4,8 As RBPs play a variety of key functions in post-transcriptional events, the changes of RBPs are related to the occurrence and development of many human diseases. Some RBPs were also aberrantly changed in tumors, which influenced the translation of mRNA to protein level. For instance, due to the silence of miR-34a, dysregulated expression of IGF2BP3 accelerates gastric carcinogenesis.9 QKI-5 regulates cell proliferation in lung cancer by changing cancer-associated alternative splicing.10 However, the role of RBPs in the development of colorectal cancer remains unclear.
The Cancer Genome Atlas (TCGA) is the largest cancer database, containing samples of more than 20,000 primary cancers and normal matched samples of multiple cancer types. Therefore, we can investigate tumor gene data in greater depth with bioinformatics methods. Furthermore, it can be linked to clinical data to obtain more valuable and meaningful results. Here, we described the expression and lineage of RBPs in colon cancer and investigated the mechanisms of RBPs in the development and prognosis of colon cancer.
Methods and Materials
Data Acquisition
We identified and downloaded the transcriptome data of patients with colon cancer from the TCGA database through the R package, including 41 cases of paracancerous normal tissue and 473 cases of tumor tissue. Furthermore, relevant clinical information of the 473 colon cancer patients was obtained, such as age, gender, stage, tumor, lymph node and metastasis stage, survival status, and survival duration (Table 1). Finally, the “Limma” package in R software was utilized to correct the downloaded transcriptome data.
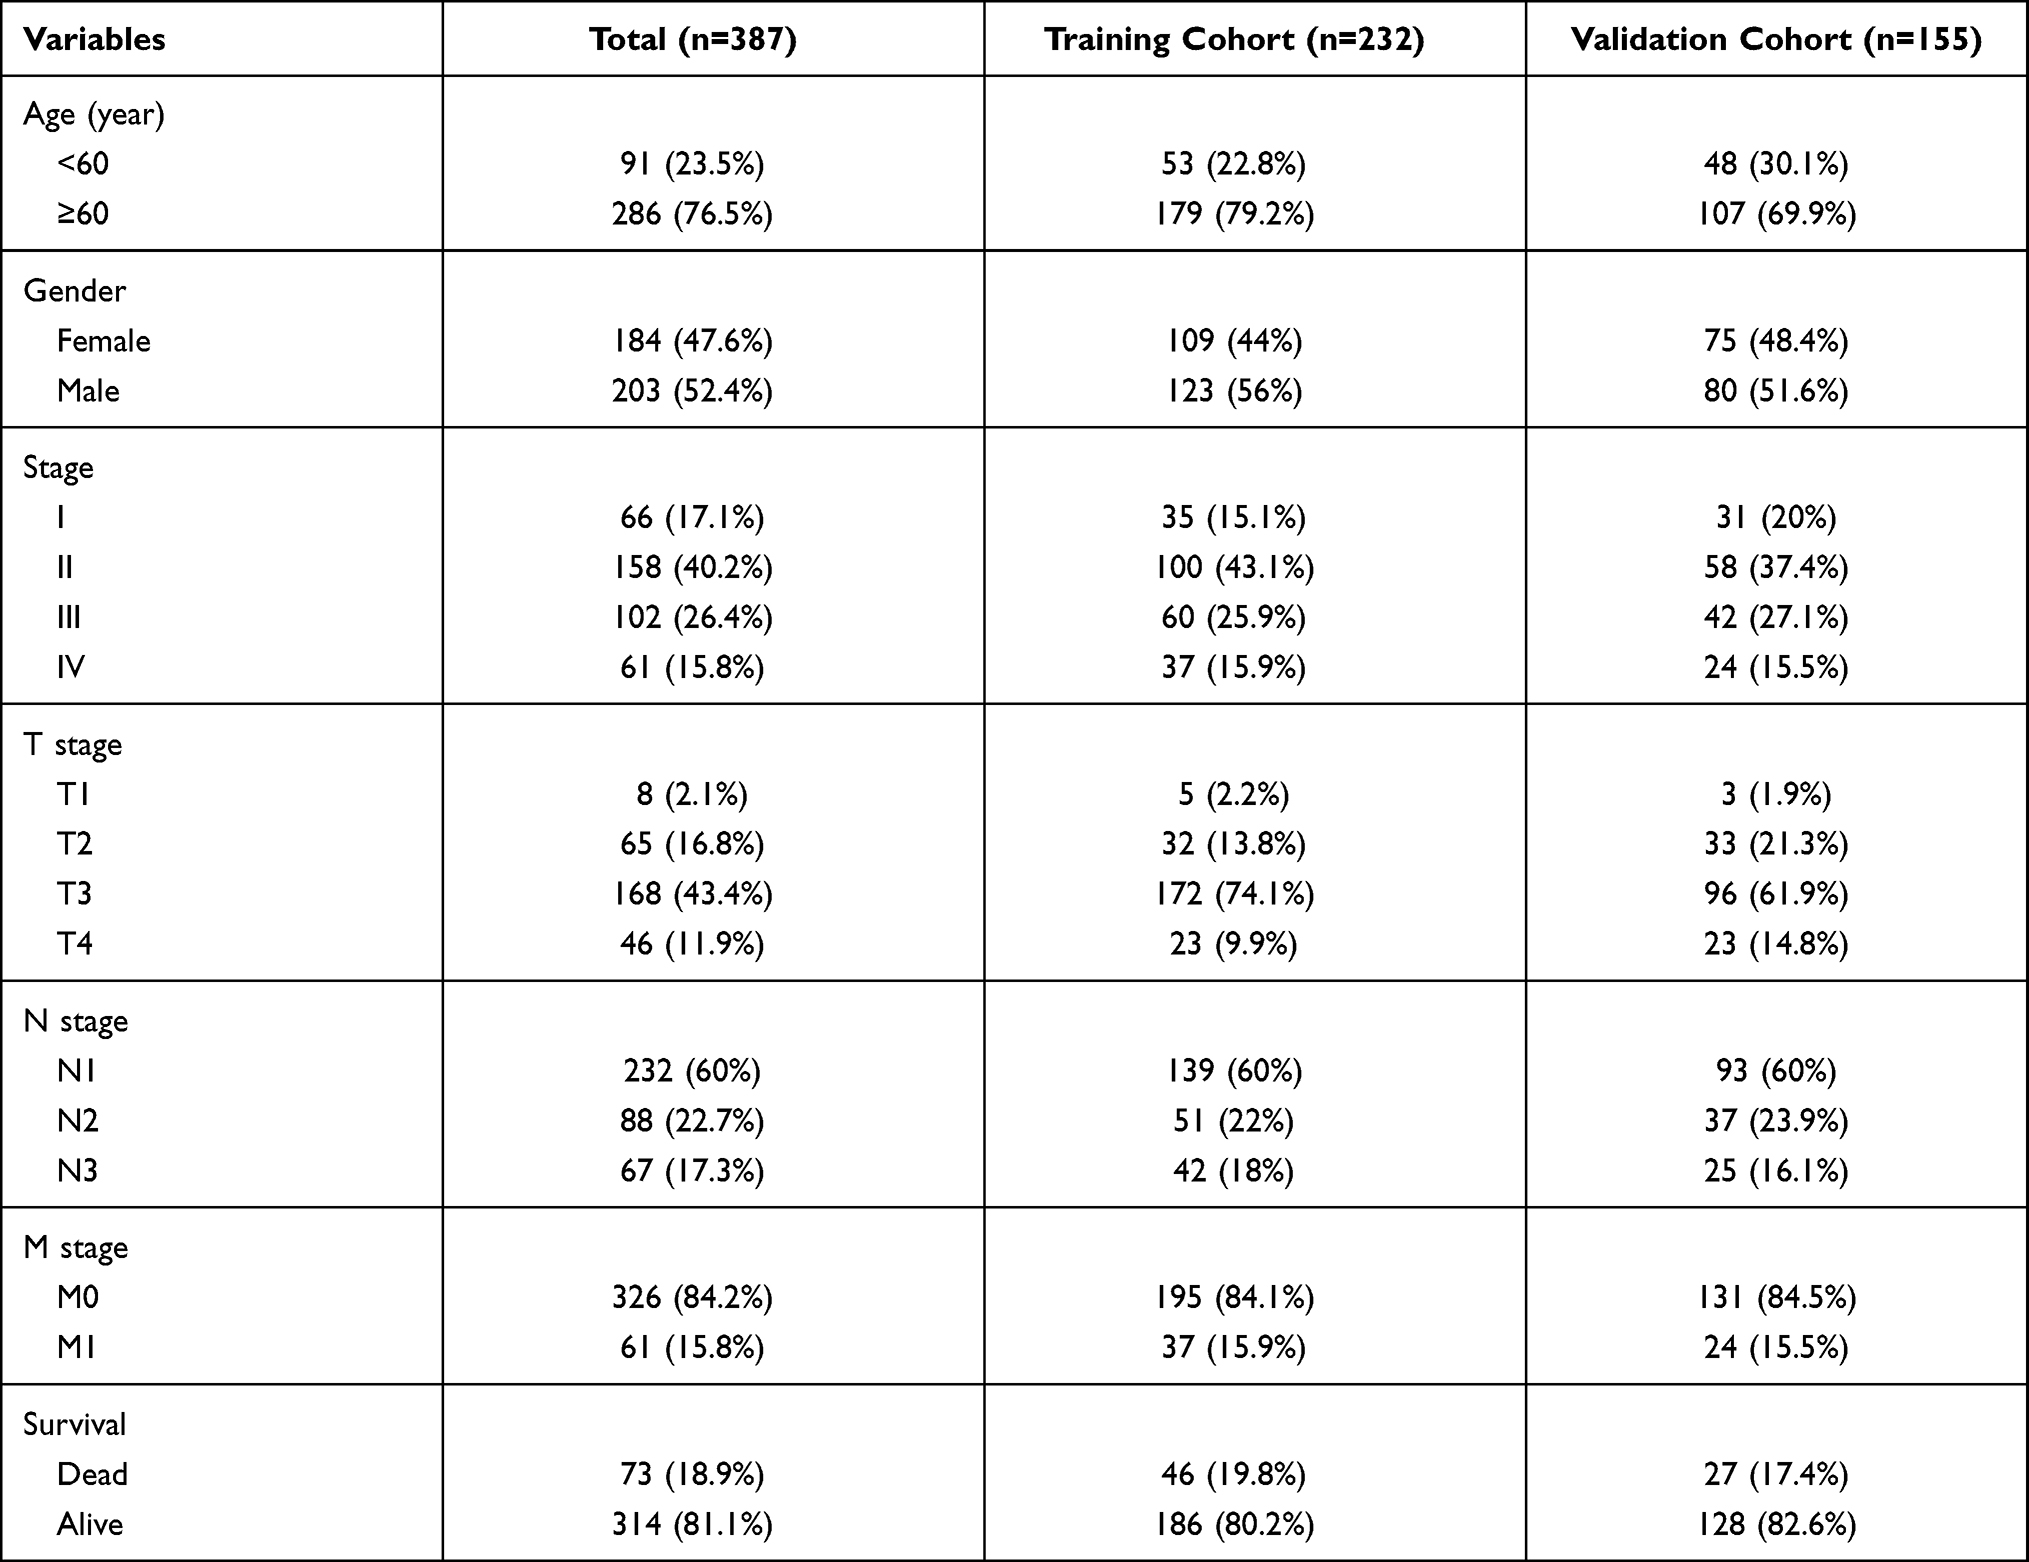 |
Table 1 Clinical Characteristics of Included Patients in the Study |
Gene Function Enrichment Analysis
In order to explore the major biological process of selected hub genes, methods were utilized to conduct the gene functional enrichment analyses, including Kyoto Encyclopedia of Genes and Genomes (KEGG) and gene ontology (GO). We utilized the Database for Annotation, Visualization, and Integrated Discovery (DAVID, https://david.ncifcrf.gov/) to identify enriched KEGG and GO themes.
Survival Analysis and Expression Comparison of Hub Genes
Clinical information for TCGA colon cancer, including survival time, survival state, and tumor, nodes, metastases (TNM) staging, were also downloaded from the TCGA database (samples with missing information were excluded). The survival R package was applied in survival analyses for hub genes. For the overall survival rates, the Log rank test was used to detect significant differences. The results were visualized using Kaplan–Meier survival curves, and a P-value <0.05 was considered statistically significant.
Gene Set Enrichment Analysis
Gene set enrichment analysis (GSEA) (version 3.0, The Broad Institute of MIT and Harvard, http://software.broadinstitute.org/gsea/downloads.jsp) was conducted between colon cancer and paracancerous normal tissues to study the biological characteristics of colon cancer. In detail, the “collapse data set to gene symbols” was set to false, the number of marks was set to 1000, the “permutation type” was set to phenotype, the “enrichment statistic” was set to weighted, and the Signal-to-Noise metric was used for ranking genes. The high expression group was used as the experimental group, and the low expression group was used as the reference group. The “c2.cp.kegg.v7.0.symbols.gmt” gene sets database was used for enrichment analysis. A gene set size >500 and <15, false discovery rate (FDR) <0.25, and nominal P-values <0.05 were regarded as the cut-off criteria.
Statistical Analysis
All analyses were performed using R 3.6.1. All statistical tests were two-sided, and a P-value <0.05 was considered statistically significant. Continuous variables that conformed to the normal distribution were compared with an independent t-test for comparison between groups, while continuous variables with skewed distribution were compared with the Mann–Whitney U-test. The correlation matrix was constructed by R software based on Pearson’s Correlation Coefficient. The relationship between immune cell infiltration and overall survival was analyzed through the Kaplan–Meier curve, which was evaluated by the Log rank test. Time-dependent receiver operating characteristics (ROC) curves were used to analyze the sensitivity and specificity of the recurrence prediction model. The univariate and multivariate regression models were used to analyze the effects of individual variables on survival. The nomogram was constructed with the regression coefficients based on the Cox analysis.
Results
Differential Expression Screening of Colon Cancer
The transcriptome data of 473 colon cancer cases and 41 adjacent normal tissue cases were obtained from the TCGA database for differential expression analysis. A total of 473 RBPs were identified as differentially expressed RBPs (DERBPs) between colon cancer and normal tissues, including 321 upregulated and 152 downregulated (P < 0.05, Figure 1A, Table 2). The heatmap of the top 10 upregulated and top 10 downregulated DERBPs is shown in Figure 1B.
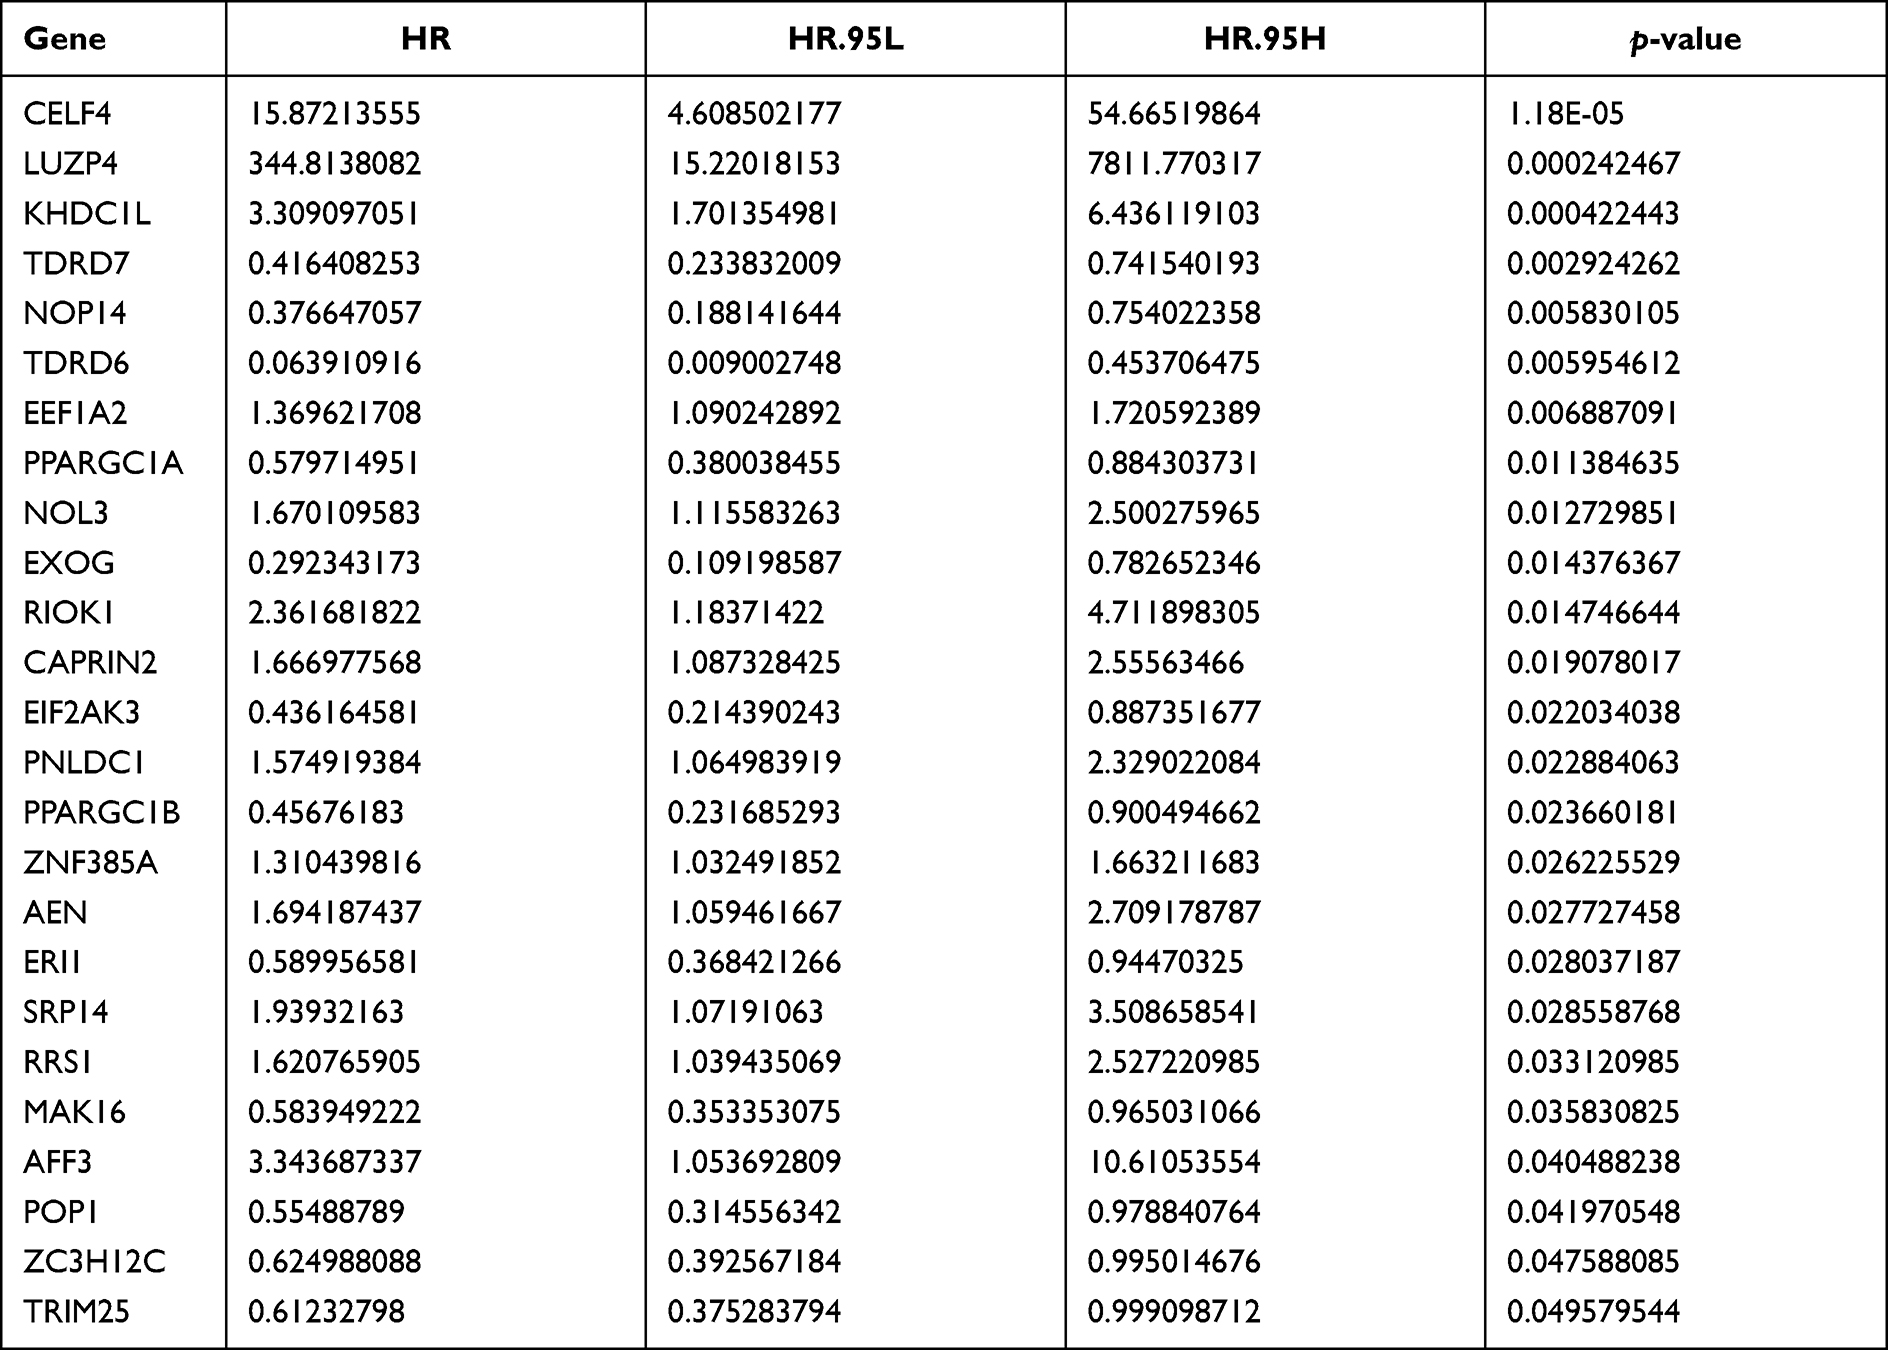 |
Table 2 Univariate Cox Regression Analysis to Screen RNA Binding Proteins Associated with Overall Survival in Colon Cancer Patients |
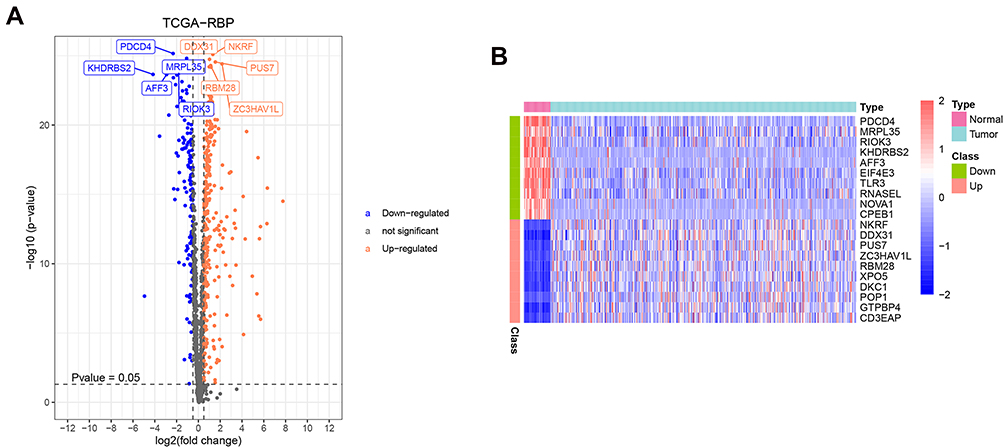 |
Figure 1 Identification of DERBPs. (A) volcano plots of 473 DERBPs in colon cancer and normal tissues from TCGA database. (B) Heatmap plots of top 10 up-regulated and top 10 down-regulated DERBPs. The colors in the heatmaps from green to red represent expression level from low to high. The red dots in the volcano plots represent up-regulation, the green dots represent down-regulation and black dots represent genes without differential expression. |
Functional Annotation of the 473 DERBPs
In order to fully understand the biological attributes of these 473 DERBPs, we conducted KEGG and GO analysis. Based on the results of DAVID, the top three enriched GO terms for upregulated genes and downregulated genes were ncRNA processing, ribosome biogenesis and rRNA metabolic processing, RNA splicing, regulation of translation and regulation of cellular amide metabolic processing (Figure 2A). The top biological pathways enriched for upregulated genes and downregulated genes were ribosome biogenesis in eukaryotes, RNA transport and spliceosome, spliceosome, and RNA transport and influenza A pathways (Figure 2B).
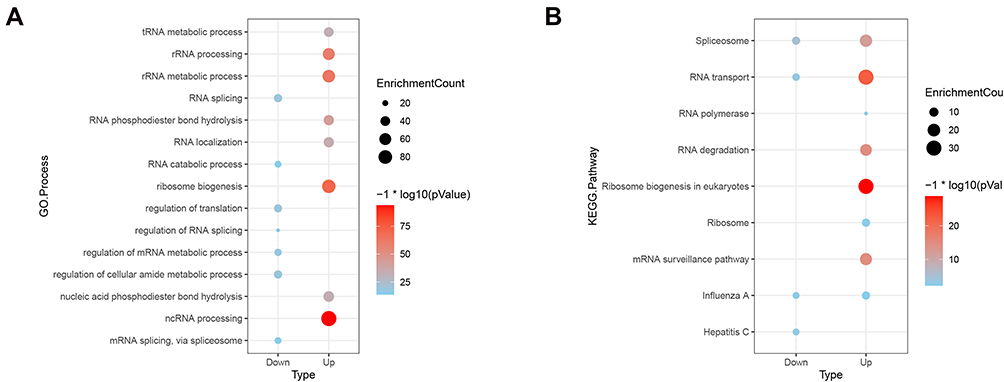 |
Figure 2 GO (A) and KEGG (B) enrichment analysis of DERBPs. |
Establishment of Immune Prognosis Model
For the purpose of revealing the relationship between the 473 DERBPs and overall survival, 25 prognostic DERBPs were identified by utilizing univariate Cox regression analysis (Figure 3A, Table 2). TCGA colon cancer data were randomly divided into two sets (training set: validation set, 3:2). Then, multivariate Cox regression analysis was applied to select the independent indicators for the overall survival based on the training set and finally got 10 DERBPs (PPARGC1A, ZNF385A, SRP14, RIOK1, ERI1, NOL3, RRS1, TDRD6, AEN, and PNLDC1) for the construction of the prognostic index (Figure 3B, Table 3). After constructing the prognostic index, patients were separated into high-risk and low-risk groups (Figure 3C and D). A heatmap was utilized to visualize the difference between gene expression profiles in low- and high-risk patients in the colon cancer training set (Figure 3E). The results from the K–M analysis indicated that high-risk patients had lower overall survival than low-risk patients in both the training and validation groups (P < 0.001) (Figure 4A–C). The ROC curve revealed that the risk model had good sensitivity and specificity in predicting survival risk (area under the ROC curve (AUC) = 0.782, AUC = 0.744 for five years overall survival in the training and validation groups, respectively) (Figure 4D–F). In order to explore whether the constructed RBP risk scoring model was independent of age, gender, stage, and other clinical-pathological parameters, univariate and multivariate Cox regression analyses were performed for age, gender, stage, TNM, and risk score. In the univariate Cox model, age, pathological stage, pathological T, N, M stage, and high-risk score were associated with poor survival (Figure 5A). In the multivariate Cox model, only age, stage, and risk score worked as independent predicted factors (Figure 5B). To better predict the prognosis of patients with colon cancer at three and five years post-surgery, a new nomogram was constructed from the variables associated with Overall Survival (OS) (age, pathological stage, TNM stage, and risk score) (Figure 5C–E).
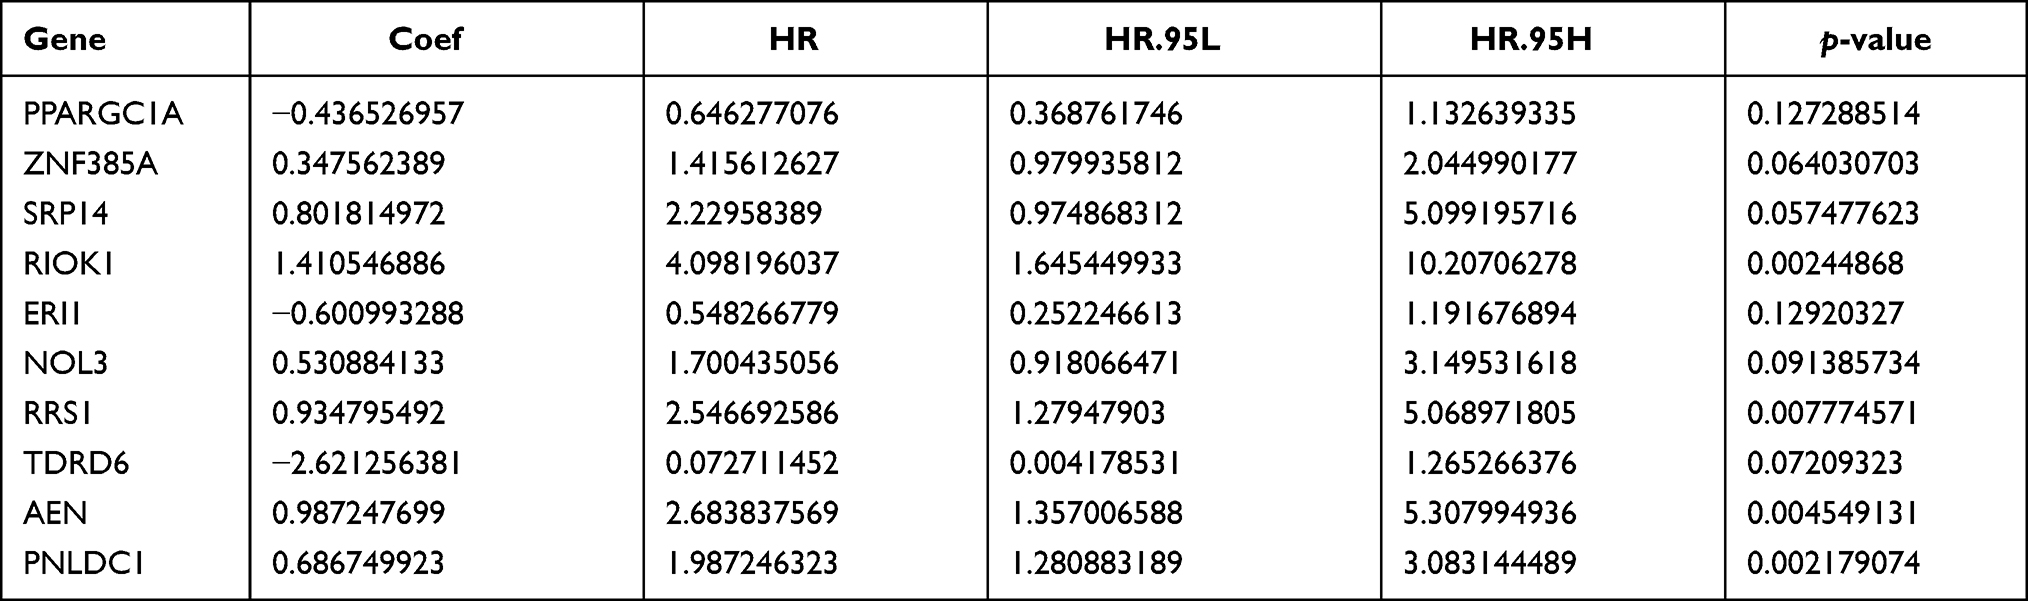 |
Table 3 Multivariate Cox Regression Analysis to Establish RNA Binding Proteins Risk Prediction Model |
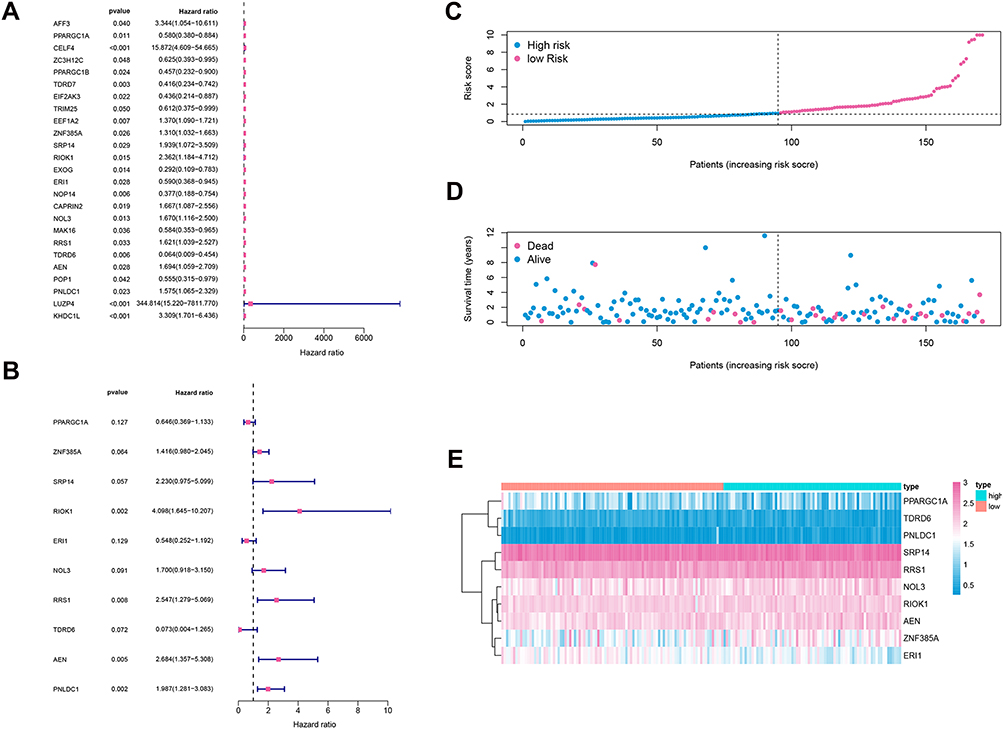 |
Figure 3 (A) Univariate survival analysis by cox proportional hazards models to select prognostic key RBPs. (B) Multivariate cox regression model for 10 prognostic RBPs used to construct RBPs risk score model. (C) Distribution of immune risk scores in colon cancer patients. (D) Distribution of survival status in colon cancer patients. (E) Distribution of specific risk factors in the high- and low-risk groups (divided by median value). |
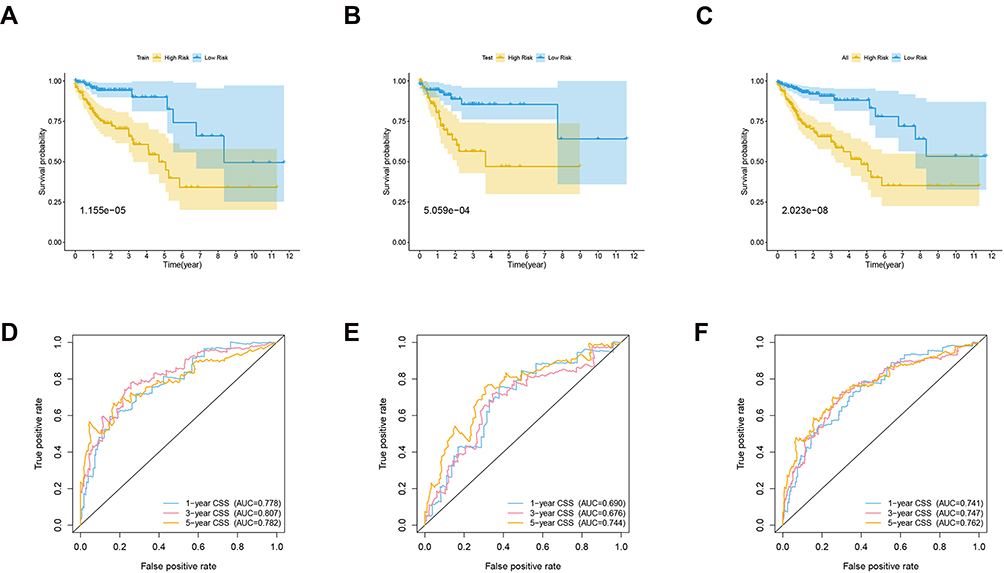 |
Figure 4 (A) Kaplan-Meier curve analysis of high-risk and low-risk patients in the training cohort. (B) Kaplan-Meier curve analysis of high-risk and low-risk patients in the testing cohort. (C) Kaplan-Meier curve analysis of high-risk and low-risk patients in the entire TCGA cohort. (D) Time dependent ROC curve analysis of the training cohort. (E) Time dependent ROC curve analysis of the testing cohort. (F) Time-dependent ROC curve analysis of the entire TCGA cohort. |
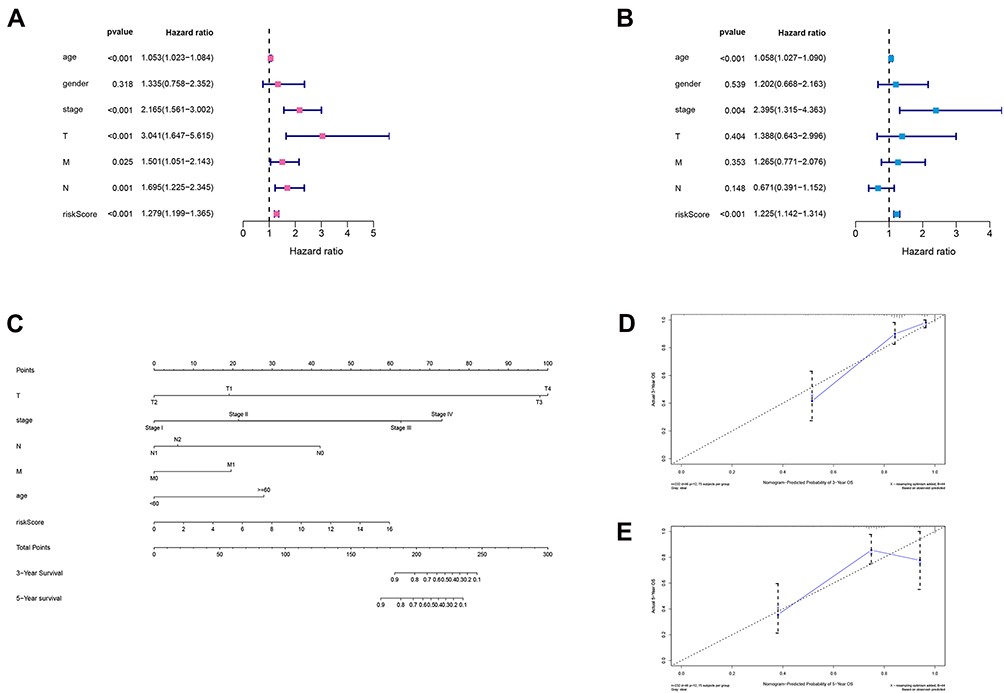 |
Figure 5 Cox’s proportional hazard model of correlative factors in colon cancer patients. (A) Univariate COX regression analysis for seven clinicopathological parameters affecting the overall survival. (B) Multivariate COX regression analysis for seven clinicopathological parameters affecting the overall survival. (C) An established nomogram to predict colon cancer survival based on cox model. (D and E) Plots displaying the calibration of each model comparing predicted and actual 3- and 5-year overall survival. |
Clinical and Prognostic Correlation of 10 Model Genes and RBP Risk Scores
We further investigated the proportion of each model gene in different pathological stages. We demonstrated that SRP14, PPARGC1A, and ER1 were most significantly associated with the development of colon cancer (Figure 6). In regard to the immune genes risk score, a strong correlation with the pathological, clinical N, and clinical M stages was identified (Figure 7).
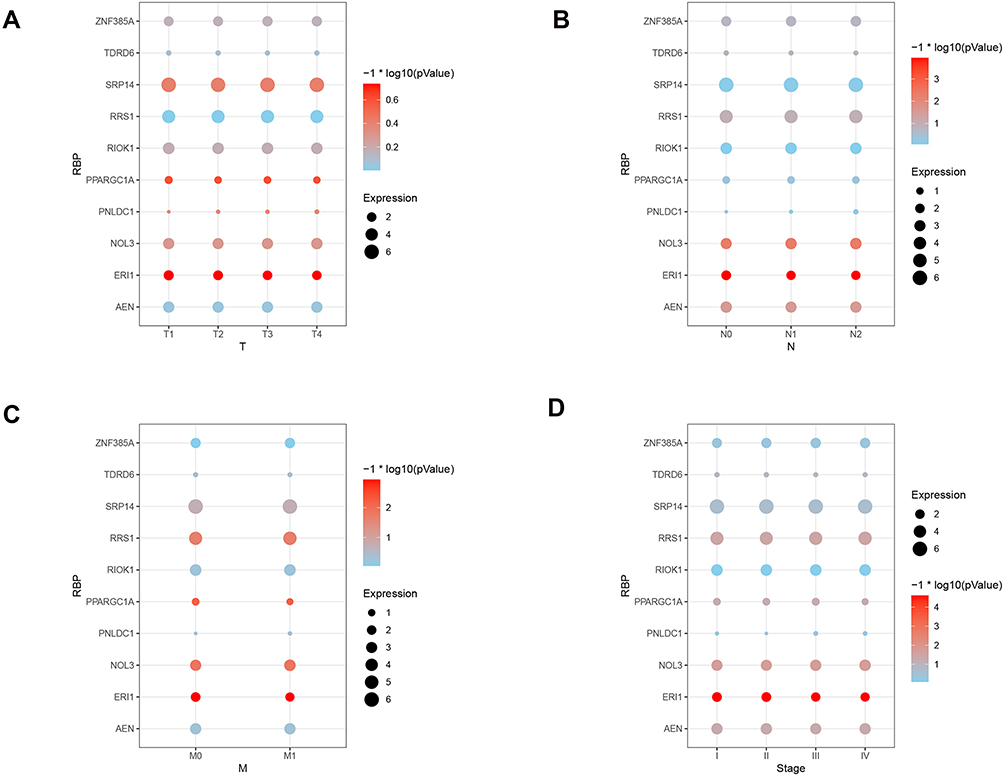 |
Figure 6 Correlation analysis between TNM&Stage and 10 model genes in colon cancer cases. (A) Correlation analysis between tumor stage and 10 model genes expression in colon cancer cases. (B) Correlation analysis between node stage and 10 model genes expression in colon cancer cases. (C) Correlation analysis between metastasis stage and 10 model genes in colon cancer cases. (D) Correlation analysis between pathologic stage and 10 model genes expression in colon cancer cases. |
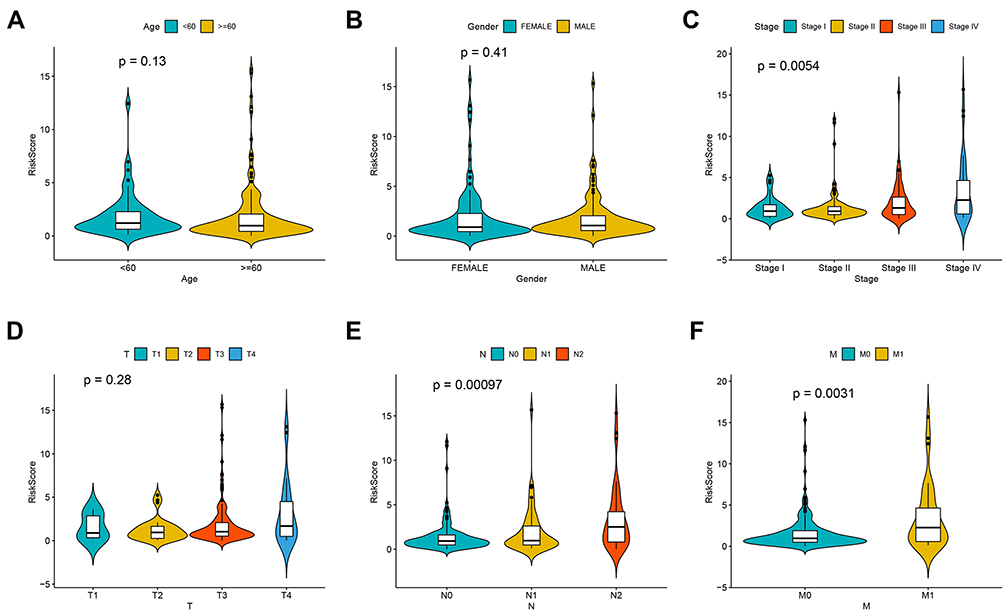 |
Figure 7 Correlation between RBPs risk scores and various clinical factors. (A) Age. (B) Gender. (C) Stage. (D) T stage. (E) N stage. (F) M stage. |
Gene Set Enrichment Analysis of Risk Scores
A GSEA of risk scores based on the TCGA colon cancer cohort was performed to explore the biological relevance of risk scores involved in colon cancer progression. GSEA analysis indicated high-risk scores were associated with MYC_TARGETS_V2, UV_RESPONSE_UP, and Wnt/beta-catenin signaling pathways (Figure 8A–C). In addition, low-risk scores were associated with the protein secretion pathway (Figure 8D).
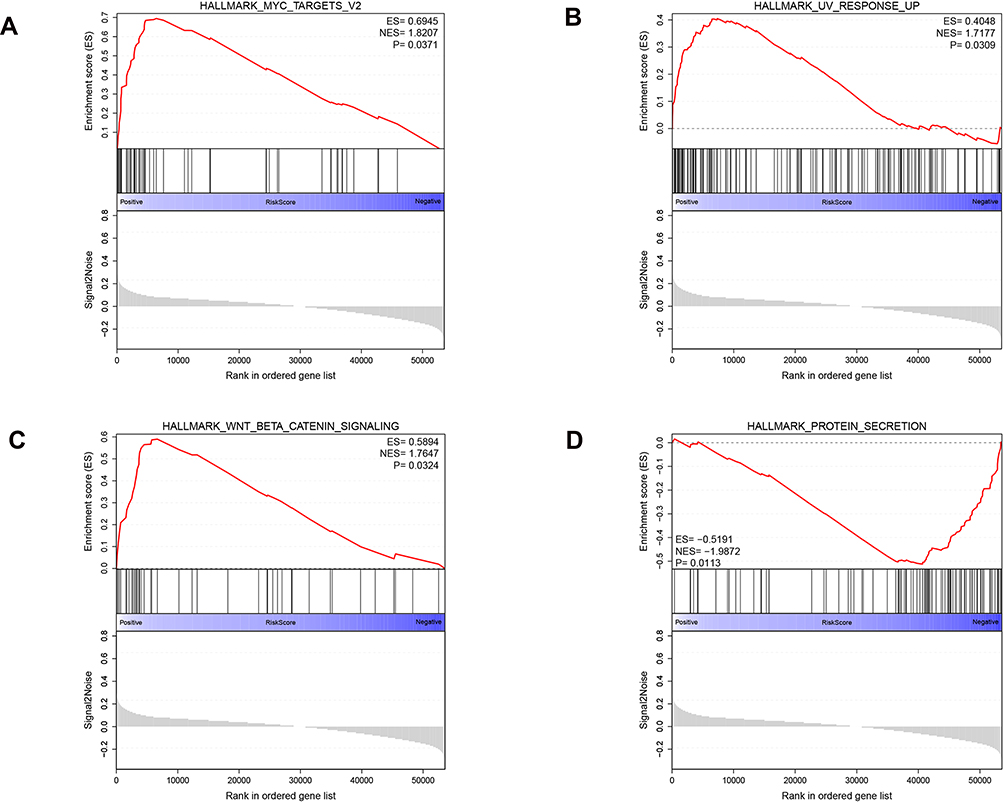 |
Figure 8 Gene set enrichment analysis of RBPs risk scores. (A–C) high risk scores. (D) low risk scores. |
Discussion
Malignant tumors are characterized by uncontrolled cell growth, mainly due to the dysregulated expression of cancer driver genes that regulate cell proliferation.11 Post-transcriptional mechanisms can greatly influence the gene expression patterns in cancer cells, in which RBPs play key roles. They can interact with target mRNAs in a sequence-dependent and structure-dependent manner and determine cellular behavior by manipulating the processing of these mRNAs.4 It has been reported that RBPs show dysregulated expression in various human cancers. However, little is currently known about the expression patterns and roles of RBPs in colon cancer. Therefore, it was crucial to investigate the RBP subsets to evaluate risk and tumor prognosis in colon cancer.
In our study, we conducted a comprehensive and detailed assessment of RBPs in colon cancer based on the data from a large set of samples. All gene expression data and patients’ clinical characteristics information were downloaded from the TCGA dataset. We analyzed the 1542 RBPs between colon cancer and normal tissues. Eventually, we verified 473 differentially expressed RBPs. Moreover, we identified and constructed a 10 hub RBP risk score model for colon cancer via univariate and multivariate Cox regression analyses, including PPARGC1A, ZNF385A, SRP14, RIOK1, ERI1, NOL3, RRS1, TDRD6, AEN, and PNLDC1. Furthermore, to investigate the prognostic value of the model, we performed the ROC curve and investigated the association between the model and clinical features. As expected, the high-risk group was correlated with worse overall survival and was inclined to have advanced stages and higher histological grades, which might manifest a poor outcome.
According to the results of the biological functions and pathway enrichment analysis of these differentially expressed RBPs, the upregulated RBPs were significantly enriched in ribosome biogenesis in eukaryotes, RNA transport, and spliceosome, while downregulated differentially expressed RBPs were enriched in spliceosome, RNA transport, and influenza A pathways. Recently, mechanistic data have emerged, suggesting a broader role for dysregulated ribosome biogenesis in the development and progression of most spontaneous cancers.12 Moreover, it is reported that RNA polymerases are consistently dysregulated in cancer, which is mostly mediated through upstream oncogenetic and tumor-suppressive signaling pathways rather than through mutations.13 These results suggest that RBPs can affect the growth of tumor cells by regulating multiple biological pathways.
Several genes in the RBPs model have been investigated in human cancers. RIOK1 activates NF-KB signal transduction, which promotes cell cycle progression and tumor lung colonization in vivo. It is demonstrated that RIOK1 is overexpressed in different subtypes of human lung cancer and breast cancer, suggesting that RIOK1 is a potential therapeutic target, especially in Ras-driven cancer.14 Ribosome biogenesis regulator 1 protein homolog (RRS1) is an important factor in ribosome biogenesis. At the molecular level, RRS1 silencing decreased the expression of M-phase inducer phosphatase 3 (CDC25C), cyclin-dependent kinase 1 (CDK1), and antigen Ki-67 (Ki-67), and increased the protein levels of cyclin-dependent kinase inhibitor 1 (CDKN1A) and tumor suppressor p53 (p53). In conclusion, RRS1 may promote the development of colon cancer. Therefore, targeting RRS1 may be a promising treatment strategy for patients with colorectal cancer (CRC).15
However, there were some limitations in our research. First, the sample size in our study was small, and a larger cohort and more abundant sequencing results are needed. Second, we only focused on the gene expression and gene mutation levels but ignored other events, such as gene methylation and copy number amplification, which are also important in tumor progression. Third, the effect of RBPs on the progression and prognosis of colorectal cancer needs to be verified in vivo and in vitro. Finally, our findings are significant but may not be useful to change the current clinical practice. They can be considered a first step towards a promising treatment strategy for patients with CRC. Further investigation is needed by a prospective study.
In summary, our study sheds light on the utility of RBPs in the prognosis of colon cancer. The constructed RBPs risk scoring model is reliable in predicting the prognosis of colon cancer, and this risk scoring model is an independent influencing factor for the prognosis of colon cancer. With the rapid development of high-throughput technology, we are confident that our risk scoring model has great potential in clinical practice.
Ethics Approval and Consent to Participate
The study was conducted in accordance with the Declaration of Helsinki (as was revised in 2013). The study was approved by Ethics Committee of the Shanghai Pudong Hospital. Written informed consent was obtained from all participants.
Acknowledgments
We are particularly grateful to all the people who have given us help on our article.
Funding
This study was funded by the Discipline Construction Promoting Project of Shanghai Pudong Hospital (grant no. Zdzk2020-09) and Natural Science Foundation of Shanghai (grant no.21ZR1457400).
Disclosure
The authors declare that they have no competing interests.
References
1. Bray F, Ferlay J, Soerjomataram I, Siegel RL, Torre LA, Jemal A. Global cancer statistics 2018: GLOBOCAN estimates of incidence and mortality worldwide for 36 cancers in 185 countries [published correction appears in CA Cancer J Clin. 2020 Jul; 70(4):313]. CA Cancer J Clin. 2018;68(6):394–424. doi:10.3322/caac.21492
2. Ferlay J, Soerjomataram I, Dikshit R, et al. Cancer incidence and mortality worldwide: sources, methods and major patterns in GLOBOCAN 2012. Int J Cancer. 2015;136(5):E359–E386. doi:10.1002/ijc.29210
3. McGuire S. World cancer report 2014. Geneva, Switzerland: World Health Organization, International Agency for Research on Cancer, WHO Press, 2015. Adv Nutr. 2016;7(2):418–419. doi:10.3945/an.116.012211
4. Masuda K, Kuwano Y. Diverse roles of RNA-binding proteins in cancer traits and their implications in gastrointestinal cancers. Wiley Interdiscip Rev RNA. 2019;10(3):e1520. doi:10.1002/wrna.1520
5. New J, Subramaniam D, Ramalingam S, et al. Pleotropic role of RNA binding protein CELF2 in autophagy induction. Mol Carcinog. 2019;58(8):1400–1409. doi:10.1002/mc.23023
6. Otsuka H, Fukao A, Funakami Y, Duncan KE, Fujiwara T. Emerging evidence of translational control by AU-rich element-binding proteins [published correction appears in Front Genet. 2021 Jun 28;12:715196]. Front Genet. 2019;10:332. doi:10.3389/fgene.2019.00332
7. Gerstberger S, Hafner M, Tuschl T. A census of human RNA-binding proteins. Nat Rev Genet. 2014;15(12):829–845. doi:10.1038/nrg3813
8. Nahalka J. The role of the protein-RNA recognition code in neurodegeneration. Cell Mol Life Sci. 2019;76(11):2043–2058. doi:10.1007/s00018-019-03096-3
9. Zhou Y, Huang T, Siu HL, et al. IGF2BP3 functions as a potential oncogene and is a crucial target of miR-34a in gastric carcinogenesis. Mol Cancer. 2017;16(1):77. doi:10.1186/s12943-017-0647-2
10. Zong FY, Fu X, Wei WJ, et al. The RNA-binding protein QKI suppresses cancer-associated aberrant splicing. PLoS Genet. 2014;10(4):e1004289. doi:10.1371/journal.pgen.1004289
11. Li W, Li X, Gao LN, You CG. Integrated analysis of the functions and prognostic values of RNA binding proteins in lung squamous cell carcinoma. Front Genet. 2020;11:185. doi:10.3389/fgene.2020.00185
12. Pelletier J, Thomas G, Volarević S. Corrigendum: ribosome biogenesis in cancer: new players and therapeutic avenues. Nat Rev Cancer. 2018;18(2):134. doi:10.1038/nrc.2018.3
13. Bywater MJ, Pearson RB, McArthur GA, Hannan RD. Dysregulation of the basal RNA polymerase transcription apparatus in cancer. Nat Rev Cancer. 2013;13(5):299–314. doi:10.1038/nrc3496
14. Weinberg F, Reischmann N, Fauth L, et al. The atypical kinase RIOK1 promotes tumor growth and invasive behavior. EBioMedicine. 2017;20:79–97. doi:10.1016/j.ebiom.2017.04.015
15. Wu XL, Yang ZW, He L, et al. RRS1 silencing suppresses colorectal cancer cell proliferation and tumorigenesis by inhibiting G2/M progression and angiogenesis. Oncotarget. 2017;8(47):82968–82980. doi:10.18632/oncotarget.20897
 © 2021 The Author(s). This work is published and licensed by Dove Medical Press Limited. The full terms of this license are available at https://www.dovepress.com/terms.php and incorporate the Creative Commons Attribution - Non Commercial (unported, v3.0) License.
By accessing the work you hereby accept the Terms. Non-commercial uses of the work are permitted without any further permission from Dove Medical Press Limited, provided the work is properly attributed. For permission for commercial use of this work, please see paragraphs 4.2 and 5 of our Terms.
© 2021 The Author(s). This work is published and licensed by Dove Medical Press Limited. The full terms of this license are available at https://www.dovepress.com/terms.php and incorporate the Creative Commons Attribution - Non Commercial (unported, v3.0) License.
By accessing the work you hereby accept the Terms. Non-commercial uses of the work are permitted without any further permission from Dove Medical Press Limited, provided the work is properly attributed. For permission for commercial use of this work, please see paragraphs 4.2 and 5 of our Terms.