")
Back to Journals » Journal of Inflammation Research » Volume 14
Identification of Potential Early Diagnostic Biomarkers of Sepsis
Authors Li Z, Huang B, Yi W, Wang F, Wei S, Yan H, Qin P, Zou D , Wei R, Chen N
Received 22 December 2020
Accepted for publication 22 February 2021
Published 3 March 2021 Volume 2021:14 Pages 621—631
DOI https://doi.org/10.2147/JIR.S298604
Checked for plagiarism Yes
Review by Single anonymous peer review
Peer reviewer comments 2
Editor who approved publication: Professor Ning Quan
Zhenhua Li,1,2,* Bin Huang,2,* Wenfeng Yi,2,* Fei Wang,1 Shizhuang Wei,1 Huaixing Yan,1 Pan Qin,1 Donghua Zou,1 Rongguo Wei,3 Nian Chen4
1Department of Emergency Medicine, The Fifth Affiliated Hospital of Guangxi Medical University, Nanning, 530022, People’s Republic of China; 2Intensive Care Unit, The Fifth Affiliated Hospital of Guangxi Medical University, Nanning, 530022, People’s Republic of China; 3Department of Clinical Laboratory, The Fifth Affiliated Hospital of Guangxi Medical University, Nanning, 530022, People’s Republic of China; 4Department of Infectious Diseases, The Fifth Affiliated Hospital of Guangxi Medical University, Nanning, 530022, People’s Republic of China
*These authors contributed equally to this work
Correspondence: Rongguo Wei; Nian Chen Email [email protected]; [email protected]
Objective: The goal of this article was to identify potential biomarkers for early diagnosis of sepsis in order to improve their survival.
Methods: We analyzed differential gene expression between adult sepsis patients and controls in the GSE54514 dataset. Coexpression analysis was used to cluster coexpression modules, and enrichment analysis was performed on module genes. We also analyzed differential gene expression between neonatal sepsis patients and controls in the GSE25504 dataset, and we identified the subset of differentially expressed genes (DEGs) common to neonates and adults. All samples in the GSE54514 dataset were randomly divided into training and validation sets, and diagnostic signatures were constructed using least absolute shrink and selection operator (LASSO) regression. The key gene signature was screened for diagnostic value based on area under the receiver operating characteristic curve (AUC). STEM software identified dysregulated genes associated with sepsis-associated mortality. The ssGSEA method was used to quantify differences in immune cell infiltration between sepsis and control samples.
Results: A total of 6316 DEGs in GSE54514 were obtained spanning 10 modules. Module genes were mainly enriched in immune and metabolic responses. Screening 51 genes from among common genes based on AUC > 0.7 led to a LASSO model for the training set. We obtained a 25-gene signature, which we validated in the validation set and in the GSE25504 dataset. Among the signature genes, SLC2A6, C1ORF55, DUSP5 and RHOB were recognized as key genes (AUC > 0.75) in both the GSE54514 and GSE25504 datasets. SLC2A6 was identified by STEM as associated with sepsis-associated mortality and showed the strongest positive correlation with infiltration levels of Th1 cells.
Conclusion: In summary, our four key genes may have important implications for the early diagnosis of sepsis patients. In particular, SLC2A6 may be a critical biomarker for predicting survival in sepsis.
Keywords: sepsis, early diagnosis, LASSO model, SLC2A6, WGCNA, diagnostic biomarker
Introduction
Sepsis causes life-threatening organ dysfunction due to dysregulated host response to infection.1,2 It is the most important cause of morbidity and mortality in the intensive care unit (ICU), and it causes substantial health care costs worldwide.3,4 Recent reports revealed that 48.9 million cases of sepsis were recorded worldwide in 2017, with the 11 million sepsis-related deaths accounting for 19.7% of total global deaths.5 The incidence of sepsis varies considerably among different geographical regions.6 Different aspects of society, economy, politics, health, and even climate affect the epidemiology of sepsis.7 Community infections account for approximately 60–70% of all cases; nosocomial infections outside the ICU, 20–30%; and primary cases in the ICU, 5–9%.8–10
Pediatric sepsis has a distinct epidemiological profile from adult sepsis and is associated with lower rates of mortality and progressive organ failure.11 Nevertheless, adult and pediatric sepsis have the same bacterial and viral causes.12 Interventions applied to adults with sepsis are often translated into clinical guidelines for pediatric sepsis patients as well.13
Sepsis survivors often suffer from multiple sequelae that significantly compromise their life expectancy and quality of life.14 Survivors are at increased risk of long-term cognitive impairment, new cardiac events, and new renal failure.15 Survivors often show progressive atherosclerosis, neurocognitive dysfunction and low-grade inflammation.16,17
The acute onset of sepsis is characterized by massive release of cytokines and other mediators, which leads to dysregulated immune responses, resulting in organ damage or death.18,19 Chronic inflammation, coupled with chronic catabolism of drugs, contributes to a state of immune dysregulation that promotes infectious complications and leads to chronic exacerbations and death.20 A striking feature of immunosuppression in sepsis is that apoptosis leads to early and massive loss of lymphocytes,21 which if severe or persistent can increase risk of mortality.22 Clinical signs of early sepsis are often subtle, nonspecific, and easy to miss. Knowledge of early sepsis symptoms may help patients and clinicians identify the condition and initiate treatment sooner.23,24
The present study analyzed gene expression profiles of adult and pediatric sepsis patients from public databases in order to understand early molecular changes as well as biological mechanisms. For the early diagnosis of sepsis patients, we established a least absolute shrink and selection operator (LASSO) model to develop a gene signature for predicting sepsis, which we validated using external data. Analysis of the area under receiver operating characteristic curve (AUC) allowed us to identify potential biomarkers of sepsis. The goal of the present study was to identify early diagnostic molecules and improve the survival of sepsis patients.
Materials and Methods
Data Sources
We collected sepsis data from gene expression omnibus (GEO) databases (http://www.ncbi.nlm.nih.gov/geo/). The GSE54514 dataset included gene expression profiling based on arrays of whole blood from 26 sepsis survivors (days 1–5), 9 sepsis patients who died, and 18 healthy controls. The GSE25504 dataset included gene expression profiling based on arrays of peripheral blood from 37 control neonates and 25 neonates with sepsis. Raw data were background-subtracted and normalized using a robust spline algorithm with the lumi package in Bioconductor.25 Institutional Review Board approval was not required for this study since all data had been released into the public domain.
Analysis of Differential Gene Expression
First, the expression profiles of genes in each sample of sepsis and control groups were constructed. Then, genes differentially expressed between the sepsis and control groups in the GSE54514 and GSE25504 datasets were identified using the Limma R package.26 Differentially expressed genes (DEGs) were defined as those whose expression differences were associated with P < 0.05.
Coexpression Analysis
Weighted gene coexpression network analysis (WGCNA) was used to identify the coexpression network of DEGs in GSE54514. The WGCNApackage in R was used to cluster genes into different modules.27 Briefly, connections among pairs of genes were identified and weighted based on correlated expression levels across multiple samples. We further converted the adjacency matrix into a topological overlap matrix (TOM) to detect gene connectivity in the network. Then, hierarchical clustering was used to identify clusters (modules) of highly interconnected genes on the basis of their connectivity and covariance coefficients. The minimum size of the gene dendrogram was 30. The power value was selected to define a high degree of positive correlation among genes in the same module. A screening threshold crosstalk greater than 900 was set for quantitating crosstalk between modules.
Enrichment Analysis
Module genes were analyzed using Gene Ontology (GO) and Kyoto Encyclopedia of Genes and Genomes (KEGG) in the clusterProfiler package in R.28 biological processes (BPs)was used to identify enrichment in GO. The clusterProfiler package was also used to conduct gene set enrichment analysis (GSEA).29 Results associated with P < 0.05 were considered statistically significant.
The fgsea package in R was used to display the enrichment results of GSEA. Gene set variation analysis (GSVA) was carried out using the GSVA package in order to display enrichment results.30 For each sample, a score was obtained describing the enrichment of a set of genes based on the gene expression profile. Then, the Limma package in R was used to compare GSVA scores between sepsis and controls. This approach identified signaling pathways that were up- or down-regulated in sepsis patients relative to controls.
LASSO Regression
Receiver operating characteristic curves were drawn and their AUCs determined to evaluate the diagnostic value of the key genes using the pROC package in R.31 Genes whose AUC > 0.7 and that were differentially regulated (up- or down-regulated) in the same direction in both GSE54514 and GSE25504 datasets were used to build a binomial LASSO model using the glmnet package in R. As a training set, 75% of samples in the GSE54514 dataset were randomly selected. As λ increases, LASSO tends to reduce the regression coefficient to zero. As a validation set, 25% of samples in the GSE54514 and GSE25504 datasets were selected. Genes with AUC > 0.75 in both the GSE54514 and GSE25504 datasets were defined as key genes.
Short Time-Series Expression Miner (STEM) Analysis
We performed STEM analysis32 of the GSE54514 dataset in order to cluster gene modules in healthy controls, sepsis survivors and sepsis patients who died. Clustering was significant if it was associated with P < 0.05. Significantly clustered genes showed a trend of greater up- or down-regulation in the order: healthy controls < sepsis survivors < sepsis patients who died.
Single-Sample Gene Set Enrichment Analysis (ssGSEA)
Marker genes for different types of immune cells were obtained from Bindea et al.33 The ssGSEA method was used to derive an enrichment score for each immune-related cell type. The infiltration level of immune cell was calculated using ssGSEA function of the GSVA package in R. We analyzed differences in immune cell infiltration between sepsis and controls. We also analyzed differences in immune cell infiltration between sepsis survivors and controls, as well as between survivors and sepsis patients who died. Correlations between different infiltration of immune cells and genes were assessed using Pearson’s correlation.
Results
Coexpression Network of Sepsis-Associated Genes
The flowchart of this study is shown in Figure 1. To identify sepsis-associated genes, we analyzed genes differentially expressed between sepsis and control samples. A total of 6316 differentially expressed genes (DEGs) in adults were obtained in the GSE54514 dataset (Figure 2A, Table S1), and 7832 DEGs in neonates in the GSE25504 dataset (Figure 2B, Table S2). A total of 3355 DEGs were common to adult and pediatric sepsis patients, while 4477 genes may be specific to pediatric sepsis and 2961 genes may be specific to adult sepsis (Figure 2C, Table S3).
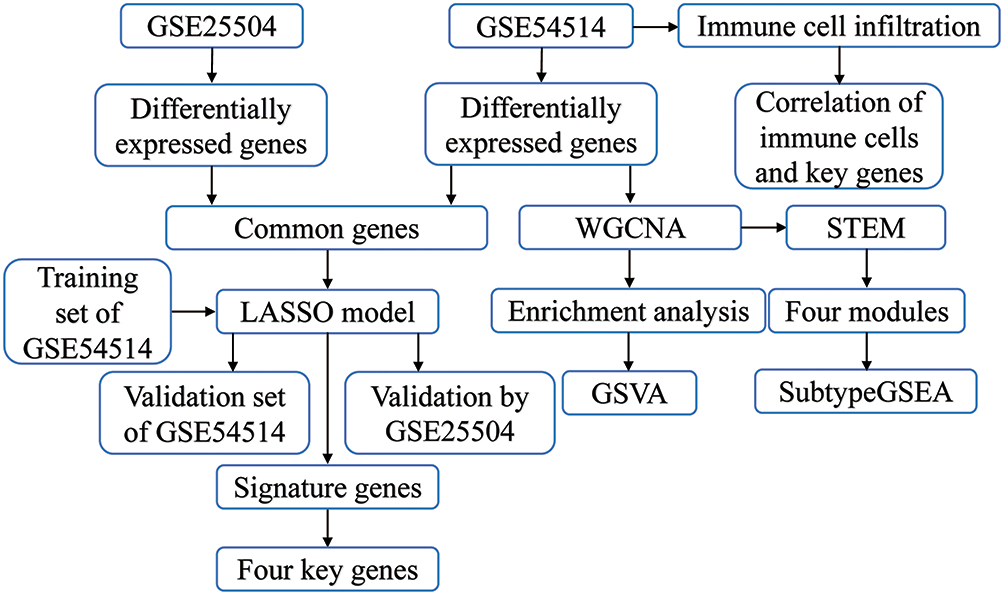 |
Figure 1 Study flowchart. Sequencing data from sepsis patients and controls in GSE54514 and GSE25504 datasets were analyzed by bioinformatics in order to identify early potential biomarkers of sepsis. Abbreviations: LASSO, least absolute shrink and selection operator; STEM, short time-series expression miner; WGCNA, weighted gene coexpression network analysis. |
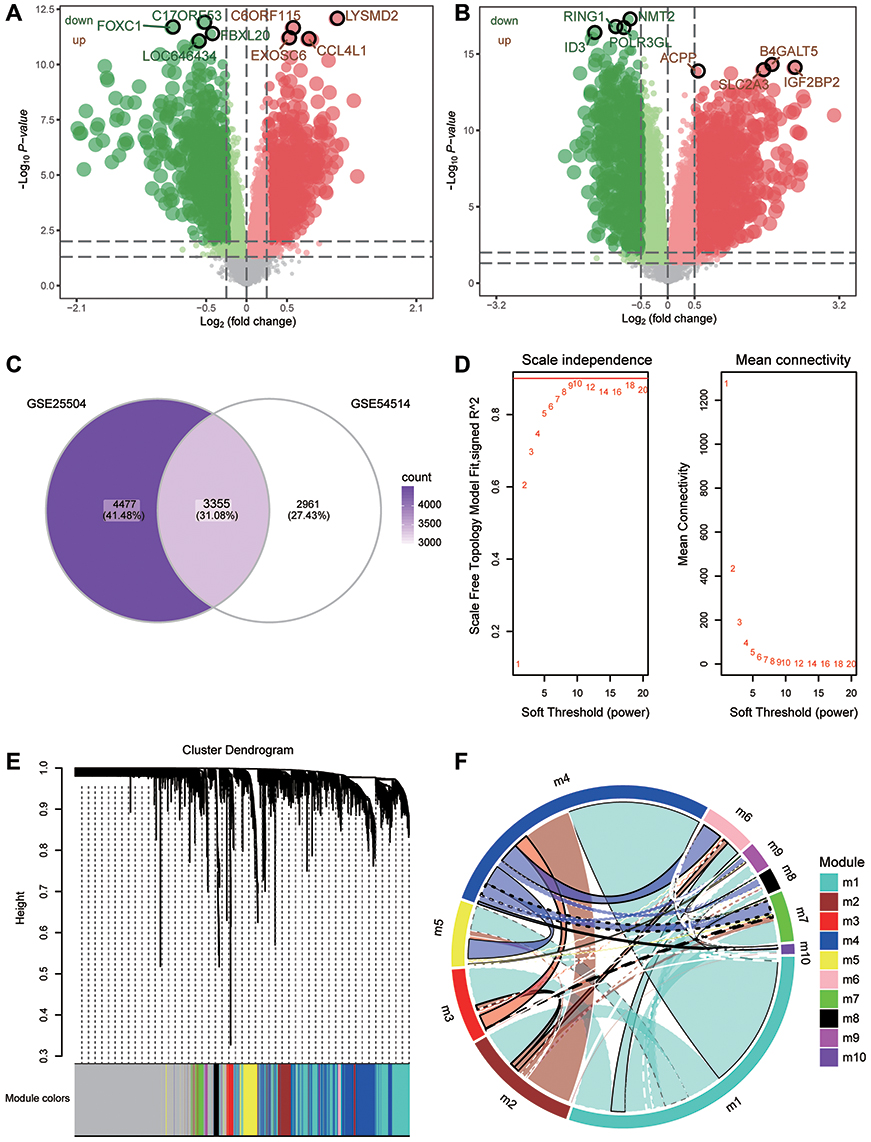 |
Figure 2 Coexpression network of differentially expressed genes. (A) Genes differentially expressed between sepsis patients and controls in the GSE54514 dataset. Green nodes represent down-regulation in sepsis; red nodes, up-regulation; and grey nodes, no significant difference from controls. The five genes most significantly up- or down-regulated, based on log2(fold change), are marked using symbols. (B) Genes differentially expressed between sepsis patients and controls in the GSE25504 dataset. Green nodes represent down-regulation in sepsis; red nodes, up-regulation; and grey nodes, no significant difference from controls. The five genes most significantly up- or down-regulated, based on log2(fold change), are marked using symbols. (C) Intersection of differentially expressed genes (DEGs) in the GSE54514 and GSE25504 datasets. The count on the left refers to DEGs unique to GSE54514; the count in the middle, DEGs common to both datasets; and the count on the right, DEGs unique to GSE25504. (D) Correlation between soft threshold power and scale-free topology model. (E) Cluster tree of coexpression modules of significantly different gene expression. Different colors represent different modules. (F) Crosstalk between modules. The more crosstalk between module genes and other genes, the greater the proportion of the ring is occupied by that module. Different colors represent different modules. |
To identify the coexpression network of DEGs in the GSE54514 dataset, we performed WGCNA. The optimal soft power threshold for WGCNA was set to 10 to preserve scale-free topology and effective connectivity (Figure 2D). Ten coexpression modules of DEGs were then established (Figure 2E). Moreover, we found significant crosstalk between coexpression modules (Figure 2F).
Enrichment of Module Genes
Based on analysis of enrichment and GSVA of module genes, we found that interferon - γ secretion, adaptive immune memory response, and T cell proliferation of biological processes were significantly up-regulated in sepsis patients compared with controls, whereas neutrophil extravasation, pentose metabolic processes, and cytosine metabolic processes were significantly down-regulated (Figure 3A). Among KEGG pathway results, antigen processing and presentation, primary immunodeficiency, as well as Th1 and Th2 cell differentiation were significantly up-regulated in sepsis patients compared with controls. Conversely, the VEGF signaling pathway, cell cycle, and HIF-1 signaling pathway were significantly down-regulated (Figure 3B). Calculation of KEGG pathways in GSEA showed that the top 10 pathways were enriched mainly in sepsis, while the latter 10 pathways were enriched mainly in controls (Figure 3C). This revealed that immune response was significantly up-regulated in sepsis, while progression of metabolic processes was down-regulated.
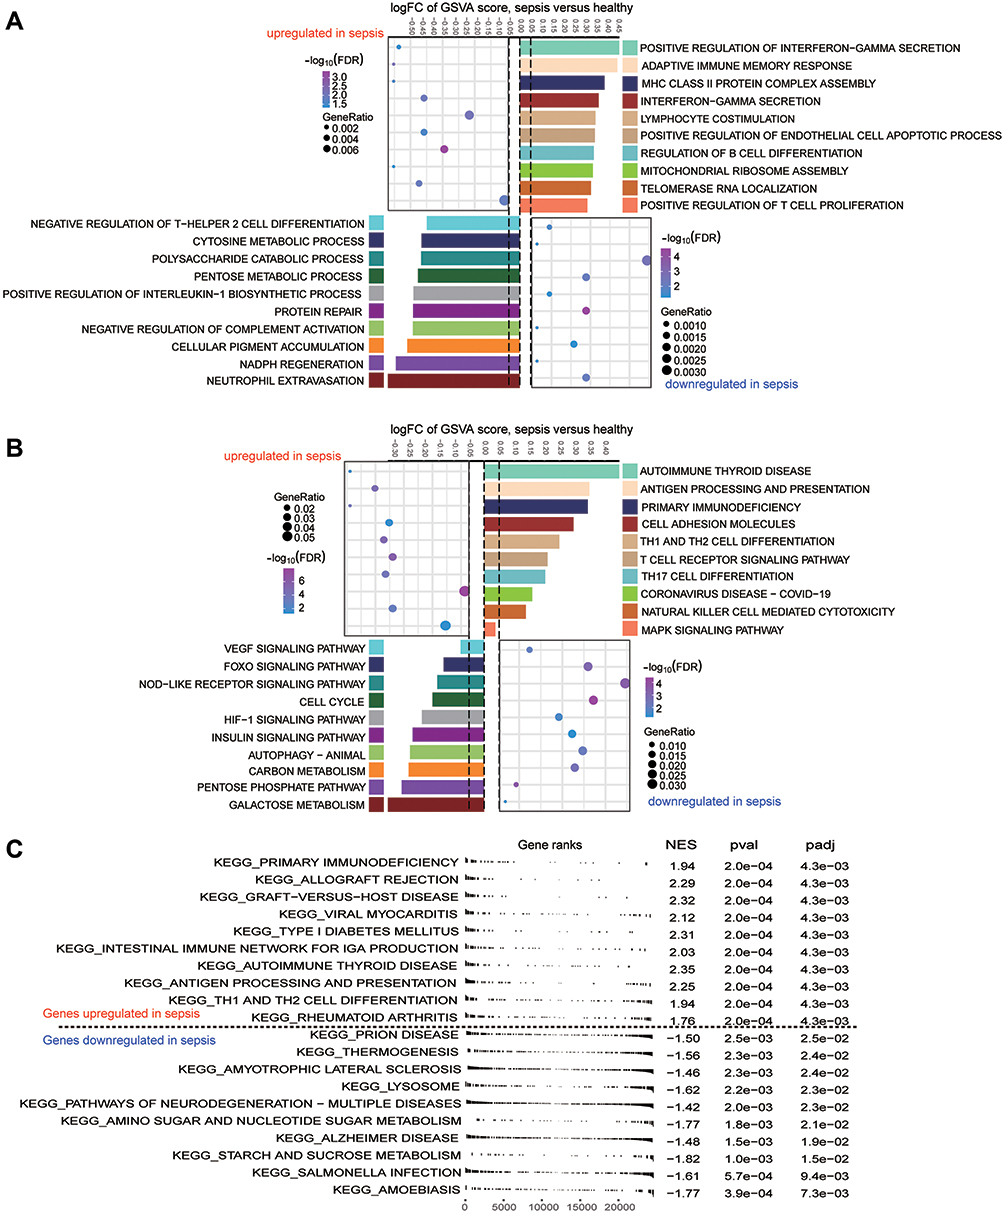 |
Figure 3 Biological functions and KEGG pathways enriched for module genes. (A) Significant up- or down-regulated biological processes in module genes of sepsis patients relative to controls, as quantified by gene set variation analysis (GSVA). FC, fold change. (B) Significant up- or down-regulated KEGG signaling pathways in module genes of sepsis patients relative to controls, as quantified by GSVA. (C) Up- or down-regulated KEGG pathways of gene set enrichment results in sepsis patients relative to controls. A P value < 0.05 was considered statistically significant. |
Identification of Key Genes Associated with Sepsis
We randomly split all the samples in the GSE54514 dataset into a training set (75%) and validation set (25%). A LASSO model was constructed in the training set by screening 51 genes with AUC > 0.7 from common genes that showed concordant up- or down-regulation in both the GSE54514 and GSE25504 datasets. A λ value of 25 was chosen to determine the genes that could predict sepsis most accurately (Figure 4A). We then obtained a 25-gene signature with a non-zero coefficient (Figure 4B). The AUC for the gene signature was 0.983 in the training set (Figure 4C) and 0.964 in the validation set (Figure 4D). Importantly, we also used external datasets to validate the gene signature: it showed good diagnostic ability, with an AUC of 0.841 (Figure 4E). Genes with AUC > 0.75 in both the GSE54514 and GSE25504 datasets were further screened, ie, CDKN1C, TMEM169, SLC2A6, DERL2, PSMB7, C1ORF55, DYNC1LI2, DUSP5, and RHOB (Figure 4F). Among them, SLC2A6, C1ORF55, DUSP5, and RHOB in the gene signature were recognized as key genes and may be able to diagnose sepsis. These key genes were up-regulated in sepsis patients compared to controls (Figure 4G).
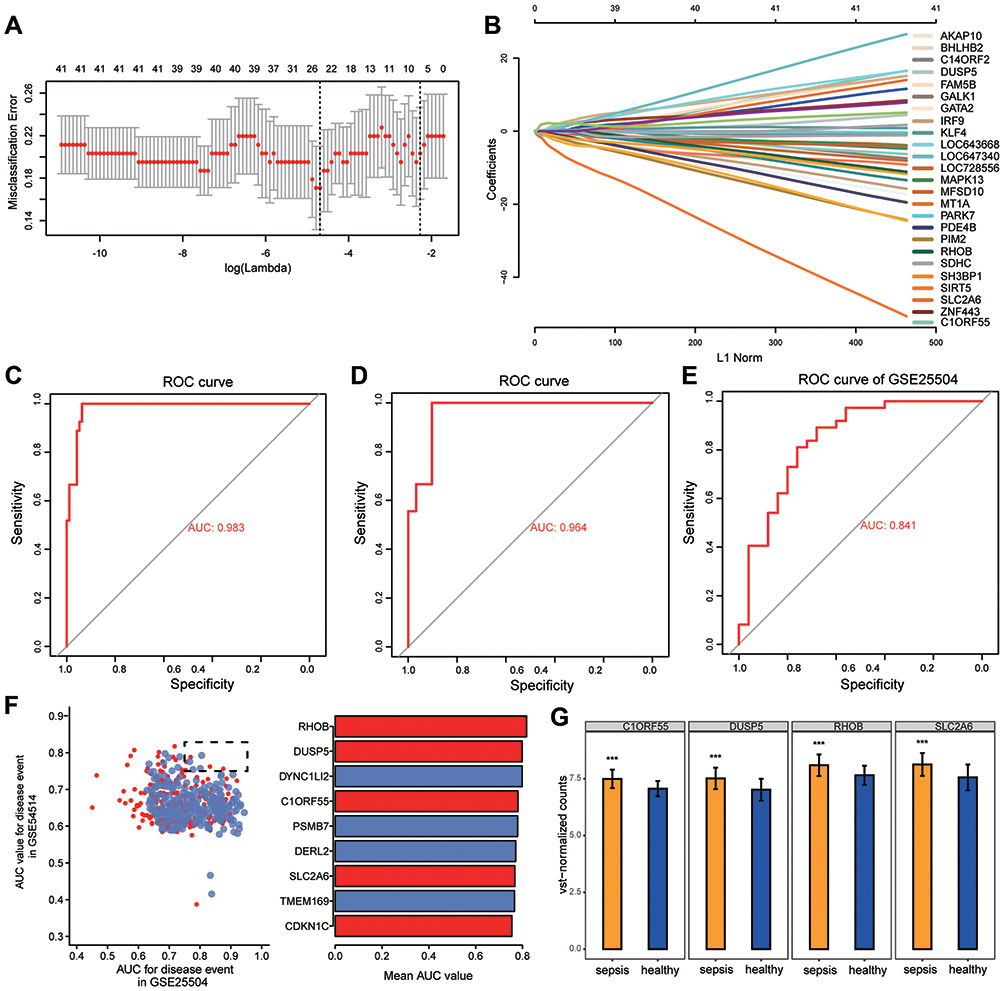 |
Figure 4 Potential key genes for the diagnosis of sepsis. (A) The gene signature selection of optimal parameter (lambda) in LASSO model. (B) LASSO coefficient profiles of the 25 differentially expressed genes selected by the optimal lambda. (C) The receiver operating characteristic (ROC) curves of the gene signature in the training set of GSE54514. (D) The ROC curves of the gene signature in the validation set of GSE54514. (E) The ROC curves of the gene signature in GSE25504. (F) The genes in GSE54514 and GSE25504 with an area under the ROC curve (AUC) greater than 0.75 are indicated together with their mean AUCs. (G) Differential expression of key genes between sepsis patients and controls in GSE54514. ***P < 0.001. |
Persistently Dysregulated Genes Associated with Sepsis Death
STEM software was used to screen module genes for persistently dysregulated genes. Among the 293 genes identified, SLC2A6 also showed a trend towards up-regulation in the order: healthy < sepsis survivors < sepsis patients who died (Figure 5A). Immune cell infiltration differed between sepsis patients and controls (Figure S1A). Infiltration by most types of immune cells was significantly higher in sepsis survivors than in controls, and lower in sepsis patients who died than in those who survived (Figure S1B). In these immune cells, CD8+ T cells are a subtype of cytotoxic T cells.33 Among the correlations between immune cells and key genes, SLC2A6 showed the strongest positive correlation with Th1 cells (Figure 5B).
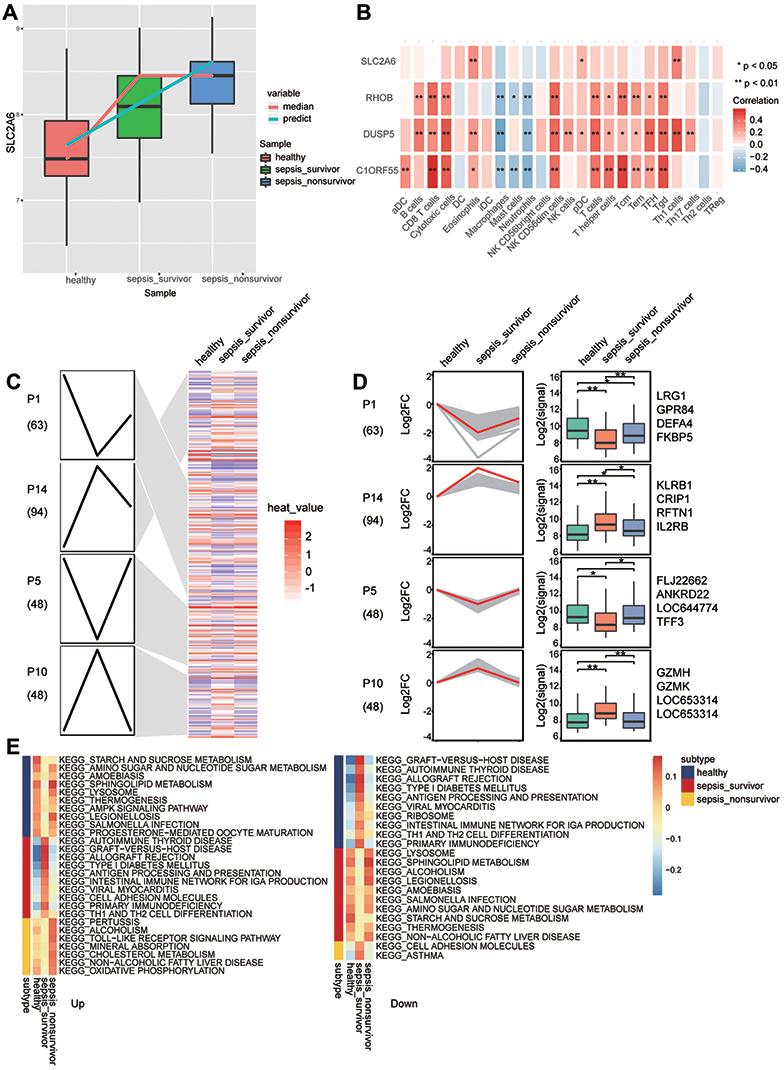 |
Figure 5 Persistently dysregulated gene expression during sepsis development. (A) The expression of SCL2A6 was persistently elevated during sepsis development. (B) Pearson correlation of immune infiltrating cells with the key genes. Red nodes indicate positive correlation, and blue nodes indicate negative correlation. *P < 0.05, **P < 0.01. (C) Heatmap of gene sets showing persistent up- or down-regulation that increased in the trend: healthy controls < sepsis survivors < sepsis patients who died. Gene sets were arranged based on cluster assignment to generate simplified expression profiles. We graphically depict only 4 modules with >40 genes. (D) The box plots of STEM genes in 4 clusters. Line plots and box plots were used to display, respectively, fold changes (log2FC) or absolute expression levels based on fragments per kilobase per million reads (log2 fragments per kilobase million). Representative genes were highlighted using red lines. The key genes were located on the right side of the box map. *P < 0.05, **P < 0.01. (E) Signaling pathways persistently up- or down-regulated as sepsis develops. Red nodes in the heatmap represent up-regulated signaling pathways, while blue nodes represent down-regulated signaling pathways. |
Cluster analysis revealed that 253 persistently dysregulated genes significantly clustered into four modules (Figure 5C and D). Subtype GSEA results showed that in sepsis patients who died, the Toll-like receptor signaling pathway and cholesterol metabolism were up-regulated, while asthma and cell adhesion molecules were consistently down-regulated (Figure 5E).
Discussion
Sepsis causes life-threatening organ dysfunction and is a medical emergency associated with high mortality and long-term disability in survivors.34 The present study analyzed differences in gene expression between sepsis patients and healthy controls and identified changes in immune and metabolic functions associated with these genes. Importantly, a combination of the LASSO model and AUCs identified SLC2A6, C1ORF55, DUSP5, and RHOB as having a diagnostic role in sepsis, especially SLC2A6, which may be a marker for early diagnosis and prognosis.
Identification of disease-associated modules by coexpression analysis has emerged as a powerful approach to gain new insights into disease biology.35 Gene sets showing synergistic expression patterns were screened using WGCNA. The enrichment results showed that the immune response was significantly up-regulated in sepsis, while metabolism was significantly down-regulated. Interferon - γ (IFN - γ), which is produced by activated T and natural killer (NK) cells, is an important immunoregulatory factor.36 In a rat model of sepsis, the survival time of rats is prolonged by increasing the number of T cells and NK cells as well as up-regulating IFN - γ.37 In fact, administering IFN - γ to patients with sepsis to strengthen the immune response has emerged as a plausible treatment and has been associated with better prognosis.38 Researchers have suggested that therapeutic interventions that suppress excessive inflammation, shift catabolism to anabolism, and enhance immune function may be beneficial once the initial symptoms of sepsis resolve.39,40 Indeed, persistent immunosuppression can lead to sepsis and consequently worse outcomes and higher long-term mortality.41 Sepsis dramatically decreases the number of pre-existing memory CD4 T cells and impairs their function, such that sepsis survivors are at higher risk of secondary infections.42 The finding that the immune response was significantly up-regulated in our analysis may be related to the larger proportion of survival patients with sepsis and the fact that all survivors were in early stages of sepsis.
Restoration of immune system function is extremely important for the prognosis of patients with sepsis.43 Th1 cells release mainly the proinflammatory cytokine IFN - γ, which induces cell phagocytosis and intracellular killing of microorganisms, and Th1 cells interact with Th2 cells to jointly regulate infection clearance.44 The results of this study showed that Th1 cells were up-regulated in sepsis, while Th2 cells were down-regulated, and that sepsis patients with persistently higher ratios of Th2 to Th1 cell numbers had the highest mortality.45 During the inflammatory process, VEGF promotes vascular dilation and permeability, disrupting the endothelial barrier.46 VEGF-A levels are increased in patients with sepsis in the ICU, and VEGF-A levels correlate with the severity of sepsis.47 HIF-1 α expression is elevated in patients with sepsis, and inhibition of HIF-1 α activity may be a novel therapeutic target for sepsis.48
We obtained a 25-gene signature and further identified SLC2A6, C1ORF55, DUSP5 and RHOB as key genes based on the LASSO model and AUCs. The AUCs were validated in the GSE54514 and GSE25504 datasets, suggesting that they are potential diagnostic markers for sepsis not only in adults but also in children. Studies have shown that SLC2A6 is associated with lipopolysaccharide (LPS)-induced inflammatory responses.49 SLC2A6 expression is up-regulated in cells infected with Gram-positive bacteria.50 A common up-regulated gene after infection, SLC2A6, which is regulated by nuclear factor - κ B (NF - κ B), encodes a protein transporter involved in metabolic responses.51,52 Expression of C1ORF55 has been associated with prognosis of breast cancer patients.53 Although we are unaware of studies suggesting a link between C1ORF55 and sepsis, the results of our analysis suggest that it may be beneficial for the early diagnosis of sepsis. Dual specificity phosphatase 5 (DUSP5) is induced during LPS-mediated inflammation and inhibits the activity of NF-κ B.54 In addition, DUSP5 specifically targets the inactivation of the ERK 1/2 signaling pathway.55 DUSP5 can be significantly induced after LPS stimulation and mycobacterial infection, which is beneficial for granulocyte development.56,57 Knocking DUSP5 out in mice promotes T cell proliferation and cell death.58 RhoGTPases are important for maintaining the endothelial barrier, and during inflammation, RHOB negatively regulates Rac-1 membrane translocation and prevents Rac-1-mediated restoration of the integrity of injured endothelium.59,60 It is clear that inflammatory and anti-inflammatory responses, as well as innate and adaptive immune systems, are equally important and are likely to be targets for future immunotherapy to improve long-term sepsis outcomes.61,62
The potential limitations of this study need to be taken into account when interpreting the findings. First, the GSE54514 and GSE25504 datasets contain different populations of sepsis patients and controls, which may affect interpretation of the results. In addition, we were able to compare immune cell infiltration between sepsis patients who survived or died in the GSE54514 dataset, but further studies should analyze the two groups for additional differences. Second, because the data we analyzed were obtained from public databases, further experimental studies are necessary to validate the findings of this study.
Conclusion
In summary, our four key genes may have important implications for the early diagnosis of patients with sepsis. The analysis suggests that in the early stage of sepsis, the immune response is enhanced, while the metabolic response is weakened. Further analysis is needed to investigate the molecular mechanisms by which the four key genes affect the prognosis of patients with sepsis.
Acknowledgments
This study was supported by the Project of Qingxiu District of Nanning Scientific Research and Technology Development Plan (2020059), the High-Level Medical Expert Training Program of Guangxi “139” Plan Funding (G201903049) and Guangxi Medical and Health Key Discipline Construction Project (Department of Emergency Medicine and Clinical Laboratory).
Disclosure
The authors report no conflicts of interest with this work.
References
1. Singer M, Deutschman CS, Seymour CW, et al. The third international consensus definitions for sepsis and septic shock (Sepsis-3). JAMA. 2016;315(8):801–810. doi:10.1001/jama.2016.0287
2. Zheng X, Luo Y, Li Q, et al. Two gene set variation index as biomarker of bacterial and fungal sepsis. Biomed Res Int. 2020;2020:8182358. doi:10.1155/2020/8182358
3. Fleischmann-Struzek C, Mikolajetz A, Schwarzkopf D, et al. Challenges in assessing the burden of sepsis and understanding the inequalities of sepsis outcomes between National Health Systems: secular trends in sepsis and infection incidence and mortality in Germany. Intensive Care Med. 2018;44(11):1826–1835. doi:10.1007/s00134-018-5377-4
4. Zhang J, Luo Y, Wang X, et al. Global transcriptional regulation of STAT3- and MYC-mediated sepsis-induced ARDS. Ther Adv Respir Dis. 2019;13:1753466619879840. doi:10.1177/1753466619879840
5. Rudd KE, Johnson SC, Agesa KM, et al. Global, regional, and national sepsis incidence and mortality, 1990–2017: analysis for the Global Burden of Disease Study. Lancet. 2020;395(10219):200–211. doi:10.1016/S0140-6736(19)32989-7
6. Markwart R, Saito H, Harder T, et al. Epidemiology and burden of sepsis acquired in hospitals and intensive care units: a systematic review and meta-analysis. Intensive Care Med. 2020;46(8):1536–1551. doi:10.1007/s00134-020-06106-2
7. Candel FJ, Borges SM, Belda S, et al. Current aspects in sepsis approach. Turning things around. Rev Esp Quimioter. 2018;31(4):298–315.
8. Angus DC, van der Poll T. Severe sepsis and septic shock. N Engl J Med. 2013;369(21):2063. doi:10.1056/NEJMc1312359
9. Fleischmann C, Thomas-Rueddel DO, Hartmann M, et al. Hospital incidence and mortality rates of sepsis. Dtsch Arztebl Int. 2016;113(10):159–166. doi:10.3238/arztebl.2016.0159
10. Fleischmann C, Scherag A, Adhikari NK, et al. Assessment of global incidence and mortality of hospital-treated sepsis. Current estimates and limitations. Am J Respir Crit Care Med. 2016;193(3):259–272. doi:10.1164/rccm.201504-0781OC
11. Lindell RB, Nishisaki A, Weiss SL, et al. Comparison of methods for identification of pediatric severe sepsis and septic shock in the virtual pediatric systems database. Crit Care Med. 2019;47(2):e129–e135. doi:10.1097/CCM.0000000000003541
12. Yealy DM, Huang DT, Delaney A, et al. Recognizing and managing sepsis: what needs to be done? BMC Med. 2015;13(1):98. doi:10.1186/s12916-015-0335-2
13. Dellinger RP, Levy MM, Rhodes A, et al. Surviving sepsis campaign: international guidelines for management of severe sepsis and septic shock, 2012. Intensive Care Med. 2013;39(2):165–228. doi:10.1007/s00134-012-2769-8
14. Myhren H, Ekeberg O, Toien K, Karlsson S, Stokland O. Posttraumatic stress, anxiety and depression symptoms in patients during the first year post intensive care unit discharge. Crit Care. 2010;14(1):R14. doi:10.1186/cc8870
15. Denstaedt SJ, Singer BH, Standiford TJ. Sepsis and nosocomial infection: patient characteristics, mechanisms, and modulation. Front Immunol. 2018;9:2446. doi:10.3389/fimmu.2018.02446
16. Kaynar AM, Yende S, Zhu L, et al. Effects of intra-abdominal sepsis on atherosclerosis in mice. Crit Care. 2014;18(5):469. doi:10.1186/s13054-014-0469-1
17. Denstaedt SJ, Spencer-Segal JL, Newstead MW, et al. S100A8/A9 drives neuroinflammatory priming and protects against anxiety-like behavior after sepsis. J Immunol. 2018;200(9):3188–3200. doi:10.4049/jimmunol.1700834
18. Zingarelli B, Coopersmith CM, Drechsler S, et al. Part I: minimum quality threshold in preclinical sepsis studies (MQTiPSS) for study design and humane modeling endpoints. Shock. 2019;51(1):10–22. doi:10.1097/SHK.0000000000001243
19. Markwart R, Condotta SA, Requardt RP, et al. Immunosuppression after sepsis: systemic inflammation and sepsis induce a loss of naive T-cells but no enduring cell-autonomous defects in T-cell function. PLoS One. 2014;9(12):e115094. doi:10.1371/journal.pone.0115094
20. Annane D. What is the evidence for harm of neuromuscular blockade and corticosteroid use in the intensive care unit? Semin Respir Crit Care Med. 2016;37(1):51–56. doi:10.1055/s-0035-1570355
21. Ammer-Herrmenau C, Kulkarni U, Andreas N, et al. Sepsis induces long-lasting impairments in CD4+ T-cell responses despite rapid numerical recovery of T-lymphocyte populations. PLoS One. 2019;14(2):e0211716. doi:10.1371/journal.pone.0211716
22. Adrie C, Lugosi M, Sonneville R, et al. Persistent lymphopenia is a risk factor for ICU-acquired infections and for death in ICU patients with sustained hypotension at admission. Ann Intensive Care. 2017;7(1):30. doi:10.1186/s13613-017-0242-0
23. Eitze S, Fleischmann-Struzek C, Betsch C, Reinhart K. Vaccination60+ study g. Determinants of sepsis knowledge: a representative survey of the elderly population in Germany. Crit Care. 2018;22(1):273. doi:10.1186/s13054-018-2208-5
24. Lu J, Li Q, Wu Z, et al. Two gene set variation indexes as potential diagnostic tool for sepsis. Am J Transl Res. 2020;12(6):2749–2759.
25. Du P, Kibbe WA, Lin SM. lumi: a pipeline for processing Illumina microarray. Bioinformatics. 2008;24(13):1547–1548. doi:10.1093/bioinformatics/btn224
26. Ritchie ME, Phipson B, Wu D, et al. limma powers differential expression analyses for RNA-sequencing and microarray studies. Nucleic Acids Res. 2015;43(7):e47. doi:10.1093/nar/gkv007
27. Langfelder P, Horvath S. WGCNA: an R package for weighted correlation network analysis. BMC Bioinform. 2008;9(1):559. doi:10.1186/1471-2105-9-559
28. Yu G, Wang LG, Han Y, He QY. clusterProfiler: an R package for comparing biological themes among gene clusters. OMICS. 2012;16(5):284–287. doi:10.1089/omi.2011.0118
29. Subramanian A, Tamayo P, Mootha VK, et al. Gene set enrichment analysis: a knowledge-based approach for interpreting genome-wide expression profiles. Proc Natl Acad Sci U S A. 2005;102(43):15545–15550. doi:10.1073/pnas.0506580102
30. Hanzelmann S, Castelo R, Guinney J. GSVA: gene set variation analysis for microarray and RNA-seq data. BMC Bioinform. 2013;14(1):7. doi:10.1186/1471-2105-14-7
31. Robin X, Turck N, Hainard A, et al. pROC: an open-source package for R and S+ to analyze and compare ROC curves. BMC Bioinform. 2011;12:77. doi:10.1186/1471-2105-12-77
32. Ernst J, Bar-Joseph Z. STEM: a tool for the analysis of short time series gene expression data. BMC Bioinform. 2006;7(1):191. doi:10.1186/1471-2105-7-191
33. Bindea G, Mlecnik B, Tosolini M, et al. Spatiotemporal dynamics of intratumoral immune cells reveal the immune landscape in human cancer. Immunity. 2013;39(4):782–795. doi:10.1016/j.immuni.2013.10.003
34. Fleischmann-Struzek C, Mellhammar L, Rose N, et al. Incidence and mortality of hospital- and ICU-treated sepsis: results from an updated and expanded systematic review and meta-analysis. Intensive Care Med. 2020;46(8):1552–1562. doi:10.1007/s00134-020-06151-x
35. Grobner SN, Worst BC, Weischenfeldt J, et al. The landscape of genomic alterations across childhood cancers. Nature. 2018;555(7696):321–327. doi:10.1038/nature25480
36. Ivin M, Dumigan A, de Vasconcelos FN, et al. Natural killer cell-intrinsic type I IFN signaling controls Klebsiella pneumoniae growth during lung infection. PLoS Pathog. 2017;13(11):e1006696. doi:10.1371/journal.ppat.1006696
37. Zhao X, Qi H, Zhou J, Xu S, Gao Y. Treatment with recombinant Interleukin-15 (IL-15) increases the number of T cells and natural killer (NK) cells and levels of interferon-gamma (IFN-gamma) in a rat model of sepsis. Med Sci Monit. 2019;25:4450–4456. doi:10.12659/MSM.914026
38. Tissieres P, Ochoda A, Dunn-Siegrist I, et al. Innate immune deficiency of extremely premature neonates can be reversed by interferon-gamma. PLoS One. 2012;7(3):e32863. doi:10.1371/journal.pone.0032863
39. Gauglitz GG, Williams FN, Herndon DN, Jeschke MG. Burns: where are we standing with propranolol, oxandrolone, recombinant human growth hormone, and the new incretin analogs? Curr Opin Clin Nutr Metab Care. 2011;14(2):176–181. doi:10.1097/MCO.0b013e3283428df1
40. Norbury WB, Jeschke MG, Herndon DN. Metabolism modulators in sepsis: propranolol. Crit Care Med. 2007;35(9 Suppl):S616–20. doi:10.1097/01.CCM.0000278599.30298.80
41. Delano MJ, Ward PA. The immune system’s role in sepsis progression, resolution, and long-term outcome. Immunol Rev. 2016;274(1):330–353. doi:10.1111/imr.12499
42. Sjaastad FV, Kucaba TA, Dileepan T, et al. Polymicrobial sepsis impairs antigen-specific memory CD4 T cell-mediated immunity. Front Immunol. 2020;11:1786. doi:10.3389/fimmu.2020.01786
43. Martin AN, Alexander-Miller M, Yoza BK, Vachharajani V, McCall CE. Sirtuin1 targeting reverses innate and adaptive immune tolerance in septic mice. J Immunol Res. 2018;2018:2402593. doi:10.1155/2018/2402593
44. Hirahara K, Nakayama T. CD4+ T-cell subsets in inflammatory diseases: beyond the Th1/Th2 paradigm. Int Immunol. 2016;28(4):163–171. doi:10.1093/intimm/dxw006
45. Xue M, Xie J, Liu L, et al. Early and dynamic alterations of Th2/Th1 in previously immunocompetent patients with community-acquired severe sepsis: a prospective observational study. J Transl Med. 2019;17(1):57. doi:10.1186/s12967-019-1811-9
46. Konig M, Nentwig A, Marti E, Mirkovitch J, Adamik KN, Schuller S. Evaluation of plasma angiopoietin-2 and vascular endothelial growth factor in healthy dogs and dogs with systemic inflammatory response syndrome or sepsis. J Vet Intern Med. 2019;33(2):569–577. doi:10.1111/jvim.15369
47. Alves BE, Montalvao SA, Aranha FJ, et al. Time-course of sFlt-1 and VEGF-A release in neutropenic patients with sepsis and septic shock: a prospective study. J Transl Med. 2011;9(1):23. doi:10.1186/1479-5876-9-23
48. Hirota K. Involvement of hypoxia-inducible factors in the dysregulation of oxygen homeostasis in sepsis. Cardiovasc Hematol Disord Drug Targets. 2015;15(1):29–40. doi:10.2174/1871529x15666150108115553
49. Das A, Chai JC, Kim SH, et al. Dual RNA sequencing reveals the expression of unique transcriptomic signatures in lipopolysaccharide-induced BV-2 microglial cells. PLoS One. 2015;10(3):e0121117. doi:10.1371/journal.pone.0121117
50. Tchatalbachev S, Ghai R, Hossain H, Chakraborty T. Gram-positive pathogenic bacteria induce a common early response in human monocytes. BMC Microbiol. 2010;10(1):275. doi:10.1186/1471-2180-10-275
51. Eisenreich W, Heesemann J, Rudel T, Goebel W. Metabolic host responses to infection by intracellular bacterial pathogens. Front Cell Infect Microbiol. 2013;3:24. doi:10.3389/fcimb.2013.00024
52. Tripathi AK, Sha W, Shulaev V, Stins MF, Sullivan DJ. Plasmodium falciparum-infected erythrocytes induce NF-kappaB regulated inflammatory pathways in human cerebral endothelium. Blood. 2009;114(19):4243–4252. doi:10.1182/blood-2009-06-226415
53. Relator RT, Terada A, Sese J. Identifying statistically significant combinatorial markers for survival analysis. BMC Med Genomics. 2018;11(Suppl 2):31. doi:10.1186/s12920-018-0346-x
54. Seo H, Cho YC, Ju A, et al. Dual-specificity phosphatase 5 acts as an anti-inflammatory regulator by inhibiting the ERK and NF-kappaB signaling pathways. Sci Rep. 2017;7(1):17348. doi:10.1038/s41598-017-17591-9
55. Seternes OM, Kidger AM, Keyse SM. Dual-specificity MAP kinase phosphatases in health and disease. Biochim Biophys Acta Mol Cell Res. 2019;1866(1):124–143. doi:10.1016/j.bbamcr.2018.09.002
56. Hansen M, Peltier J, Killy B, et al. Macrophage phosphoproteome analysis reveals MINCLE-dependent and -independent mycobacterial cord factor signaling. Mol Cell Proteomics. 2019;18(4):669–685. doi:10.1074/mcp.RA118.000929
57. Lang R, Raffi FAM. Dual-specificity phosphatases in immunity and infection: an update. Int J Mol Sci. 2019;20(11):11. doi:10.3390/ijms20112710
58. Kutty RG, Xin G, Schauder DM, et al. Dual specificity phosphatase 5 is essential for T cell survival. PLoS One. 2016;11(12):e0167246. doi:10.1371/journal.pone.0167246
59. Pronk MCA, van Bezu JSM, van Nieuw Amerongen GP, van Hinsbergh VWM, Hordijk PL. RhoA, RhoB and RhoC differentially regulate endothelial barrier function. Small GTPases. 2019;10(6):466–484. doi:10.1080/21541248.2017.1339767
60. Marcos-Ramiro B, Garcia-Weber D, Barroso S, et al. RhoB controls endothelial barrier recovery by inhibiting Rac1 trafficking to the cell border. J Cell Biol. 2016;213(3):385–402. doi:10.1083/jcb.201504038
61. Bosmann M, Ward PA. The inflammatory response in sepsis. Trends Immunol. 2013;34(3):129–136. doi:10.1016/j.it.2012.09.004
62. Hotchkiss RS, Monneret G, Payen D. Sepsis-induced immunosuppression: from cellular dysfunctions to immunotherapy. Nat Rev Immunol. 2013;13(12):862–874. doi:10.1038/nri3552
 © 2021 The Author(s). This work is published and licensed by Dove Medical Press Limited. The full terms of this license are available at https://www.dovepress.com/terms.php and incorporate the Creative Commons Attribution - Non Commercial (unported, v3.0) License.
By accessing the work you hereby accept the Terms. Non-commercial uses of the work are permitted without any further permission from Dove Medical Press Limited, provided the work is properly attributed. For permission for commercial use of this work, please see paragraphs 4.2 and 5 of our Terms.
© 2021 The Author(s). This work is published and licensed by Dove Medical Press Limited. The full terms of this license are available at https://www.dovepress.com/terms.php and incorporate the Creative Commons Attribution - Non Commercial (unported, v3.0) License.
By accessing the work you hereby accept the Terms. Non-commercial uses of the work are permitted without any further permission from Dove Medical Press Limited, provided the work is properly attributed. For permission for commercial use of this work, please see paragraphs 4.2 and 5 of our Terms.