")
Back to Journals » International Journal of General Medicine » Volume 15
Identification of Potential Core Genes Between Primary and Metastatic Malignant Melanoma and Analysis of Their Immune Correlation
Authors Jia CL, Yang F , Li RN
Received 27 October 2021
Accepted for publication 20 December 2021
Published 11 January 2022 Volume 2022:15 Pages 379—391
DOI https://doi.org/10.2147/IJGM.S338890
Checked for plagiarism Yes
Review by Single anonymous peer review
Peer reviewer comments 2
Editor who approved publication: Dr Scott Fraser
Cong-Li Jia,1 Fu Yang,2 Rui-Ning Li3
1Weifang Medical College, Weifang, Shandong, People’s Republic of China; 2Department of Hepatobiliary Surgery, First Affiliated Hospital of Kunming Medical University, Kunming, Yunnan, People’s Republic of China; 3Second Clinical Medical College, Lanzhou University, Lanzhou, Gansu, People’s Republic of China
Correspondence: Fu Yang
Department of Hepatobiliary Surgery, First Affiliated Hospital of Kunming Medical University, No. 295, Xi Chang Road, Kunming, Yunnan, 650032, People’s Republic of China
Tel +86 13888428338
Email [email protected]
Purpose: To identify the potential differential genes between primary and metastatic melanoma, screen out immune-related genes in core genes and analyze their immune correlation, thus searching for the early diagnostic biomarkers of cutaneous malignant melanoma (CMM) and the targets of curbing metastasis.
Materials and Methods: We analyzed two microarray datasets (GSE8401 and GSE46517) derived from the Gene Expression Omnibus (GEO) database. Differentially expressed genes (DEGs) between primary and metastatic melanoma were screened out using the GEO2R tool. Gene Ontology (GO) and Kyoto Encyclopedia of Genes and Genomes (KEGG) pathway enrichment analysis were performed to identify the functions and pathways of DEGs. We analyzed protein–protein interaction of these DEGs based on the Search Tool for the Retrieval of Interacting Genes database and showed by Cytoscape software. In addition, the online Gene Expression Profiling Interactive Analysis tool (GEPIA) was used to analyze the prognostic value of hub genes expressed in metastatic melanoma patients. Immune-related genes in hub genes were screened and further analyzed.
Results: A total of 178 upregulated DEGs and 4 downregulated DEGs were identified. 23 terms and 4 pathways were confirmed related to metastatic melanoma. Ten hub genes with a high degree of connectivity were found. Overexpression of three hub genes (DSG1, FLG, PKP1) (P< 0.01) was associated with metastasis and poor prognosis of CMM. Among them, the patients with overexpression of PKP1 suffered shorter survival. In addition, 2 immune-related genes (EGFR and CDH1) in hub genes were screened out and both of them were related to anti-tumor immunity, although their expression level did not affect the overall survival of CMM patients significantly.
Conclusion: Our study suggests that DSG1, FLG and PKP1 were overexpressed in metastatic melanoma compared with primary melanoma, and overexpression of these three genes was an unfavorable prognostic factor ifor CMM patients, which may indicate that they are associated with promoting metastasis of malignant melanoma. EGFR and CDH1 play a crucial role in anti-tumor immunity for CMM. Further research is needed to explore the value of these genes in the inhibition of metastasis and treatment of CMM.
Keywords: cutaneous malignant melanoma, metastasis, genes, PKP1, DSG1, FLG, CDH1, EGFR
Introduction
Cutaneous malignant melanoma is a highly malignant tumor originating from skin melanocytes, which is usually ignored as melanin nevus in the early stage.1 Once metastasis occurs, the cure rate is low. The primary lesion is often seen in the lower extremities, and a few can occur in tissues and organs, such as digestive tract and eyes. CMM with insidious onset is prone to metastasis and diffusion. Currently, surgery combined with radiotherapy, chemotherapy and high-dose interferon are the main treatment methods for CMM, but the prognosis is unfavorable. Despite the rise of immunotherapy targeting certain mutated genes in recent years, the survival rate is still low.2 Metastatic potential for CMM is very high, and the prognosis of patients with metastatic tumor is very poor. Molecular targeted therapy is the main strategy for the treatment of metastatic melanoma, however, lacking targets to inhibit tumor metastasis results that only a small number of patients can benefit.3 Recent studies have focused on finding diagnostic biomarkers and therapeutic targets for malignant melanoma, but their focus is mostly on identifying gene expression differences between normal tissues and tumors, while few studies have explored genes differentially expressed between primary cancer and metastatic cancer. However, early melanoma treatment is often delayed due to misdiagnosis, and intervention before metastasis may be a promising strategy for improving survival. Due to this, it is urgent to find novel biomarkers in the genetic differences between primary and metastatic melanoma to guide early diagnosis and treatment.
In this study, we sought to explore new indicators of metastasis in CMM and to provide new therapeutic targets for this disease. To detect the DEGs between metastatic and primary tumor, bioinformatics methods were used to analyze the gene expression profiling data downloaded from the GEO database. We performed GO function and KEGG pathway enrichment to analyze DEGs. In addition, a protein–protein interaction (PPI) network was established to confirm hub genes associated with metastatic melanoma. The survival analysis of these hub genes was performed to screen out genes associated with poor prognosis as biomarkers for further research. More importantly, we screened out immune-related genes for anti-tumor immunity analysis.
Materials and Methods
Data Acquisition
The gene expression datasets analyzed in our study were downloaded from the GEO database (https://www.ncbi.nlm.nih.gov/geo/). A total of 1154 series for human cutaneous malignant melanoma were retrieved from the database. After careful screening, two gene expression profiles (GSE8401 and GSE46517) were picked out. Both gene expression profiles GSE8401 and GSE46517 were based on platform GPL96 ([HG-U133A] Affymetrix Human Genome U133A Array). All the data were freely available online, and the study did not refer to any experiments on humans or animals by any of the authors.
Differential Genes Screening
We used GEO2R online analysis tool (https://www.ncbi.nlm.nih.gov/geo/geo2r/) to screen the DEGs between metastatic malignant melanoma and primary tumor samples. Genes that matched the cutoff criteria, adjusted P<0.05 and |logFC|≥1.5, were viewed as DEGs. For each dataset, a statistical analysis was performed, and the Venn diagram online tool (http://bioinformatics.psb.ugent.be/webtools/Venn/) was used to identify the intersected portion.
GO Functions and KEGG Pathways Analysis of DEGs
GO analysis is mainly used to study functional enrichment of genes. Gene functions include biological process (BP), molecular function (MF), and cellular component (CC). KEGG, as a database, can be used to analyze the pathway enrichment of genes. In this study, the Database for Annotation, Visualization and Integrated Discovery (DAVID) online tools (https://david.ncifcrf.gov/) were designed to carry out the GO function analysis and KEGG pathway enrichment analysis of DEGs. P<0.01 and gene counts≥10 were considered statistically significant.
PPI Network Establishment and Hub Gene Confirming
PPI is usually searched by The Search Tool for the Retrieval of Interacting Genes (STRING) database (http://string-db.org/), which can construct PPI network. Mapping the DEGs selected previously to the STRING database to evaluate the latent PPI correlation. The PPI pairs were picked out with a combined score>0.4. Afterwards, Cytoscape software (www.cytoscape.org/) was used to plot the PPI network. The higher the connection degree of the nodes are, the more important the nodes are to maintain the stability of the protein network. We use CytoHubba, a plugin in cytoscape to calculate the degree of each protein node. In this study, ten genes with the highest connectivity were confirmed as hub genes.
Survival Analysis of Hub Genes
An online tool, Gene Expression Profiling Interactive Analysis (http://gepia.cancer-pku.cn/) is an interactive web server for analyzing the RNA sequencing expression data of tumors and normal samples, using a standard processing pipeline. The prognostic value of hub gene in metastatic melanoma was evaluated using this tool. For each gene, patients were divided into two groups according to the median values of mRNA expression. P<0.01 was considered statistically significant.
Immune-Related Gene Analysis
The immune-related gene sets were then downloaded via the website (http://www.immport.org/home). We used an online tool (http://bioinformatics.psb.ugent.be/webtools/Venn) to select the intersection of hub genes and immune-related gene sets, immune-related genes in hub genes were screened out and their immune correlation for CMM was further analyzed by TIMER online tool (http://timer.comp-genomics.org/).
Results
Identification of DEGs
Two expression profiles (GSE8401 and GSE46517) were selected in this study. Among them, GSE8401 contained 52 metastatic melanoma samples and 31 primary melanoma samples, and GSE46517 included 73 metastatic melanoma samples and 31 primary melanoma samples (Table 1). Based on the standard of P<0.05 and |logFC|≥1.5, in gene chip GSE8401, 324 DEGs were selected, containing 281 upregulated genes and 43 downregulated genes, while a total of 206 DEGs were picked out from the gene chip GSE46517, including 200 upregulated genes and 6 downregulated genes. All DEGs were identified by comparing metastatic and primary melanoma samples. The intersection of DEG profiles was showed by Venn Analysis (Figure 1). Subsequently, we identified 182 significant DEGs. Including 178 upregulated genes and 4 downregulated genes.
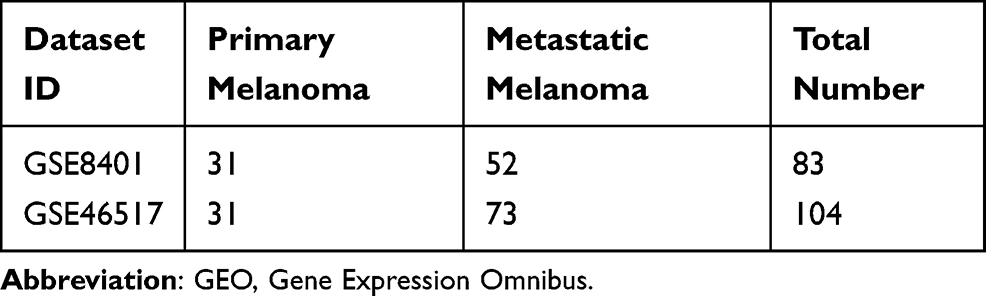 |
Table 1 Statistics of Two Gene Chips from GEO Database |
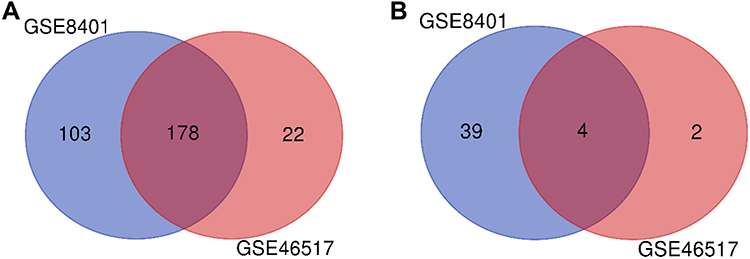 |
Figure 1 DEGs intersection graph of two chip datasets. Abbreviation: DEG, differentially expressed gene. Notes: (A) Upregulated genes. (B) Downregulated genes. |
Functional Enrichment Analyses of DEGs
We obtained the result of GO function and KEGG pathway enrichment for DEGs using the DAVID. The results of GO analysis showed that the enriched GO terms were classified into three types containing CC, BP, and MF, DEGs were mainly enriched in BPs, containing epidermis development, keratinocyte differentiation, keratinization, peptide cross-linking, single organismal cell–cell adhesion, cell adhesion, negative regulation of endopeptidase activity, extracellular matrix organization and cytoskeleton organization. CC analysis indicated that the DEGs were enriched in extracellular exosome, desmosome, cornified envelope, intermediate filament, extracellular space, cell–cell adherens junction, extracellular region and extracellular matrix. For the molecular function, the DEGs were enriched in structural molecule activity, structural constituent of cytoskeleton, calcium ion binding, serine-type peptidase activity, serine-type endopeptidase inhibitor activity and serine-type endopeptidase activity (Figure 2). Besides, KEGG pathway analysis figured out that DEGs were principally enriched in the pathway of amoebiasis, ECM–receptor interaction, protein digestion and absorption, and arrhythmogenic right ventricular cardiomyopathy (ARVC) (Figure 3).
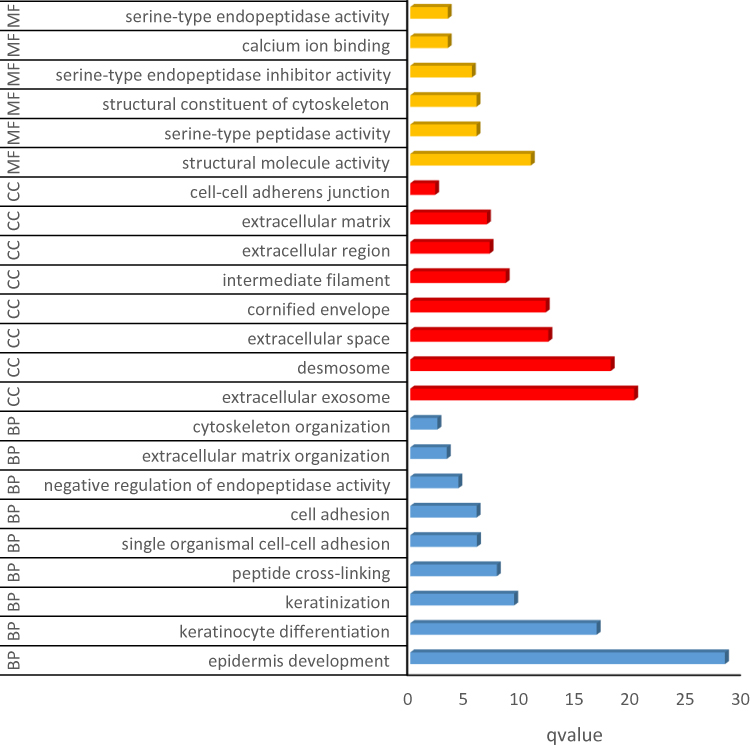 |
Figure 2 GO analysis for differentially expressed genes. Abbreviation: GO, Gene ontology. Notes: Barplot graph for GO (The longer bar means the more genes enriched. Blue: Biological Process; red: Cellular Component; yellow: Molecular Function). |
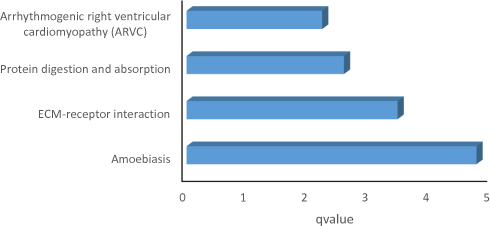 |
Figure 3 KEGG analysis for differentially expressed genes. Abbreviation: KEGG, Kyoto Encyclopedia of Genes and Genomes. Note: Barplot graph for KEGG (The longer bar means the more genes enriched). |
PPI Network Establishment and Hub Gene Identification
The protein interactions among the DEGs indicated that 182 nodes and 773 edges were detected in the PPI network (Figure 4). The average node degree is 8.49. We screened the top ten genes as hub genes according to connectivity degree in the PPI network (Table 2) and showed their interactions (Figure 5). The results suggested that cadherin 1, type 1, E-cadherin (epithelial) (CDH1; degree=43) was the most significant gene with connectivity, subsequent ones were keratin 5 (KRT5; degree=40), keratin 14 (KRT14; degree=39), epidermal growth factor receptor (EGFR, degree=38), filaggrin (FLG; degree=36), loricrin (LOR; degree=34), desmoglein 1 (DSG1; degree=33), corneodesmosin (CDSN; degree=32), desmoplakin (DSP; degree=32), and plakophilin 1 (PKP1; degree=30). All of these hub genes were upregulated in metastatic melanoma.
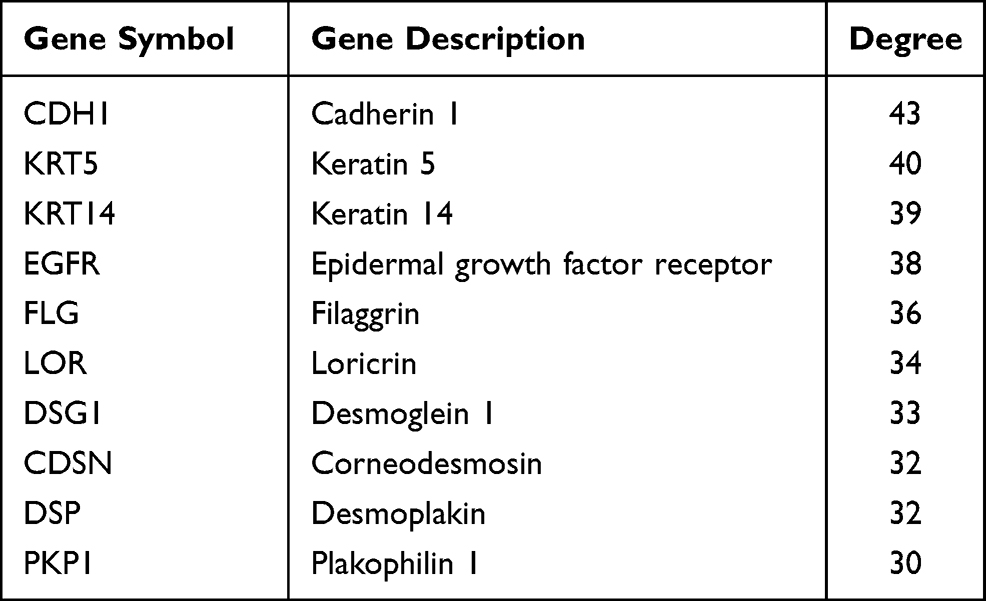 |
Table 2 Top Ten Hub Genes with the Highest Degree of Connectivity |
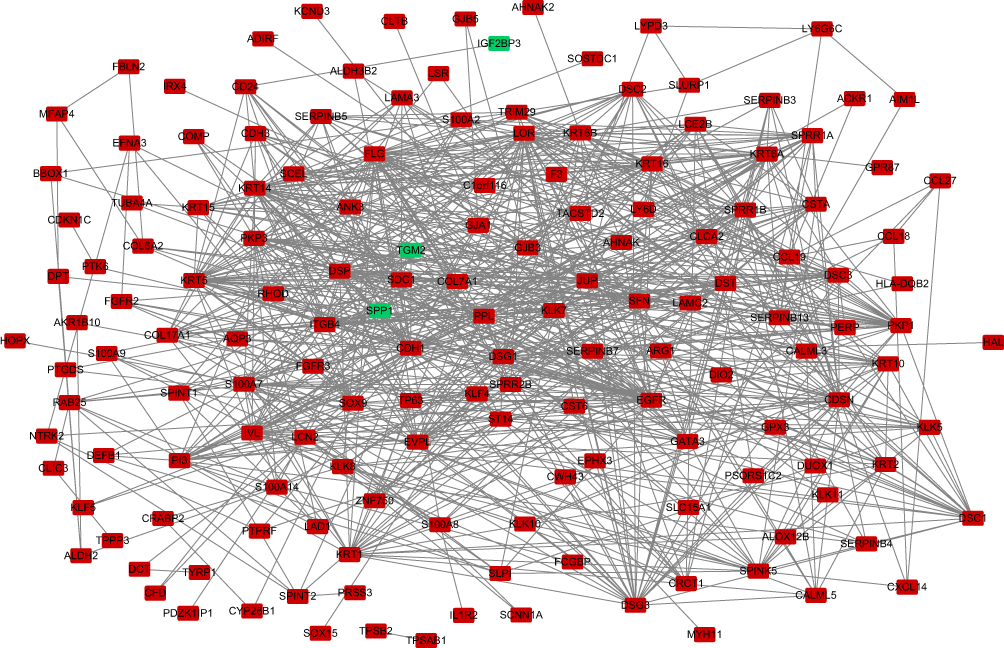 |
Figure 4 Protein–protein interaction network established with the DEGs. Abbreviation: DEG, differentially expressed gene. Note: Red nodes represent upregulated genes, and blue nodes represent downregulated genes. |
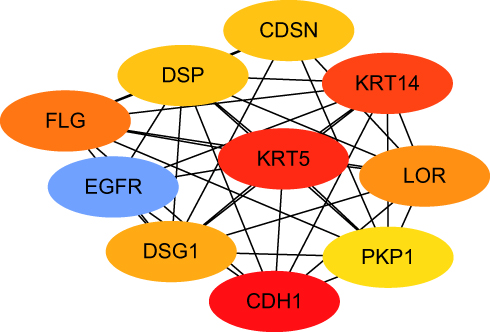 |
Figure 5 The interaction between hub genes. Abbreviations: CDH1, cadherin 1; KRT5, keratin 5; KRT14, keratin 14; EGFR, epidermal growth factor receptor; FLG, filaggrin; LOR, loricrin; DSG1, desmoglein 1; CDSN, corneodesmosin; DSP, desmoplakin; PKP1, plakophilin 1. Note: Red means most connections, blue means more connections, orange to yellow, as the color becomes lighter, the association decreases. |
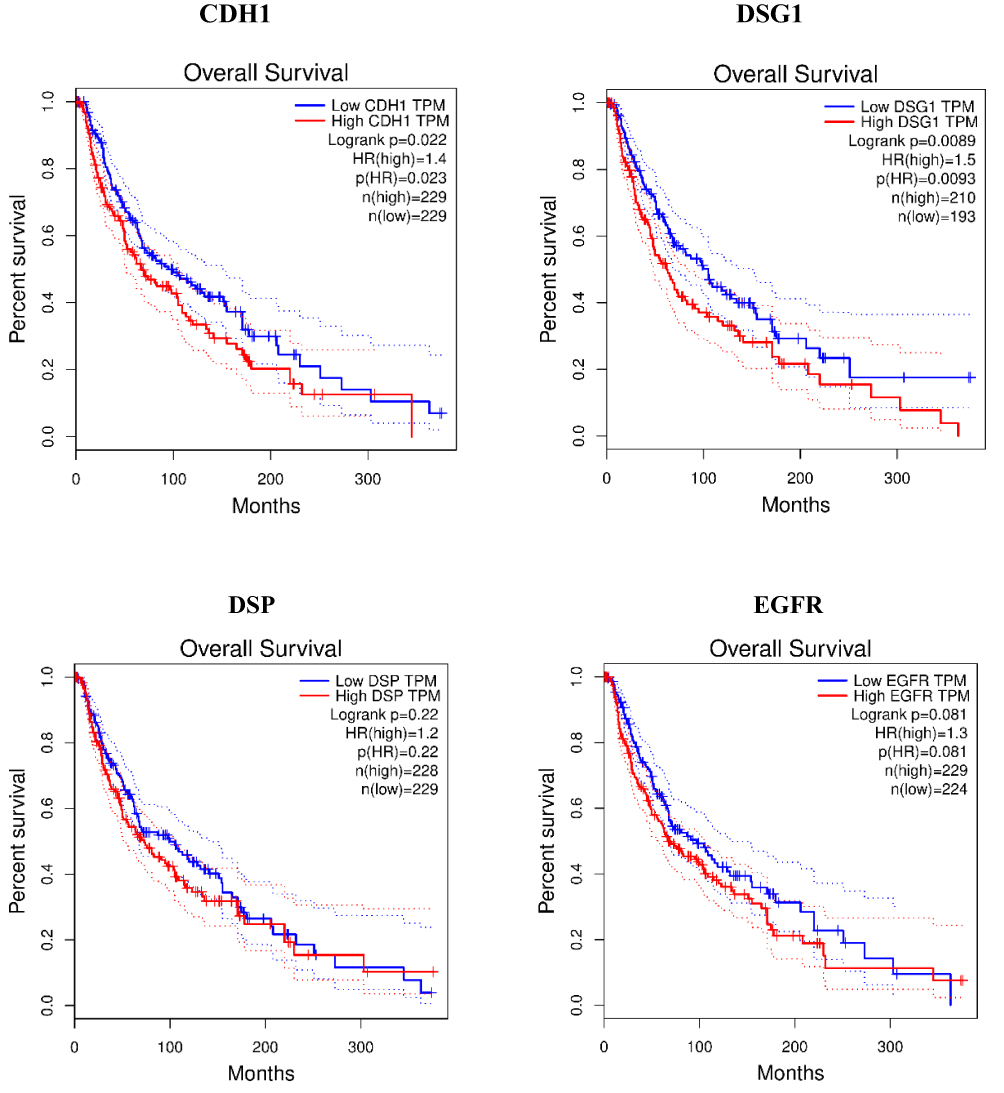 |
Figure 6 Continued. |
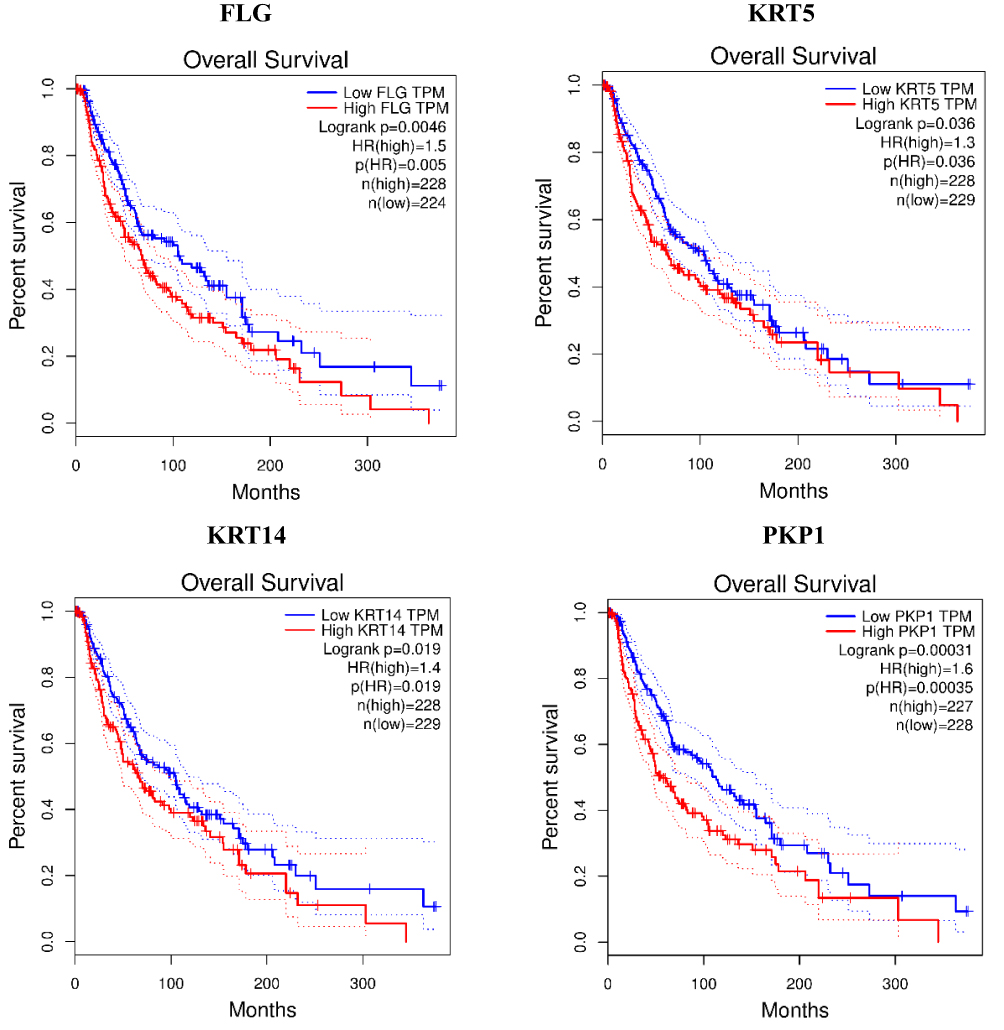 |
Figure 6 Overall survival analyses for the top ten hub genes expressed in metastatic melanoma by Gene Expression Profiling Interactive Analysis tool. Notes: Gene description can be seen in Table 2 the overall survival of CDSN and LOR cannot be obtained due to the deficiency of the sample size at the custom thresholds for these two genes. |
Survival Analysis of Core Genes
The prognostic values of the ten potential hub genes were investigated using Gene Expression Profiling Interactive Analysis (GEPIA) online tool. The overall survival of 8 potential hub genes was obtained except LOR and CDSN, due to the deficiency of the sample size at the custom thresholds for these two genes. The results showed that overexpression of three hub genes known as DSG1 (p=0.0089; HR (high)=1.5; n=403), FLG (p=0.0046; HR (high)=1.5; n=452) and PKP1 (p=0.00031; HR (high)=1.6; n=455) were significantly related to poor overall survival of malignant melanoma patients (P<0.01); among these, overexpression of PKP1 (p=0.00031; HR (high)=1.6; n=455) was more unfavorable prognostic factor for overall survival in CMM patients (Figure 6). There was no statistically significant difference in disease-free survival among the ten hub genes (P>0.01).
Immune-Related Gene Analysis
We intersected the hub genes with the immune-related genes and screened out two immune-related genes (EGFR and CDH1) (Figure 7). The relationship between EGFR or CDH1 and immune cells infiltration in metastatic melanoma was showed in Figures 8 and 9, respectively. Rho<0 represented negative correlation, while Rho>0 mean positive correlation, P<0.05 indicated the difference was statistically significant. For EGFR, CD8+T cell (Rho=−0.184) and NK cell (Rho=−0.172) were negative correlation with its expression level, meanwhile, the expression of EGFR positively affected the infiltration of Tregs (Rho=0.192). On the other hand, CDH1 had a positive correlation with CD8+T cell (Rho=0.164) and NK cell (Rho=0.174). However, the expression of CDH1 plays a negative role on Tregs (Rho=−0.152). We also analyzed the effect of several immune cells on the survival of CMM, which showed that CD8+T cell, NK cell and Tregs were associated with good prognosis (Figure 10).
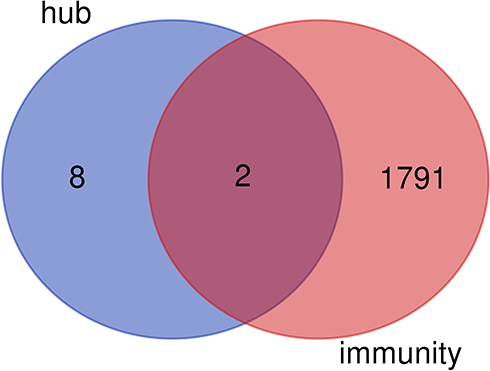 |
Figure 7 Intersection graph of hub genes and immune-related genes. |
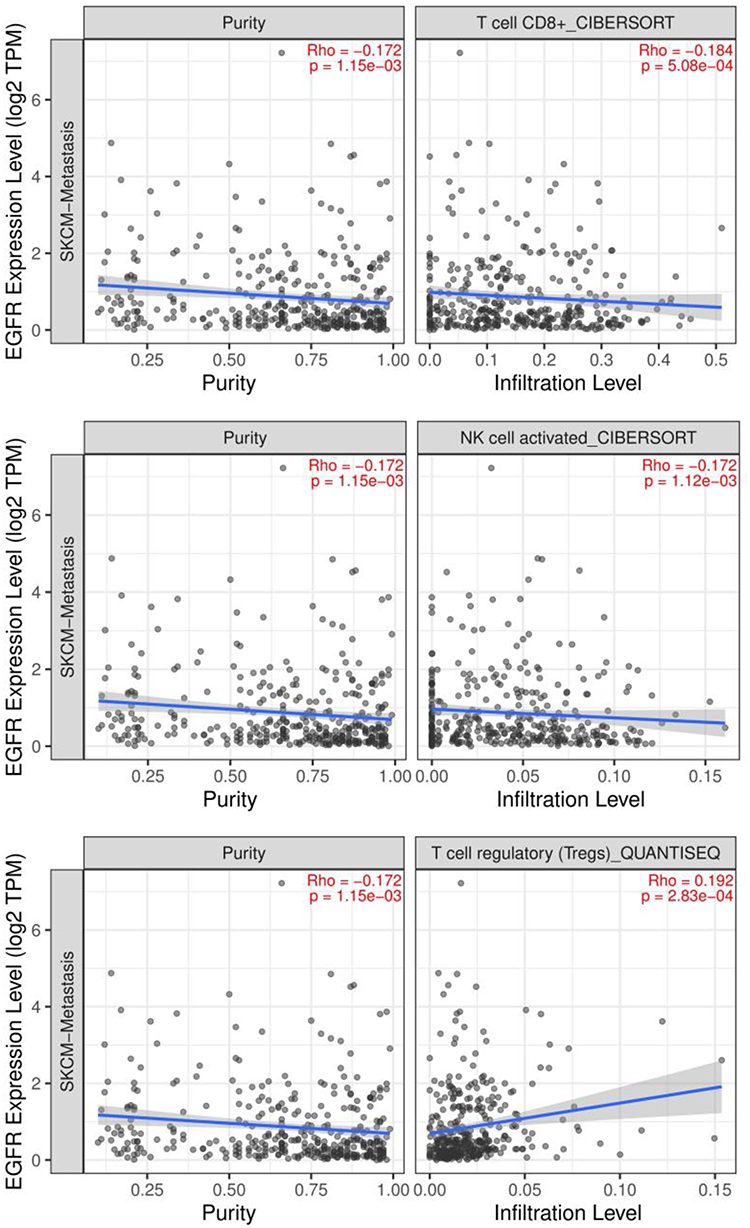 |
Figure 8 The relationship between EGFR and immune cells infiltration in metastatic melanoma. Abbreviation: EGFR, epidermal growth factor receptor. Notes: Black dots represent the number of immune cell infiltration, the more black dots, the more infiltration. The blue line represents the relationship between immune cell infiltration and gene expression level, the blue line upward sloping represents the positive relationship, the blue line downward sloping represents the negative relationship, the greater the gradient, the closer the relationship. |
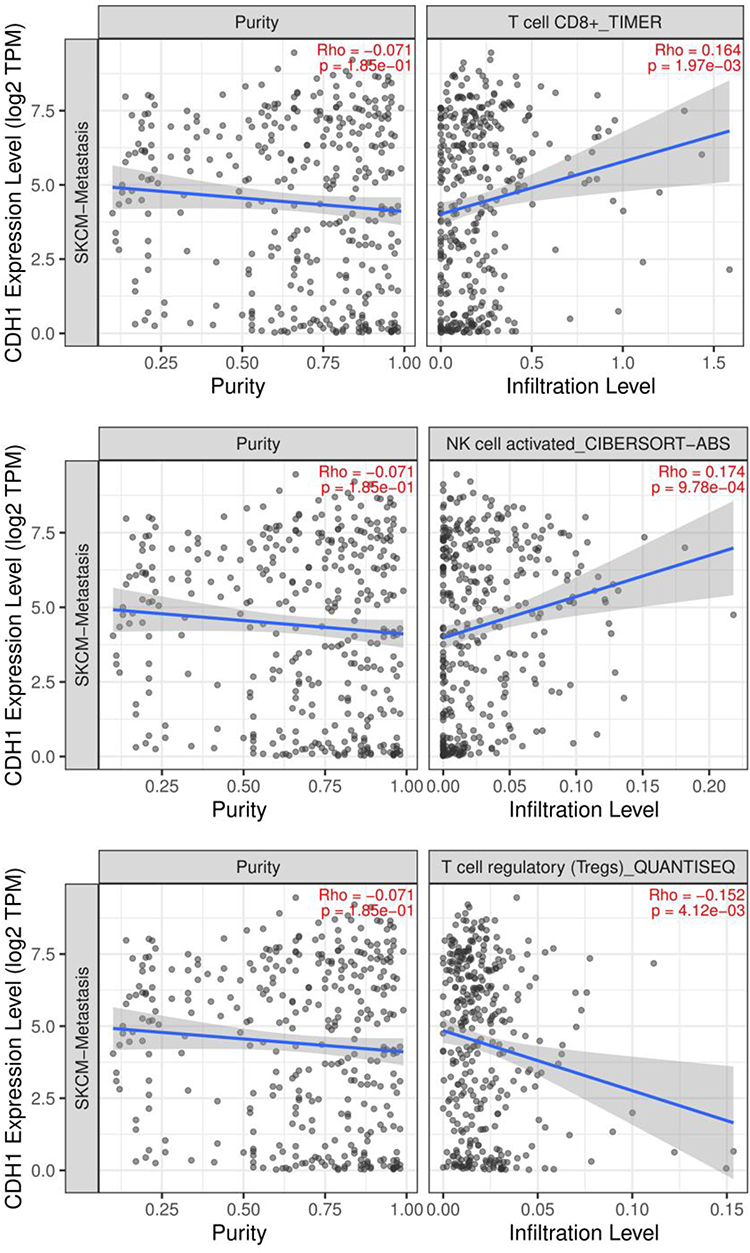 |
Figure 9 The relationship between CDH1 and immune cells infiltration in metastatic melanoma. Abbreviation: CDH1, cadherin 1. Notes: Black dots represent the number of immune cell infiltration, the more black dots, the more infiltration. The blue line represents the relationship between immune cell infiltration and gene expression level, the blue line upward sloping represents the positive relationship, the blue line downward sloping represents the negative relationship, the greater the gradient, the closer the relationship. |
 |
Figure 10 Relationship between immune cells infiltration and survival in patients with cutaneous malignant melanoma. Note: P<0.05 means significant difference. |
Discussion
Cutaneous malignant melanoma is a highly malignant tumor with insidious onset, strong invasion and high mortality deriving from melanocytes.1 Primary melanoma is easily misdiagnosed as melanin nevus and ignored. Once metastasis occurs, the 5-year survival rate is low, and the prognosis is unfavorable. Due to the lack of effective targets and biomarkers that predict metastasis, it is difficult for CMM patients to benefit from inhibition of metastasis. Meanwhile, immunotherapy, radiotherapy and chemotherapy remain the main adjuvant therapies. Nevertheless, radiation and chemotherapy are not very effective. Hence, it is urgent to confirm novel target.
In this study, to identify the underlying core genes involved in metastatic melanoma, we performed gene expression and protein interaction analyses based on public databases. DEGs between metastatic and primary melanoma were identified according to gene expression profiling data from the GEO database. The DEGs picked out were mainly correlated with the GO BP terms, such as keratinocyte differentiation, keratinization, peptide crosslinking, cell adhesion and extracellular matrix. Two of the detected KEGG pathways, known as ECM–receptor interaction and protein digestion, were associated with cancer progression. Ten core genes were screened out from the PPI network established based on DEGs, containing KRT5, FLG, KRT14, LOR, CDH1, DSP, DSG1, EGFR, PKP1, CDSN. All of these genes were upregulated in metastatic melanoma. However, among them, only overexpression of three genes including DSG1, FLG and PKP1 had a statistically significant effect on overall survival, which indicated that these three genes may play a crucial role in the metastasis and prognosis of CMM. PKP1 is considered to be an important component of desmosomes, and desmosomes are active cellular junctions that participate in cellular cohesion and are essential for maintaining tissue integrity.4 Thus, PKP1 mutations lead to fewer and poorly formed desmosomes and loss of epidermal integrity.5 Disruption of the integrity and stability of the epidermal barrier is a hallmark of cancer, which suggests that PKP1 is a cancer suppressor. Nevertheless, PKP1 overexpression has been demonstrated in several cancers, such as oral/pharyngeal squamous cell cancer and squamous cell lung cancer,6 and its expression level was negatively correlated with the degree of malignancy in oral/pharyngeal squamous cell cancer.7 In our study, PKP1 overexpressed in metastatic melanoma compared with primary melanoma. Furthermore, high expression of PKP1 was associated with shortened survival. We speculated that this might due to the fact that PKP1 exists not only in the desmosomes but also in the nucleus and cytoplasm, and it performs different functions in different cellular components.8,9 Another possibility is that PKP1 is modified during carcinogenesis and the tumor may progress due to uncontrolled adhesion and migration.10
In addition to PKP1, we also detected 9 potential core genes for metastatic melanoma, but only DSG1 and FLG were the main genes that had a significant impact on the survival of CMM patients, suggesting that DSG1 and FLG may play a role in the progression and metastasis of CMM. FLG encodes proteins that are also part of the desmosome and are involved in cell adhesion and regulation of skin barrier function.11,12 A study confirmed that disruption of cell adhesion might lead to uncontrolled cell proliferation and played a key role in epithelial-to-mesenchymal transition (EMT).13 EMT is a critical developmental procedure in which abnormal activation enables tumors to gain the ability to invade and metastasize far away.14 This process may also occur in melanoma metastasis. FLG is located on chromosome 1q21.3, which is the reported CMM susceptibility site. In our study, FLG expression was significantly higher in metastatic melanoma compared with primary melanoma. Kezic S. has reported that FLG may serve as a potential biomarker for reducing melanoma risk.15 Some studies have confirmed that DSG1 expression is decreased in lung cancer, head and neck cancer and gastric cancer, and its low expression is associated with longer survival or tumor inhibition. However, some people think DSG1 is carcinogenic. Li et al found that DSG1 expression decreased when melanoma cells proliferated, but in our study, DSG1 overexpressed in metastatic melanoma. These genes play different or even opposite roles in the occurrence and progression of different tumors, which may be related to the different locations of genes or stage of tumor. For instance, the expression of genes in desmosomes inhibits tumor invasion, while the expression in cytoplasm or nucleus may promote tumor metastasis. Gene expression may increase in the middle stage of the tumor to initiate metastasis and decrease in the later stage. However, the role and mechanism of these genes in CMM are still unclear.
We identified two immune-related core genes for CMM, namely EGFR and CDH1. On the one hand, Epidermal Growth Factor Receptor (EGFR) is one of the four members of the HER family receptors,16 which comprise EGFR/HER1/erbB1, HER2/erbB2, HER3/erbB3, and HER4/erbB4.17,18 Previous research reported that 10–30% of all lung adenocarcinomas19,20 included an EGFR-activating mutation. EGFR mutations occur mostly in adenocarcinoma, younger women and girls,17 and never-smokers.17 ErbB1 (also known as EGFR) receptor signaling is involved in cell proliferation, migration, differentiation and tissue morphogenesis.21 ErbB signaling is often found to be overactive in epithelial malignancies, accounting for 80–90% of all cancer cases,22 indicating that this pathway is a very promising target in oncology. Tumor antigens are expressed specifically or highly in tumor tissues. In addition, tumor antigens can result from mutated gene products, which are not produced by non-cancer cells. Mutated epidermal growth factor receptor known as EGFRvIII is a tumor-specific product that is expressed by 30% Glioblastoma multiforme (GBM) cases.23 EGFRvIII has been extensively studied as a tumor antigen. It has been reported that the frequency of oncogenic mutations in the EGFR gene is closely associated with the occurrence of melanoma.24,25 Our study found that high expression of EGFR promoted the infiltration of Tregs in CMM but inhibited the expression of CD8+T cells and NK cells. Meanwhile, high expression of CD8+T cell, NK cell, and Tregs was positively associated with longer survival and anti-tumor immunity. The results above indicated EGFR as a pathogenic gene of CMM, which is consistent with previous reports. On the other hand, our study suggested that high expression of CDH1 resulted in the increased infiltration of CD8+T cell and NK cell, while decreased infiltration of Tregs. The CDH1 gene encodes a transmembrane glycoprotein E-cadherin that maintains Ca 2+ -dependent cell–cell adhesion in epithelial tissues and therefore plays an important role in tumorigenesis as a tumor suppressor gene.26 Reduced E-cadherin expression is reported to be a feature of colorectal cancer.27 Recent evidence suggested that reduced E-cadherin expression was associated with pathological features, such as poor differentiation, infiltrative growth, lymph node metastasis, and poor prognosis.28 Altered expression of e-cadherin has been observed in a variety of malignancies, including ovarian,29 prostate,30 liver,31 and breast cancers.32 CDH1 hypermethylation is one of the mechanisms causing E-cadherin expression reduction. Lack of E-cadherin results in the dysfunction of the cell–cell adhesion system, causing a loss of cell–cell adhesion, release of cytoplasmic β-catenin, activating Wnt signaling and increasing tumor invasiveness.33 Hypermethylation and reduced expression of CDH1 have been observed in a variety of malignancies, including gastric cancer, ovarian cancer and breast cancer.34,35 Interestingly, we found overexpression of CDH1 in metastatic melanoma in our study, which was not consistent with the results of previous studies on other tumors, thus further exploring is needed.
The limitation of our study lies in the fact that hub gene is identified through calculation, and there is still a lack of clinical and basic experimental verification. Therefore, further research is needed. However, our study is scientifically supported and credible, and may provide new ideas for the treatment of CMM.
Conclusion
In summary, this study identified 206 DEGs between metastatic melanoma and primary melanoma, of which, ten hub genes with the most connection degree were picked out. These genes are related to the cell functions of tumor-causing and are involved in some of the signaling pathways of tumorigenesis and development. Among them, overexpression of PKP1, FLG and DSG1 are significantly associated with overall survival of CMM patients. CDH1 and EGFR were related to tumor immunity. Due to strong invasion of CMM, only the early diagnosis and treatment can improve prognosis, these genes may become biomarkers of diagnosis for primary melanoma and therapeutic targets to inhibit metastasis, opening up a novel way for the treatment of CMM. Nevertheless, further studies for the biological function of these genes, laboratory and clinical studies are still needed.
Ethics and Consent Statements
The data in this study came from the GEO public database, and the original data had passed the ethical review and obtained the written informed consent of the patients when provided. Our use of the data from the GEO public database was reviewed by the Ethical Review Committee of Weifang Medical College.
Disclosure
The authors report no conflicts of interest in this work.
References
1. Rastrelli M, Tropea S, Rossi CR, et al. Melanoma: epidemiology, risk factors, pathogenesis, diagnosis and classification. In Vivo (Brooklyn). 2014;28(6):1005–1011.
2. Rose K, Grant- KELS JM. Pediatric melanoma- the whole (conflicts of interest) story. Int J Womens Dermatol. 2018;5(2):110–115. doi:10.1016/j.ijwd.2018.10.020
3. Flahety RKT, Hodi FS, Fisher DE. From genes to drugs: targeted strategies for melanoma. Nat Rev Cancer. 2012;12(5):349–361. doi:10.1038/nrc3218
4. Hatzfeld M, Haffner C, Schulze K, Vinzens U. The function of plakophilin 1 in desmosome assembly and actin filament organization. J Cell Biol. 2000;149:209–222. doi:10.1083/jcb.149.1.209
5. McGrath JA, McMillan JR, Shemanko CS, et al. Mutations in the plakophilin 1 gene result in ectodermal dysplasia/skin fragility syndrome. Nat Genet. 1997;17:240. doi:10.1038/ng1097-240
6. TCGA research network; 2018. Available from: https://cancergenome.nih.gov/.
7. Schwarz J, Ayim A, Schmidt A, et al. Differential expression of desmosomal plakophilins in various types of carcinomas: correlation with cell type and differentiation. Hum Pathol. 2006;37:613–622. doi:10.1016/j.humpath.2006.01.013
8. Gomez-Morales M, Camara-Pulido M, Miranda-Leon MT, et al. Differential immunohistochemical localization of desmosomal plaque-related proteins in non-small-cell lung cancer. Histopathology. 2013;63:103–113. doi:10.1111/his.12126
9. Hatzfeld M. Plakophilins: multifunctional proteins or just regulators of desmosomal adhesion? Biochim Biophys Acta. 2007;1773:69–77. doi:10.1016/j.bbamcr.2006.04.009
10. Fujita JUNKI, Nakajima MASANOBU, Muroi HIROTO, et al. The prognostic significance of plakophilin-1 expression in esophageal cancer. Anticancer Res. 2021;41:3401–3407. doi:10.21873/anticanres.15127
11. Salerno EP, Bedognetti D, Mauldin IS, et al. Human melanomas and ovarian cancers overexpressing mechanical barrier molecule genes lack immune signatures and have increased patient mortality risk. Oncoimmunology. 2016;5:e1240857. doi:10.1080/2162402X.2016.1240857
12. Thyssen JP, Kezic S. Causes of epidermal filaggrin reduction and their role in the pathogenesis of atopic dermatitis. J Allergy Clin Immunol. 2014;134:792–799. doi:10.1016/j.jaci.2014.06.014
13. Brown L, Wan H. Desmoglein 3: a help or a hindrance in cancer progression? Cancers. 2015;7(1):266–286. doi:10.3390/cancers7010266
14. Mani SA, Guo W, Liao MJ, et al. The epithelial-mesenchymal transition generates cells with properties of stem cells. Cell. 2008;133(4):704–715. doi:10.1016/j.cell.2008.03.027
15. Kezic S. Loss-of-function mutations in filaggrin gene and malignant melanoma. J Eur Acad Dermatol Venereol. 2018;32:193. doi:10.1111/jdv.14813
16. Liu X, Wang P, Zhang C, Ma Z. Epidermal growth factor receptor (EGFR): a rising star in the era of precision medicine of lung cancer. Oncotarget. 2017;8:50209–50220. doi:10.18632/oncotarget.16854
17. Hirsch FR, Scagliotti V, Mulshine JL, et al. Lung cancer: current therapies and new targeted treatments. Lancet. 2017;389:299–311. doi:10.1016/S0140-6736(16)30958-8
18. Sigismund S, Avanzato D, Lanzetti L. Emerging functions of the EGFR in cancer. Mol Oncol. 2018;12:3–20. doi:10.1002/1878-0261.12155
19. Chen K, Yu X, Wang H, Zhang N, Zhang P. Uncommon mutation types of epidermal growth factor receptor and response to EGFR tyrosine kinase inhibitors in Chinese non-small cell lung cancer patients. Cancer Chemother Pharmacol. 2017;80:1179–1187. doi:10.1007/s00280-017-3464-9
20. Jang J, Son J, Park E, et al. Discovery of a highly potent and broadly effective epidermal growth factor receptor and HER2 exon 20 insertion mutant inhibitor. Angew Chem Int Ed Engl. 2018;7:11629–11633. doi:10.1002/anie.201805187
21. Schlessinger J. Ligand-Induced, receptor-mediated dimerization and activation of EGF receptor. Cell. 2002;110(6):669–672. doi:10.1016/S0092-8674(02)00966-2
22. Roskoski R. The ErbB/HER family of protein-tyrosine kinases and cancer. Pharmacol Res. 2014;79:34–74. doi:10.1016/j.phrs.2013.11.002
23. Paff M, Alexandru-Abrams D, Hsu FP, Bota DA. The evolution of the EGFRvIII (rindopepimut) immunotherapy for glioblastoma multiforme patients. Hum Vaccin Immunother. 2014;10:3322–3331. doi:10.4161/21645515.2014.983002
24. Pan SH, Su KY, Spiessens B, et al. Gene expression of MAGE-A3 and PRAME tumor antigens and EGFR mutational status in Taiwanese non-small cell lung cancer patients. Asia Pacific J Clin Oncol. 2017;13:e212–23. doi:10.1111/ajco.12586
25. Koopmans I, Hendriks D, Samplonius DF, et al. A novel bispecific antibody for EGFR-directed blockade of the PD-1/PD-L1 immune checkpoint. Oncoimmunology. 2018;7:e1466016. doi:10.1080/2162402X.2018.1466016
26. Gall TM, Frampton AE. Gene of the month: e-cadherin (CDH1). J Clin Pathol. 2013;66(11):928–932. doi:10.1136/jclinpath-2013-201768
27. Borger ME, Gosens MJ, Jeuken JW, et al. Signet ring cell differentiation in mucinous colorectal carcinoma. J Pathol. 2007;212:278–286. doi:10.1002/path.2181
28. Yoshida R, Kimura N, Harada Y, Ohuchi N. The loss of E-cadherin, alpha- and beta-catenin expression is associated with metastasis and poor prognosis in invasive breast cancer. Int J Oncol. 2001;18(3):513–520.
29. Reddy P, Liu L, Ren C, et al. Formation of E-cadherin-mediated cell-cell adhesion activates AKT and mitogen activated protein kinase via phosphatidylinositol 3 kinase and ligand-independent activation of epidermal growth factor receptor in ovarian cancer cells. Mol Endocrinol. 2005;19(10):2564–2578. doi:10.1210/me.2004-0342
30. Grant CM, Kyprianou N. Epithelial mesenchymal transition (EMT) in prostate growth and tumor progression. Transl Androl Urol. 2013;2(3):202–211. doi:10.3978/j.issn.2223-4683.2013.09.04
31. Zhai B, Yan HX, Liu SQ, Chen L, Wu MC, Wang HY. Reduced expression of E-cadherin/catenin complex in hepatocellular carcinomas. World J Gastroenterol. 2008;14(37):5665–5673. doi:10.3748/wjg.14.5665
32. Shargh SA, Sakizli M, Khalaj V, et al. Downregulation of E-cadherin expression in breast cancer by promoter hypermethylation and its relation with progression and prognosis of tumor. Med Oncol. 2014;31(11):250. doi:10.1007/s12032-014-0250-y
33. Debies MT, Welch DR. Genetic basis of human breast cancer metastasis. J Mammary Gland Biol Neoplasia. 2001;6(4):441–451. doi:10.1023/A:1014739131690
34. Zheng SY, Hou JY, Zhao J, Jiang D, Ge JF, Chen S. Clinical outcomes of downregulation of E-cadherin gene expression in non-small cell lung cancer. Asian Pac J Cancer Prev. 2012;13(4):1557–1561. doi:10.7314/APJCP.2012.13.4.1557
35. Tamura G, Yin J, Wang S, et al. E-Cadherin gene promoter hypermethylation in primary human gastric carcinomas. J Natl Cancer Inst. 2000;92(7):569–573. doi:10.1093/jnci/92.7.569
 © 2022 The Author(s). This work is published and licensed by Dove Medical Press Limited. The full terms of this license are available at https://www.dovepress.com/terms.php and incorporate the Creative Commons Attribution - Non Commercial (unported, v3.0) License.
By accessing the work you hereby accept the Terms. Non-commercial uses of the work are permitted without any further permission from Dove Medical Press Limited, provided the work is properly attributed. For permission for commercial use of this work, please see paragraphs 4.2 and 5 of our Terms.
© 2022 The Author(s). This work is published and licensed by Dove Medical Press Limited. The full terms of this license are available at https://www.dovepress.com/terms.php and incorporate the Creative Commons Attribution - Non Commercial (unported, v3.0) License.
By accessing the work you hereby accept the Terms. Non-commercial uses of the work are permitted without any further permission from Dove Medical Press Limited, provided the work is properly attributed. For permission for commercial use of this work, please see paragraphs 4.2 and 5 of our Terms.