")
Back to Journals » OncoTargets and Therapy » Volume 10
Identification of potential biomarkers and analysis of prognostic values in head and neck squamous cell carcinoma by bioinformatics analysis
Authors Yang B , Chen Z, Huang Y, Han G, Li W
Received 24 February 2017
Accepted for publication 4 April 2017
Published 26 April 2017 Volume 2017:10 Pages 2315—2321
DOI https://doi.org/10.2147/OTT.S135514
Checked for plagiarism Yes
Review by Single anonymous peer review
Peer reviewer comments 2
Editor who approved publication: Dr Yao Dai
Bo Yang,* Zhifeng Chen,* Yu Huang, Guoxu Han, Weizhong Li
Department of Oral and Maxillofacial Surgery, Nanfang Hospital, Southern Medical University, Guangzhou, People’s Republic of China
*These authors contributed equally to this work
Abstract: The purpose of this study was to find disease-associated genes and potential mechanisms in head and neck squamous cell carcinoma (HNSCC) with deoxyribonucleic acid microarrays. The gene expression profiles of GSE6791 were downloaded from the Gene Expression Omnibus database. Differentially expressed genes (DEGs) were obtained with packages in R language and STRING constructed protein–protein interaction (PPI) network of the DEGs with combined score >0.8. Subsequently, module analysis of the PPI network was performed by Molecular Complex Detection plugin and functions and pathways of the hub gene in subnetwork were studied. Finally, overall survival analysis of hub genes was verified in TCGA HNSCC cohort. A total of 811 DEGs were obtained, which were mainly enriched in the terms related to extracellular matrix (ECM)–receptor interaction, ECM structural constituent, and ECM organization. A PPI network was constructed, consisting of 401 nodes and 1,254 edges and 15 hub genes with high degrees in the network. High expression of 4 genes of the 15 genes was associated with poor OS of patients in HNSCC, including PSMA7, ITGA6, ITGB4, and APP. Two significant modules were detected from the PPI network, and the enriched functions and pathways included proteasome, ECM organization, and ECM–receptor interaction. In conclusion, we propose that PSMA7, ITGA6, ITGB4, and APP may be further explored as potential biomarkers to aid HNSCC diagnosis and treatment.
Keywords: head and neck squamous cell carcinoma, interaction network, prognostic biomarkers, function and pathway analysis
Introduction
Head and neck squamous cell carcinoma (HNSCC) is the sixth most common cancer worldwide, with ~650,000 new cases and nearly 350,000 patient deaths from HNSCC annually.1 Prognosis remains poor, and the 5-year survival rates for HNSCC patients continue to be <50%. Local tumor recurrence, distant metastasis, and therapeutic resistance appear to be the major contributing factors for this low survival rate.2
Previously identified biomarkers can help in predicting the prognosis of HNSCC. However, their clinical application is limited. Currently, there is no evidence-based recommendation for altering the treatment of patients with HNSCC by the expression of individual biomarkers.3 Therefore, it is crucial to investigate the molecular mechanisms involved in proliferation, apoptosis, and invasion of HNSCC and discover more effective biomarkers of HNSCC to improve diagnosis and prevention of the disease.
Currently, genetic and genomics research is developing rapidly, which helps us to understand the potential mechanisms of some diseases.4,5 For example, microarray analysis is widely used in the field of cancer genetics research, which may measure gene expression on a genome-wide scale simultaneously.6
In the present study, the biological informatics approach was used to analyze the gene expression profiles in HNSCC, and functional analysis was performed to identify differentially expressed genes (DEGs) between HNSCC and normal control. Subsequently, network analysis was applied for the DEGs and a protein–protein interaction (PPI) network was constructed; then, we investigated whether the hub gene of the subnetwork could reduce the overall survival (OS) in TCGA database. Through analyzing their biological functions, pathways, and OS, we may bring to light the underlying mechanisms of HNSCC development and identify the potential candidate biomarkers for diagnosis, prognosis, and drug targets.
Materials and methods
Microarray data
Microarray expression profiles of GSE67917 were downloaded from Gene Expression Omnibus database for identifying DEGs of HNSCC. GSE6791, which was already deposited in GPL570 (Affymetrix Human Genome U133 Plus 2.0 Array, Santa Clara, CA, USA), consisted of 42 HNSCC samples and 14 normal epithelial samples.
Data preprocessing and identification of DEGs
The raw array data were subjected to background correction and quartile data normalization. Then, the DEGs between HNSCC samples and normal controls were identified using the empirical Bayes approach in linear models for the microarray data (limma) package.8 |log FC| >1 and P<0.05 were selected as the cutoff criterion.
Functional and pathway enrichment analysis of DEGs
The Database for Annotation, Visualization, and Integrated Discovery (DAVID),9 which is a comprehensive set of functional annotation tools, has been used for systematic and integrative analysis of large gene lists. In this work, the significant gene ontology (GO) biological process terms and Kyoto Encyclopedia of Genes and Genomes (KEGG) pathway enrichment analyses of the identified DEGs were performed using DAVID database with the thresholds of P<0.05.
Modules from the PPI network
To evaluate the interactive relationships among DEGs, the DEGs were mapped to the Search Tool for the Retrieval of Interacting Genes(STRING) database.10 Then, the interaction relationships of DEGs were selected to construct the PPI network (combined score >0.8) and visualized using Cytoscape.11 The Molecular Complex Detection (MCODE) plugin12 in Cytoscape was used to screen the modules of PPI network, using cutoff values as follows: MCODE scores >15 and number of nodes >15. Moreover, the function and pathway enrichment analysis of DEGs in each module was performed using DAVID.
Survival analysis of the hub gene
OS analysis was performed using HNSCC samples from the TCGA dataset and mRNA Z-score data files were downloaded from the cBioPortal.13 Patients were classified into high or low expression based on whether Z-score expression was >median (high) or <median (low). Based on these categories, log-rank analysis and Kaplan–Meier plots were produced using Prism Software (GraphPad Software, Inc., La Jolla, CA, USA).
Results
Identification of DEGs
The total number of samples analyzed was 42 HNSCC samples, along with 14 normal epithelial samples. After data preprocessing, DEG analysis was performed using the limma software package. A total of 811 genes were identified after the analyses of GSE6791, including 550 upregulated and 261 downregulated genes.
GO and KEGG pathway enrichment analyses
We uploaded all 811 DEGs to the online software DAVID to identify overrepresented GO categories and KEGG pathways. GO analysis results showed that the most overrepresented GO terms in biological processes were enriched in extracellular matrix (ECM) organization, antigen processing and presentation of exogenous peptide antigen via major histocompatibility class I, transporter associated with antigen processing-dependent, and collagen catabolic process. In addition, the most enriched GO terms in molecular function and cellular component were threonine-type endopeptidase activity and extracellular exosome, respectively. On the other hand, the most enriched KEGG pathway terms were as follows: ECM–receptor interaction, amebiasis, proteasome, focal adhesion, and small cell lung cancer (Table 1).
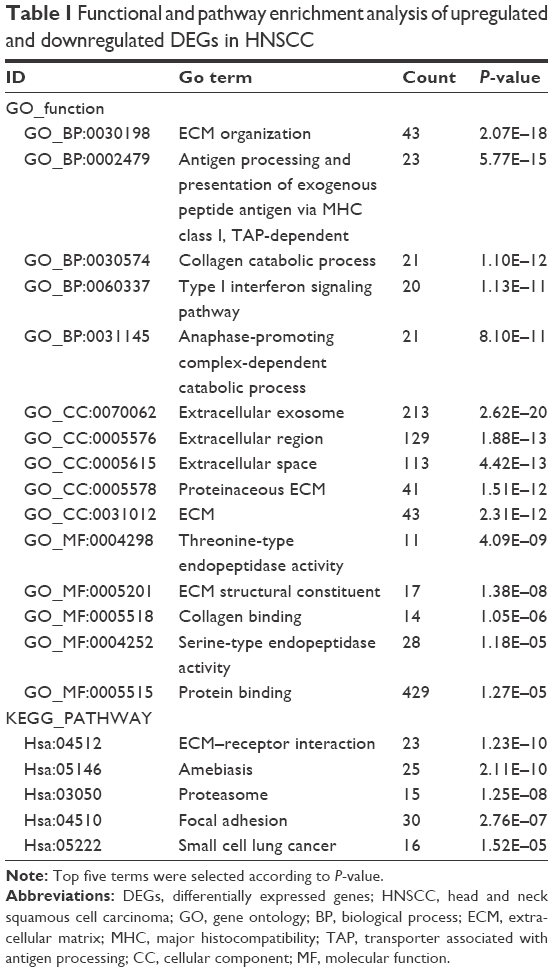 | Table 1 Functional and pathway enrichment analysis of upregulated and downregulated DEGs in HNSCC |
Coexpression network analysis of DEGs
To interpret the biological meaning of the identified DEGs, we constructed a coexpression network for the DEGs with a combined score >0.8 and with significant interaction relation composed of 401 nodes and 1,254 edges by STRING database analysis (Figure 1). From the coexpression network of the selected DEGs, the top 15 hub genes were determined according to the number of the interacting edges: CDK1, PTK2, ITGAV, APP, COL1A1, MMP9, AURKA, BMP2, ITGB4, CDC20, SDC4, COL1A2, ITGA6, PSMA7, and STAT1 (Table 2).The distinct modules of 401 DEGs and their interacting genes were further identified by the MCODE using Cytoscape software. Among the modules, two subnetworks with >15 nodes were selected (Figure 2), and enrichment analysis showed that the genes in the subnetworks were mainly associated with proteasome, ECM–receptor interaction, protein digestion and absorption, and focal adhesion (Table 3).
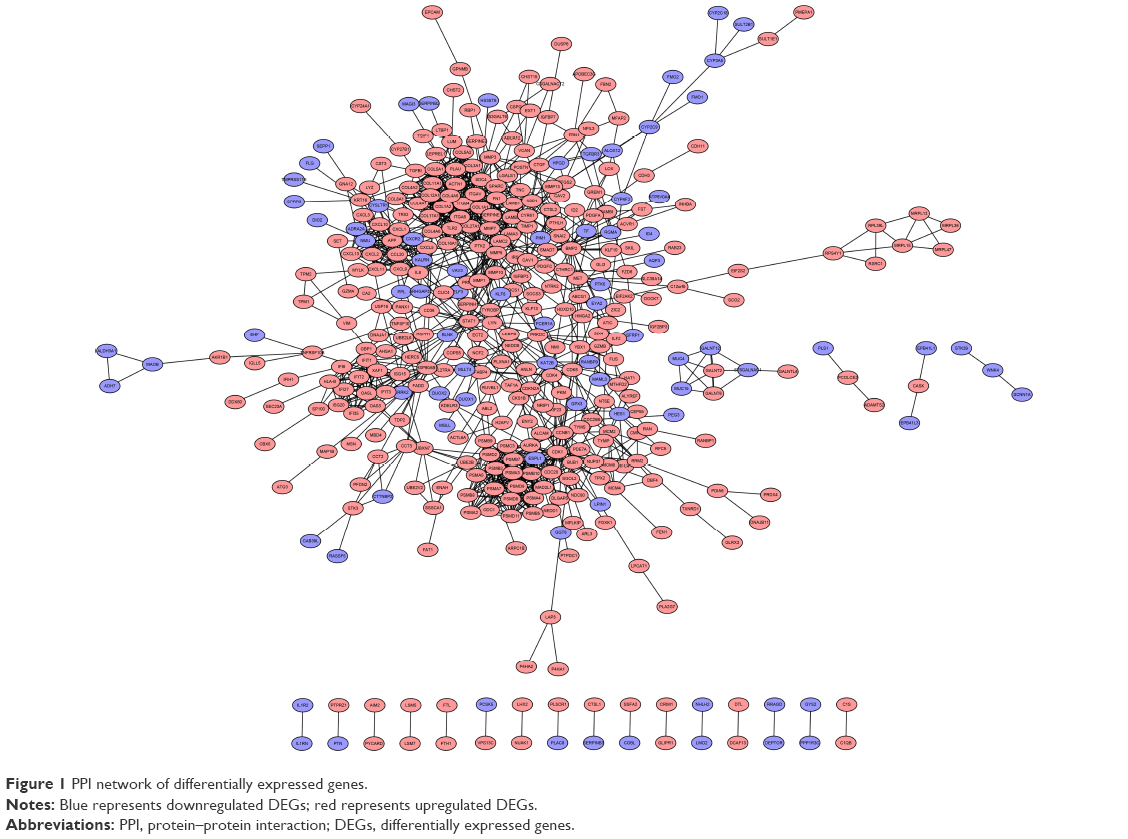 | Figure 1 PPI network of differentially expressed genes. |
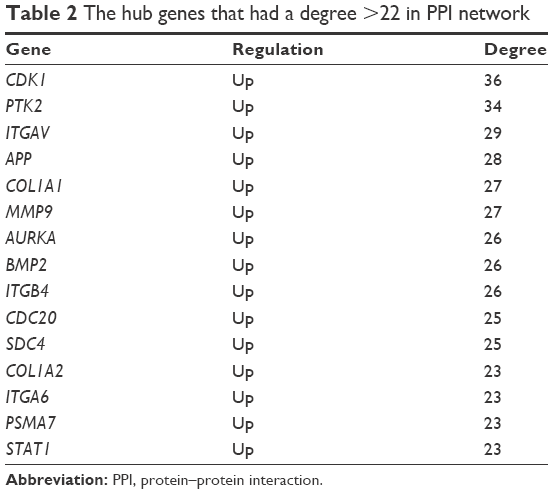 | Table 2 The hub genes that had a degree >22 in PPI network |
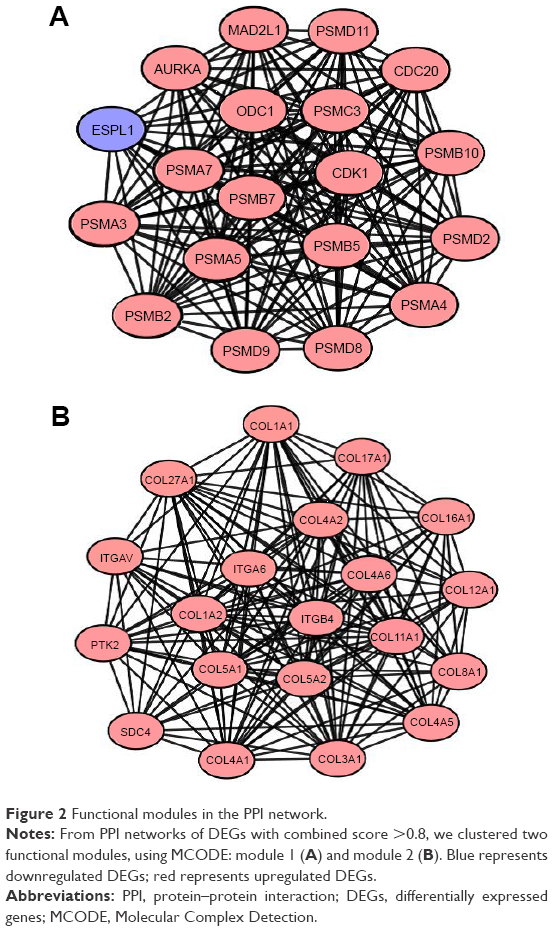 | Figure 2 Functional modules in the PPI network. |
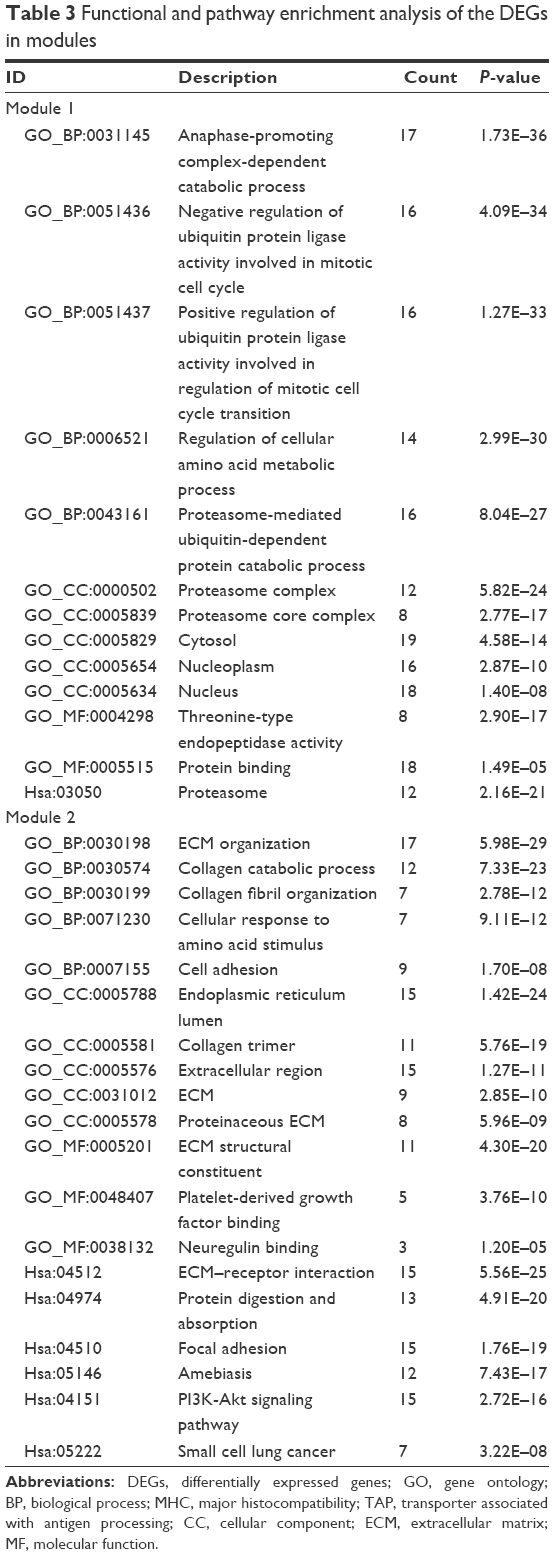 | Table 3 Functional and pathway enrichment analysis of the DEGs in modules |
Hub genes were validated as an independent predictor for OS in the TCGA cohort
We subsequently sought to assess the significance of expression of 15 hub genes in HNSCC. Therefore, the relation between expression of 15 hub genes and OS in the TCGA HNSCC cohort (461 patients) was verified, and the patients were divided into low or high expression groups according to the median expression. Our results showed that poor OS was associated only in those patients with high expression of PSMA7 (HR: 1.60 [1.20–2.10], P=0.0009) in the TCGA HNSCC cohort, as well as ITGA6 (HR: 1.32 [1.00–1.75], P=0.0472), ITGB4 (HR: 1.38 [1.05–1.83], P=0.0113), and APP (HR: 1.40 [1.04–1.87], P=0.0113; Figure 3).
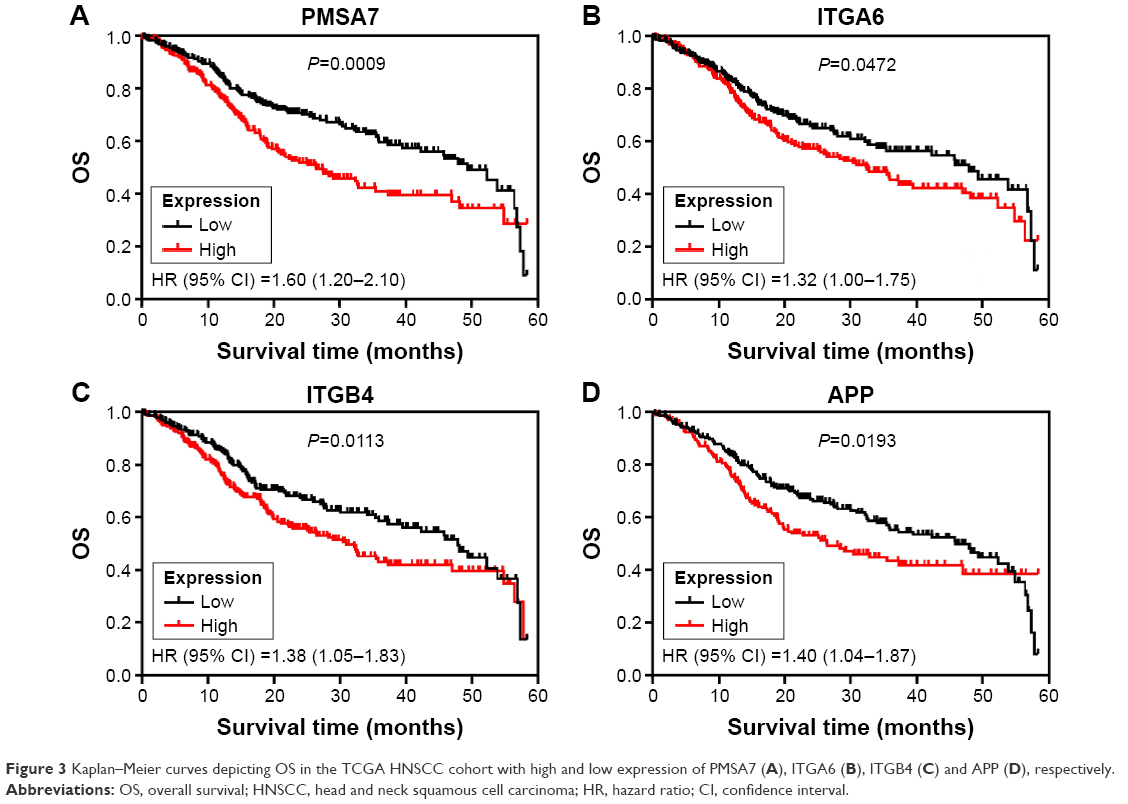 | Figure 3 Kaplan–Meier curves depicting OS in the TCGA HNSCC cohort with high and low expression of PMSA7 (A), ITGA6 (B), ITGB4 (C) and APP (D), respectively. |
Conclusion
Despite advances in surgical, chemotherapy, and medical therapy, the overall mortality of HNSCC has remained virtually unchanged over the past decades. The lethality of HNSCC is mainly due to difficulties in detecting it at an early stage and the lack of effective treatments for patients in advanced stages. Interestingly, bioinformatics plays a major role in the analysis and interpretation of genomic and proteomic data.14 For example, some researchers focus on bioinformatics, nanogenomics, and nanoproteomics aspects of contemporary nanodentistry and summarize some proteomics and proteogenomics approaches for oral diseases.15,16 Therefore, in the present study, we attempted to utilize comprehensive bioinformatics methods to explore the potential molecular mechanism of HNSCC to improve survival rate and prevention.
In this study, a total of 811 DEGs were screened, consisting of 550 upregulated genes and 261 downregulated genes. Moreover, we selected two significant modules with several key DEGs (like PSMA7, ITGA6, and ITGB4) in HNSCC regulatory network, and functional enrichment analyses showed that these key DEGs were mainly enriched in ECM–receptor interaction, which is closely related to cancer. Finally, survival analysis of these hub genes revealed that four overexpressed genes were significantly correlated with poor OS of patients in the TCGA HNSCC cohort, and these included PSMA7, ITGA6, ITGB4, and APP.
The data showed that PSMA7 is involved in “module 1” of the gene coexpression network, which is enriched in the proteasome pathway. Many studies have suggested that proteasome promotes the degradation of oxidatively damaged proteins that play a role in the cell cycle and transcription, which are essential for cancer improvement. Previously, it was reported that PSMA7 inhibits the proliferation, tumorigenicity, and invasion of human lung adenocarcinoma cells.17 Similar results also showed that high expression of PSMA7 is associated with liver metastasis in colorectal cancer.18 Besides, Hu et al also found depletion of PSMA7 inhibited cell growth, invasion, and migration in RKO cells and strongly suppressed the tumorigenic ability of RKO cells in vivo.19 Taken together, we speculate that the overexpression of PSMA7 may contribute to HNSCC progression and correlate with a poor prognosis.
On the other hand, ITGA6 and ITGB4, which are found in “module 2” in PPI network, were associated with the ECM–receptor interaction pathway, and belong to the integrin family, which participates in cell adhesion as well as cell surface-mediated signaling. Interactions between cells and the ECM could lead to the direct or indirect control of cellular processes of adhesion, migration, differentiation, proliferation, and apoptosis.20 As previously reported, silencing of ITGA6 genes significantly inhibited cell migration and invasion in head and neck cancer cells and hepatocellular carcinoma cells.21,22 Similarly high ITGA6 expression was shown to enhance invasion in models of metastatic breast cancer.23 Moreover, Kwon et al24 found ITGA6 is a possible target for antibody-related diagnostic and therapeutic modalities in esophageal squamous cell carcinoma. Meanwhile, ITGB4 regulates migration and invasion in models of metastatic prostate cancer.25 Moreover, Masugi et al26 found that knockdown of ITGB4 reduced the migration and invasion and that upregulation of ITGB4 promoted cell scattering and motility in pancreatic ductal adenocarcinoma cells. Besides, our study shows that ITGB4 was associated with poor prognosis in HNSCC; similar results have also been shown in pancreatic ductal adenocarcinoma patients.27 Together, we speculate that ITGA6 and ITGB4 in ECM–receptor interaction signaling pathway may play a significant role in HNSCC.
Amyloid-β precursor protein (APP) is the highly conservative single transmembrane protein with a receptor-like structure that has been shown to be involved in Alzheimer disease,28 but its function in normal physiological is unclear. Interestingly, APP is increased in many different cancers, such as colon cancer, pancreatic cancer, and thyroid cancer.29–31 Lim et al32 found that overexpression of APP is found both in malignant breast cancer cell lines and in human breast cancer tissues, and APP could regulate cell growth, apoptosis, and motility of breast cancer, possibly via engagement of AKT-mediated signaling pathways. Similarly, APP could promote cell growth in pancreatic cancer cells.31 In addition, Ko et al33 found a significant increase of APP in an oral squamous cell carcinoma (OSCC) tissue and also that OSCC patients with high mRNA levels of APP had poor prognoses. The abovementioned studies show that APP may be involved in the pathogenesis of malignant tumors by affecting cell growth or apoptosis, thereby supporting our findings.
In summary, the current study was intended to identify DEGs with comprehensive bioinformatics analysis to find the potential biomarkers and predict progression of diseases. We found that hub genes of complex networks, such as PSMA7, ITGA6, ITGB4, and APP, may be exploited as a prognostic tool for HNSCC. Finally, our results suggested that proteasome and ECM–receptor interaction may be important in the development of HNSCC. However, further experimental studies are still required to prove our findings and determine the potential clinical value of these as biomarkers.
Acknowledgment
The project was supported by the Guangdong Natural Science Foundation of China (2015A030313309).
Disclosure
The authors report no conflicts of interest in this work.
References
Parkin DM, Bray F, Ferlay J, Pisani P. Global cancer statistics, 2002. CA Cancer J Clin. 2005;55(2):74–108. | ||
Prince ME, Sivanandan R, Kaczorowski A, et al. Identification of a subpopulation of cells with cancer stem cell properties in head and neck squamous cell carcinoma. Proc Natl Acad Sci U S A. 2007;104(3):973–978. | ||
Ang KK, Sturgis EM. Human Papillomavirus as a marker of the natural history and response to therapy of head and neck squamous cell carcinoma. Semin Radiat Oncol. 2012;22(2):128–242. | ||
Orlando B, Bragazzi N, Nicolini C. Bioinformatics and systems biology analysis of genes network involved in OLP (Oral Lichen Planus) pathogenesis. Arch Oral Biol. 2013;58(6):664–673. | ||
Lakhani SR, Ashworth A. Microarray and histopathological analysis of tumours: the future and the past? Nat Rev Cancer. 2001;1(2):151–157. | ||
Rays M, Chen Y, Su YA. Use of a cDNA microarray to analyse gene expression patterns in human cancer. Nat Genet. 1996;14(4):457–460. | ||
Pyeon D, Newton MA, Lambert PF, et al. Fundamental differences in cell cycle deregulation in human papillomavirus-positive and human papillomavirus-negative head/neck and cervical cancers. Cancer Res. 2007;67(10):4605–4619. | ||
Smyth GK. Limma: linear models for microarray data. In: Gentleman R, Carey VJ, Huber W, Irizarry RA, Dudoit S. Bioinformatics and Computational Biology Solutions Using R and Bioconductor. Seattle, WA: Springer; 2005:397–420. | ||
Huang DW, Sherman BT, Lempicki RA. Systematic and integrative analysis of large gene lists using DAVID bioinformatics resources. Nat Protoc. 2009;4(1):44–57. | ||
Szklarczyk D, Franceschini A, Kuhn M, et al. The STRING database in 2011: functional interaction networks of proteins, globally integrated and scored. Nucleic Acids Res. 2011;39(Suppl 1):D561–D568. | ||
Shannon P, Markiel A, Ozier O, et al. Cytoscape: a software environment for integrated models of biomolecular interaction networks. Genome Res. 2003;13(11):2498–2504. | ||
Bader GD, Hogue CW. An automated method for finding molecular complexes in large protein interaction networks. BMC Bioinformatics. 2003;4(1):2. | ||
Gao J, Aksoy BA, Dogrusoz U, et al. Integrative analysis of complex cancer genomics and clinical profiles using the cBioPortal. Sci Signal. 2013;6(269):pl1. | ||
Wright JT, Hart TC. The genome projects: implications for dental practice and education. J Dent Educ. 2002;66(5):659–671. | ||
Bragazzi NL, Pechkova E, Nicolini C. Proteomics and proteogenomics approaches for oral diseases. Adv Protein Chem Struct Biol. 2014;95:125–162. | ||
Nicolini C, Bragazzi N. Nanogenomics and nanoproteomics for personalized nanotheranostics for oral and colorectal cancer. Per Med. 2015;13(1):9–11. | ||
Tan JY, Huang X, Luo YL. PSMA7 inhibits the tumorigenicity of A549 human lung adenocarcinoma cells. Mol Cell Biochem. 2012;366(1–2):131–137. | ||
Hu XT, Chen W, Wang D, et al. The proteasome subunit PSMA7 located on the 20q13 amplicon is overexpressed and associated with liver metastasis in colorectal cancer. Oncol Rep. 2008;19(2):441–446. | ||
Hu XT, Chen W, Zhang FB, et al. Depletion of the proteasome subunit PSMA7 inhibits colorectal cancer cell tumorigenicity and migration. Oncol Rep. 2009;22(5):1247–1252. | ||
Hansen NU, Genovese F, Leeming DJ, Karsdal MA. The importance of extracellular matrix for cell function and in vivo likeness. Exp Mol Pathol. 2015;98(2):286–294. | ||
Kinoshita T, Nohata N, Hanazawa T, et al. Tumour-suppressive microRNA-29s inhibit cancer cell migration and invasion by targeting laminin-integrin signalling in head and neck squamous cell carcinoma. Br J Cancer. 2013;109(10):2636–2645. | ||
Lv G, Lv T, Qiao S, et al. RNA interference targeting human integrin α6 suppresses the metastasis potential of hepatocellular carcinoma cells. Eur J Med Res. 2013;18:52. | ||
Brooks DLP, Schwab LP, Krutilina R, et al. ITGA6 is directly regulated by hypoxia-inducible factors and enriches for cancer stem cell activity and invasion in metastatic breast cancer models. Mol Cancer. 2016;15:26. | ||
Kwon J, Lee TS, Lee HW, et al. Integrin alpha 6: a novel therapeutic target in esophageal squamous cell carcinoma. Int J Oncol. 2013;43(5):1523–1530. | ||
Banyard J, Chung I, Migliozzi M, et al. Identification of genes regulating migration and invasion using a new model of metastatic prostate cancer. BMC Cancer. 2014;14:387. | ||
Masugi Y, Yamazaki K, Emoto K, et al. Upregulation of integrin β4 promotes epithelial-mesenchymal transition and is a novel prognostic marker in pancreatic ductal adenocarcinoma. Lab Invest. 2015;95(3):308–319. | ||
Damhofer H, Medema JP, Veenstra VL, et al. Assessment of the stromal contribution to Sonic Hedgehog-dependent pancreatic adenocarcinoma. Mol Oncol. 2013;7(6):1031–1042. | ||
O’Brien RJ, Wong PC. Amyloid precursor protein processing and Alzheimer’s disease. Annu Rev Neurosci. 2011;34:185–204. | ||
Meng JY, Kataoka H, Itoh H, Koono M. Amyloid β protein precursor is involved in the growth of human colon carcinoma cell in vitro and in vivo. Int J Cancer. 2001;92(1):31–39. | ||
Krause K, Karger S, Sheu SY, et al. Evidence for a role of the amyloid precursor protein in thyroid carcinogenesis. J Endocrinol. 2008;198(2):291–299. | ||
Hansel DE, Rahman A, Wehner S, Herzog V, Yeo CJ, Maitra A. Increased expression and processing of the Alzheimer amyloid precursor protein in pancreatic cancer may influence cellular proliferation. Cancer Res. 2003;63(21):7032–7037. | ||
Lim S, Yoo BK, Kim HS, et al. Amyloid-beta precursor protein promotes cell proliferation and motility of advanced breast cancer. BMC Cancer. 2014;14:928. | ||
Ko SY, Lin SC, Chang KW, et al. Increased expression of amyloid precursor protein in oral squamous cell carcinoma. Int J Cancer. 2004;111(5):727–732. |
 © 2017 The Author(s). This work is published and licensed by Dove Medical Press Limited. The full terms of this license are available at https://www.dovepress.com/terms.php and incorporate the Creative Commons Attribution - Non Commercial (unported, v3.0) License.
By accessing the work you hereby accept the Terms. Non-commercial uses of the work are permitted without any further permission from Dove Medical Press Limited, provided the work is properly attributed. For permission for commercial use of this work, please see paragraphs 4.2 and 5 of our Terms.
© 2017 The Author(s). This work is published and licensed by Dove Medical Press Limited. The full terms of this license are available at https://www.dovepress.com/terms.php and incorporate the Creative Commons Attribution - Non Commercial (unported, v3.0) License.
By accessing the work you hereby accept the Terms. Non-commercial uses of the work are permitted without any further permission from Dove Medical Press Limited, provided the work is properly attributed. For permission for commercial use of this work, please see paragraphs 4.2 and 5 of our Terms.