")
Back to Archived Journals » Research and Reports in Medicinal Chemistry » Volume 5
Identification of potent histone deacetylase 8 inhibitors using pharmacophore-based virtual screening, three-dimensional quantitative structure–activity relationship, and docking study
Authors Debnath T, Majumdar S, Kalle A, Aparna V, Debnath S
Received 22 January 2015
Accepted for publication 15 March 2015
Published 25 June 2015 Volume 2015:5 Pages 21—39
DOI https://doi.org/10.2147/RRMC.S81388
Checked for plagiarism Yes
Review by Single anonymous peer review
Peer reviewer comments 4
Editor who approved publication: Dr Xing-Cong Li
Video abstract presented by Tanusree Debnath
Views: 1313
Tanusree Debnath,1 Swapan Majumdar,2 Arunasree M Kalle,3 Vema Aparna,4 Sudhan Debnath1
1Department of Chemistry, MBB College, Agartala, Tripura, 2Department of Chemistry, Tripura University, Suryamanninagar, Agartala, Tripura, 3University of Hyderabad Gachibowli, Hyderabad, 4Sree Chaitanya Institute of Pharmaceutical Sciences, Karimnagar, India
Abstract: In recent years, histone deacetylases (HDACs) have been considered one of the promising targets for cancer chemotherapy. In the present study, a six-featured pharmacophore model with two hydrogen bond acceptors (AA), two hydrogen bond donors (DD), and two aromatic rings (RR) was developed. A predictive three-dimensional quantitative structure–activity relationship model was generated using the pharmacophore models obtained. The model has an excellent correlation coefficient and good predictive ability, as shown by the significant statistical parameters for both the training set (R2=0.9565, standard deviation =0.1171, F=99, and number of ligands in training set =21) and test set (Q2=0.8468, Pearson's R=0.9363, number of ligands in test set =9) molecules. The pharmacophore model was employed for the virtual screening of molecules with HDAC8 activity. The screening resulted in 366 hits with predicted activity as HDAC8 inhibitors. The hits obtained from the virtual screening were subjected to a molecular docking study to identify the potent inhibitors that binds to the active site with high affinity. The molecular docking study of known inhibitors and their analysis showed that the crucial interacting amino acid residues of HDAC8 are TYR-306, HIS-142, PHE-152, TYR-100, HIE-180, PHE-207, and Zn-388. On the basis of fitness score, predicted activities, XP Glide score, ADME results, and interacting amino acid residues, ten structurally diverse hits were reported in this paper as HDAC8 inhibitors.
Keywords: pharmacophore, atom-based 3D QSAR, virtual screening, docking, ADME, HDAC8 inhibitors
Introduction
Histone deacetylases (HDACs) play an important role in the regulation of histone and nonhistone proteins; hence, they are considered to be crucial in many biological processes, such as the regulation of gene expression, the regulation of transcription,1 cell cycle progression, and cell survival.2,3 Deacetylation of histones is connected with transcriptional repression, together with a reduction in the expression of tumor suppressor genes.4 Due to their role in various biological functions, HDAC inhibition has become a promising epigenetic target for the treatment of cancer.5 HDAC inhibitors (HDACis) are structurally diverse and are classified into various groups as hydroximates,6–8 cyclic tetrapeptides,9 benzamides,10,11 electrophilic ketones,12 and carboxylic acids.13 Two HDACis (vorinostat and romidepsin) have been approved by the United States Food and Drug Administration for the treatment of cutaneous T-cell lymphoma.14 However, treatment with HDACis has demonstrated narrow clinical benefit for patients with solid tumors, prompting the exploration of novel treatment combinations with other cancer therapeutics.15
The human HDACs family consists of 18 different members16 and on the basis of phylogenetic analysis, the eukaryotic HDACs have been classified into classes I, II, III, and IV.17 Among them, HDAC8 belongs to the class I group. HDAC8 is differentially expressed and associated with various cancers. It was reported that HDAC8 is relevant in neuroblastoma;18 its inhibition induces apoptosis in T-cell cancers such as leukemia.19,20 The significant concentrations of HDAC8 found in colorectal, cervical, and gastric cancers cells21,22 indicate that HDAC8 inhibitors may be chemotherapeutic agents for colon, cervical, and gastric cancers. Thus, the development of selective HDAC8 inhibitors is of high interest in the etiology and treatment of various cancers. Most of the HDACis available to date are designed in such a way as to interact with Zn metal.23–25 The HDACs inhibitors consist of three distinct structural motifs: Zn-binding group, a hydrophobic linker, and a cap group.26 Two types of cap groups are found in HDACis: a small planar group or a cyclic tetrapeptide group.27 The inhibitors of HDAC with a small cap group are inactive if the functional group is a carboxylic acid.28 The inhibitors, which contain a cap group of cyclic tetrapeptide and a carboxylic acid functional group,29,30 have proven to be crucial for HDAC inhibition. Most of the inhibitors reported so far belong to the hydroxamic acid group, which interacts with zinc present in the active site.2 Hydroxamic acid shows strong chelation with Zn ion; for this reason, hydroxamic acid could present with metabolic and pharmacokinetic challenges.31 Hence, inhibitors devoid of the hydroxamic acid group have become increasingly desirable.
In this study, our aim was to find nonhydroxamate inhibitors by searching a database. The resulted hits were then subjected to a molecular docking study to determine the binding affinity with the receptor. The best hits obtained from the docking studies were subjected to the adsorption, distribution, metabolism, and excretion (ADME) study to compare the drug-likeness properties with standard drugs. The hits with a high fitness score, a high Glide score, high predicted activity, and drug-like properties will be selected and further taken up for the development of potential and selective HDAC8 inhibitors.
Materials and methods
Dataset
The HDAC8 inhibitors used in this study, with their corresponding half maximal inhibitory concentration (IC50) values were obtained from the literature of same assay series.32 The IC50 values of all HDAC8 inhibitors were converted into their negative logarithm of IC50 (pIC50), which spanned 1.65 orders of magnitude (5.67–7.32). All of the compounds with pIC50 values were randomly grouped into a training set of 23 molecules and a test set of nine molecules (Figure 1). The distribution of activity data versus the number of compounds is shown in Figure 2 and confirms that the test set is a true representative of the training set. The X-ray crystal structures of HDAC8 were retrieved from the RCSB protein data bank for the molecular docking studies.33 All of the computational work was carried out using an HP Z820 Workstation running over CentOS 6.3.
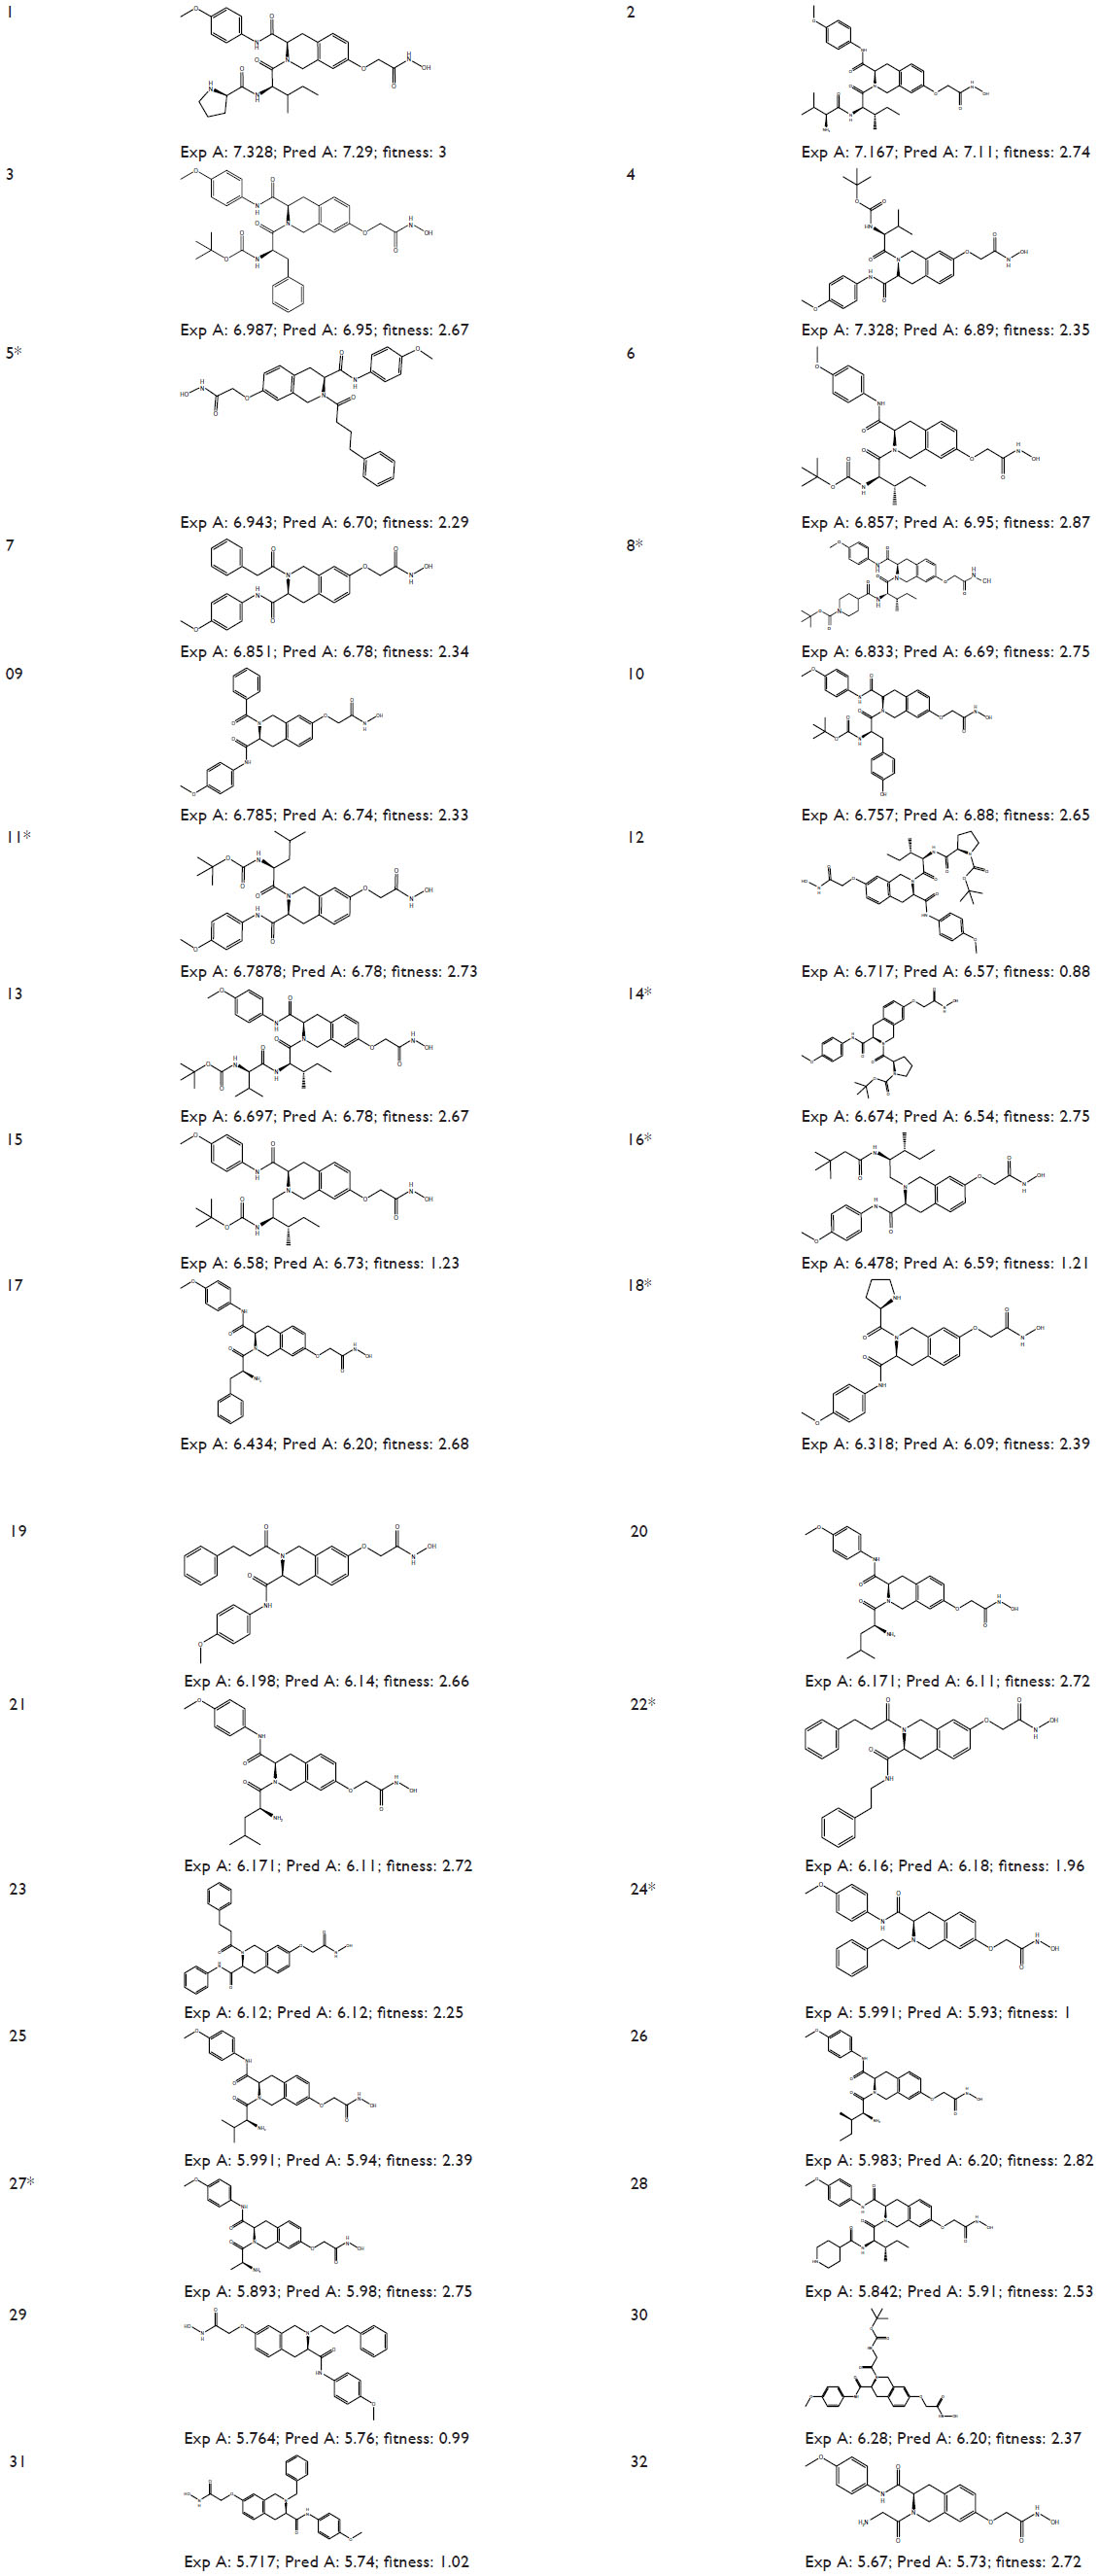 | Figure 1 Structures and experimental HDAC8 inhibitory activity (pIC50), Pred A (pIC50), and fitness of the known inhibitors (1–32). |
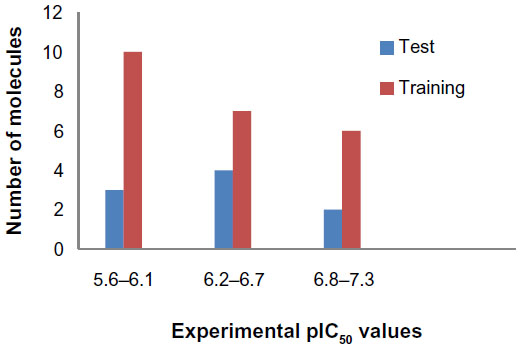 | Figure 2 Distribution of activities (pIC50) for the training and test set compounds. |
Ligand preparation, protein preparation, and grid generation
All of the structures of HDAC8 inhibitors were initially drawn using a two-dimensional (2D) sketcher (Maestro 9.6) and then converted to three-dimensional (3D) structures. All of these molecules were prepared using the LigPrep module of the Schrödinger suite (LigPrep, version 2.6, Schrödinger, LLC). The force field used was OPLS_2005. All of the possible ionic states at the target pH of 7.2±2 were generated using Epik. Possible stereo isomers were also generated for each ligand with low energy ring conformations, one per ligand. The X-ray crystal structures of HDAC8 (Protein Data Bank identifier [PDB ID]: 1T64; 1T67; 1VKG; 3SFF; and 2V5X) complexed with coligands were prepared using the “Protein Preparation Wizard” (Schrödinger Suite 2013 Protein Preparation Wizard; Epik version 2.5 and Prime version 2.2, Schrödinger, LLC; 2013). Prepared protein structures were subsequently used for grid generation using the “Receptor Grid Generation” panel. The receptor grid box was defined with a 15Å size from the center of the selected cocrystallized ligand. The root-mean-square deviation (RMSD) values between the docked conformation and cocrystallized ligands of 1T64, 1T67, 1VKG, 3SFF, and 2V5X were 0.3571, 1.7528, 0.4160, 1.0505, and 0.9651, respectively. 1T64, with the lowest RMSD value, was selected for the docking studies.
Pharmacophore identification
PHASE (PHASE, version 3.5, Schrödinger, LLC; 2013)34 provides six built-in pharmacophoric features: hydrogen bond acceptor (A); hydrogen bond donor (D); hydrophobic group (H); negatively ionizable (N); positively ionizable (P); and aromatic ring (R). Common pharmacophoric sites were created by keeping the default number of features. In the present study, an initial analysis showed that three chemical features (hydrogen bond acceptor [A], hydrogen bond donor [D], and aromatic ring [R]) could effectively map all inhibitors in the dataset. In the pharmacophore hypotheses scoring techniques, each pharmacophore and its associated ligand were treated temporarily as a reference in order to assign a score; the hypotheses were ranked according to the following scores: the alignment score, the vector score, and the volume score. To determine the common pharmacophore hypothesis, all compounds with pIC50 values ≥6.983 were considered to be active and those with pIC50 values ≤5.764 were considered to be inactive. The quality of alignment was measured by survival score.35
Building atom-based 3D QSAR models
The top three pharmacophore hypotheses (AADHRR.106, AADDRR.1695, and AADDHR.476) were selected to build atom-based 3D quantitative structure -activity relationship (QSAR) models (Table 1). The selected hypothesis contained hydrogen bond donors (D), hydrogen bond acceptors (A), and aromatic ring features (R), as shown in Figure 3. The fitness scores of the most active compound (1) with hypothesis AADHRR.106, AADDRR.1695, and AADDHR.476 were 3.0, 3.0, and 2.98, respectively, while the fitness scores of the least active compound (32) with same hypothesis were 2.69, 2.72, and 2.91, respectively. The training set molecules were randomly selected to constitute an atom-based 3D QSAR model; grid spacing was set to 1Å. Four partial least squares factors were used to avoid over-fitting of the results. The best QSAR model was selected for further validation. In the present study, the number of pharmacophoric features was six. The probability of matching the pharmacophoric features with the database molecules reduced with increasing numbers of features. Hence, low fitness scored molecules (fitness score ≥0.75) were also considered for the docking studies (Figure S1).
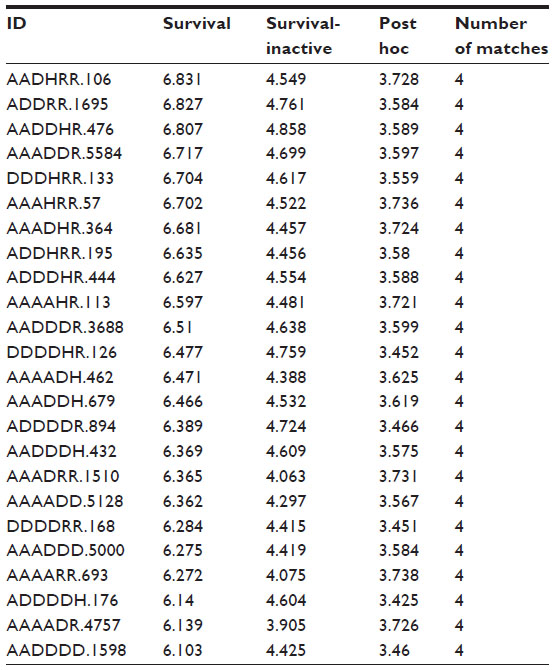 | Table 1 Pharmacophore hypothesis with scoring values |
 | Figure 3 PHASE-generated pharmacophore model of the most active ligand. |
Validation of the QSAR model
The 3D QSAR model is validated using both the internal and external validation methods. The prediction ability of the model is evaluated by the well-known “leave-one-out” cross-validation method.36 For comparison between the predicted and experimental activities of the training set, R2 (squared correlation coefficient) was used; for a good model, it should be ≥0.70.37 A high R2 in the training set shows good internal validation, but good internal validation does not indicate the high predictive ability of an external test set.38 Therefore, for a reliable predictive model, external validation is also essential. In this model, to determine the predictive power of the external validation root-mean-square error (RMSE). Q2 (test set correlation), and Pearson’s R (between the predicted and observed activity for the test set) were used. For a good predictive model, RMSE values should be low (<0.30), Q2 >0.60,37 and Pearson’s R should be >0.8. The other criteria for a good model are that R2–Q2 should not be more than 0.30,37 the standard deviation (SD) should be small, the highest F value, and lowest P-value containing factor should be considered. Based on these statistical criteria (Table 2), hypothesis AADDRR.1695 was selected for the 3D QSAR model generation.
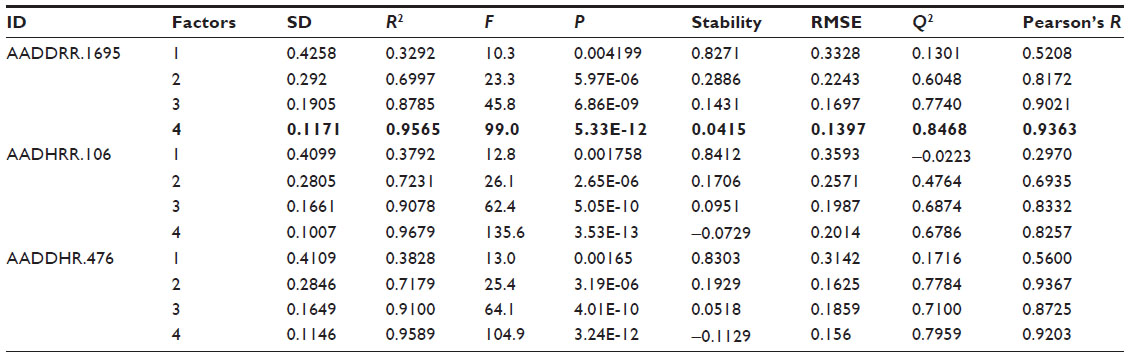 | Table 2 Statistical parameters for the best three pharmacophore hypotheses |
Molecular docking studies
Molecular docking studies for all known inhibitors, as well as hits obtained from pharmacophore-based virtual screening, were performed with a previously prepared receptor grid using the default options of Glide version 6.0, Schrödinger, LLC.39–41 The best docking pose was selected based on the XP Glide score.
Validation of the docking study
X-ray crystal structures of HDAC8 inhibitors were used to evaluate the ability of an XP Glide docking program. The RMSD was calculated by superimposition between the docking and cocrystalline pose of the coligand. The RMSD values of the coligands of HDAC8 (PDB ID: 1T64; 1T67; 1VKG; 3SFF; and 2V5X) were 0.3571, 1.7528, 0.4160, 1.0505, and 0.9651, respectively (Table 3). Glide was able to predict the right binding disposition of all ligands with an RMSD <3 Å, which indicated that Glide was able to reproduce the native conformation successfully.
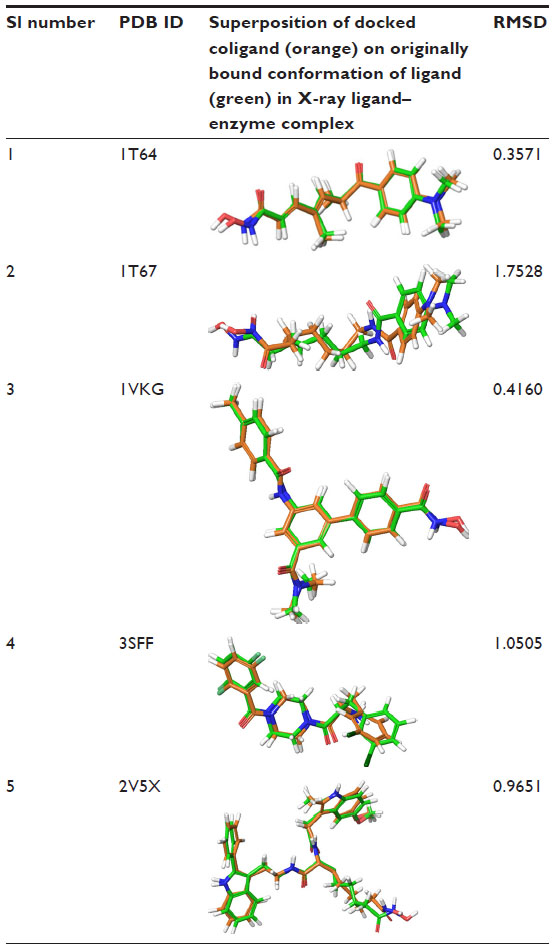 | Table 3 Structure overlap between coligand and docked orientation and their RMSD values |
Virtual screening
In drug discovery, the virtual screening of a database is an important part. The PHASE module of Schrödinger 9.6 was used for virtual screening of a 3D database. The best pharmacophore model, AADDRR.1695, was used for the virtual screening of a 3D chemical database to identify potential lead molecules that could be further developed as HDAC8 inhibitors with high activity. The Phase Database (Phase Commercially Available Compounds) was prepared by sound data format files of commercially available compounds obtained from the following vendors: Asinex (Winston-Salem, NC, USA); Bionet (Key Organics Inc., Bedford, MA, USA); ChemDiv (eMolecules, Inc., La Jolla, CA, USA) (chemdiv.emolecules.com); Enamine (Monmouth Junction, NJ, USA); LifeChem (Life Chemicals Inc., Niagara-on-the-Lake, ON, Canada); Maybridge (Thermo Fisher Scientific, Waltham, MA, USA); Specs (Zoetermeer, the Netherlands); and TimTec (Newark, DE, USA); containing approximately 4.3×10⁶ molecules. Initially, the database was filtered to remove duplicate molecules and molecules with highly undesirable properties. The resulting database was used to perform pharmacophore-based virtual screening, as depicted in the flowchart (Figure 4).
 | Figure 4 Workflow for the virtual screening protocol. |
ADME prediction of identified hits
The ADME study was performed to determine the drug-likeness properties of the identified HDAC8 inhibitors using the Schrödinger module, QikProp 3.5 (Schrödinger, LLC, New York, NY, USA). QikProp provides ranges of values to compare particular molecular properties with those of 95% of known drugs. The predicted absorption, distribution, metabolism, elimination, and toxicity (ADMET) properties of hits with acceptable ranges are listed in Table 4.
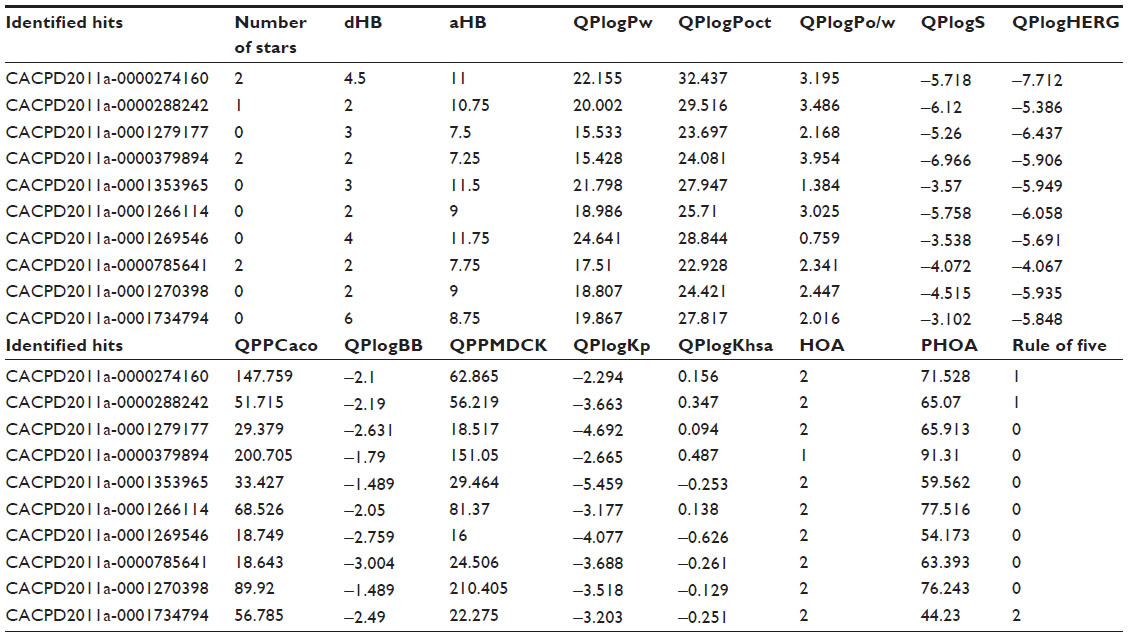 | Table 4 ADME properties of identified hits with recommended range |
Results and discussion
Twenty-four pharmacophore hypotheses were generated with AADHRR.106, AADDRR.1695, AADDHR.476, and so on, as shown in Table 1. The top three hypotheses (AADDRR.1695, AADHRR.106, and AADDHR.476) with high survival scores and survival-inactive scores were chosen for QSAR model building. All the statistical parameters of the three models are summarized in Table 2. Of the three best hypotheses, AADDRR.1695 yielded a statistically significant atom-based 3D QSAR model and was thus chosen for further study. Scatter plots of the observed and predicted activities for both the training and test set molecules are shown in Figure 5.
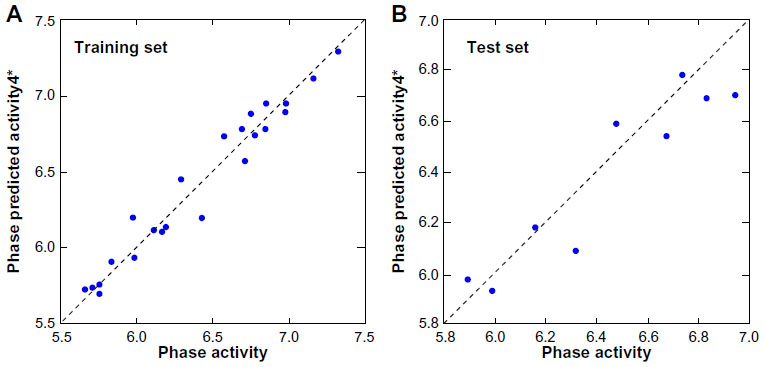 | Figure 5 Fitness graph between the observed and PHASE predicted activity for the training and test set compounds. |
3D QSAR analysis
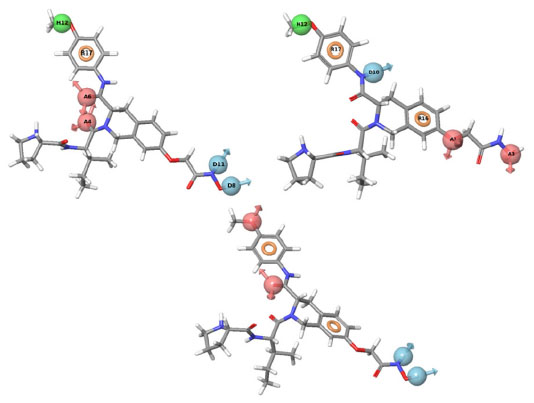
The 3D QSAR visualization generated by PHASE for highest active (1) and lowest active (32) compounds suggests that the blue cube regions are favorable for the introduction of the hydrogen bond donor group (D), and the orange cubes depict regions that are favorable for hydrogen bond acceptors (A) (Figure 6). Introducing these groups in the specified regions could increase the HDAC8 inhibitory activity.
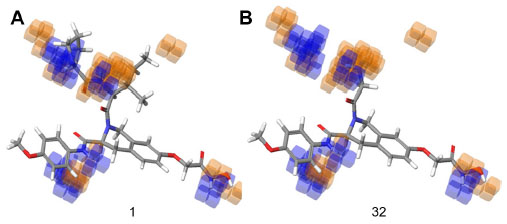 | Figure 6 Hydrogen bond donor visualization of a three-dimensional QSAR model on the highest active compound (1) and the least active compound (32). |
Figure 7 shows the regions that are favorable and unfavorable for hydrophobic substitutions, which are mapped on both molecules 1 and 32 among the training set. The regions that favor bulky substitutions are indicated as green cubes, while the unfavorable regions are shown as purple cubes. The mapping of these regions on molecule 32 shows that hydrophobic group unoccupied in favorable regions, which explains its least activity.
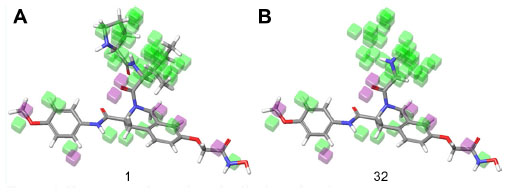 | Figure 7 Hydrophobic interaction visualization of a three-dimensional QSAR model on compound 1 and compound 32. |
Figure 8 shows the favorable and unfavorable regions for substitution with electron withdrawing groups on compound 1 and compound 32. The blue regions indicate that the presence of the electron withdrawing group in these regions will favor HDAC8 inhibitory activity, and the orange cube region surrounding the ligands indicates that these regions are unfavorable for substitution with electron withdrawing groups.
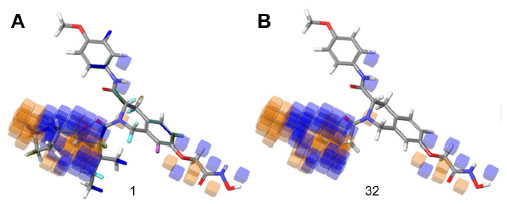 | Figure 8 Electron withdrawing visual representation of a three-dimensional QSAR model of compound 1 and compound 32. |
In sum, the favorable regions for the introduction of the hydrogen bond donor (A), hydrophobic, and electron withdrawing groups are shown as blue, green, and reddish-brown dotted regions, respectively (Figure 9).
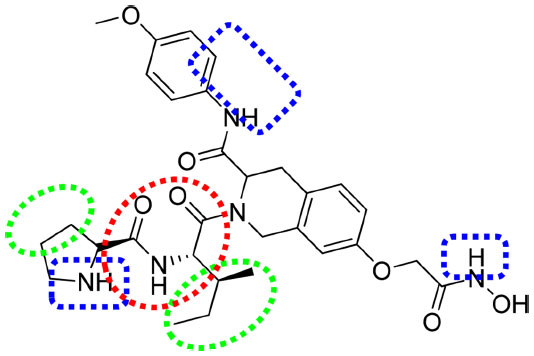 | Figure 9 Important features based on three-dimensional QSAR visualization on compound 1. |
Docking analysis
Docking studies revealed that both the inhibitors and virtual screening (VS) hits interact with active site residues through hydrogen bonds, Zn metal coordination, as well as through π–π and hydrophobic interactions. The 2D ligand interactions with different amino acid residues of HDAC8, the XP Glide score, and the Zn ligand interaction distances of both inhibitors and the ten identified hits are listed in Figures S2 and S3, respectively.
The analysis of docking interactions of both inhibitors and VS hits (Table 5) suggests that the major hydrophobic interactions occurred between the inhibitors and amino acid residues (PHE-152 [number of interactions {NOI} =14], PHE-207 [NOI=11], HIE-180 [NOI=10], TYR-100 [NOI=9], PHE-208 [NOI=6], and HIS-143 [NOI=3]). The hydrogen bond donor interactions were observed with amino acid residues HIS-142 (NOI=18), GLY-151 (NOI=7), GLY-140 (NOI=6), TYR-100 (NOI=3), HIS-143 (NOI=3), TYR-306 (NOI=23), PHE-208 (NOI=3), and HIE-180 (NOI=2), and hydrogen bond acceptor interactions were observed with TYR-306 (NOI=23), PHE-208 (NOI=3), and HIE-180 (NOI=2) amino acid residues. Hydroxamic acid functional groups of all the inhibitors bind Zn metal in the active site.
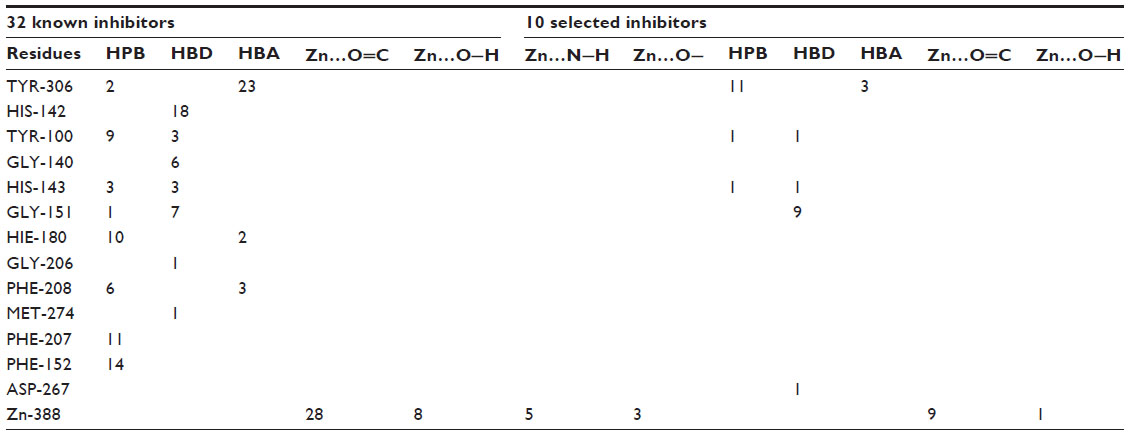 | Table 5 Summary of the number of HPB, HBD, HBA, and interactions with Zn |
The docking analysis of hits showed that the majority of the hydrophobic contacts occurred with TYR-306 (NOI=11), hydrogen bond donor interactions occurred with amino acid residues like GLY-151 (NOI=9), and hydrogen bond acceptor interactions occurred with TYR-306 (NOI=3). The amide functional groups of most of the hits interacted with the Zn2+ ion in the active site. The XP Glide score of identified hits (range: −10.596 to −12.969) was better than the XP Glide score of known inhibitors (range: −8.221 to −11.129) (Figures S2 and S3). All of the selected hits interacted with the Zn-like coligands of 1T64, which indicates their potential affinity to the receptor (Figure S4).
ADME analysis
The ADME parameters of the identified VS hits were within the acceptable range intended for human use (Table 4). Therefore, the VS hits obtained could be potential leads for the development of HDAC8 inhibitors. Experimental studies could be taken up further to assess their development.
Conclusion
Six-feature predictive pharmacophore models were generated using a training set of 21 compounds for the virtual screening of a chemical database. The screening of the database yielded 366 hits with fitness scores >0.75. A statistically significant atom-based 3D QSAR model was built using the six-feature pharmacophoric hypothesis, AADDRR.1695. The QSAR model visuals identified important structural features, such as the hydrogen bond donor (D), the hydrophobic interaction, and the electron withdrawing effect responsible for improved activity. Most of the HDAC8 inhibitors explored to date were from hydroxamic acid, which showed strong chelation with a Zn ion. For this reason, hydroxamic acid could present metabolic and pharmacokinetic challenges. The inhibitors reported in this paper are from the nonhydroxamic acid group. Finally, based on pharmacophore matching, predicted activity, the XP Glide score, and ADME filtration, ten structurally diverse hits were reported as potential HDAC8 inhibitors. These hits may be further developed as novel potential and selective inhibitors. Further, compound synthesis and in vitro inhibitory activity will be reported in due course.
Acknowledgment
The authors are thankful to the Department of Biotechnology, New Delhi, Government of India, for providing financial support (file number BT/327/NE/TBP/2012) for this research work.
Disclosure
The authors report no conflicts of interest in this work.
References
Glozak MA, Sengupta N, Zhang X, Seto E. Acetylation and deacetylation of non-histone proteins. Gene. 2005;363:15–23. | |
Suzuki T, Nagano Y, Matsuura A, et al. Novel histone deacetylase inhibitors: design, synthesis, enzyme inhibition, and binding mode study of SAHA-based non-hydroxamates. Bioorg Med Chem Lett. 2003;13(24):4321–4326. | |
Di Gennaro E, Bruzzese F, Caraglia M, Abruzzese A, Budillon A. Acetylation of proteins as novel target for antitumor therapy: review article. Amino Acids. 2004;26(4):435–441. | |
Bolden JE, Peart MJ, Johnstone RW. Anticancer activities of histone deacetylase inhibitors. Nat Rev Drug Discov. 2006;5(9):769–784. | |
Minucci S, Pelicci PG. Histone deacetylase inhibitors and the promise of epigenetic (and more) treatments for cancer. Nat Rev Cancer. 2006;6(1):38–51. | |
Nam NH, Huong TL, Dung do TM, et al. Novel isatin-based hydroxamic acids as histone deacetylase inhibitors and antitumor agents. Eur J Med Chem. 2013;70:477–486. | |
Wang C, Eessalu TE, Barth VN, et al. Design, synthesis, and evaluation of hydroxamic acid-based molecular probes for in vivo imaging of histone deacetylase (HDAC) in brain. Am J Nucl Med Mol Imaging. 2013;4(1):29–38. | |
Zhang Y, Feng J, Liu C, Fang H, Xu W. Design, synthesis and biological evaluation of tyrosine-based hydroxamic acid analogs as novel histone deacetylases (HDACs) inhibitors. Bioorg Med Chem. 2011;19(15):4437–4444. | |
Montero A, Beierle JM, Olsen CA, Ghadiri MR. Design, synthesis, biological evaluation, and structural characterization of potent histone deacetylase inhibitors based on cyclic alpha/beta-tetrapeptide architectures. J Am Chem Soc. 2009;131(8):3033–3041. | |
Vaidya AS, Karumudi B, Mendonca E, et al. Design, synthesis, modeling, biological evaluation and photoaffinity labeling studies of novel series of photoreactive benzamide probes for histone deacetylase 2. Bioorg Med Chem Lett. 2012;22(15):5025–5030. | |
Moradei OM, Mallais TC, Frechette S, et al. Novel aminophenyl benzamide-type histone deacetylase inhibitors with enhanced potency and selectivity. J Med Chem. 2007;50(23):5543–5546. | |
Ilies M, Dowling DP, Lombardi PM, Christianson DW. Synthesis of a new trifluoromethylketone analogue of l-arginine and contrasting inhibitory activity against human arginase I and histone deacetylase 8. Bioorg Med Chem Lett. 2011;21(19):5854–5858. | |
Bora-Tatar G, Dayangaç-Erden D, Demir AS, Dalkara S, Yelekçi K, Erdem-Yurter H. Molecular modifications on carboxylic acid derivatives as potent histone deacetylase inhibitors: activity and docking studies. Bioorg Med Chem. 2009;17(14):5219–5228. | |
Prince HM, Bishton MJ, Harrison SJ. Clinical studies of histone deacetylase inhibitors. Clin Cancer Res. 2009;15(12):3958–3969. | |
Thurn KT, Thomas S, Moore A, Munster PN. Rational therapeutic combinations with histone deacetylase inhibitors for the treatment of cancer. Future Oncol. 2011;7(2):263–283. | |
Hess-Stumpp H, Bracker TU, Henderson D, Politz O. MS-275, a potent orally available inhibitor of histone deacetylases – the development of an anticancer agent. Int J Biochem Cell Biol. 2007;39(7–8):1388–1405. | |
Gregoretti IV, Lee YM, Goodson HV. Molecular evolution of the histone deacetylase family: functional implications of phylogenetic analysis. J Mol Biol. 2004;338(1):17–31. | |
Oehme I, Deubzer HE, Wegener D, et al. Histone deacetylase 8 in neuroblastoma tumorigenesis. Clin Cancer Res. 2009;15(1):91–99. | |
Gryder BE, Sodji QH, Oyelere AK. Targeted cancer therapy: giving histone deacetylase inhibitors all they need to succeed. Future Med Chem. 2012;4(4):505–524. | |
Balasubramanian S, Ramos J, Luo W, Sirisawad M, Verner E, Buggy JJ. A novel histone deacetylase 8 (HDAC8)-specific inhibitor PCI-34051 induces apoptosis in T-cell lymphomas. Leukemia. 2008;22(5):1026–1034. | |
Song J, Noh JH, Lee JH, et al. Increased expression of histone deacetylase 2 is found in human gastric cancer. APMIS. 2005;113(4):264–268. | |
Zhu P, Martin E, Mengwasser J, Schlag P, Janssen KP, Göttlicher M. Induction of HDAC2 expression upon loss of APC in colorectal tumorigenesis. Cancer Cell. 2004;5(5):455–463. | |
Tang W, Luo T, Greenberg EF, Bradner JE, Schreiber SL. Discovery of histone deacetylase 8 selective inhibitors. Bioorg Med Chem Lett. 2011;21(9):2601–2605. | |
Liu T, Kapustin G, Etzkorn FA. Design and synthesis of a potent histone deacetylase inhibitor. J Med Chem. 2007;50(9):2003–2006. | |
Olson DE, Wagner FF, Kaya T, et al. Discovery of the first histone deacetylase 6/8 dual inhibitors. J Med Chem. 2013;56(11):4816–4820. | |
Chen PC, Patil V, Guerrant W, Green P, Oyelere AK. Synthesis and structure-activity relationship of histone deacetylase (HDAC) inhibitors with triazole-linked cap group. Bioorg Med Chem. 2008;16(9):4839–4853. | |
Grozinger CM, Schreiber SL. Deacetylase enzymes: biological functions and the use of small-molecule inhibitors. Chem Biol. 2002;9(1):3–16. | |
Jung M, Brosch G, Kölle D, Scherf H, Gerhäuser C, Loidl P. Amide analogues of trichostatin A as inhibitors of histone deacetylase and inducers of terminal cell differentiation. J Med Chem. 1999;42(22):4669–4679. | |
Furumai R, Komatsu Y, Nishino N, Khochbin S, Yoshida M, Horinouchi S. Potent histone deacetylase inhibitors built from trichostatin A and cyclic tetrapeptide antibiotics including trapoxin. Proc Natl Acad Sci U S A. 2001;98(1):87–92. | |
Finnin MS, Donigian JR, Cohen A, et al. Structures of a histone deacetylase homologue bound to the TSA and SAHA inhibitors. Nature. 1999;401(6749):188–193. | |
Patil V, Sodji QH, Kornacki JR, Mrksich M, Oyelere AK. 3-Hydroxypyridin-2-thione as novel zinc binding group for selective histone deacetylase inhibition. J Med Chem. 2013;56(9):3492–3506. | |
Zhang Y, Feng J, Jia Y, et al. Development of tetrahydroisoquinoline-based hydroxamic acid derivatives: potent histone deacetylase inhibitors with marked in vitro and in vivo antitumor activities. J Med Chem. 2011;54(8):2823–2838. | |
Somoza JR, Skene RJ, Katz BA, et al. Structural snapshots of human HDAC8 provide insights into the class I histone deacetylases. Structure. 2004;12(7):1325–1334. | |
Dixon SL, Smondyrev AM, Knoll EH, Rao SN, Shaw DE, Friesner RA. PHASE: a new engine for pharmacophore perception, 3D QSAR model development, and 3D database screening: 1. Methodology and preliminary results. J Comput Aided Mol Des. 2006;20(10–11):647–671. | |
Tawari NR, Bag S, Degani MS. Pharmacophore mapping of a series of pyrrolopyrimidines, indolopyrimidines and their congeners as multidrug-resistance-associated protein (MRP1) modulators. J Mol Model. 2008;14(10):911–921. | |
Tetko IV, Tanchuk VY, Villa AE. Prediction of n-octanol/water partition coefficients from PHYSPROP database using artificial neural networks and E-state indices. J Chem Inf Comput Sci. 2001;41(5):1407–1421. | |
Veerasamy R, Rajak H, Jain A, Sivadasan S, Varghese CP, Agrawal RK. Validation of QSAR models – strategies and importance. International Journal of Drug Design and Discovery. 2011;2(3):511–519. | |
Roy DR, Sarkar U, Chattaraj PK, et al. Analyzing toxicity through electrophilicity. Mol Divers. 2006;10(2):119–131. | |
Friesner RA, Banks JL, Murphy RB, et al. Glide: a new approach for rapid, accurate docking and scoring. 1. Method and assessment of docking accuracy. J Med Chem. 2004;47(7):1739–1749. | |
Halgren TA, Murphy RB, Friesner RA, et al. Glide: a new approach for rapid, accurate docking and scoring. 2. Enrichment factors in database screening. J Med Chem. 2004;47(7):1750–1759. | |
Friesner RA, Murphy RB, Repasky MP, et al. Extra precision glide: docking and scoring incorporating a model of hydrophobic enclosure for protein-ligand complexes. J Med Chem. 2006;49(21):6177–6196. |
Supplementary materials
 | Figure S1 Mapping of ten identified hits with pharmacophore matching and fitness score with compound ID. |
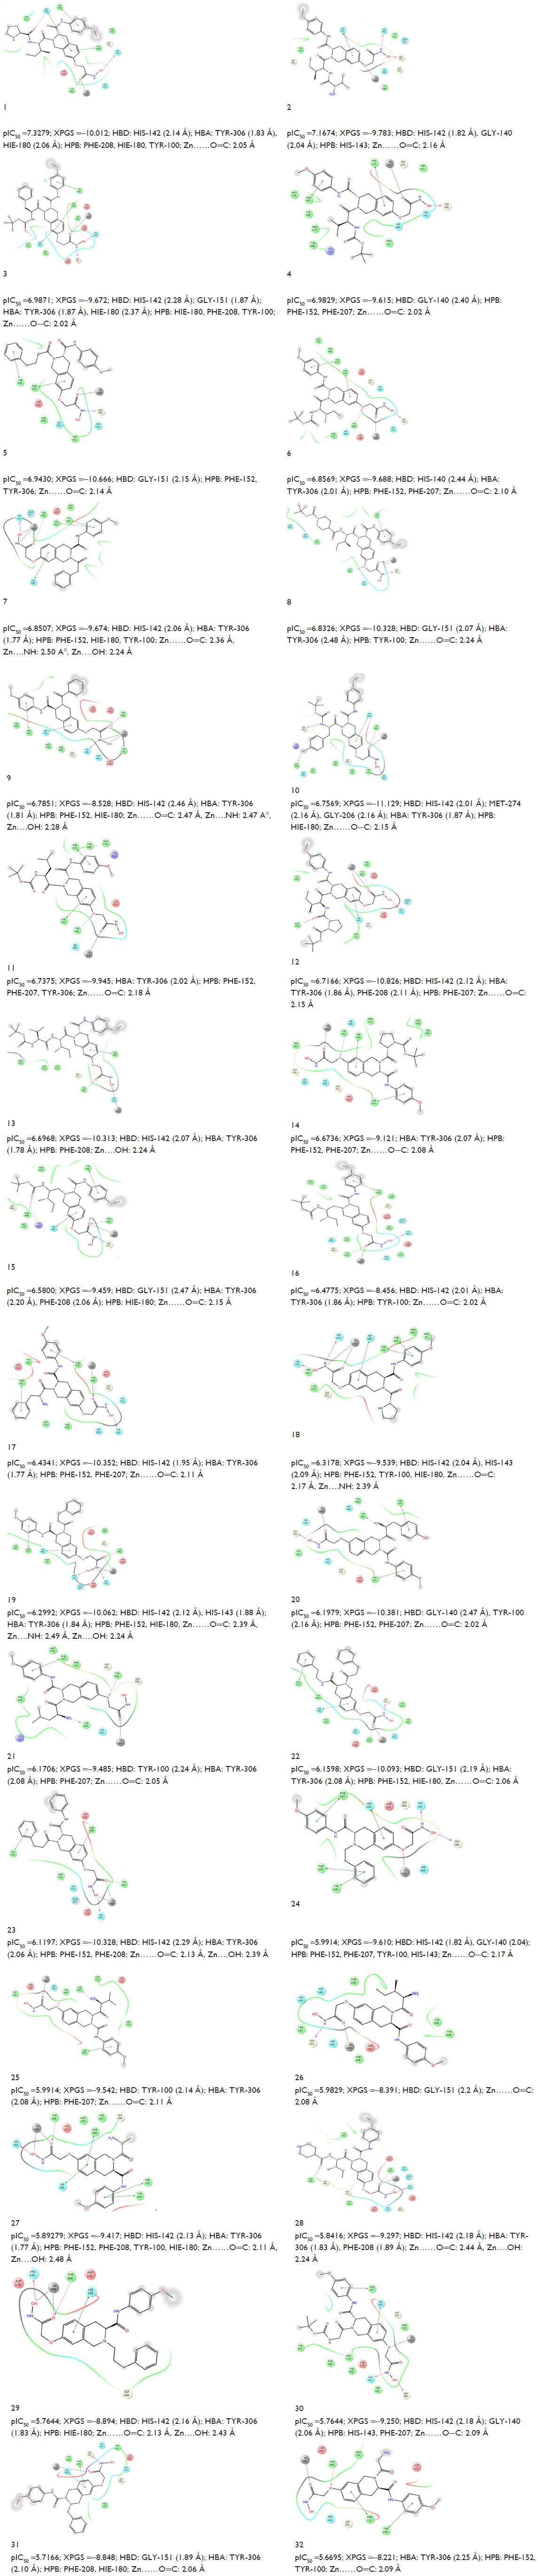 | Figure S2 Experimental activity (pIC50), XPGS, type of interaction (HBD and HBA), and Zn (interaction distance) of known inhibitors. |
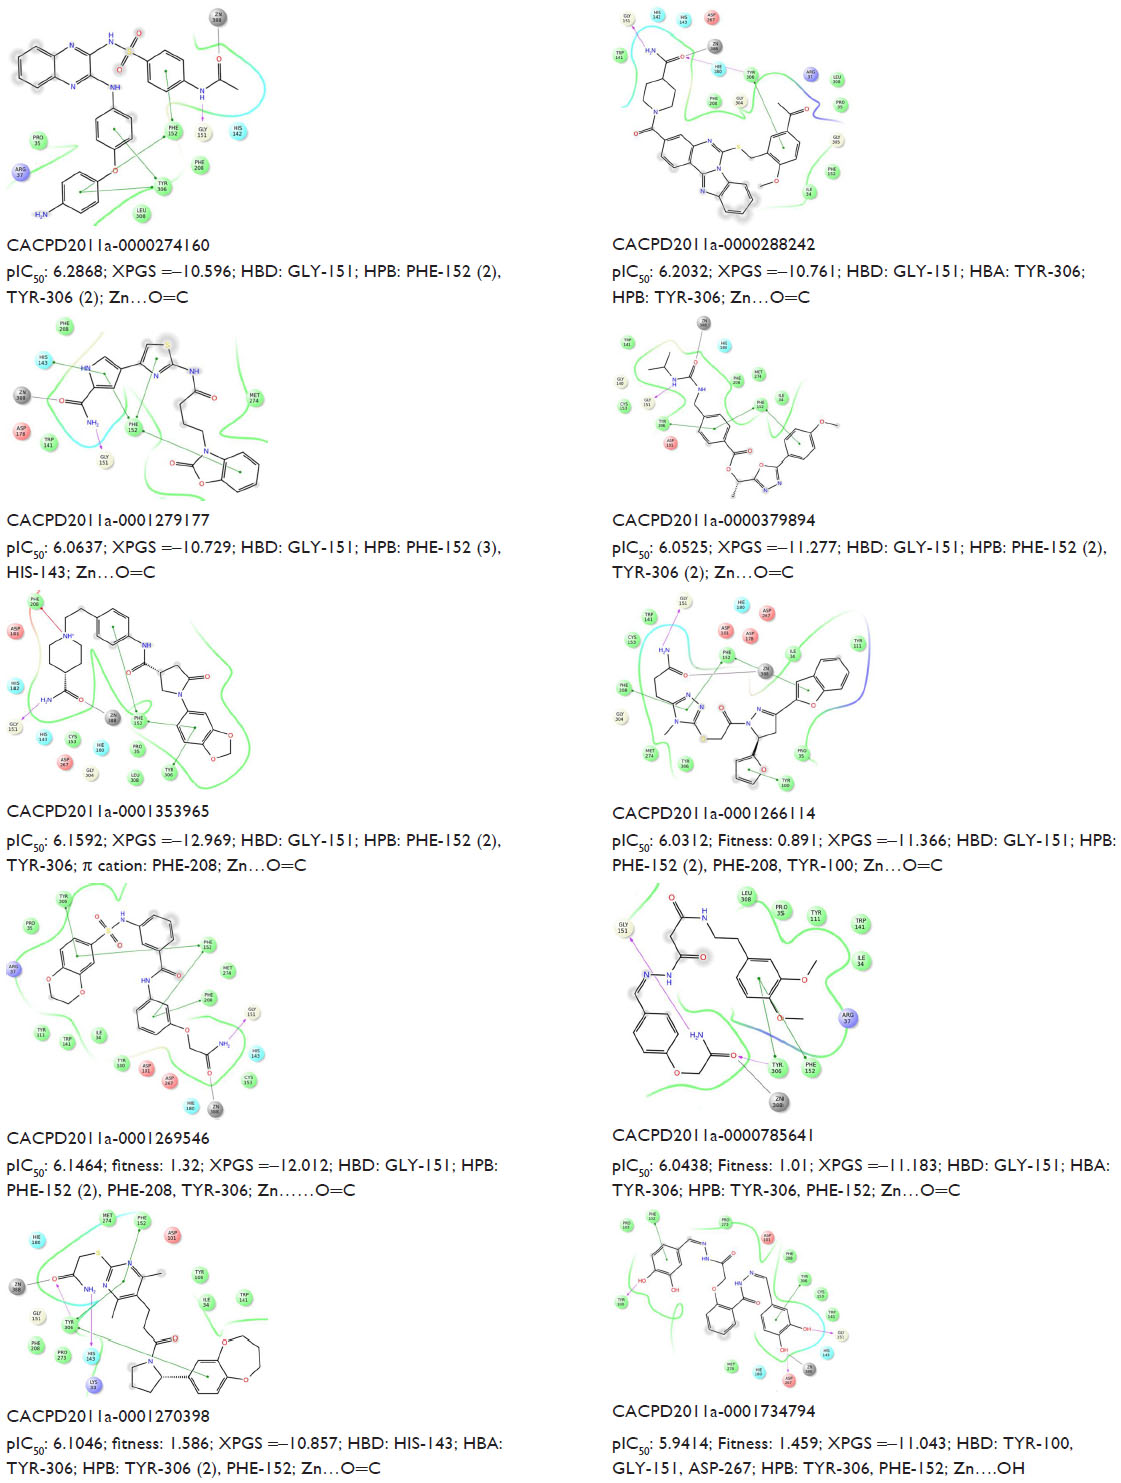 | Figure S3 Predicted activity (pIC50), XPGS, type of interaction (HBD and HBA), and Zn (interaction distance) of ten potent hits. |
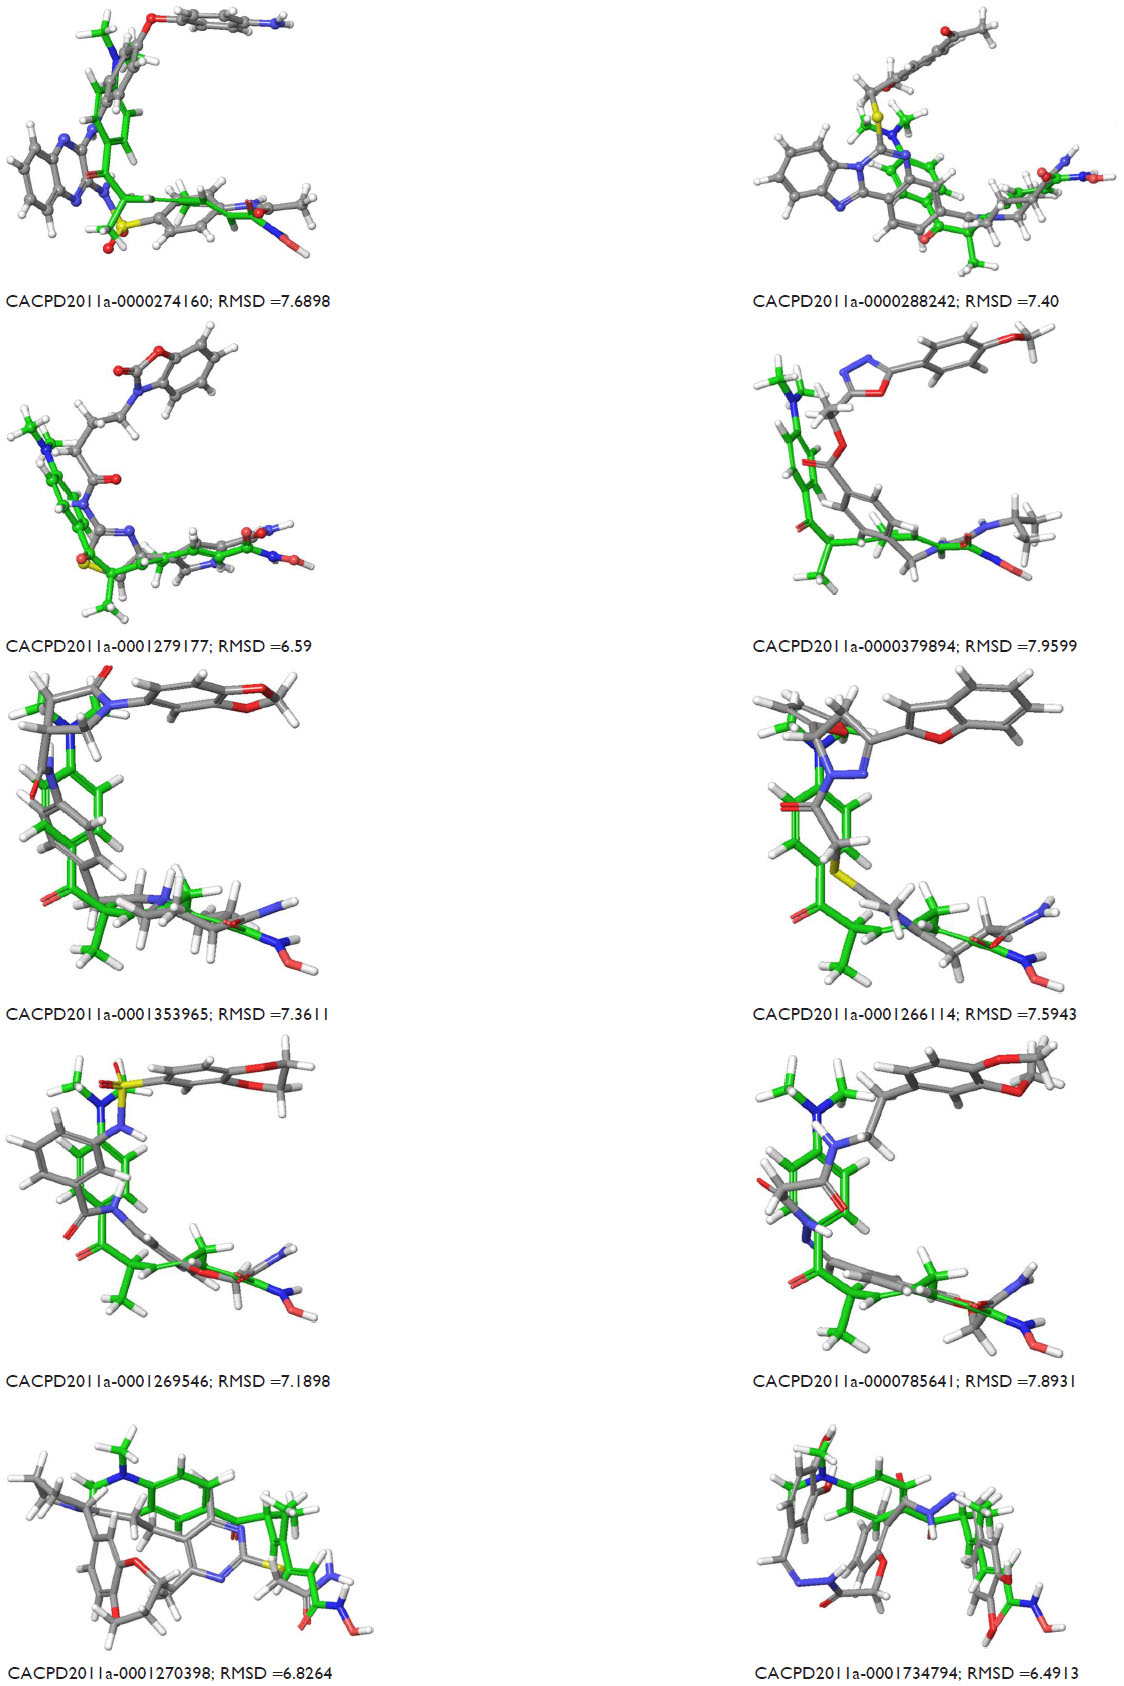 | Figure S4 Superposition of reported hits on the coligand of the X-ray ligand–enzyme complex of 1T64 and RMSD values. |
 © 2015 The Author(s). This work is published and licensed by Dove Medical Press Limited. The full terms of this license are available at https://www.dovepress.com/terms.php and incorporate the Creative Commons Attribution - Non Commercial (unported, v3.0) License.
By accessing the work you hereby accept the Terms. Non-commercial uses of the work are permitted without any further permission from Dove Medical Press Limited, provided the work is properly attributed. For permission for commercial use of this work, please see paragraphs 4.2 and 5 of our Terms.
© 2015 The Author(s). This work is published and licensed by Dove Medical Press Limited. The full terms of this license are available at https://www.dovepress.com/terms.php and incorporate the Creative Commons Attribution - Non Commercial (unported, v3.0) License.
By accessing the work you hereby accept the Terms. Non-commercial uses of the work are permitted without any further permission from Dove Medical Press Limited, provided the work is properly attributed. For permission for commercial use of this work, please see paragraphs 4.2 and 5 of our Terms.