")
Back to Journals » Cancer Management and Research » Volume 12
Identification of PDE7B as a Potential Core Gene Involved in the Metastasis of Clear Cell Renal Cell Carcinoma
Authors Sun Y, Zou J, Ouyang W, Chen K
Received 23 April 2020
Accepted for publication 17 June 2020
Published 12 July 2020 Volume 2020:12 Pages 5701—5712
DOI https://doi.org/10.2147/CMAR.S259192
Checked for plagiarism Yes
Review by Single anonymous peer review
Peer reviewer comments 2
Editor who approved publication: Professor Rudolph Navari
Yi Sun,1,2,* Junxia Zou,3,* Wei Ouyang,1,2 Ke Chen1,2
1Department of Urology, Tongji Hospital, Tongji Medical College, Huazhong University of Science and Technology, Wuhan 430030, People’s Republic of China; 2Hubei Institute of Urology, Wuhan 430030, People’s Republic of China; 3Department of Pediatrics, Tongji Hospital, Tongji Medical College, Huazhong University of Science and Technology, Wuhan 430030, People’s Republic of China
*These authors contributed equally to this work
Correspondence: Ke Chen Email [email protected]
Background: Metastasis is the main cause of treatment failure in various cancer, including ccRCC. However, the key genes involved in ccRCC metastasis remain largely unknown.
Purpose: The identification of the aberrant gene expression patterns associated with metastatic traits is of great clinical significance. The aim of this study was to investigate the clinical significance and function of PDE7B in ccRCC.
Materials and Methods: Expression profiling data for patient-matched primary and metastatic ccRCC tumors were obtained from GEO Dataset. Limma package was used to identify differentially expressed genes (DEGs) between the metastatic and the primary groups. Gene Ontology, Kyoto Encyclopedia of Genes Genomes (KEGG), and PPI network analysis were used to study the interacting activities and the interconnection of the DEGs. CCK-8 assays and Transwell assays were performed to detect the proliferation and migration of renal cancer cells.
Results: We obtained 163 DEGs, including 132 that were upregulated and 31 that were downregulated in metastatic ccRCC tissues. Both Gene Ontology function and KEGG pathway analysis showed that DEGs were involved in extracellular matrix (ECM) organization and cell adhesion. After utilizing PPI network to explore the interconnection among the DEGs, 22 genes were selected as the hub genes. Subsequently, survival analysis revealed that seven hub genes (SFN, NKX2-1, HP, MAPT, EPHA4, KCNAB1, and PDE7B) were significantly associated with overall survival disease-specific survival, and progression-free interval in ccRCC. Moreover, the low expression of PDE7B was found in clinical ccRCC samples and correlated with TNM stage and histologic grade. We further showed that knockdown of PDE7B increased cell growth and migration of renal cancer cells.
Conclusion: Our results implicated that PDE7B may play a key role in the development of metastatic RCC.
Keywords: metastatic renal cell carcinoma, differentially expressed genes, PDE7B, extracellular matrix
Introduction
Renal cell carcinoma (RCC) is a common urologic tumor and accounts for about 175,000 deaths in 2018.1 Most of the deaths from RCC are caused by metastases; and the most common sites of RCC metastasis are lung and bone.2 Approximately 20–30% of patients with RCC have metastatic disease at initial diagnosis. In addition, about 25–40% of RCC patients would recur and ultimately develop into metastatic renal cell carcinoma (mRCC) after resection of the primary tumor.3 Clear cell RCC (ccRCC) accounts for about 75% of all RCC tumors and is the best studied subtype of RCC. During the past 20 years, researchers have made significant progress in understanding the molecular mechanisms involved in the metastasis of ccRCC. An increasing number of studies have revealed that both tumor cell-intrinsic changes and the tumor microenvironment (TME) abnormalities are involved in RCC metastasis.4,5 These studies have led to new treatment options for metastatic ccRCC.4 However, the mortality rates and 5-year survival remain poor. Therefore, understanding the precise molecular mechanisms that lead to ccRCC metastasis will be critical to discover novel therapeutic targets for metastatic ccRCC.
Delineating the specific gene expression programs during cancer cells acquires metastatic properties is important for understanding the mechanism of metastasis. Owing to the metastases, ccRCC tissue is obtained rarely, the interrogation of molecular mechanisms that lead to ccRCC metastases has primarily been based on studies made in the primary tumor and metastatic models of renal cancer cells.6–8 Currently, genome-wide gene expression profiling has identified many genes that were altered in metastatic ccRCC compared with their patient-matched primary tumor.2,9,10 For example, Ho et al used microarrays methods on 14 pairs of lung metastases ccRCC tissue and matched primary tumor tissue, and identified up-regulation of ECM genes in metastases.2 However, whether and how specific genes lead to ccRCC metastases remains largely unknown.
In the present study, bioinformatics methods were used to screen differentially expressed genes (DEGs) between tissues from metastatic ccRCC and primary ccRCC. Subsequently, pathway enrichment analysis and protein‑protein interaction (PPI) network analysis were performed to predict the potential functions and potential mechanism of DEGs. We identified several genes whose deregulation is associated with a worsened prognosis through subsequent analysis of the TCGA cohort. Our data also implicate PDE7B functions as a tumor suppressor in ccRCC.
Methods
Data Collection
The TCGA data about mRNA expression levels and clinical data were downloaded from an integrated TCGA Pan-Cancer Clinical Data Resource and used for survival analysis.11 The read counts of ccRCC data in TCGA were downloaded from UCSC Xena and used for differentially expression analysis between renal cancer tissues and adjacent normal tissues. The GEO datasets (GSE22541, GSE85258 and GSE105261) contained both the primary and metastatic ccRCC tissues were downloaded and used for the identification of differentially expressed genes.2,9,10
mRNA Expression Analysis of Microarray
The gene expression data from GEO database were downloaded using the GEOquery package.12 Differentially expressed genes between groups were identified with |log2FoldChange|>2 and adj. P‑value <0.05 (GSE22541) or P‑value <0.05 (GSE85258) cutoffs using Limma package.13
Pathway Enrichment Analysis
The g:Profiler is a common web-based tool for analyzing pathway enrichment of a gene list.14 GO and KEGG pathway analysis of differentially expressed genes was performed using g:Profiler. Adjusted P‑value <0.05 was considered as a significant enrichment.
The PPI Network Analysis
The online software NetworkAnalyst was used to apply to construct and visualize the PPI network analysis.15 The DEGs were put together in a list with gene symbols, along with the expressions that were shown as Log2 (fold change). The STRING Interactome was selected as the PPI database, and the confidence score cutoff was set as 900 for the analysis.
The Cancer Genome Atlas (TCGA) Analysis
The relative expression levels of all genes in the ccRCC tissue compared with the expression levels in normal kidney tissue from TCGA were analyzed using the DeSeq2 software.16 In addition, the overall survival (OS), disease-specific survival (DSS), and progression-free interval (PFI) analyses were performed by the Kaplan‑Meier survival method with log‑rank test.
RNA Interference and Real-Time PCR Analysis
PDE7B-specific (sh-PDE7B) or control (sh-LacZ) shRNA target sequence was synthesised and cloned into PCDH-H1 containing EGFP and a puromycin resistance cassette. The target sequences for PDE7B were as follows: PDE7B-1#, GCTCACCTCCACAATAAAGAC; PDE7B-2#, GGCCCAGTGGAAGAGCCTG. RT-PCR, real-time PCR assays were performed as described previously.17 The primers for qPCR were as follows: PDE7B-F, GGCAAGGTGAACTTGAACAGA; PDE7B-R, CTGGGCCTTGTTGTGTGCGA; GAPDH-F, TGGTCACCAGGGCTGCTTTTA; GAPDH-R, CATCGCCCCACTTGATTTTG.
Cell Culture
HEK293T cell line was purchased from the National Infrastructure of Cell Line Resource (Beijing, China). The 786-O and ACHN cell lines were purchased from the American Type Culture Collection (ATCC). These cells were cultured in Dulbecco’s modified Eagle’s medium (Invitrogen) with 10% fetal bovine serum (HyClone). All cells were maintained in the presence of 5% CO2 at 37°C.
Cell Proliferation and Migration Assays
Renal cancer cells were infected with lentivirus for 48 h, and then cells were digested and transferred to 96 well micro-plates, replanting at a density of approximately 2000 cells per well. CCK-8 kit was utilized to quantify cell viability at 24 h, 48 h, 72 h, 96 h after seeded in 96 well micro-plates. Cell proliferation was measured using the CCK-8 (Dojindo Laboratories) according to the manufacturer’s instructions. Migration was conducted using Matrigel-coated Transwell inserts according to manufacturer’s instructions. A density of about 1x10⁵ of renal cancer cells were suspended and then seeded in the upper chambers of 24-well transwell plates with FBS-free medium. Culture medium containing 10% fetal bovine serum was deposited in the lower chambers. After 12–18 hours, cells that migrated were stained by 0.5% crystal violet solution for 15 min and counted.
Statistical Analysis
The data is presented as the means ±SD. Comparisons between two groups were performed using an unpaired Student’s t-test. All data were analyzed using GraphPad Prism 8.0 (GraphPad software, Inc., La Jolla, CA, USA). Three levels of significance were used (*p < 0.05, **p < 0.01, and ***p < 0.001).
Results
DEGs Screening
To obtain novel insight into the biology of metastatic ccRCC, expression levels of genes were compared between the primary and metastatic ccRCC tissues to identify differentially expressed genes (DEGs) by Limma. |log2FC|>1 and adjusted P‑value <0.05 were considered as threshold values for the DEGs. In summary, we identified 433 DEGs in GSE22541 and 317 DEGs in GSE85258 (Supplementary Table S1 and S2). Venn analysis was performed and the result shown that 163 DEGs in total were differentially expressed in both assays, among which 132 genes were upregulated and 31 genes were downregulated in metastatic ccRCC group (Figure 1; Supplementary Table S3).
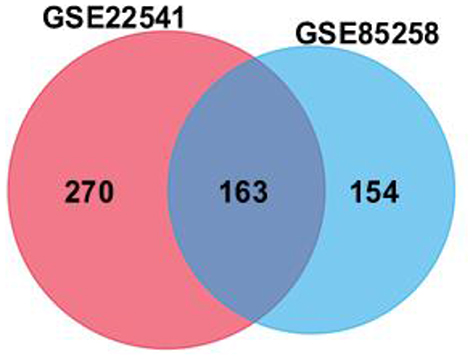 |
Figure 1 Venn diagram of differentially expressed genes (DEGs, 433 in GSE22541 and 317 in GSE85258) was used to obtain the DEG profiles intersection. 163 DEGs in total were remarkably expressed differentially in both datasets. |
KEGG and GO Enrichment Analyses of DEGs
To analyze the biological classification of DEGs, pathway enrichment analysis was performed using the g:Profile software. The analysis results showed that variations in biological process (BP) of DEGs have been dramatically rich in “extracellular matrix organization” (GO:0030198),“tube development” (GO:0035295), “response to growth factor” (GO:0070848), “cell adhesion” (GO:0007155) (Figure 2A). Changes in the molecular function (MF) of DEGs were enriched in “Extracellular matrix structural constituent” (GO:0005201), “Platelet-derived growth factor binding” (GO:0048407), and “aspartic-type endopeptidase activity” (GO:0070001)(Figure 2A). Furthermore, KEGG pathway (Figure 2B) revealed that DEGs mostly aggregated in the “Protein digestion and absorption” (KEGG:04974), ‘AGE-RAGE signaling pathway in diabetic complications’ (KEGG:04933), “ECM-receptor interaction” (KEGG:04512) and “Focal adhesion” (KEGG:04510) pathways. The detailed results of KEGG pathways and GO enrichment analyses for the identified DEGs were listed in Supplementary Table S4.
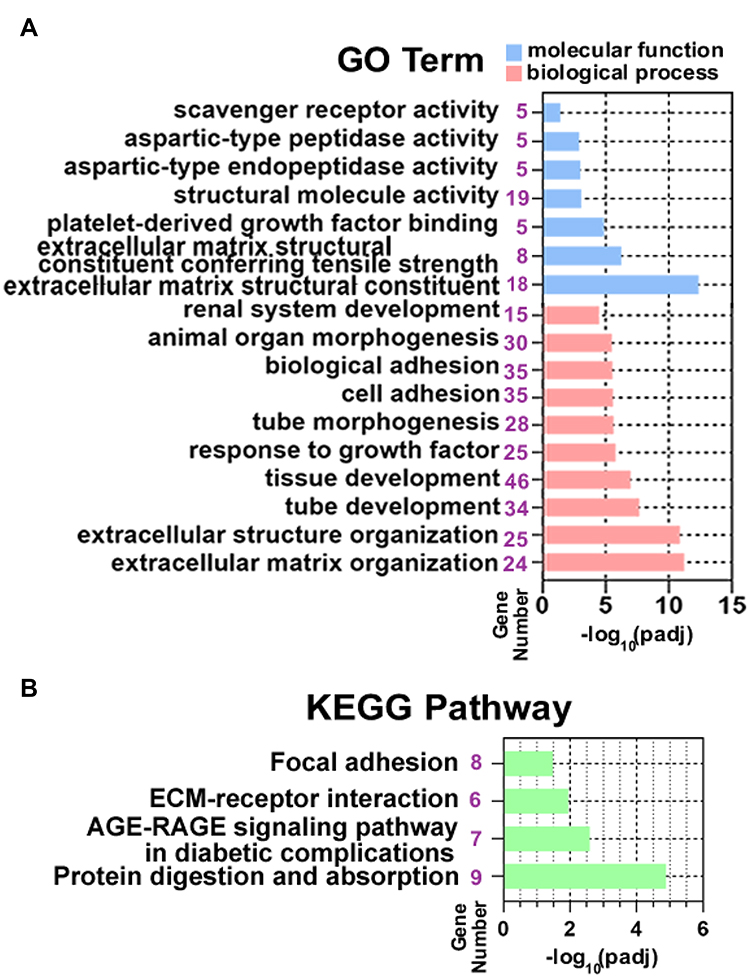 |
Figure 2 Functional and pathway enrichment analysis of DEGs. (A) Significantly enriched GO terms of DEGs. The blue columns represent the molecular function group, the orange columns represent the biological process group. (B) KEGG pathway enrichment of DEGs. |
The PPI Network of DEGs
To obtain the interactions between DEGs, we next construct the PPI network using networkanalyst software. Consequently, we obtained 21 subnetworks which including a “continent” (Subnetwork 1) and 20 “islands” (Subnetwork 2–21). As shown in Figure 3A, the subnetwork 1 included 412 nodes, 484 edges and 35 seeds. In addition, the subnetwork 1 was composed of 18 modules shown in Supplemental Table S5 via module exploring function. The visualized Subnetwork 2–4 are shown in Figure 3B–D. The detail information of in all subnetworks were listed in Supplemental Table S6.
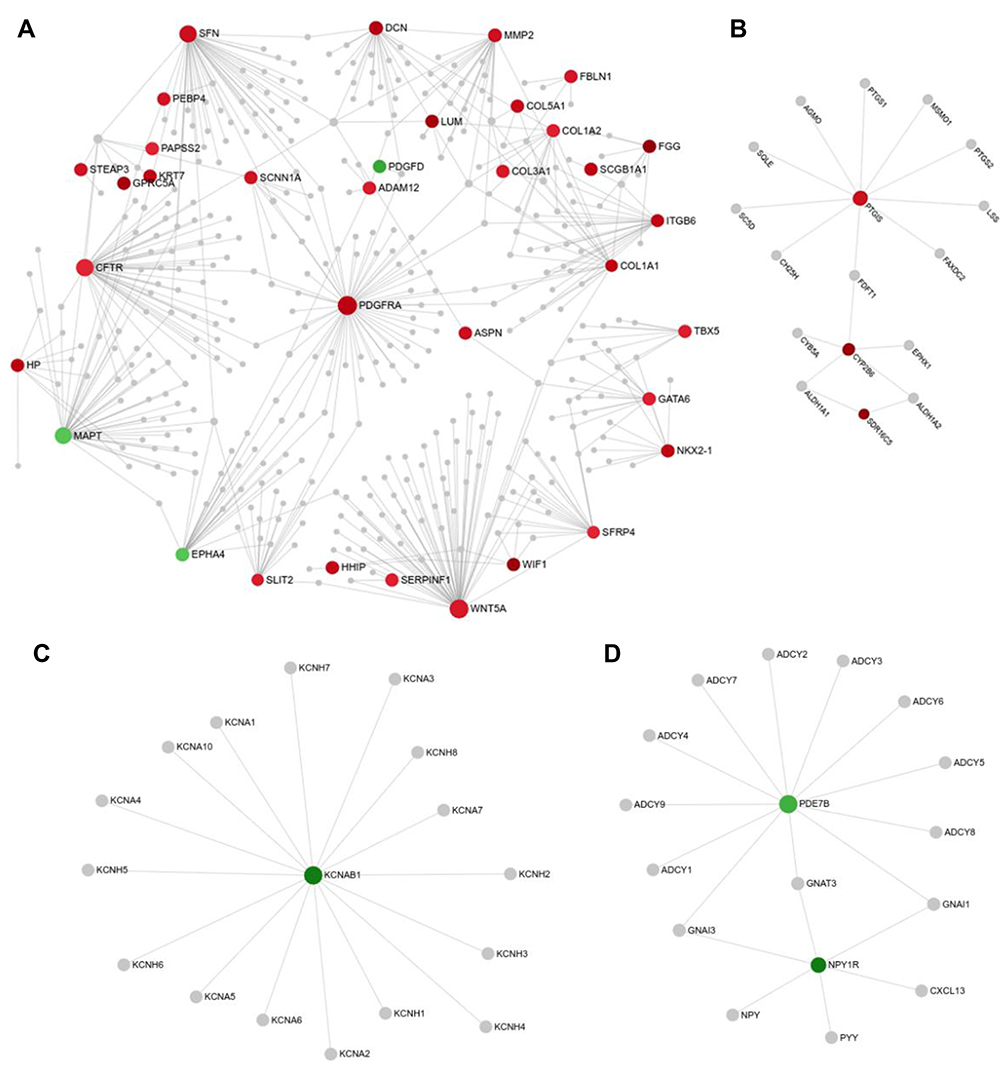 |
Figure 3 Protein-protein interaction (PPI) network of DEGs analyzed by STRING database. (A–D) Subnetwork 1 (A), Subnetwork 2 (B), Subnetwork 3 (C), and Subnetwork 4 (D) were visualized in the network. The red color and green color indicate the nodes are up- and down-regulated, respectively. |
Hub Gene Selection and Analysis/Hub Nodes in the Network
Based on the threshold values (Degree>7), 22 DEGs were selected as hub genes (Figure 4). Particularly, 19 of them were included in Subnetwork 1. Furthermore, the information of hub genes and their degrees were listed in Supplemental Table S7.
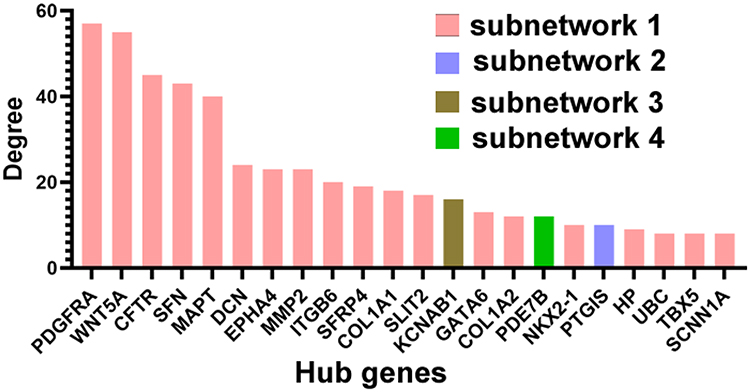 |
Figure 4 Hub genes identified by PPI network. The top 22 hub nodes with their degrees are displayed. |
Survival Analysis of Hub Genes
Next, we analyzed all the 22 hub genes in ccRCC from the TCGA cohort (Table 1). Survival analysis showed that high expression of SFN, NKX2-1, and HP predicted poor OS and disease-specific survival (DSS), and shorter progression-free interval (PFI) (Figure 5). However, low expression of MAPT, EPHA4, KCNAB1, and PDE7B were associated with poor OS and DSS, and shorter PFI (Figure 6).
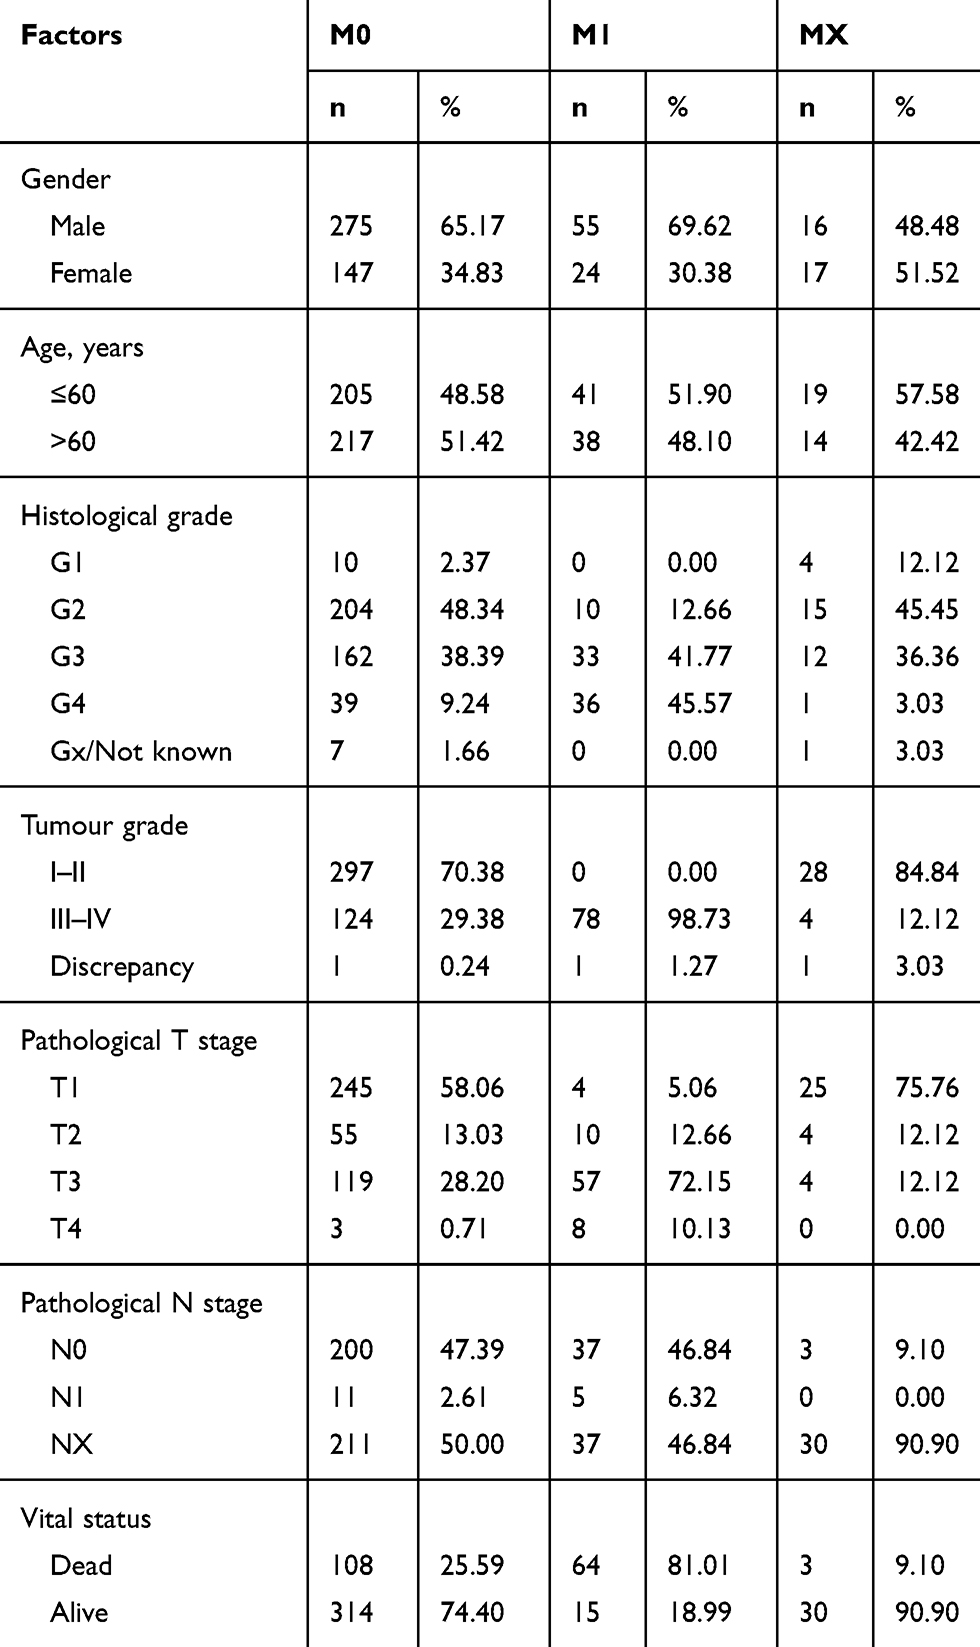 |
Table 1 Features of ccRCC Patients Downloaded from TCGA According to the Metastasis Status |
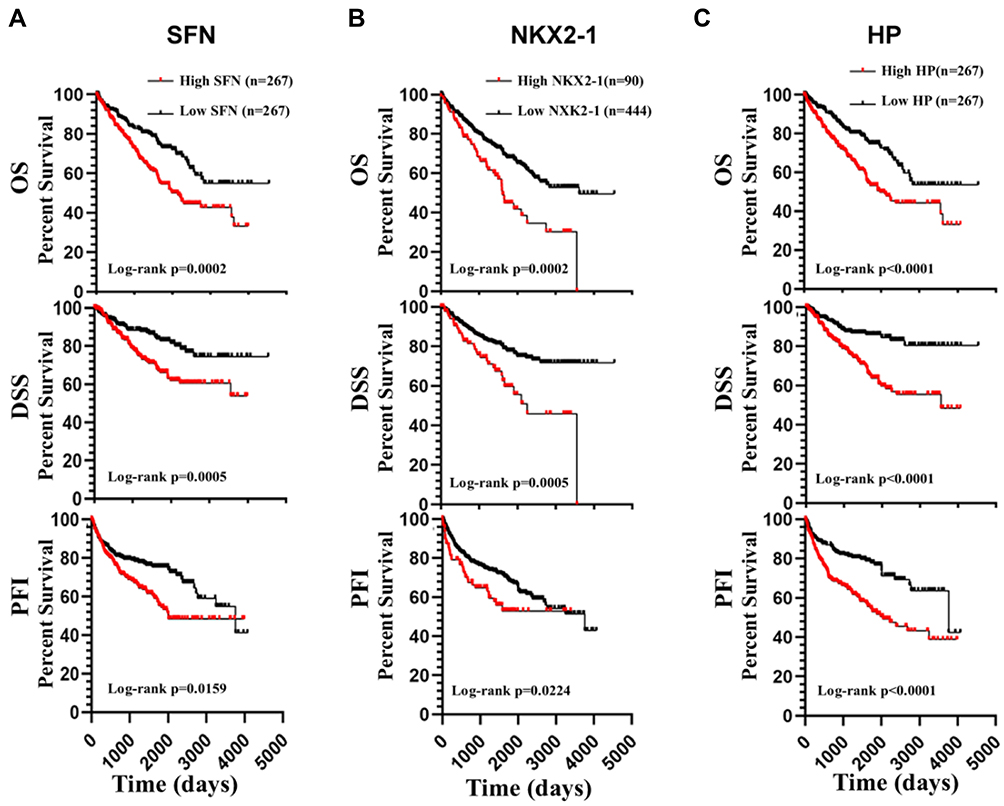 |
Figure 5 Survival analysis of hub genes. ccRCC patients with high expression of SFN (A), NKX2-1 (B), and HP (C) showed poor OS and disease-specific survival (DSS), and shorter progression-free interval (PFI). |
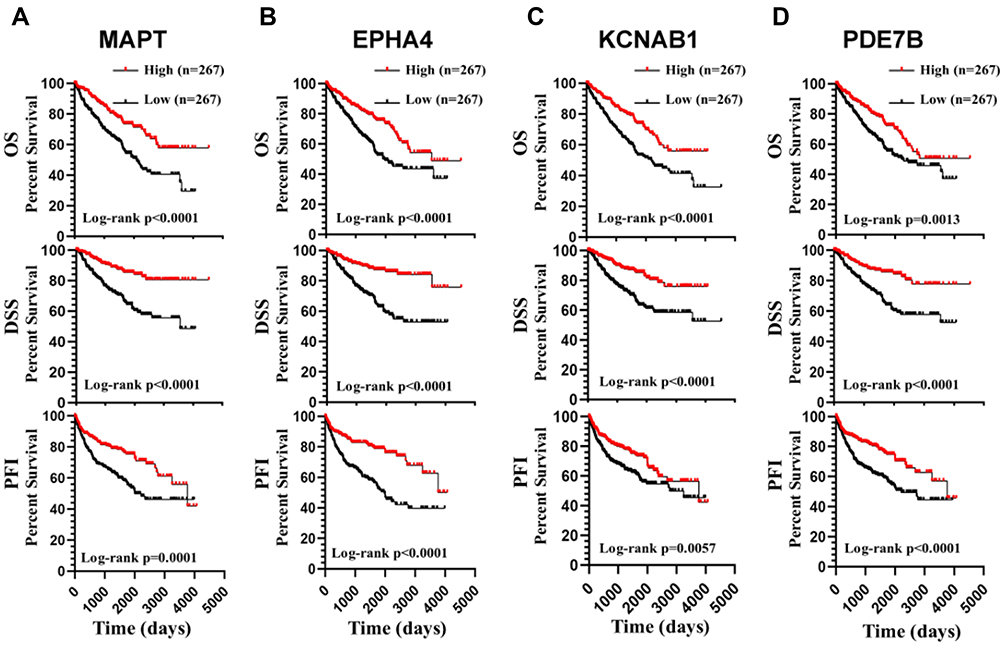 |
Figure 6 Survival analysis of hub genes. ccRCC patients with low expression of MAPT (A), EPHA4 (B), KCNAB1 (C), and PDE7B (D) showed poor OS and disease-specific survival (DSS), and shorter progression-free interval (PFI). |
PDE7B Was Abnormally Expressed in ccRCC
We then asked whether the seven survival-associated hub genes are abnormally expressed in ccRCC samples. We analyzed the expression of these genes by the TCGA data, and it was found that KCNAB1, NKX2-1 and HP were up-regulated in ccRCC, while PDE7B was down-regulated in ccRCC tissues (Figure 7A–D). In addition, we found that the expression of PDE7B was significantly negatively correlated with TNM stage and histologic grade (Figure 7E and F). Together, these results indicated that PDE7B might play a key role in the ccRCC development and progression and is a valuable biomarker for this disease.
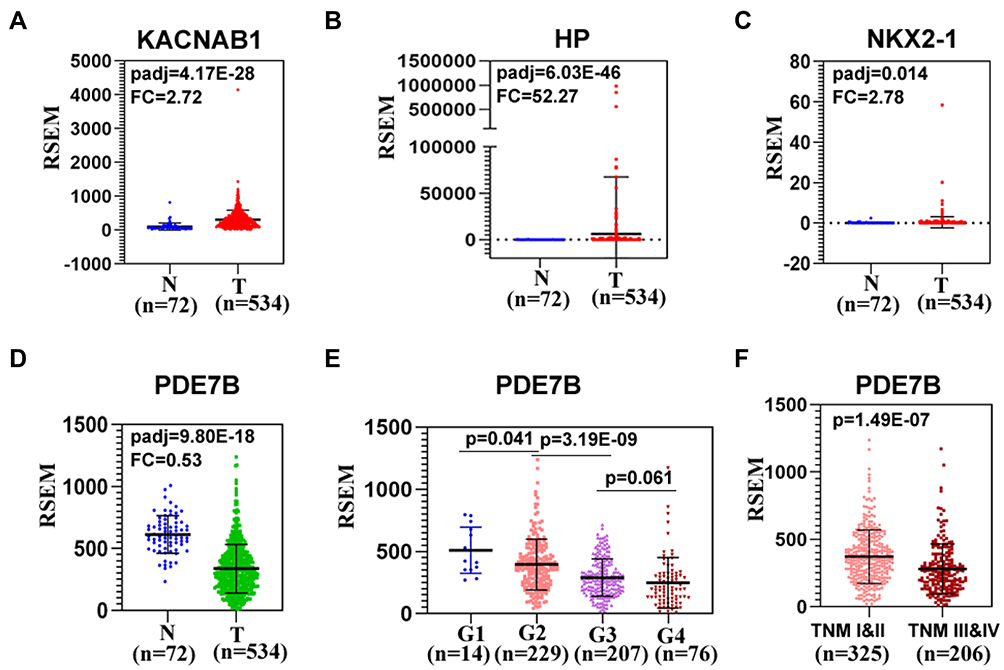 |
Figure 7 The expression of hub genes in ccRCC patients. (A–D) Differential expression of KCNAB1, HP, NKX2-1 and PDE7B between ccRCC and normal tissues was calculated by using the downloaded TPM values. (E) The relationship between PDE7B and histologic grade in ccRCC. (F) PDE7B is lowly expressed in ccRCC patients with advanced TNM stage (III/IV stage). |
PDE7B Affects Multiple Pathways in Renal Cancer Cells
To identify PDE7B-dependent molecular pathways involved in the regulation of ccRCC cells function, gene-set-enrichment analysis (GSEA) was performed to determine whether an a priori-defined set of genes showed significantly different expression in high PDE7B and low PDE7B expression groups. This analysis revealed that the group with low expression of PDE7B showed enrichment for a gene set encoding products associated with cAMP, MYC, EIF4E and RB pathways (Figure 8). Thus, these results indicated that the low expressed of PDE7B facilitated multiple cancer promotion mechanisms.
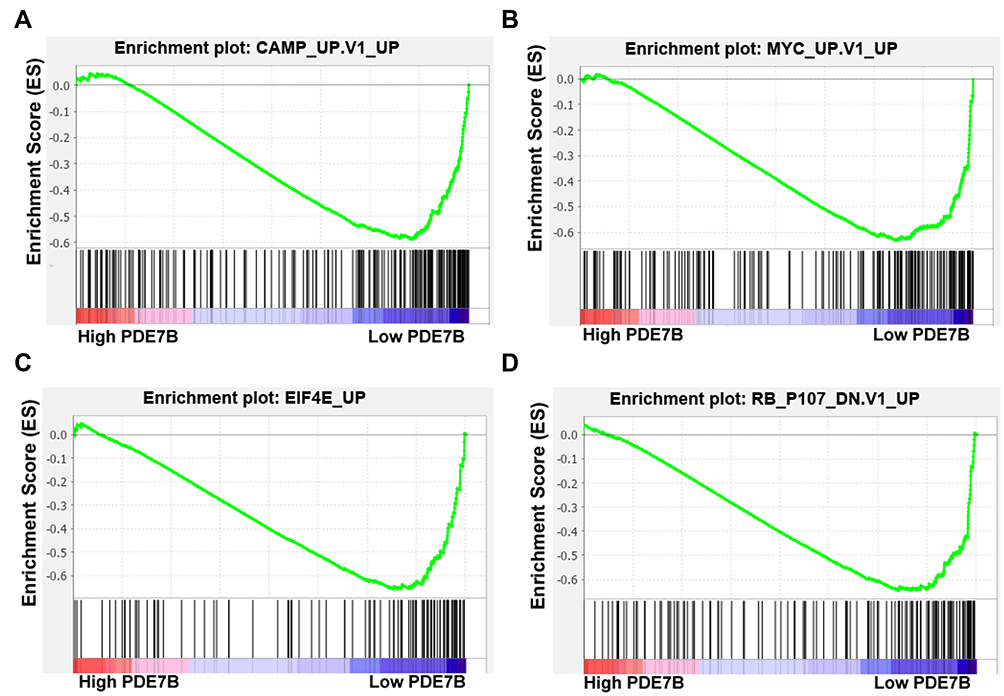 |
Figure 8 Gene Set Enrichment Analysis (GSEA) analysis of different expression genes in ccRCC tissues between high PDE7B group and low PDE7B expression group. (A–D) Enrichment curves showed that low expression of PDE7B showed enrichment for a gene set encoding products associated with cAMP, MYC, EIF4E and RB pathways. |
PDE7B Inhibits Cell Growth and Migration of Renal Cancer Cells
To further investigate the roles of PDE7B in ccRCC, we knockdown PDE7B in ACHN and 786-O cells by lentiviral vector, and examined the effect of PDE7B knockdown on the cell proliferation, migration and invasion. Quantitative PCR analysis showed that the level of PDE7B significantly decreased following infection by lentivirus in ACHN and 786-O cells, respectively (Figure 9A). Next, cell viability and transwell assays were performed. Our data showed that the down-regulation of PDE7B significantly increased cell viability (Figure 9B). Also, we found that PDE7B depletion significantly increased the migration capability of 786-O and ACHN cells (Figure 9C). Together, these findings indicate that PDE7B is a potential candidate tumor suppressor and play an important role in ccRCC metastasis in ccRCC.
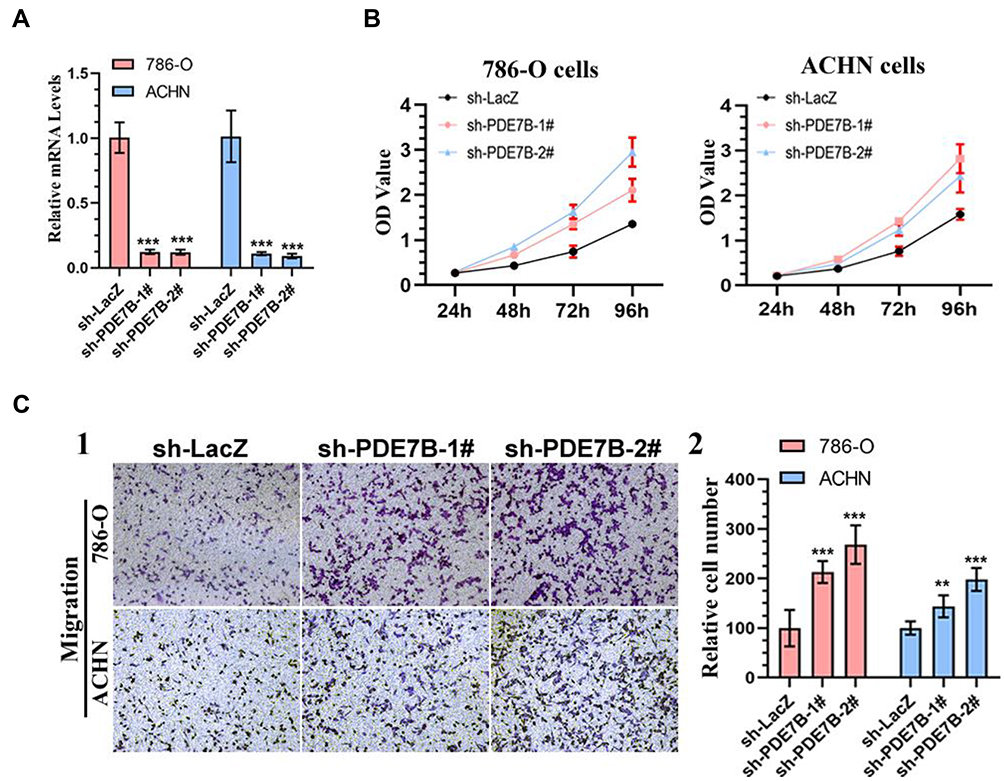 |
Figure 9 Knockdown of PDE7B promotes the cell proliferation and migration of renal cancer cells. (A) Real-time PCR analysis of PDE7B mRNA showed efficient PDE7B knockdown by shRNA expression in 786-O and ACHN cells. ***, statistically significant difference, P < 0.001. (B) The cell viability of 786-O and ACHN cells expressing sh-LacZ or sh-PDE7B was determined by CCK8 assays at indicated time points. Data presented are means±SD from three independent experiments. (C) Migration assay in 786-O and ACHN cells. Representative photographs were taken at ×200 magnification (1). The number of migrated cells was quantified (2). Results are plotted as percent (%) migrating and invading cells relative to sh-LacZ treatment. **statistically significant difference, P < 0.01. ***P < 0.001. |
Discussion
Metastasis is the main cause of treatment failure in various cancer, including ccRCC. Although much progress has been made in metastatic ccRCC treatment, mortality and 5-year survival remain unacceptably poor.2 Thus, it is urgent to explore the molecular mechanisms of ccRCC metastasis and find out more effective drugs. Previous studies in ccRCC mainly focused on the difference between tumor and nontumor tissues, and identified many somatic variants and differentially expressed genes may be potentially effective therapeutic targets.4,18,19 Priestley et al sequenced 2520 pairs of tumor and normal tissue and performed whole-genome analyses of metastatic solid tumors, and found that metastatic tumor genomes showed similar mutational landscape with primary tumors.20 On the other hand, mounting studies have demonstrated that metastatic progression is associated with altered patterns of genes expression.7,8,19,21 The present study downloaded all available gene expression profiles (GSE22541, GSE85258 and GSE105261) from GEO datasets which contain metastases ccRCC tissue and matched primary tumor tissue. We re-analyzed these data and have found that 433 gens in GSE22541 and 317 gene in GSE85258 with statistically significant differences (|log2FC|>1). However, there are only 33 DEGs were identified in GSE105261 using the same cutoff (data not shown).9 Furthermore, many up-regulated genes in the metastases group from GSE22541 and GSE85258 are down-regulated in the metastases group from GSE105261 (data not shown). Thus, we discarded GSE105261 data for further analysis. We evaluated gene expression profiles using GSE22541 and GSE85258, and identified 163 DEGs.
Then, GO and KEGG pathway enrichment analysis was performed to explore the potential biological function of DEGs. We found that DEGs were significantly associated with extracellular matrix organization, response to growth factor, and cell adhesion. Extracellular matrix (ECM) has been suggested to play a vital role in tumor progression and a therapeutic target in cancer.2,22,23 In addition, both growth factor and cell adhesion have a significant role in cell survival and cancer metastasis.24,25 KEGG pathway analysis revealed that the DEGs were aggregated in AGE-RAGE signaling pathway, ECM-receptor interaction and focal adhesion. AGE-RAGE pathway played an important role in bridging inflammation and cancer.26 Thus, it is possible that these enriched pathways play a vital role in regulating ccRCC metastasis.
A network of PPI was further used to reveal the interconnection among the DEGs, and we identified seven hub genes (SFN, NKX2-1, HP, MAPT, EPHA4, KCNAB1, and PDE7B) with prognostic function for patients with ccRCC. Importantly, we found that PDE7B’s expression was negatively correlated with TNM stage and histologic grade in ccRCC. PDE7B is a member of phosphodiesterase (PDE) family, which normally hydrolysis of phosphate groups and decrease intracellular cAMP concentration. cAMP is an important second messenger in cell signaling, and intracellular cAMP regulation is critical for a variety of cellular functions. In addition, it was found that cAMP signaling plays an important role in tumor progression and therapy.27–31 Therefore, it is speculated that PDE7B may play a role in tumorigenesis through regulating the cAMP levels. Indeed, a number of studies have shown that PDE7B is deregulated in various cancers. PDE7B has shown to be up-regulated in chronic lymphocytic leukemia (CLL) and high PDE7B expression acts as a bad prognostic factor for CLL patients.32,33 Also, PDE7B was highly expressed in mantle cell lymphoma (MCL) patients and its high expression might be an unfavorable prognostic indicator in MCL.34 Cao et al also showed that PDE7B is an unfavorable prognostic factor for cytogenetic normal AML (CN-AML).35 In glioblastoma (GBM) model, Brooks et al found that PDE7B overexpression was associated with the expansion of a stem-like cell subpopulation and increased tumor growth and aggressiveness.36 Zhang et al revealed that knockdown of PDE7B inhibited the cell growth and tumor development of triple-negative breast cancer (TNBC) cells, which was mediated by regulating cAMP concentration.37 These results suggest that PDE7B mainly acts as an oncogene and promotes tumor progression in these tumors. Nevertheless, the expression and function of PDE7B in ccRCC remain elusive. In our research, the results proved that the down-regulation of PDE7B was a frequent event in ccRCCs, and this down-regulation increased ccRCC cell viability and migration abilities. These results suggest that PDE7B exerts anti-tumourigenic effects in ccRCC in a cell-type and context-dependent manner. To further explore the potential mechanisms of PDE7B in ccRCC, GSEA was performed and showed that low expression of PDE7B group was mostly associated with cAMP, MYC, EIF4E and RB pathways. It is well known that MYC, EIF4E and RB pathways play key roles in various cancers. Thus, PDE7B may regulate ccRCC metastasis via regulating these pathways. However, further studies are still needed to explore the specific molecular mechanisms of PDE7B in ccRCC.
In summary, we identified seven genes with prognostic value in ccRCC through integrated bioinformatics analysis. Our results suggested that PDE7B was significantly associated with OS, DSS and PFI, which may become a clinically useful biomarker and therapeutic target for ccRCC.
Disclosure
The authors declare that they have no competing interests.
References
1. Linehan WM, Ricketts CJ. The cancer genome atlas of renal cell carcinoma: findings and clinical implications. Nat Rev Urol. 2019;16(9):539–552. doi:10.1038/s41585-019-0211-5
2. Ho TH, Serie DJ, Parasramka M, et al. Differential gene expression profiling of matched primary renal cell carcinoma and metastases reveals upregulation of extracellular matrix genes. Ann Oncol. 2017;28(3):604–610. doi:10.1093/annonc/mdw652
3. Lalani AA, McGregor BA, Albiges L, et al. Systemic treatment of metastatic clear cell renal cell carcinoma in 2018: current paradigms, use of immunotherapy, and future directions. Eur Urol. 2019;75(1):100–110. doi:10.1016/j.eururo.2018.10.010
4. Choueiri TK, Motzer RJ. Systemic Therapy for Metastatic Renal-Cell Carcinoma. N Eng J Med. 2017;376(4):354–366. doi:10.1056/NEJMra1601333
5. Fu Q, Xu L, Wang Y, et al. Tumor-associated macrophage-derived interleukin-23 interlinks kidney cancer glutamine addiction with immune evasion. Eur Urol. 2019;75(5):752–763. doi:10.1016/j.eururo.2018.09.030
6. Yao X, Tan J, Lim KJ, et al. VHL deficiency drives enhancer activation of oncogenes in clear cell renal cell carcinoma. Cancer Discov. 2017;7(11):1284–1305. doi:10.1158/2159-8290.CD-17-0375
7. Rodrigues P, Patel SA, Harewood L, et al. NF-kappaB-Dependent Lymphoid Enhancer Co-option Promotes Renal Carcinoma Metastasis. Cancer Discov. 2018;8(7):850–865. doi:10.1158/2159-8290.CD-17-1211
8. Vanharanta S, Shu W, Brenet F, et al. Epigenetic expansion of VHL-HIF signal output drives multiorgan metastasis in renal cancer. Nat Med. 2013;19(1):50–56. doi:10.1038/nm.3029
9. Nam H-Y, Chandrashekar DS, Kundu A, et al. Integrative epigenetic and gene expression analysis of renal tumor progression to metastasis. Mol Cancer Res. 2019;17(1):84–96. doi:10.1158/1541-7786.MCR-17-0636
10. Wuttig D, Zastrow S, Füssel S, et al. CD31, EDNRB and TSPAN7 are promising prognostic markers in clear-cell renal cell carcinoma revealed by genome-wide expression analyses of primary tumors and metastases. Int J Cancer. 2012;131(5):E693–E704. doi:10.1002/ijc.27419
11. Liu J, Lichtenberg T, Hoadley KA, et al. An Integrated TCGA pan-cancer clinical data resource to drive high-quality survival outcome analytics. Cell. 2018;173(2):400–416.e11. doi:10.1016/j.cell.2018.02.052
12. Davis S, Meltzer PS. GEOquery: a bridge between the Gene Expression Omnibus (GEO) and BioConductor. Bioinformatics. 2007;23(14):1846–1847. doi:10.1093/bioinformatics/btm254
13. Ritchie ME, Phipson B, Wu D, et al. Limma powers differential expression analyses for RNA-sequencing and microarray studies. Nucleic Acids Res. 2015;43(7):e47. doi:10.1093/nar/gkv007
14. Reimand J, Isserlin R, Voisin V, et al. Pathway enrichment analysis and visualization of omics data using g: profiler, GSEA, Cytoscape and EnrichmentMap. Nat Protoc. 2019;14(2):482–517. doi:10.1038/s41596-018-0103-9
15. Zhou G, Soufan O, Ewald J, et al. NetworkAnalyst 3.0: a visual analytics platform for comprehensive gene expression profiling and meta-analysis. Nucleic Acids Res. 2019;47(W1(W1):W234–W241. doi:10.1093/nar/gkz240
16. Love MI, Huber W, Anders S. Moderated estimation of fold change and dispersion for RNA-seq data with DESeq2. Genome Biol. 2014;15(12):550. doi:10.1186/s13059-014-0550-8
17. Chen K, Xiao H, Zeng J, et al. Alternative Splicing of EZH2 pre-mRNA by SF3B3 contributes to the tumorigenic potential of renal cancer. Clin Cancer Res. 2017;23(13):3428–3441. doi:10.1158/1078-0432.CCR-16-2020
18. Hsieh JJ, Le VH, Oyama T, et al. Chromosome 3p Loss-Orchestrated VHL, HIF, and epigenetic deregulation in clear cell renal cell carcinoma. J Clin Oncol. 2018;36:Jco2018792549.
19. Lalani A-KA, Albiges L, Gray KP, et al. Differential expression of c-Met between primary and metastatic sites in clear-cell renal cell carcinoma (ccRCC) and its association with PD-L1 expression. J Clin Oncol. 2017;35(15_suppl):4573. doi:10.1200/JCO.2017.35.15_suppl.4573
20. Priestley P, Baber J, Lolkema MP, et al. Pan-cancer whole-genome analyses of metastatic solid tumours. Nature. 2019;575(7781):210–216. doi:10.1038/s41586-019-1689-y
21. Lambert AW, Pattabiraman DR, Weinberg RA. Emerging Biological Principles of Metastasis. Cell. 2017;168(4):670–691. doi:10.1016/j.cell.2016.11.037
22. Pickup MW, Mouw JK, Weaver VM. The extracellular matrix modulates the hallmarks of cancer. EMBO Rep. 2014;15(12):1243–1253. doi:10.15252/embr.201439246
23. Lu P, Weaver VM, Werb Z. The extracellular matrix: a dynamic niche in cancer progression. J Cell Biol. 2012;196(4):395–406. doi:10.1083/jcb.201102147
24. Padmanaban V, Krol I, Suhail Y, et al. E-cadherin is required for metastasis in multiple models of breast cancer. Nature. 2019;573(7774):439–444. doi:10.1038/s41586-019-1526-3
25. Lowery FJ, Yu D. Growth factor signaling in metastasis: current understanding and future opportunities. Cancer Metastasis Rev. 2012;31(3):479–491. doi:10.1007/s10555-012-9380-x
26. Riehl A, Németh J, Angel P, et al. The receptor RAGE: bridging inflammation and cancer. Cell Commun Signaling. 2009;7(1):12. doi:10.1186/1478-811X-7-12
27. Zou T, Liu J, She L, et al. A perspective profile of ADCY1 in cAMP signaling with drug-resistance in lung cancer. J Cancer. 2019;10(27):6848–6857. doi:10.7150/jca.36614
28. Löffler I, Grün M, Böhmer FD, et al. Role of cAMP in the promotion of colorectal cancer cell growth by Prostaglandin E2. BMC Cancer. 2008;8(1):380. doi:10.1186/1471-2407-8-380
29. Park J-Y, Juhnn Y-S. cAMP signaling increases histone deacetylase 8 expression via the Epac2–Rap1A–Akt pathway in H1299 lung cancer cells. Exp Mol Med. 2017;49(2):e297–e297. doi:10.1038/emm.2016.152
30. Vitale G, Dicitore A, Mari D, et al. A new therapeutic strategy against cancer: cAMP elevating drugs and leptin. Cancer Biol Ther. 2009;8(12):1191–1193. doi:10.4161/cbt.8.12.8937
31. Zimmerman NP, Roy I, Hauser AD, et al. Cyclic AMP regulates the migration and invasion potential of human pancreatic cancer cells. Mol Carcinog. 2015;54(3):203–215. doi:10.1002/mc.22091
32. Zhang L, Murray F, Zahno A, et al. Cyclic nucleotide phosphodiesterase profiling reveals increased expression of phosphodiesterase 7B in chronic lymphocytic leukemia. Proc Natl Acad Sci U S A. 2008;105(49):19532–19537. doi:10.1073/pnas.0806152105
33. Zhang L, Murray F, Rassenti LZ, et al. Cyclic nucleotide phosphodiesterase 7B mRNA: an unfavorable characteristic in chronic lymphocytic leukemia. Int J Cancer. 2011;129(5):1162–1169. doi:10.1002/ijc.25785
34. Fang C, Dong H-J, Zou Z-J, et al. High expression of cyclic nucleotide phosphodiesterase 7B mRNA predicts poor prognosis in mantle cell lymphoma. Leuk Res. 2013;37(5):536–540. doi:10.1016/j.leukres.2013.02.006
35. Cao L, Zhang W, Liu X, et al. The Prognostic Significance of PDE7B in cytogenetically normal acute myeloid leukemia. Sci Rep. 2019;9(1):16991. doi:10.1038/s41598-019-53563-x
36. Brooks MD, Jackson E, Warrington NM, et al. PDE7B is a novel, prognostically significant mediator of glioblastoma growth whose expression is regulated by endothelial cells. PLoS One. 2014;9(9):e107397. doi:10.1371/journal.pone.0107397
37. Zhang DD, Li Y, Xu Y, et al. Phosphodiesterase 7B/microRNA-200c relationship regulates triple-negative breast cancer cell growth. Oncogene. 2019;38(7):1106–1120. doi:10.1038/s41388-018-0499-2
 © 2020 The Author(s). This work is published and licensed by Dove Medical Press Limited. The full terms of this license are available at https://www.dovepress.com/terms.php and incorporate the Creative Commons Attribution - Non Commercial (unported, v3.0) License.
By accessing the work you hereby accept the Terms. Non-commercial uses of the work are permitted without any further permission from Dove Medical Press Limited, provided the work is properly attributed. For permission for commercial use of this work, please see paragraphs 4.2 and 5 of our Terms.
© 2020 The Author(s). This work is published and licensed by Dove Medical Press Limited. The full terms of this license are available at https://www.dovepress.com/terms.php and incorporate the Creative Commons Attribution - Non Commercial (unported, v3.0) License.
By accessing the work you hereby accept the Terms. Non-commercial uses of the work are permitted without any further permission from Dove Medical Press Limited, provided the work is properly attributed. For permission for commercial use of this work, please see paragraphs 4.2 and 5 of our Terms.