")
Back to Journals » OncoTargets and Therapy » Volume 13
Identification of Pannexin 2 as a Novel Marker Correlating with Ferroptosis and Malignant Phenotypes of Prostate Cancer Cells
Authors Liao D, Yang G, Yang Y, Tang X, Huang H, Shao J, Pan Q
Received 14 February 2020
Accepted for publication 26 April 2020
Published 19 May 2020 Volume 2020:13 Pages 4411—4421
DOI https://doi.org/10.2147/OTT.S249752
Checked for plagiarism Yes
Review by Single anonymous peer review
Peer reviewer comments 2
Editor who approved publication: Dr Leo Jen-Liang Su
Duwu Liao,1,* Guang Yang,2,* Yuan Yang,3,* Xueyong Tang,4,* Haixia Huang,5 Jichun Shao,1 Qi Pan4
1Department of Urology Surgery, The Second Affiliated Hospital of Chengdu Medical College, China National Nuclear Corporation 416 Hospital, Chengdu, Sichuan, People’s Republic of China; 2Department of Urology Surgery, The First Affiliated Hospital of Chongqing Medical University, Chongqing, People’s Republic of China; 3Department of Neurosurgery, West China Hospital, Sichuan University, Chengdu, People’s Republic of China; 4Department of Dermatology, Chongqing Traditional Chinese Medicine Hospital, Chongqing, People’s Republic of China; 5Department of Critical Care Medicine, Children’s Hospital of Chongqing Medical University, Ministry of Education Key Laboratory of Child Development and Disorders, China International Science and Technology Cooperation Base of Child Development and Critical Disorders, Chongqing, People’s Republic of China
*These authors contributed equally to this work
Correspondence: Jichun Shao
Department of Urology Surgery, The Second Affiliated Hospital of Chengdu Medical College, China National Nuclear Corporation, 416 Hospital, 4# Second Ring Road, North Fourth Section, Chengdu, Sichuan 610057, People’s Republic of China
Email [email protected]
Qi Pan
Department of Dermatology, Chongqing Traditional Chinese Medicine Hospital, 40# Daomenkou, Yuzhong District, Chongqing 400011, People’s Republic of China
Email [email protected]
Purpose: Prostate cancer (PCa) is a widespread urinary neoplasm and one of the most prevalent and second most frequent malignancies diagnosed in males worldwide. This study aimed to identify a candidate marker and explore its molecular mechanism in PCa.
Methods: Gene expression datasets, GSE55945 (n=21) and GSE46602 (n=50), were downloaded from the Gene Expression Omnibus database. Bioinformatic approaches were applied to identify potential markers. Effects of the candidate marker on proliferation, migration, invasion, and ferroptosis (ferrous iron and malondialdehyde (MDA)) in PCa cells and its mechanism were assessed after performing cell transfection.
Results: A total of 1435 common differentially expressed genes were identified in GSE55945 and GSE46602. Five key gene modules were listed based on a protein–protein interaction network, containing five hub genes. Pannexin 2 (PANX2), a candidate marker was identified, and findings revealed substantial upregulation of its expression levels in PCa cell lines. Blocking expression of PANX2 resulted in suppression of proliferation, migration, and invasion in PCa cells, while increasing ferrous iron and MDA levels. However, these effects were rescued by Nrf2 activator, oltipraz. The Nrf2 signaling pathway was consequently applied to determine underlying mechanism of PANX2 in PCa cells. We established that silencing PANX2 remarkably reduced protein expression levels in members of Nrf2 signaling pathway (Nrf2, HO-1, and FTH1).
Conclusion: Our study demonstrated that PANX2 is implicated in the pathogenesis of PCa, which regulates malignant phenotypes and ferroptosis through Nrf2 signaling pathway, and maybe a potential therapeutic target for PCa.
Keywords: prostate cancer, ferroptosis, PANX2 and Nrf2 signaling pathways
Introduction
Prostate cancer (PCa) is a highly prevalent non-cutaneous malignancy among males during adulthood. PCa is the second leading cause of cancer-related deaths in males across western countries.1 PCa incidence in developed nations in the west has gradually stabilized and subsequently declined over time. PCa incidence in developing countries including China has exhibited a steady growth.2 Overdiagnosis and overtreatment are emerging problems in PCa therapy due to lack of biomarkers for detecting PCa at early stages. Therefore, identification of more precise markers is critical for improving diagnosis and treatment of PCa.3
Microarray technology has made a considerable progress in transcriptomics, providing a more comprehensive and precise view of the transcription pattern of tumors. Application of bioinformatics to microarray expression profile may enhance the optimization of potential specific markers. For example, proteins in pannexin family that are linked to the progression of human cancers have been identified.4,5 The expression level of PANX2, a member of pannexin family is associated with poor survival in renal cell carcinoma (RCC) and promoted proliferation of RCC cells, suggesting that PANX2 may be a valuable biomarker for prognosis in RCC.6 However, few studies have addressed the clinical value and latent mechanism of PANX2 in PCa.
Ferroptosis is an iron-dependent form of cell death, a feature which differentiates it from apoptosis, autophagy, and necrosis.7 Ferroptosis causes accumulation of ferric iron and lipid peroxidation. Induction of ferroptosis facilitates selective elimination of multiple tumor cells and represents an emerging strategy.8,9 Several regulators of ferroptosis have recently been identified in certain cancer cells. For example, Nrf2 is a key gene of oxidative stress response which prevents ferroptosis.10 Glutathione peroxidase-4 (GPX4), a unique member of selenium-dependent glutathione peroxidases in mammals, has been proven to perform a pivotal role in suppression of lipid ROS production during ferroptotic cell death.11 However, potential regulatory mechanism of ferroptosis remains indeterminate.
Our present research revealed that PANX2 as a potential marker can regulate proliferation, migration, invasion, and ferroptosis in PCa cells via Nrf2 signaling pathway. Overall, combining bioinformatics and in vitro analysis is more effective than the application of bioinformatics only, and this may contribute to advancements in diagnosis and treatment of PCa.
Materials and Methods
Acquisition of PCa Microarray Expression Profile
To identify a comprehensive set of differentially expressed genes (DEGs) between patients with PCa and normal control (NC) patient, two microarray expression profiles in GSE55945 (n=21)12 and GSE46602 (n=50)13 based on GPL570 platform were obtained from the Gene Expression Omnibus (GEO, https://www.ncbi.nlm.nih.gov/geo).
Identification of DEGs
After powerful multi-chip average background correction, microarray matrix file was performed quantile normalization and calculation of expression using affymetrix software package to acquire gene expression profile. A linear model and Bayesian statistics were employed using the Limma software package. DEGs in PCa samples were identified. P <0.05 and | Log2 (fold change) |> 0.7 were the initial criteria for screening.
Enrichment Analyses
GO analysis has been developed as a commonly used approach to annotate genes together with gene products and to identify featured biological properties of high-throughput genomic or transcriptomic profiles.14 Kyoto Encyclopedia of Genes and Genomes (KEGG, http://www.genome.jp) is a knowledge base used to systematically analyze gene functions, and it can link genomic data with higher order functional data.15 Mapping a user gene into related biological annotations based on the DAVID database (https://david.ncifcrf.gov/) is key to successful high-throughput functional analyses of genes.16 The DAVID online approach was employed for GO and KEGG pathway enrichment analyses to examine the functions of DEGs. P value of less than 0.05 (P<0.05) was considered statistically significant.
Protein–Protein Interaction (PPI) Network Analysis
High-quality INTeractomes (HINT)17 was applied to acquire co-complex and binary human protein interactome networks with high quality. The eventual network used for the present work integrated a co-complex with binary networks consisting of 42,604 interactions out of 9985 proteins. The PPI database covered 1740 interactions among 1440 genes following the removal of self-loops.
ClusterOne18 is able to identify overlapping functional modules according to the topological features of protein interactome network. DEGs were mapped onto the HINT database to assess interactions across various DEGs. Cytoscape was subsequently used to construct PPI networks. In addition, ClusterOne in Cytoscape was used to screen PPI network modules. We screened ClusterOne for parameters related to size (‘s’) and minimal cluster density (“d”). Default parameters were set at p<0.001, minimum size=10, and minimum density=0.05.
Cell Cultures and Cell Transfections
PCa cell lines (including LNCap, PC-3, and DU145), together with immortalized non-tumorigenic human prostate epithelial cells (RWPE1), were provided by the Cell Bank of the Chinese Academy of Sciences. Cells were cultured in Roswell Park Memorial Institute-1640 medium (RPMI-1640; Gibco, Grand Island, NY, USA) supplemented with 1% penicillin-streptomycin and 10% fetal bovine serum (FBS; Gibco, Grand Island, NY, USA). Incubation was subsequently performed under conditions of 5% CO2 and a temperature of 37°C.
A corresponding negative control (NC) siRNAs and three PANX2-siRNAs were obtained from GenePharma (Shanghai, China) and used for silencing expression of PANX2. Sequences for the siRNAs are shown below: si-PANX2 1# (sense: 5ʹ-AGAAGGCCAAGACTGAGGCA-3ʹ, antisense: 5ʹ-GGAGCATCTTTGGTGGGTGC-3ʹ); si-PANX2 2# (sense: 5ʹ-CCAAGAACTTCGCAGAGGAAC-3ʹ, antisense: 5ʹ-GGGCAGGAACTTGTGCTCA-3ʹ); si-PANX2 3# (sense: 5ʹ-GAGAAAAAGCATACCCGCCAC-3ʹ, antisense: 5ʹ-GGGTGAGCAGACATGGAATGA-3ʹ). The siRNA sequence for negative control siRNA was not disclosed by the manufacturer. Cells (1×10⁵ cells/well) were initially inoculated into 6-well plates until they attained 70–80% cell confluence for transient transfection. Lipofectamine 2000 (Invitrogen, USA) was subsequently used to transfect cells with siRNA or NC to an eventual content of 100 nM as per the manufacturer’s instructions. Cells were collected 48 h after transfection to analyze the expression levels of targets.
Analysis of mRNA Expression
The RNAiso Plus (Takara, Dalian, China) was used to extract total cellular RNA according to the manufacturer’s instructions. cDNA was then synthesized through reverse transcription of RNA using PrimeScript RT reagent Kit with gDNA Eraser (Takara, Dalian, China) according to the manufacturer’s directions. We used SYBR Premix Ex Taq II (Takara) for real-time PCR assays, with β-actin as the internal reference.
Cell Proliferation
We used a cell counting Kit-8 (CCK8, Dojindo, Japan) to analyze cell proliferation as per the manufacturer’s instructions. Cells (4×10³ cells/well) were inoculated in 96-well plates. CCK-8 reagent was then put into all well plates following 0, 24, 48, and 72 h of culture, to incubate in dark for 1.5 h. Absorbance was subsequently measured at a wavelength of 450 nm to count viable cells.
Wound-Healing Assay
A typical wound-healing assay was conducted in vitro to evaluate the migratory capacity of treated and non-treated PC3 cells. Cells were inoculated into 6-well plates until they attained 100% cell confluence. A sterile pipette tip was used to scratch surfaces of cells. Cells were subsequently washed with PBS three times to remove detached cells, and then cultured in a serum-free medium for 24 h under identical conditions. Images of interest were obtained at 0 h and after 24 h, respectively.
Transwell Migration and Invasion Assay
Migration and invasion capacities of PC3 cells were examined using transwell assays. Treated and non-treated PC3 cells were prepared into a suspension in a serum-free medium. To test the migration capacity of cells, 100 µL of the prepared cell suspension was loaded in the upper chamber, and 600 µL of medium with 10% FBS added to the lower chamber. The upper chamber was covered with Matrigel (BD Biosciences) before seeding the cells to test the invasion capacity of the cells. Cells (4×10⁴) were then inoculated in the upper chamber, fixed with 4% paraformaldehyde for 15 min and removed from the chamber after 24 h. We subsequently stained treated cells with 0.1% crystal violet for 10 min. Cells in the inner layer were selected with caution, 3 fields of view for each sample randomly screened and penetrating cells counted.
Iron Assay
The relative ferric iron level in the cell lysate was evaluated using an iron assay kit (No. DIFE-250; BioAssay Systems, USA) according to the manufacturer’s instructions.
Lipid Peroxidation Assay
A lipid peroxidation detection kit (No. A003-1-2; Nanjing Jiancheng College of Biotechnology, China) was used to evaluate relative malondialdehyde (MDA) concentration in cell lysate according to the manufacturer’s instructions.
Western Blot
Total cellular protein was isolated, and the concentration determined using bicinchoninic acid (BCA) protein determination kit (Beyotime, Shanghai, China). Proteins were then separated using 8% sodium dodecyl sulfate-polyacrylamide gel electrophoresis (SDS-PAGE), followed by transfer to the polyvinylidene fluoride (PVDF) membranes. Membranes were subsequently blocked with 5% skimmed milk and incubated using primary antibodies overnight at a temperature of 4°C. Membranes were then washed with TBST three times and incubated for 1 h using secondary antibody under ambient temperature. Membranes were rinsed three times in TBST and exposed using enhanced chemiluminescence (ECL) solution (Wanleibio, Shenyang, China) under dark conditions.
Statistical Analysis
Data were expressed as mean ± standard deviation (SD). GraphPad Prism analysis software was used for statistical analysis. Differences between 2 groups were assessed using one-way analysis of variance (ANOVA) and t-test. Statistical significance indicated that * represents p<0.05; **represents p<0.01; #represents p<0.05; ##represents p<0.01.
Results
Identification of DEGs
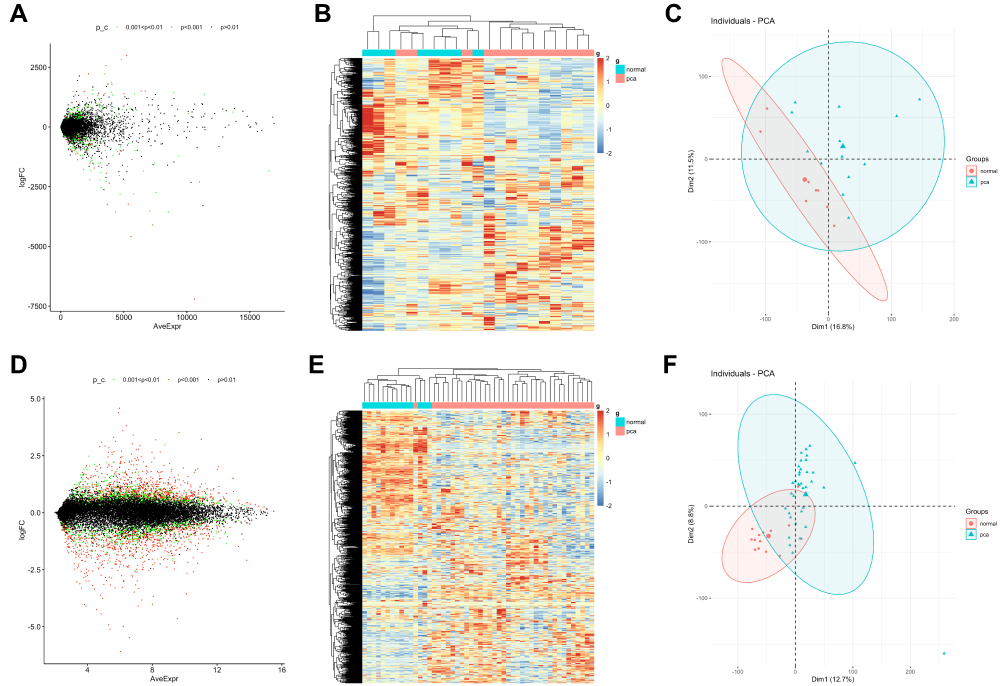
Differentially expressed genes (DEGs) on profiles obtained from GSE55945 (n=21) and GSE46602 (n=50) datasets were analyzed using Limma R package (Table 1). Based on the parameters set with a p value of <0.05 and | Log2 (fold change) |> 0.7, 3392 DEGs were identified in 13 PCa and 8 normal samples in the GSE55945 dataset, with 1437 up-regulated genes and 1955 down-regulated genes (Figure 1A and B). A total of 3867 DEGs were identified in 36 PCa and 14 normal samples in the GSE46602 dataset, with 2450 up-regulated genes and 1417 down-regulated genes (Figure 1C and D). Principal component analysis (PCA) revealed that PCa and normal samples were completely separated by DEGs in the GSE55945 dataset (Figure 1E). This implied that expression patterns of the DEGs were a unique characteristic which can be used to distinguish between PCa and normal samples. PCA also displayed similar results in the GSE46602 dataset (Figure 1F).
 |
Table 1 The Acquisition of PCa Microarray Expression Profiles |

Enrichment Analysis of DEGs
We selected 1435 DEGs that were common between GSE55945 and GSE46602 datasets for further analysis (Figure 2A). The “clusterProfiler” R package was used for gene functional enrichment analysis to enhance our understanding of the function of the 1435 common DEGs. DEGs were enriched in biological processes (BP), such as ‘ribosome biogenesis’, “rRNA metabolic process”, and “ribosomal large subunit biogenesis” to analyze GO. GO cellular component (CC) terms indicated that DEGs were enriched in “ribosome”, “ribosomal subunit”, and “mitochondrial matrix”. In addition, molecular function terms of GO demonstrated that DEGs were enriched in “catalytic activity”, “structural constituent of ribosome”, and “ligase activity” (Figure 2B). Ten most significant pathways of KEGG were listed, such as “ribosome”, “Hippo signaling pathway”, and “oxidative stress” (Figure 2C). Network interactions in diverse signaling pathways were established using “clusterProfiler” R package. Oxidative stress associated with hippo signaling pathway, drug metabolism, glutathione metabolism, and platinum drug resistance exhibited an interactional relationship (Figure 2D). In addition, we established that PANX2 was enriched to oxidative stress; 21 genes (ie, FGF1, PARD6G, and CCND2) were enriched to hippo signaling pathway (Figure 2E).
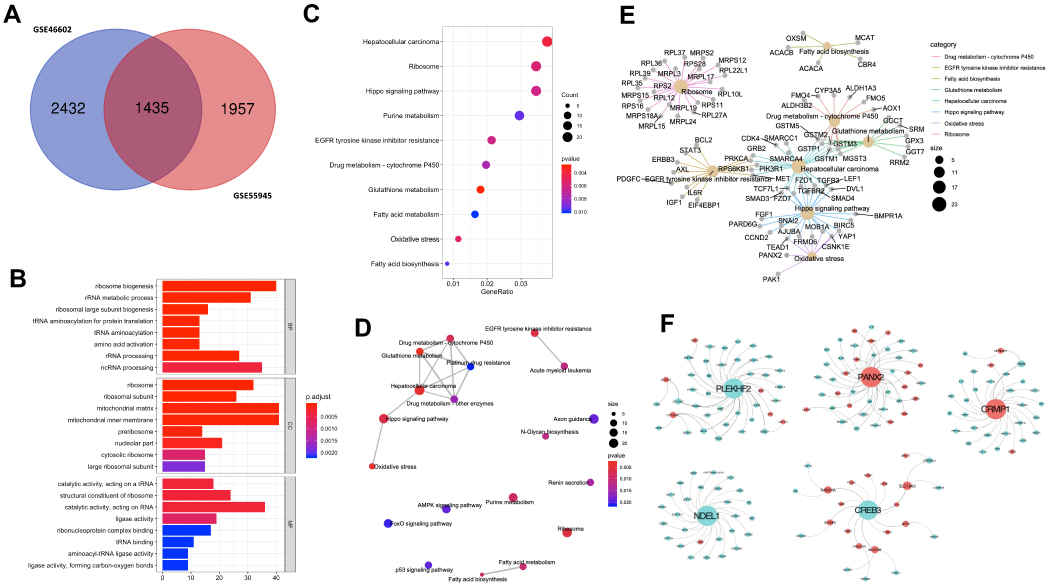 |
Figure 2 Functional enrichment of common DEGs between two GEO microarray expression profiles. (A) Shows the intersection of GSE55945 and GSE46602. (B) Significant GO enrichment results are exhibited. (C) Significantly changed pathways are displayed. (D) Significantly changed pathways are connected to display their interactions. In this network, the circle size is directly proportional to the weighted degree of connectivity. (E) The association between significantly changed pathways and DEGs. Circle size represents the number of connections between gene and pathway. (F) Five most significant modules obtained from the PPI network. Red nodes denote up-regulated genes, and green nodes indicate down-regulated genes. Size of the node is directly proportional to the weighted degree of connectivity. |
Module Screening from the PPI Network
We built a protein–protein interaction (PPI) network based on the 1435 DEGs using ClusterOne to mine core genes from multiple strategies.18 Our screening exhibited five key gene modules (Figure 2F) from which five hub genes were identified including PLEKHF2, PANX2, CRMP1, NDEL1, and CREB3. Moreover, PANX2 exhibited the most significant differential expression between PCa and normal samples. PPI model analysis revealed that PANX2 may have a crucial function in protein interaction. Therefore, PANX2 was selected for subsequent experiment validation.
Validation of Candidate Gene in PCa Cell Lines
PANX2 was inquired in GSE55945 (n=21), GSE46602 (n=50) and TCGA PCa RNA-Seq dataset (n=549) to further test its expression in PCa cell lines. Our results displayed significantly high expression levels of PANX2 (p=4.2E-02, 1.8E-02, and 7.3E-11, respectively) (Figure 3A–C). Moreover, correlation analysis between the expression of PANX2 and diverse PCa Gleason scores in TCGA dataset (n=496) was performed. Analysis revealed that the differential expression of PANX2 was considerably correlated with Gleason score (p<0.0001) (Figure 3D). Total RNAs and proteins were subsequently extracted from AR-positive LNCaP, AR-negative Du145, and PC3 cell lines for qRT-PCR and Western blotting. Expression of PANX2 was substantially up-regulated across PC3, DU145, and LNCaP cell lines, relative to the non-tumorigenic immortal human prostate epithelial cells (RWPE1) (Figure 3E and F). Our results indicated that PANX2 may play an essential role in the progression of PCa. PANX2 was highly expressed in PC3 cells based on Western blotting and qRT-PCR assays. Consequently, PC3 cells were adopted for subsequent cell analysis.
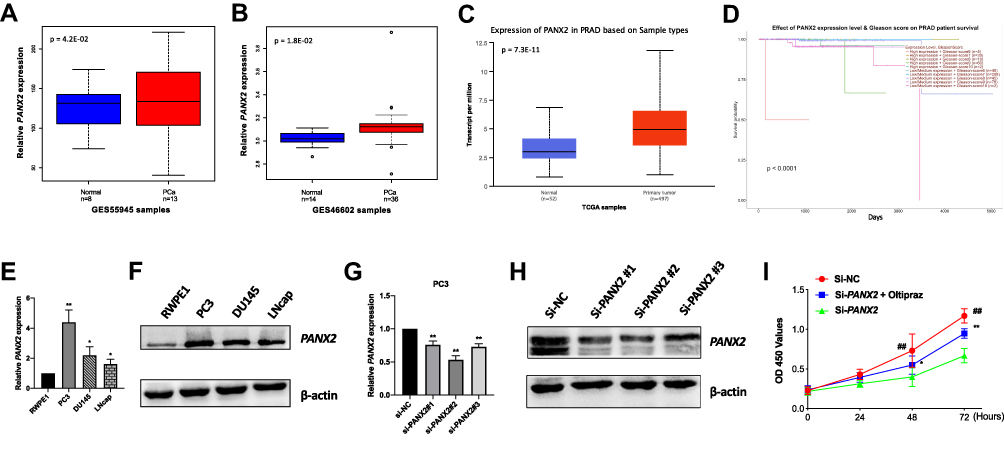 |
Figure 3 Validation of PANX2 expression in public datasets and cell lines. (A–C) PANX2 expression levels are displayed in GSE55945 (n=21), GSE46602 (n=50) and TCGA PCa data (n=549). (D) Differentially expressed PANX2 is associated with PCa Gleason score (p<0.0001). (E, F) Expression levels of PANX2 in several PCa cell lines by qRT-PCR and Western blot. (G, H) The effect of interfering with expression of PANX2 at mRNA and protein levels in PC3 cell lines. (I) The CCK-8 assay carried out to evaluate cell proliferation viability after interference with expression of PANX2. (*represents Si-PANX2 vs Si-PANX2+oltipraz, **p<0.01; ##p<0.01). |
Blocking Expression of PANX2 Inhibits Malignant Phenotypes of PCa Cells
To elucidate the biological function of PANX2 in the progression of PCa, PC3 cells were infected with lentivirus-mediated PANX2 shRNAs. Three different shRNAs were designed to target different loci on PANX2 exons PANX2 (shRNA #1, #2, #3). The mRNA levels of PANX2 in PC3 cells infected with sh-PANX2#1, sh-PANX2#2, and sh-PANX2#3 were significantly lower in sh-NC group than in the control group, indicating that PANX2 had been successfully knocked down (Figure 3G and H). sh-PANX2 with the highest efficiency was selected for subsequent experiments. Proliferation of PC3 cells was considerably lower in PANX2-shRNA group than in the NC-siRNA group (Figure 3I). Additionally, cells in which PANX2 was knocked down exhibited lower migration and invasion capacities than cells in the NC-siRNA group (Figure 4). Our results confirmed that PANX2 is required for metastatic and invasive abilities of PCa cells.
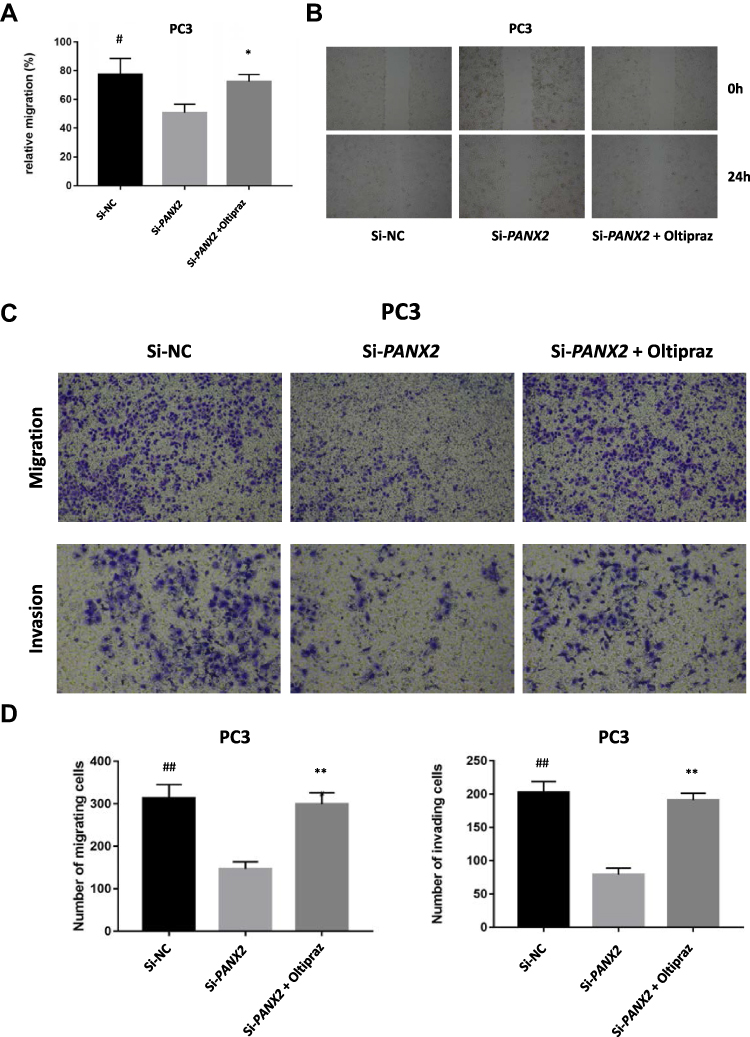 |
Figure 4 The influence on malignant phenotypes of PCa cells under altered expressions of PANX2. (A, B) Measurement of wound healing capacity. Cells under different treatments migrating to wound regions are examined and photos taken. (C, D) Transwell migration and invasion assay. An evaluation of invasive and migratory abilities of PC3 cells under different treatments. (*represents Si-PANX2 vs Si-PANX2+oltipraz, **p<0.01, *p<0.05; #represents Si-NC vs Si-PANX2, ##p<0.01, #p<0.05). |
PANX2 Silencing Promotes Ferroptosis in PCa Cells
We evaluated related indicators of ferroptosis including iron and lipid peroxidation accumulation after interfering with expression of PANX2 to determine whether PANX2 was associated with ferroptosis in PCa cells. We investigated the effect of PANX2 on the changes in levels of Fe2+ because ferrous iron (Fe2+) is a necessary element for the initiation of ferroptosis. Knocking down PANX2 increased levels of intracellular Fe2+ (Figure 5A). In addition, MDA is a representative end-product of lipid peroxidation, and we tested whether PANX2 regulated accumulation of MDA in PCa cells. Inhibition of PANX2 increased accumulation of MDA in PC3 cell lines (Figure 5B). Our findings suggest that PANX2 is a regulator of ferroptosis, and it modulates intracellular Fe2+ and MDA in PCa cells.
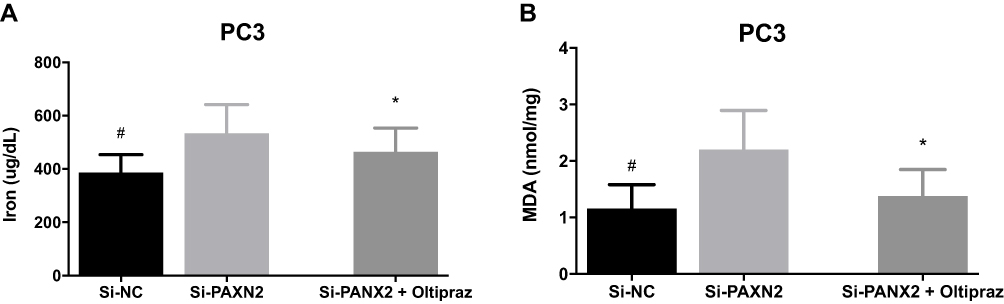 |
Figure 5 The influence on ferroptosis of PCa cells under altered expression of PANX2. (A, B) Detection of ferrous iron and MDA levels after PCa cells are transfected with si-PANX2. (*represents Si-PANX2 vs Si-PANX2+oltipraz, *p<0.05; #represents Si-NC vs Si-PANX2, #p<0.05). |
PANX2 Silencing Inhibited Nrf2 Signaling Pathway
We focused on functional enrichment results of PANX2 to establish the potential mechanism of PANX2 in the progression of PCa. PANX2 was associated with oxidative stress (Figure 6A). Nrf2 pathway plays a crucial role in oxidative stress, especially the Nrf2 gene. We also established that knocking down PANX2 can substantially reduce Nrf2 mRNA and protein expressions, and the downstream gene expressions (HO-1 and FTH1) (Figure 6B and C). Furthermore, different concentrations of Nrf2 activator, oltipraz were screened to determine whether activation of Nrf2 pathway contributed to changes in inhibitory effects of knocking down PANX2 on PCa cells (Figure 6D and E). We subsequently used 50 µM of oltipraz to treat PC3 cell lines after knocking down PANX2. Co-incubation with oltipraz resulted in complete reversal of the inhibitory effects of proliferation, metastasis, invasion, and ferroptosis after knocking down PANX2 (Figures 3H, 4 and 5). Expression levels of the members of Nrf2 pathway were also elevated (Nrf2, HO-1, and FTH1) (Figure 6C). This indirectly proves that PANX2 regulates the biological behavior and ferroptosis of PCa cells via the Nrf2 pathway.
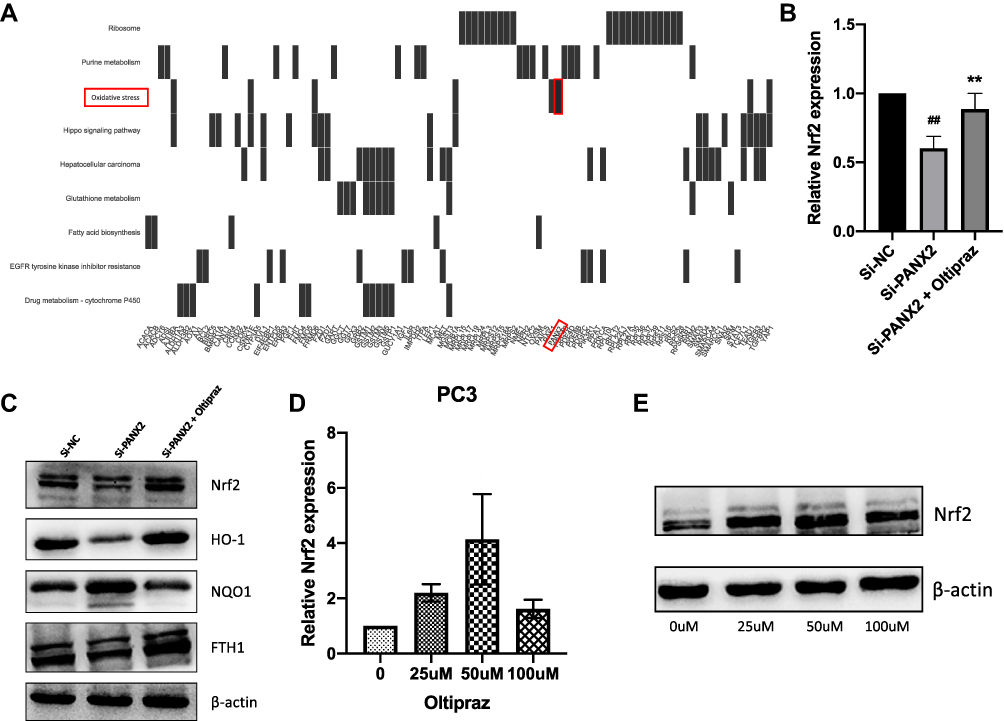 |
Figure 6 Analysis of Nrf2 signaling pathway. (A) A heatmap indicating the relationship between relevant pathways and corresponding DEGs. (B) Detection of expression levels of Nrf2 in PC3 cell lines transfected with si-PANX2 or si-NC using qRT-PCR. (C) Western blotting image analysis indicating reduction in expression levels of Nrf2 and its downstream members (HO-1 and FTH1) after silencing PANX2. (D, E) Selection of optimal concentrations of oltipraz. (##p<0.01; **p<0.01). |
Discussion
Data used in the current work were obtained from GSE55945 and GSE46602 datasets, whereby a total of 1435 common DEGs between the two datasets were systematically analyzed using bioinformatics. PANX2, a novel candidate gene was screened to reveal its essential roles in PCa cell proliferation, migration, invasion, ferroptosis, and potential mechanism involved. To our knowledge, this study provides significant evidence that PANX2 can regulate ferroptosis in PCa cells via the Nrf2 signaling pathway.
Several studies have proven that proteins belonging to pannexin family play a crucial role in human cancers.4–6 Recent studies have revealed that expression levels of PANX2 are considerably upregulated in renal cell carcinoma and cholangiocarcinoma,6,19 but downregulated in glioma.20,21 This demonstrates that PANX2 has varying effects on different types of tumors. However, the biological function of PANX2 in PCa remains unknown. In our study, we first confirmed that expression levels of PANX2 are remarkably upregulated in PCa tissues and cell lines. To elucidate the clinical function of PANX2 in PCa, we established that differential expression of PANX2 is significantly associated with Gleason score. PANX2 is regarded as an independent factor for severity in PCa patients. Therefore, PANX2 can be used as a specific marker in PCa patients. However, the present study was a retrospective analysis, and further studies should be conducted by recruiting independent cohorts to validate the clinical implications of PANX2’s in PCa.
Increasing pieces of evidence from previous studies demonstrate that Nrf2 has been recognized as a crucial gene of oxidative stress in tumorigenesis.22,23 Recent studies reveal that silencing expression of Nrf2 suppressed prostate cancer development,24,25 implying that Nrf2 has a pro-oncogenic role achieved through activation of its downstream targets in the progression of PCa. Application of bioinformatics and in vitro analysis in our study confirms that PANX2 was enriched to oxidative stress, and blocking the expression of PANX2 suppresses proliferation, migration, and invasion in PCa cells, and increases ferrous iron and MDA levels. However, these effects were rescued by Nrf2 activator oltipraz. Our findings are consistent with those of previous studies and prove that PANX2 can regulate malignant phenotypes and ferroptosis in PCa cells by targeting Nrf2. Nuclear factor erythroid-2 related factor 2 (Nrf2) primarily regulates genes which contain antioxidant response elements (ARE) in their promoters.26 Activation of Nrf2 in PCa due to overexpression of PANX2 in PCa cells may initiate antioxidant response elements, thereby impeding ferroptosis and causing proliferation, migration, and invasion in PCa cells. We intend to conduct further studies to determine the effect of Nrf2 in the presence of PANX2 in vivo.
This is the first study to prove that PANX2 facilitates proliferation, migration, and invasion, and inhibits ferroptosis in vitro in PCa cells. This elucidates the pivotal role of PANX2 in the development of PCa. Nrf2 which is a target factor of PANX2 in PCa may be a fascinating therapeutic target.27 Notably, targeting dysregulated PANX2 is anticipated to be a well-tolerated therapy. Our results have demonstrated that inhibition of PANX2 as a regulator of Nrf2 can be a therapeutic approach for treating PCa. However, it will be imperative to validate this therapy in vivo and to develop it for the treatment of PCa.
Conclusions
In summary, findings of the current study have successfully identified the DEGs from diverse PCa datasets and selected a significantly up-regulated candidate gene PANX2, which is involved in ferroptosis of PCa cells via the Nrf2 signaling pathway. Our study provides a valuable avenue for unveiling novel mechanisms in PCa progression.
Acknowledgments
This work was sponsored by National Natural Science Young Foundation of China (Grant nos. 81904218 to Q.P., 81902532 to Y.Y. and 81704091 to X.Y.T.), Spark Project of Sichuan University (Grant nos. 2082604401223 to Y.Y.), China Postdoctoral Science Found (2019M653831XB to Q.P.) and Natural Science Foundation of Chongqing, China (cstc2019jcyj-msxmX0095 to Q.P., cstc2019jcyj-msxmX0757 to X.Y.T. and cstc2019jcyj-msxmX0768).
Author Contributions
All authors contributed to data analysis, drafting or revising the article, gave final approval of the version to be published, and agree to be accountable for all aspects of the work.
Disclosure
All authors declared that they have no competing interest in this work.
References
1. Bray F, Ferlay J, Soerjomataram I, Siegel RL, Torre LA, Jemal A. Global cancer statistics 2018: GLOBOCAN estimates of incidence and mortality worldwide for 36 cancers in 185 countries. CA Cancer J Clin. 2018;68(6):394–424. doi:10.3322/caac.21492
2. Ye D, Zhu Y. Epidemiology of prostate cancer in China: an overview and clinical implication. Zhonghua Wai Ke Za Zhi. 2015;53(4):249–252.
3. Zhou J-G, Zhao H-T, Jin S-H, Tian X, Ma H. Identification of a RNA-seq-based signature to improve prognostics for uterine sarcoma. Gynecol Oncol. 2019;155(3):499–507. doi:10.1016/j.ygyno.2019.08.033
4. Jalaleddine N, El-Hajjar L, Dakik H, et al. Pannexin1 is associated with enhanced epithelial-to-mesenchymal transition in human patient breast cancer tissues and in breast cancer cell lines. Cancers (Basel). 2019;11(12):1967. doi:10.3390/cancers11121967
5. Romano RC, Gardner JM, Shalin SC, et al. High relative expression of pannexin 3 (PANX3) in an axillary sweat gland carcinoma with osteosarcomatous transformation. Am J Dermatopathol. 2016;38(11):846–851. doi:10.1097/DAD.0000000000000583
6. Kim KM, Hussein UK, Bae JS, et al. The expression patterns of FAM83H and PANX2 are associated with shorter survival of clear cell renal cell carcinoma patients. Front Oncol. 2019;9:14. doi:10.3389/fonc.2019.00014
7. Stockwell BR, Friedmann Angeli JP, Bayir H, et al. Ferroptosis: a regulated cell death nexus linking metabolism, redox biology, and disease. Cell. 2017;171(2):273–285. doi:10.1016/j.cell.2017.09.021
8. Yu Y, Xie Y, Cao L, et al. The ferroptosis inducer erastin enhances sensitivity of acute myeloid leukemia cells to chemotherapeutic agents. Mol Cell Oncol. 2015;2(4):e1054549. doi:10.1080/23723556.2015.1054549
9. Jiang L, Kon N, Li T, et al. Ferroptosis as a p53-mediated activity during tumour suppression. Nature. 2015;520(7545):57–62. doi:10.1038/nature14344
10. Abdalkader M, Lampinen R, Kanninen KM, Malm TM, Liddell JR. Targeting Nrf2 to suppress ferroptosis and mitochondrial dysfunction in neurodegeneration. Front Neurosci. 2018;12:466. doi:10.3389/fnins.2018.00466
11. Imai H, Matsuoka M, Kumagai T, Sakamoto T, Koumura T. Lipid peroxidation-dependent cell death regulated by GPx4 and ferroptosis. Curr Top Microbiol Immunol. 2017;403:143–170. doi:10.1007/82_2016_508
12. Arredouani MS, Lu B, Bhasin M, et al. Identification of the transcription factor single-minded homologue 2 as a potential biomarker and immunotherapy target in prostate cancer. Clin Cancer Res. 2009;15(18):5794–5802. doi:10.1158/1078-0432.CCR-09-0911
13. Mortensen MM, Høyer S, Lynnerup A-S, et al. Expression profiling of prostate cancer tissue delineates genes associated with recurrence after prostatectomy. Sci Rep. 2015;5(1):1–11. doi:10.1038/srep16018
14. Ashburner M, Ball CA, Blake JA, et al. Gene ontology: tool for the unification of biology. Nat Genet. 2000;25(1):25–29. doi:10.1038/75556
15. Kanehisa M, Furumichi M, Tanabe M, Sato Y, Morishima K. KEGG: new perspectives on genomes, pathways, diseases and drugs. Nucleic Acids Res. 2016. doi:10.1093/nar/gkw1092
16. Dennis G, Sherman BT, Hosack DA, et al. DAVID: database for annotation, visualization, and integrated discovery. Genome Biol. 2003;4(5):P3. doi:10.1186/gb-2003-4-5-p3
17. Das J, Yu H. HINT: high-quality protein interactomes and their applications in understanding human disease. BMC Syst Biol. 2012;6(1):92. doi:10.1186/1752-0509-6-92
18. Nepusz T, Yu H, Paccanaro A. Detecting overlapping protein complexes in protein-protein interaction networks. Nat Methods. 2012;9(5):471–472. doi:10.1038/nmeth.1938
19. Liu J, Liu W, Li H, et al. Identification of key genes and pathways associated with cholangiocarcinoma development based on weighted gene correlation network analysis. PeerJ. 2019;7:e7968. doi:10.7717/peerj.7968
20. Le Vasseur M, Chen VC, Huang K, Vogl WA, Naus CC. Pannexin 2 localizes at ER-mitochondria contact sites. Cancers (Basel). 2019;11(3):343. doi:10.3390/cancers11030343
21. Lai CPK, Bechberger JF, Naus CC. Pannexin2 as a novel growth regulator in C6 glioma cells. Oncogene. 2009;28(49):4402–4408. doi:10.1038/onc.2009.283
22. Tsai T-F, Chen P-C, Lin Y-C, et al. Miconazole contributes to NRF2 activation by noncanonical P62-KEAP1 pathway in bladder cancer cells. Drug Des Devel Ther. 2020;14:1209–1218. doi:10.2147/DDDT.S227892
23. Sajadimajd S, Khazaei M. Oxidative stress and cancer: the role of Nrf2. Curr Cancer Drug Targets. 2018;18(6):538–557. doi:10.2174/1568009617666171002144228
24. Chen J-Y, Wang F-B, Xu H, et al. High glucose promotes prostate cancer cells apoptosis via Nrf2/ARE signaling pathway. Eur Rev Med Pharmacol Sci. 2019;23(3 Suppl):192–200. doi:10.26355/eurrev_201908_18647
25. Wang Z, Han G, Liu Q, Zhang W, Wang J. Silencing of PYGB suppresses growth and promotes the apoptosis of prostate cancer cells via the NF-κB/Nrf2 signaling pathway. Mol Med Rep. 2018;18(4):3800–3808. doi:10.3892/mmr.2018.9388
26. Li R, Jia Z, Zhu H. Regulation of Nrf2 signaling. React Oxyg Species (Apex). 2019;8(24):312–322. doi:10.1074/jbc.M110.118976
27. Xue D, Zhou C, Shi Y, Lu H, Xu R, He X. Nuclear transcription factor Nrf2 suppresses prostate cancer cells growth and migration through upregulating ferroportin. Oncotarget. 2016;7(48):78804–78812. doi:10.18632/oncotarget.12860
 © 2020 The Author(s). This work is published and licensed by Dove Medical Press Limited. The full terms of this license are available at https://www.dovepress.com/terms.php and incorporate the Creative Commons Attribution - Non Commercial (unported, v3.0) License.
By accessing the work you hereby accept the Terms. Non-commercial uses of the work are permitted without any further permission from Dove Medical Press Limited, provided the work is properly attributed. For permission for commercial use of this work, please see paragraphs 4.2 and 5 of our Terms.
© 2020 The Author(s). This work is published and licensed by Dove Medical Press Limited. The full terms of this license are available at https://www.dovepress.com/terms.php and incorporate the Creative Commons Attribution - Non Commercial (unported, v3.0) License.
By accessing the work you hereby accept the Terms. Non-commercial uses of the work are permitted without any further permission from Dove Medical Press Limited, provided the work is properly attributed. For permission for commercial use of this work, please see paragraphs 4.2 and 5 of our Terms.