")
Back to Journals » OncoTargets and Therapy » Volume 13
Identification of Novel lncRNA Markers in Glioblastoma Multiforme and Their Clinical Significance: A Study Based on Multiple Sequencing Data
Received 24 October 2019
Accepted for publication 22 January 2020
Published 4 February 2020 Volume 2020:13 Pages 1087—1098
DOI https://doi.org/10.2147/OTT.S235951
Checked for plagiarism Yes
Review by Single anonymous peer review
Peer reviewer comments 2
Editor who approved publication: Dr Leo Jen-Liang Su
Youwei Li, Dongsheng Guo
Department of Neurosurgery, Tongji Hospital, Tongji Medical College, Huazhong University of Science and Technology, Wuhan, Hubei, People’s Republic of China
Correspondence: Dongsheng Guo
Department of Neurosurgery, Tongji Hospital, Tongji Medical College, Huazhong University of Science and Technology, Wuhan, Hubei, People’s Republic of China
Email [email protected]
Background: Long non-coding RNAs (lncRNAs) have been verified to have a vital role in the progression of glioblastoma multiforme (GBM). Our research was about to identify the potential lncRNAs which was closely associated with the pathogenesis and prognosis of glioblastoma multiforme.
Methods: All RNA sequence profiling data from patients with GBM were obtained from The Genotype-Tissue Expression (GTEx) and The Cancer Genome Atlas (TCGA). Differently expressed genes identified from GBM and control samples were used to construct competing endogenous RNA (ceRNA) network and perform corresponding functional enrichment analysis. Univariate Cox regression followed by lasso regression and multivariate Cox was used to validate independent lncRNA factors and construct a risk prediction model. Quantitative polymerase chain reaction (qPCR) was performed to verify the expression levels of potential lncRNA biomarkers in human GBM clinical specimens. A gene set enrichment analysis (GSEA) was subsequently conducted to explore potential signaling pathways in which critical lncRNAs may be involved. Moreover, nomogram plot was applied based on our prediction model and significant clinical covariates to visualize the prognosis of GBM patients.
Results: A total of 2023 differentially expressed genes (DEGs) including 56 lncRNAs, 1587 message RNAs (mRNAs) and 380 other RNAs were included. Based on predictive databases, 16lncRNAs, 32 microRNAs (miRNAs) and 99 mRNAs were used to construct a ceRNA network. Moreover, we performed a novel risk prediction model with 5 potential prognostic lncRNAs, in which 4 of them were newly identified in GBM, to predict the prognosis of GBM patients. Finally, a nomogram plot was constructed to illustrate the potential relationship between the prognosis of GBM and our risk prediction model and significant clinical covariates.
Conclusion: In this study, we identified 4 novel potential lncRNA biomarkers and constructed a prediction model of GBM prognosis. A simple-to-use nomogram was provided for further clinical application.
Keywords: long non-coding RNA, glioblastoma multiforme, prognosis, ceRNA network
Introduction
Glioblastoma multiforme (GBM), the most common malignant brain tumor in human, is characterized by a poor median survival time (about 14 months) after being diagnosed.1,2 The 5-year survival rate of GBM was only 5.5%.3 Conventional therapy of GBM usually includes surgery, radiotherapy, chemotherapy and precise use of molecular targeted drugs.4,5 The final lethality rate of GBM is high because of the characteristic of infiltrative growth, which makes it difficult to be resected completely and easy for tumor recurrence.6 The poor prognosis is considered to be related to tumor recurrence and therapeutic resistance after tumor resection, and it is still a challenge for treating such intracranial tumors.7 Thus, comprehensive understanding of the underlying mechanisms and finding more accurate and effective molecular targets and biomarkers are needed.
Long noncoding RNA (lncRNA) is a type of noncoding RNA comprising various RNA transcripts of sizes exceeding 200 nucleotides (nt) in length, which lacks the capability of protein-coding.8 LncRNAs are more active in the biology than message RNAs (mRNAs) and tissue-specific, indicating that these RNA sequences play vital roles in the biology of organism.9 Previous researches have indicated that aberrant expression of lncRNAs might be associated with at least part of the biological characteristics of GBM, including angiogenesis, proliferation, stemness, and drug resistance,10–12 which have great clinical significances in the diagnosis and prognostication of GBM.13,14
Many lncRNAs have been verified to be related to the onset and progression of GBM.10,11 Published researches of GBM-related lncRNAs have focused on functions of aberrantly expressed lncRNAs. In molecular biology, competing endogenous RNA (ceRNA), one mechanism of lncRNAs post-transcriptional regulation, can competitively bind with shared microRNAs (miRNAs) to regulate other RNA sequences.15,16 For example, lncRNA CRNDE’s upregulation can compete for miR-384 and impairs the capability of miR-384 to specific downstream molecules (Bcl-2, cyclin D1, and STAT3), and abrogate the inhibition of downstream genes.17 Consistently, HOTAIR can function as endogenous molecular sponges to compete for miR-148b-3p and decrease the permeability of the BTB (blood-brain tumor barrier) in glioblastoma and other malignant gliomas.18 In addition, lncRNAs have also been demonstrated to be involved in the regulation of genome activity, protein modification and anchoring, and functional micropeptides encoding.19–21
The levels of LncRNAs’ expression were found to be correlated with the malignancy grade and clinical prognosis of GBM patients. For example, Wang et al confirmed that HOXA11-AS, a novel cell cycle-associated lncRNA, is a prognostic biomarker in glioma patients.22 More recently, Chen et al revealed that lncRNA NEAT1 can promote the activation of WNT/β-catenin pathway, which can strongly indicate a poor survival prognosis in GBM.23 Thus, it is urgent to elucidate the biological mechanisms of the potential functions of dysregulated lncRNAs in GBM regulation.
In the last few decades, limited efforts have been made to understand the potential functions of lncRNAs. Some novel insights and potential targets of lncRNAs verified in other diseases including various malignant tumor have not yet been clearly identified in the pathogenesis of GBM. The aim of our study was to explore the relationship between lncRNAs prognostic factor and overall survival (OS) of patients in GBM. The mRNA and lncRNA data were systematically analyzed and a ceRNA network was constructed based on the intersection of differentially expressed genes (DEGs) in The Cancer Genome Atlas (TCGA) databases and The Genotype-Tissue Expression (GTEx) portal. Functional enrichment analysis based on current newest bioinformatics resources and survival analysis based on both univariate and multivariate Cox regressions allowed us to have a better understanding of the primary functions of lncRNAs in GBM and their relevant prognostic significance. In our study, we constructed a new and practical risk model based on potential prognostic lncRNAs to predict the OS of GBM. Nomogram was used to visualize our model with significant clinical covariates. The potential function and involved signal pathways of novel lncRNA predictive factors were also analysed. These findings can increase our understanding of the function of lncRNAs in GBM and improve GBM treatment.
Materials and Methods
Collection of Datasets
The Cancer Genome Atlas (TCGA), with molecular data from more than 20,000 primary cancer samples including GBM, is a landmark cancer genomics program for human. However, GTEx Program established a data resource and tissue bank of healthy people. This study meets the guidelines provided by TCGA and GTEx.24,25 Data of TCGA and GTEx were thoroughly screened for all available data sets. The downloaded GBM samples in TCGA were then cross-referenced with their corresponding clinical information through TCGA barcode. Patients in TCGA cohort failing to meet the following criteria were eliminated: 1.GBM transcriptome data with basic survival information including survival status and survival time; 2. Survival time or following time of patients is more than 60 days. Finally, 149 GBM samples from TCGA, 5 pericarcinous tissue samples and 102 normal brain tissue samples from GTEx were included. Also, 340 GBM samples with completed clinical information were included for validation. The basic patients’ information of the corresponding GBM samples in the TCGA database is shown in Supplementary Table 1.
Data heterogeneity is one of the main reasons for bias. The TCGA and GTEx sample data we downloaded came from different platforms, and complicated differences may exist in the time, performer and experimental methods of these data, which may generate potential heterogeneity, and cause bias. To avoid generating unreliable results, we integrated TCGA and GTEx data with the R language “limma” package and “sva” package to normalize the batch effects and eliminate data heterogeneity. Genes that could not be identified in all of the data sets were removed. CeRNA network generated by Cytoscape (vision 3.7.1) was used for the analysis of interactive relationships between lncRNA, miRNA and mRNA. Bar Plots of enrichment analysis generated by R language (version 3.6.1) was created to display the detail of potential function and pathways in GBM. The flowchart was used to illustrate details of this study design in Figure 1.
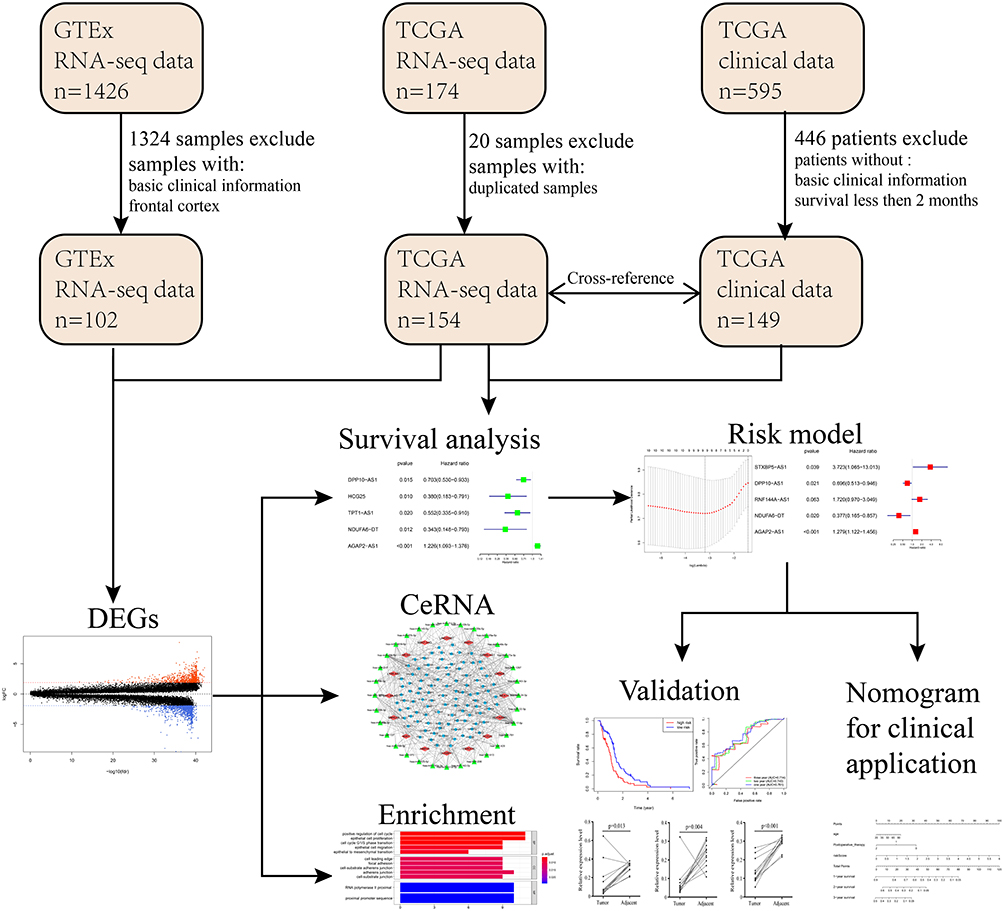 |
Figure 1 Flowchart of the systematic profiling of lncRNAs in GBM in the current study. Abbreviations: GTEx, The Genotype-Tissue Expression; TCGA, The Cancer Genome Atlas; DEG, differentially expressed gene; GBM, glioblastoma multiforme; ceRNA, competing endogenous RNA. |
Identification of DEGs
To identify DEGs between GBM and normal tissues, we used the R language “limma” package to screen the DEGs between the GBM samples and control samples (para-carcinoma tissues from GBM cohort in TCGA database and normal brain tissues from healthy people) from the merged GTEx data sets and TCGA GBM transcriptome data. All values of genes’ expression levels were performed a log transformation to correct potential skewed distributions. Mann–Whitney test was performed to determine differential expression levels of genes between tumor samples and corresponding control samples. |log2 fold change (FC) | >2, and false discovery rate (FDR) values < 0.05 were considered to be statistically significant.
CeRNA Network
To explore whether our DEGs existed in a ceRNA network, miRcode, miRTarBase, TargetScan, and miRDB database were used to identify interaction between our aberrantly expressed genes of GBM patients. miRcode database was used to predict relationship between lncRNA and miRNA. Then, the predicted miRNA was performed to verify aberrantly survival-associated mRNA based on miRTarBase, TargetScan, and miRDB. Only miRNA-mRNA strings confirmed in all three databases can be included in our ceRNA network. Cytoscape software (vision 3.7.1) was used to visualize the obtained lncRNA-miRNA-mRNA strings in ceRNA networks.
Functional and Pathway Enrichment Analysis
Based on all mRNAs in our ceRNA network, Gene ontology (GO) term and Kyoto Encyclopedia of Genes and Genomes (KEGG) pathway analysis were conducted with R language “clusterProfiler” package (FDR< 0.05). Bar plot was used to visualize the biological process (BP), cellular component (CC), and molecular function (MF) of GO term and associated signal pathways of KEGG.
Survival Analysis
To verify the correlation between differential expression of lncRNAs or mRNAs and the outcomes of GBM patients’ survival, we conducted Kaplan–Meier method and univariate Cox survival regression through the R language “survival” package and basic package. All samples were divided into two groups according to the median value, and Kaplan-Meier analysis was performed based on survival data, log-rank P value <0.05 was considered significant. For univariate and multivariate Cox survival regression analysis, potential predictors of OS were identified based on prognosis data and genes’ expression levels (P value <0.05).
Construction of Risk Prediction Model
In order to build a prognostic model applicable to GBM patients, which is easier and more valuable in promoting in the clinical practice, differentially expressed lncRNAs were used to conduct a univariate Cox survival regression, P value <0.05 was considered significant. To create a more parsimonious model, lasso regression was applied to shrink the independent variables and reduce potential over-fit in our model (Number of simulations=5000). Then, multivariate Cox survival regression was performed between lncRNAs obtained from lasso regression and over survival to confirm independent prognostic factors in our model (stepwise regression method, P value <0.05). Coefficients (coef) of lncRNAs in multivariate Cox regression were used as coefficients of corresponding factors in risk prediction model. The risk value of our model was as follows: risk value = expression of lncRNA1* coef1+ expression of lncRNA2* coef2 + … + expression of lncRNAn* coefn. The accuracy of the model was tested by the AUC value of the ROC curve. All statistical analyses in this study were conducted by R language (version 3.6.1).
RNA Isolation and PCR
All 14 pairs of fresh glioblastoma and adjacent normal specimens were collected from surgical resection in Department of Neurosurgery of Huazhong University of Science and Technology affiliated Tongji Hospital from March 2015 to July 2019. All included specimens were confirmed by the pathological diagnoses. Clinically basic detail of corresponding GBM patients is described in Supplementary Table 2. Written informed consents of using data or tissues for this study were acquired from corresponding patients or guardians or other direct relatives. This study was approved by the Research Ethics Committee of Tongji Hospital of Huazhong University of Science and Technology affiliated Tongji Hospital (serial number: TJ-IBR20181111).
We purified total RNA of paired clinical tissue samples with TRIzol (Invitrogen, USA) according to the manufacturer’s instructions. 500 μg of total RNA was then reverse transcribed into cDNA with ReverTra Ace qPCR RT Kit (Toyobo, Japan). RT-qPCR assays were conducted using SYBR Green Master Mix (Thermo) on a 7900 HT Fast Real-Time PCR system (Applied Biosystems). Details of primer Sequences used for qRT-PCR in this study are listed in Supplementary Table 3. The ΔΔCt method was used for quantification analysis.
Gene Set Enrichment Analysis
All GBM transcriptional data in the TCGA database were divided into two groups according to the median value of risk prediction model. Gene set enrichment analysis (GSEA) was performed based on the KEGG database (c2.cp.kegg.v7.0.symbols.gmt) and Reactome database (c2.cp.reactome.v7.0.symbols.gmt) using GSEA −3.0.jar (Number of simulations=1000, FDR<0.25).
Nomogram Construction
To visualize the prediction effect of our model, the nomogram was established for the OS by using R language “rms” and “survival” package (version 3.6.1). Concordance index value was used to evaluate the nomogram performance.
Statistical Analysis
Significant differences between two groups were estimated by Student’s t-test. The paired T-test was used to test the significant difference of the paired samples. Overall survival (OS) curves were used to describe the survival distributions (log-rank P value < 0.05). GO and KEGG Pathway analysis was performed using the R language clusterProfiler package. GSEA −3.0.jar was used to analyse the lncRNA-specific signalling pathways (FDR < 0.25). Unless explicitly stated, differences were considered significant when P value < 0.05. All statistical analyses were performed using R language version 3.5.1 and GraphPad prism software version 8.0.
Results
Clustering Analysis of the DEGs
Differentially expressed genes between tumor and normal samples have been validated to play a vital role in the process of many malignant diseases. Thus, we screened and downloaded the raw RNA expression profiling data from TCGA and GTEx database. All patients’ detailed information is shown in Supplementary Table 1. Though a series of stringent filters was implemented, we obtained the expression levels of 55,187 genes in the RNA expression profiling data from 256 samples (149 GBM samples and 107 control samples). R language “limma” package was used to identify significantly aberrant expression of genes (FDR < 0.05, |Log2FC| > 2) (Figure S1A). Eventually, a total of 2023 DEGs were obtained, including 1586 mRNAs, 57 lncRNAs and 380 other types of RNA sequences. Bubble chart was used to demonstrate the top 30 significant lncRNAs (Figure S1B). Furthermore, part of identified lncRNAs were showed in boxplot to intuitively illustrate the differences between GBM and control samples (Figure S1C).
CeRNA Network
It was evident that RNA transcripts, both protein-coding and non-coding, thus have the capability to compete for miRNA binding and co-regulate each other in ceRNA networks. To explore whether there is a competitive endogenous RNA regulatory relationship among the differentially expressed lncRNAs and mRNAs, we constructed a ceRNA network according to the methods described above. The ceRNA network we constructed contains 16 lncRNAs, 32 miRNAs and 99 mRNAs (Figure 2). Of note is that the majority of lncRNAs and mRNAs in our network bind to more than one miRNA. Detailed information of the ceRNA network is shown in Supplementary Table 4.
 |
Figure 2 Competing endogenous RNA network in GBM based on DEGs obtaining from transcriptional data of TCGA and GTEx. Red diamond stands for the selected lncRNAs, the green triangle represents miRNAs, and the blue circle represents mRNAs. |
GO and KEGG Functional Enrichment Analysis
To further elucidate the underlying biological functions of genes and the main signaling pathways in the ceRNA network, functional enrichment analyses including GO and KEGG analysis were conducted (FDR< 0.05). Specific GO categories such as positive regulation of cell cycle (Fisher’s Exact Test, FDR< 0.01), epithelial cell proliferation (FDR< 0.01), cell cycle G1/S phase transition (FDR< 0.01), and adherens junction (FDR=0.011) were significantly enriched in these DEGs (Figure 3A). Additionally, the results of KEGG analysis revealed the potential biological relationship between our gene set and the PI3K-Akt signaling pathway (Fisher’s Exact Test, FDR<0.01), cellular senescence pathway (FDR<0.01), and microRNAs in cancer (FDR<0.01), etc. (Figure 3B). Taken together, these results indicated that the DEGs in our ceRNA play a vital role in regulating malignant process such as cell proliferation, cell cycle and cell adhesion with potential pathways such as PI3K-Akt signaling pathway, etc., of GBM.
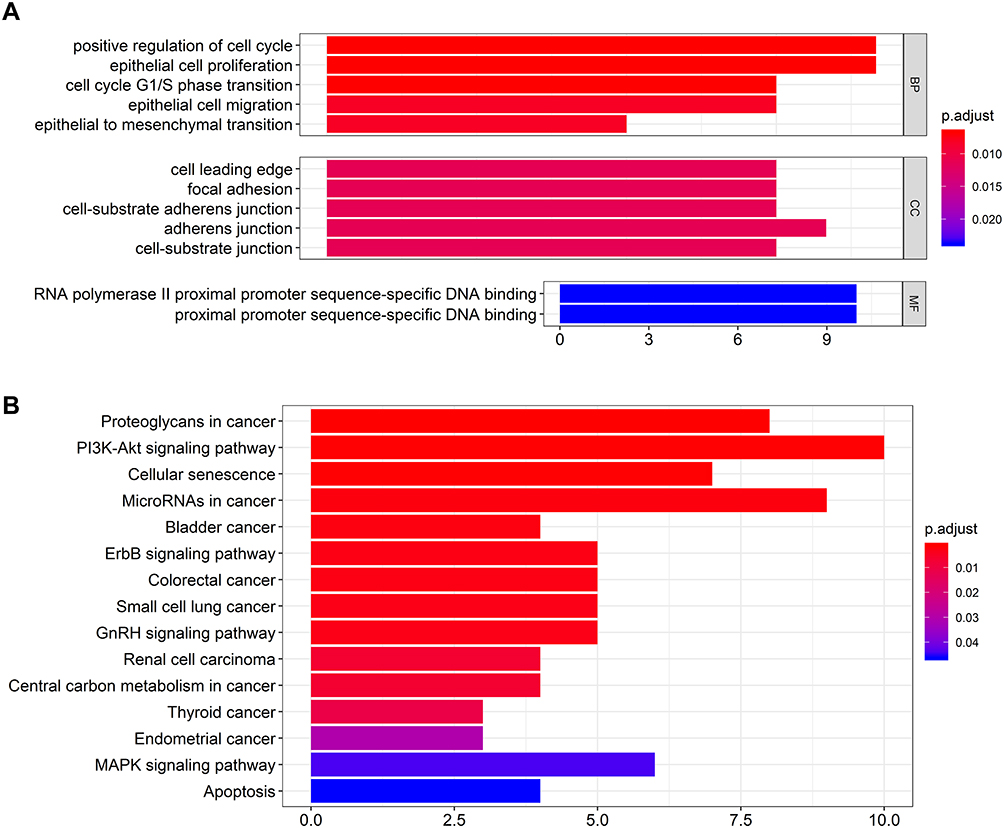 |
Figure 3 The bar charts for gene ontology analysis and KEGG pathway analysis for mRNAs in the ceRNA network. (A) Bar chart of gene ontology enriched in all GO, BP, and MF annotations; (B) Bar chart of KEGG pathway analysis. Abbreviations: GO, gene ontology; CC, cellular component; MF, molecular function. |
Survival Analysis
Differentially expressed mRNA has been verified to significantly associate with the biology process of malignant diseases. Similarly, significantly different lncRNAs between GBM and control samples may play a significant role in the whole course of GBM. After the deletion of patients with a series of stringent filters, a total of 149 GBM patients’ clinical data were included in the analysis. Eventually, we performed survival analysis of all differentially expressed lncRNAs using the method of univariate Cox regression (P value < 0.05). The results of the univariate Cox regression are shown in Supplementary Table 5. Among all of the lncRNAs, four lncRNAs (HCG25, NDUFA6-DT, DPP10-AS1, TPT1-AS1) were identified to be significantly associated with good survival in patients, while one (AGAP2-AS1) was significantly associated with poor patient survival (Figure 4A).
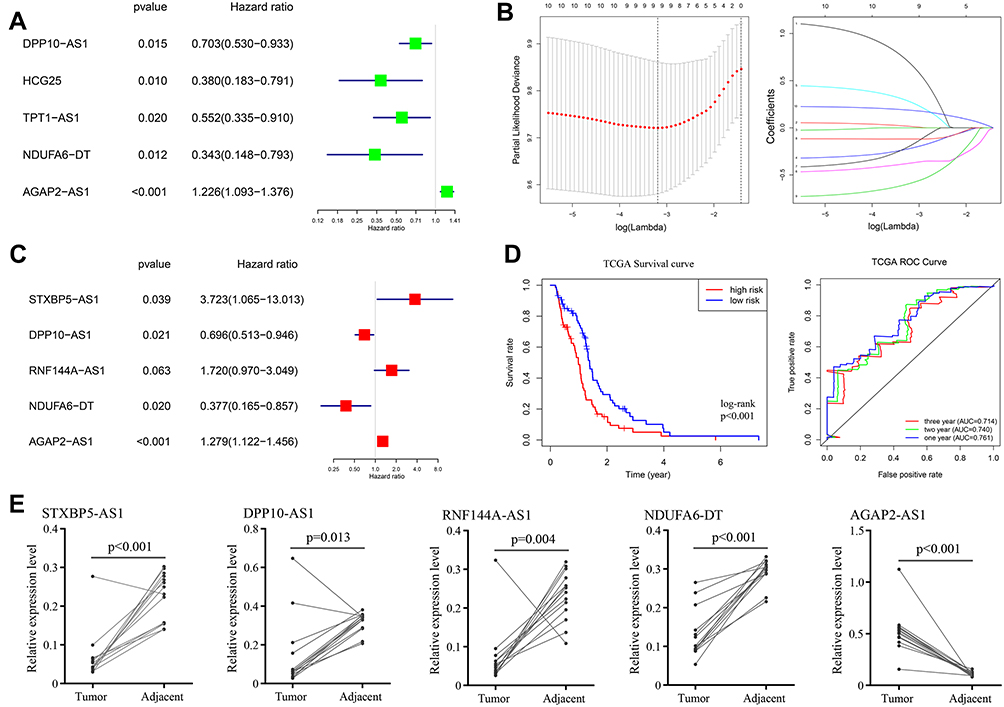 |
Figure 4 Survival analysis and construction of risk prediction model. (A) univariate Cox regression of differentially expressed lncRNAs; (B) lasso regression for lncRNAs in univariate Cox regression; (C) multivariate Cox regression of remained lncRNAs in lasso regression; (D) Kaplan-Meier survival curves (left) and AUC values of ROC curves (right) of the risk prediction model in TCGA; (E) the expression levels of STXBP5−AS1, DPP10−AS1, RNF144A−AS1, NDUFA6−DT and AGAP2−AS1 in GBM and control tissues. |
Risk Prediction Model for GBM Patients
Given the heterogeneity of glioblastoma, individual survival-related lncRNAs may not be able to accurately predict patient outcomes. We selected the top ten survival associated lncRNAs as candidates for our model. To exclude any lncRNAs that may not be independent factor in our risk predictor, lasso regression (Figure 4B) and multivariate Cox regression (Figure 4C) was performed to identify candidate potential predictive factors. Eventually, the prognostic predictor with five lncRNAs, including STXBP5-AS1 (hazard ratio (HR) = 3.723, 95% confidence interval (CI): 1.065–13.013, P = 0.039), DPP10-AS1 (HR = 0.696, 95% CI: 0.5123–0.946, P =0.021), RNF144A-AS1 (HR = 1.720, 95% CI: 0.970–3.049, P = 0.063), NDUFA6-DT (HR = 0.377, 95% CI: 0.165–0.857, P =0.020), and AGAP2-AS1 (HR = 1.279, 95% CI: 1.122–1.456, P <0.001), was generated. All samples were divided into two groups according to the median value of risk score of our model, and Kaplan-Meier analysis was performed based on survival data, log-rank P value <0.05 was considered significant (Figure 4D). The AUC value of ROC curve was 0.761, 0.740 and 0.714 at one, two and three years of OS (Figure 4D).
To verify the accuracy and reliability of our bioinformatics analysis, qPCR analysis was used to evaluate expression levels of five lncRNAs with potential prognostic value in GBM and adjacent normal tissues. Consistent with our bioinformatics analysis results, the expression levels of STXBP5−AS1 (P<0.001), DPP10−AS1 (P=0.013), RNF144A−AS1 (P=0.004) and NDUFA6−DT (P<0.001) in GBM tissues were significantly higher than they were in adjacent normal tissues (paired t-test, P value < 0.05), while AGAP2−AS1 showed inverse result (P<0.001) (Figure 4E).
GSEA analysis was also performed based on both KEGG and Reactome pathway database to predict the potential signaling pathways that might play a vital role in modulating the prognosis of patients based on the risk value of our model. As shown in Figure 5A and B, the pathway involved in cell adhesion and migration such as Leukocyte transendothelial migration (Enrichment score (ES) =0.58, FDR=0.026) and Cell adhesion molecules (ES=0.61, FDR=0.030) in KEGG database and Integrin cell surface interactions (ES=0.73, FDR=0.040) in Reactome database were played a vital role in the biology process in GBM. Multiple tumor-associated pathways such as Bladder cancer pathway (ES=0.58, FDR=0.026) and Small cell lung cancer pathway (ES=0.58, FDR=0.026) in KEGG database and Constitutive signaling by aberrant PI3K in cancer (ES=055, FDR=0.083) in Reactome database were also active in GBM process.
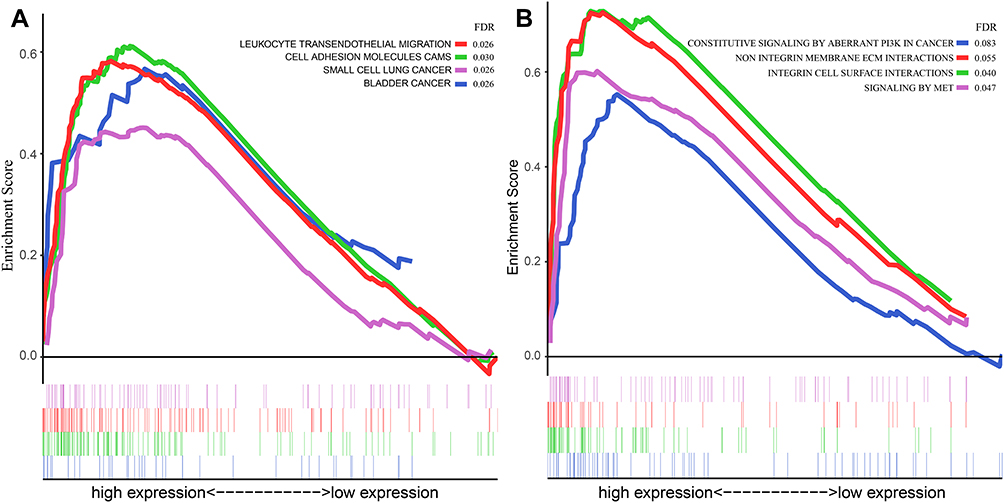 |
Figure 5 GSEA analysis based on the risk value of the prediction model in the current study. (A) GSEA analysis based on the KEGG pathway database; (B) GSEA analysis based on the Reactome pathway database. Abbreviations: GSEA, gene set enrichment analysis; KEGG, Kyoto Encyclopedia of Genes and Genomes. |
Nomogram for Prognostic Prediction
Nomogram plot was used extensively to provide graphical calculations of complicated formulas to a practical precision for many years. Clinical data were divided into two groups according to the risk value of our model, and significance between clinical characteristics and OS in TCGA is shown in Table 1. In this study, we constructed a nomogram based on risk scores of our risk model and significant clinical covariates (age and postoperative therapy), thus providing clinicians with an efficient tool to predict the survival time of individual patients of GBM (Figure 6). The C-index for the model was 0.774, which suggested a good predict performance.
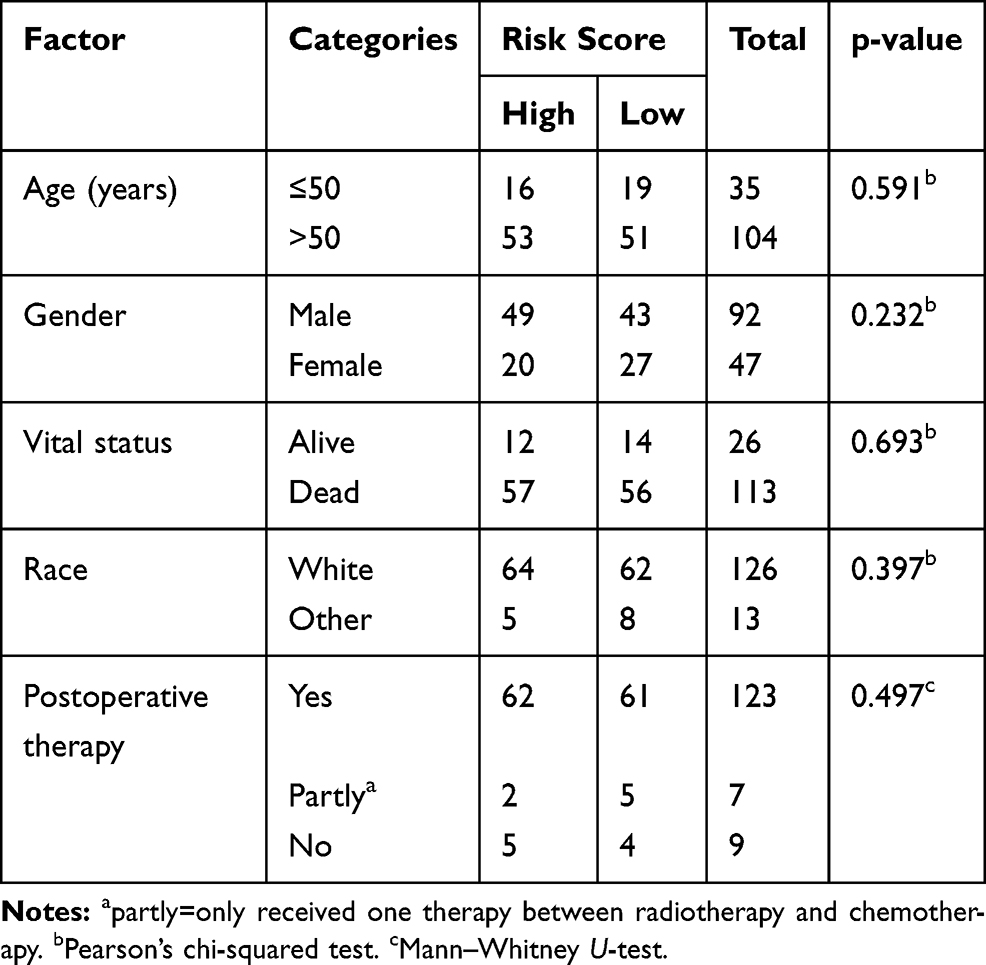 |
Table 1 Clinical Characteristics of Two Groups in Risk Prediction Model |
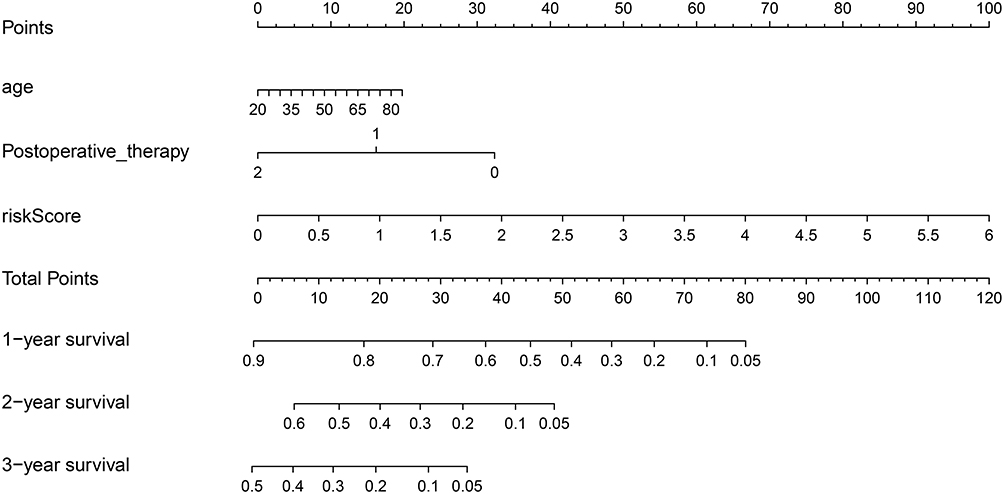 |
Figure 6 Nomogram of prognosis (survival probability) prediction for GBM patients. To estimate the rate for a real patient, identify the patient’s regulation type for integrated values of the risk prediction model and clinical characteristics including age and postoperative therapy, draw a line from the observed status for each factors straight upwards to the Points axis to obtain the points a factor. Repeat this procedure until scores for all factors were decided. Sum the points corresponding to all factors and locate the cumulative point on the Total Points axis. Draw a line straight down to the Risk axis to check the rate for the particular patient. |
Discussion
LncRNA has been verified to play a significant role in the whole process of GBM, such as stemness, proliferation, angiogenesis and drug resistance.10,11 For example, LncRNA NEAT1 can function as molecular signaling mediators to mediate trimethylation of H3K27 in the promoter region of WNT/β-catenin and activate corresponding WNT/β-catenin pathways, thus promoting glioma cell growth and invasion in GBM.23 Moreover, lnc-TALC can promote O6-methylguanine-DNA methyltransferase expression, which is a hub molecule in the drug-resistant of GBM, via regulating the c-Met pathway.26 Recent studies have revealed that the aberrant expression of some hub lncRNAs may correlate with malignancy grade of tumor and have significant clinical implications in the prognosis of patients. Jing et al demonstrated that the up-regulated expression level of CRNDE was associated with the poor prognosis of GBM through survival analysis.13 Similarly, Wu et al uncovered that the up-regulated HOXA-AS3 in GBM was correlated with poor prognosis of glioma patients through Cox regression analysis.14
Up to now, many published researches validated that directly comparing the expression level of transcripts between tumor samples and corresponding control samples is an effective method to identify hub genes in corresponding malignant process. For example, Li et al identified novel lncRNAs which might be a therapeutic target for patients with cholangiocarcinoma through screening differentially expressed genes between cholangiocarcinoma and corresponding normal tissues.27 Notably, Song et al compared the expression of transcripts in different grades of glioma and identified four lncRNAs which may serve as potential prognosis biomarkers.28 However, only few studies have performed to identify prognosis lncRNAs between glioblastoma and corresponding normal tissues. Moreover, integrated prediction model of multiple hub lncRNAs for prognosis has been lacking, and is greatly needed, especially in GBM.
In our study, we performed a systematic analysis of aberrantly expressed lncRNAs based on RNA sequencing data from TCGA and GTEx. To elucidate the potential regulation between lncRNA-miRNA-mRNA strings, we constructed a ceRNA network based on the TCGA and GTEx transcriptional data. Univariate Cox regression followed by lasso regression and multivariate Cox was used to validate independent lncRNA factors and construct a risk prediction model for GBM patients. As a result, 5 potential lncRNA biomarkers (STXBP5-AS1, DPP10-AS1, RNF144A-AS1, NDUFA6-DT, AGAP2-AS1) were identified. We also construct a nomogram to visualize the OS of GBM patients based on our risk model and significant clinical covariates.
Recently, emerging studies of lncRNAs were typically focused on ceRNA networks of regulation. To investigate the underlying interaction between potential hub lncRNAs and mRNAs, a ceRNA network including 16 lncRNAs, 32 miRNAs and 99 mRNAs was constructed. We found 10 lncRNAs (CRNDE, EPB41L4A-AS1, GRM5-AS1, LY86-AS1, PART1, GUSBP11, MIAT, MEG3, NEAT1, SNHG14) that can bind to 10 or more miRNAs, which indicates that these lncRNAs might be more active in communicating with other molecular factors in GBM. Some of these lncRNAs have previously been found to function in a vital role in GBM and other malignant gliomas. Published researches have revealed that MEG3 have the capacity to act as an endogenous molecular sponge and combine with miR-93, miR-19a, miR-377 or miR-140, thereby suppressing the malignant process of glioma.29–32 Conversely, CRNDE has been verified to have significant biological functions in the malignant process of glioma by binding miR-186 and miR-384.17,33
Considering the interaction of lncRNAs and mRNAs in the ceRNA network, function analysis of mRNAs can at least partly uncover the underlying mechanism of corresponding lncRNAs. GO analysis of mRNAs in the ceRNA network indicated that the genes in our ceRNA network might significantly function in the regulation of cell cycle and cell proliferation, which are considered as a vital process in various malignant diseases including GBM. KEGG enrichment analysis suggested that these genes mainly activated in some vital pathways for carcinogenesis such as PI3K-Akt signaling pathway and cellular senescence pathway. Multiple other malignant signal pathways such as bladder cancer pathway and small cell lung cancer pathway were validated to be associated with these genes.
Understanding the molecular function of lncRNAs in GBM would promote their clinical application. In our risk model constructed by Cox and lasso regression, 5 lncRNA markers (AGAP2-AS1, STXBP5-AS1, DPP10-AS1, RNF144A-AS1, NDUFA6-DT) were identified. For AGAP2-AS1, multiple researches have invalidated that it played a vital role in the proliferation and invasion of GBM procession and was associated with the prognosis of GBM.34,35 It has been reported to be up-regulated in ovarian carcinoma and GBM and predicted poor prognosis, which is consistent with our analysis. For STXBP5-AS1, although it has not been identified in GBM, it was validated to be dysregulated gene in multiple malignant tumors such as cervical cancer, gastric cancer and non-small-cell lung carcinoma.36–38 Similarly, DPP10-AS1 was recognized as one of core genes in human epidermal growth factor receptor 2 (HER-2)-enriched subtype breast cancer.39 Moreover, RNF144A-AS1, as one of hub factors, showed high sensitivity and specificity in the prediction of chemoresistance in high-grade serous ovarian carcinoma.40 All these details suggest the reliability of our analysis.
We also performed GSEA analysis based on the risk value of GBM cohort in order to obtain deep understanding of predictive factors in our model. Notably, the enrichment outcomes based on both KEGG and Reactome pathway database mainly focused on the pathways of cell adhesion, migration and proliferation, which were significant processes of multiple malignant diseases. These results were consistent with biological function and pathway of corresponding lncRNAs in published studies. This indicates that our results are reasonable. The AUC value of ROC of our model based on TCGA was all above 0.7 at one, two and three years of OS, which suggested good performance of our model. Moreover, nomogram based on significant clinical covariates and our prediction model was simple-to-use and can be used to help clinicians to efficiently estimate the prognosis of GBM patients.
Finally, the advantages of our research are: genome-wide lncRNA profiling conducted for the first time based on a large number of both GBM and normal tissues; integrated analysis based on multiple database; identification of novel lncRNA markers and construction of a clinically useful nomogram. Some limitations of this study should be noted. Some DEGs we identified between GBM and normal tissues had a very low expression or even were not expressed in the GBM group. These genes, which might play a vital role in the process of biology, are omitted because of the characteristics of Cox survival analysis and may cause some biases of our findings.
Conclusion
In general, a novel prediction model including 5 predictive lncRNA biomarkers for GBM prognosis was constructed based on a systematic strategy. We also constructed a clinically useful prediction nomogram based on our prediction model and significant clinical covariates. Although our study is preliminary, we have provided novel insights for the prognosis of GBM and laid a solid foundation for further clinical practise.
Data Sharing Statement
All data generated or analyzed during this study are included in this article. The datasets included in our current study are available at the GTEX (http://commonfund.nih.gov/GTEx/) and TCGA database (https://cancergenome.nih.gov/).
Acknowledgment
This work was supported by the National Natural Science Foundation of China (grant numbers: 81874086 and 81472364).
Author Contributions
All authors contributed to data analysis, drafting and revising the article, gave final approval of the version to be published, and agree to be accountable for all aspects of the work.
Disclosure
The authors declare that they have no conflicts of interest in this work.
References
1. Van Meir EG, Hadjipanayis CG, Norden AD, Shu HK, Wen PY, Olson JJ. Exciting new advances in neuro-oncology: the avenue to a cure for malignant glioma. CA Cancer J Clin. 2010;60(3):166–193. doi:10.3322/caac.20069
2. Stupp R, Mason WP, van den Bent MJ, et al. Radiotherapy plus concomitant and adjuvant temozolomide for glioblastoma. N Engl J Med. 2005;352(10):987–996. doi:10.1056/NEJMoa043330
3. Ostrom QT, Gittleman H, Truitt G, Boscia A, Kruchko C, Barnholtz-Sloan JS. CBTRUS statistical report: primary brain and other central nervous system tumors diagnosed in the United States in 2011-2015. Neuro Oncol. 2018;20(suppl_4):iv1–iv86. doi:10.1093/neuonc/noy131
4. Hervey-Jumper SL, Berger MS. Maximizing safe resection of low- and high-grade glioma. J Neurooncol. 2016;130(2):269–282. doi:10.1007/s11060-016-2110-4
5. Shah JL, Li G, Shaffer JL, et al. Stereotactic radiosurgery and hypofractionated radiotherapy for glioblastoma. Neurosurgery. 2018;82(1):24–34. doi:10.1093/neuros/nyx115
6. Cheng Z, Li Z, Ma K, et al. Long non-coding RNA XIST promotes glioma tumorigenicity and angiogenesis by acting as a molecular sponge of miR-429. J Cancer. 2017;8(19):4106–4116. doi:10.7150/jca.21024
7. Chen J, Li Y, Yu TS, et al. A restricted cell population propagates glioblastoma growth after chemotherapy. Nature. 2012;488(7412):522–526. doi:10.1038/nature11287
8. Ulitsky I, Bartel DP. lincRNAs: genomics, evolution, and mechanisms. Cell. 2013;154(1):26–46. doi:10.1016/j.cell.2013.06.020
9. Deveson IW, Hardwick SA, Mercer TR, Mattick JS. The dimensions, dynamics, and relevance of the mammalian noncoding transcriptome. Trends Genet. 2017;33(7):464–478. doi:10.1016/j.tig.2017.04.004
10. Yan Y, Xu Z, Li Z, Sun L, Gong Z. An insight into the increasing role of LncRNAs in the pathogenesis of gliomas. Front Mol Neurosci. 2017;10:53. doi:10.3389/fnmol.2017.00053
11. Shi J, Dong B, Cao J, et al. Long non-coding RNA in glioma: signaling pathways. Oncotarget. 2017;8(16):27582–27592. doi:10.18632/oncotarget.15175
12. Sun B, Zhao X, Ming J, Liu X, Liu D, Jiang C. Stepwise detection and evaluation reveal miR-10b and miR-222 as a remarkable prognostic pair for glioblastoma. Oncogene. 2019;38(33):6142–6157. doi:10.1038/s41388-019-0867-6
13. Jing SY, Lu YY, Yang JK, Deng WY, Zhou Q, Jiao BH. Expression of long non-coding RNA CRNDE in glioma and its correlation with tumor progression and patient survival. Eur Rev Med Pharmacol Sci. 2016;20(19):3992–3996.
14. Wu F, Zhang C, Cai J, et al. Upregulation of long noncoding RNA HOXA-AS3 promotes tumor progression and predicts poor prognosis in glioma. Oncotarget. 2017;8(32):53110–53123. doi:10.18632/oncotarget.18162
15. Salmena L, Poliseno L, Tay Y, Kats L, Pandolfi PP. A ceRNA hypothesis: the Rosetta Stone of a hidden RNA language? Cell. 2011;146(3):353–358. doi:10.1016/j.cell.2011.07.014
16. Porto FW, Daulatabad SV, Janga SC. Long non-coding RNA expression levels modulate cell-type-specific splicing patterns by altering their interaction landscape with RNA-binding proteins. Genes (Basel). 2019;10:8. doi:10.3390/genes10080593
17. Zheng J, Liu X, Wang P, et al. CRNDE promotes malignant progression of glioma by attenuating miR-384/PIWIL4/STAT3 axis. Mol Ther. 2016;24(7):1199–1215. doi:10.1038/mt.2016.71
18. Sa L, Li Y, Zhao L, et al. The role of HOTAIR/miR-148b-3p/USF1 on regulating the permeability of BTB. Front Mol Neurosci. 2017;10:194. doi:10.3389/fnmol.2017.00194
19. Li W, Notani D, Ma Q, et al. Functional roles of enhancer RNAs for oestrogen-dependent transcriptional activation. Nature. 2013;498(7455):516–520. doi:10.1038/nature12210
20. Lin A, Li C, Xing Z, et al. The LINK-A lncRNA activates normoxic HIF1alpha signalling in triple-negative breast cancer. Nat Cell Biol. 2016;18(2):213–224. doi:10.1038/ncb3295
21. Huang JZ, Chen M, Chen D, et al. A peptide encoded by a putative lncRNA HOXB-AS3 suppresses colon cancer growth. Mol Cell. 2017;68(1):171–84.e6. doi:10.1016/j.molcel.2017.09.015
22. Wang Q, Zhang J, Liu Y, et al. A novel cell cycle-associated lncRNA, HOXA11-AS, is transcribed from the 5-prime end of the HOXA transcript and is a biomarker of progression in glioma. Cancer Lett. 2016;373(2):251–259. doi:10.1016/j.canlet.2016.01.039
23. Chen Q, Cai J, Wang Q, et al. Long noncoding RNA NEAT1, regulated by the EGFR pathway, contributes to glioblastoma progression through the WNT/beta-catenin pathway by scaffolding EZH2. Clin Cancer Res. 2018;24(3):684–695. doi:10.1158/1078-0432.CCR-17-0605
24. Wang Z, Jensen MA, Zenklusen JC. A practical guide to The Cancer Genome Atlas (TCGA). Methods Mol Biol. 2016;1418:111–141.
25. Lonsdale J, Thomas J, Salvatore M. The Genotype-Tissue Expression (GTEx) project. Nat Genet. 2013;45(6):580–585. doi:10.1038/ng.2653
26. Wu P, Cai J, Chen Q, et al. Lnc-TALC promotes O(6)-methylguanine-DNA methyltransferase expression via regulating the c-Met pathway by competitively binding with miR-20b-3p. Nat Commun. 2019;10(1):2045. doi:10.1038/s41467-019-10025-2
27. Li G, Liu T, Zhang B, Chen W, Ding Z. Genome-wide identification of a competing endogenous RNA network in cholangiocarcinoma. J Cell Biochem. 2019;120(11):18995–19003. doi:10.1002/jcb.v120.11
28. Song L, Zhang S, Duan C, et al. Genome-wide identification of lncRNAs as novel prognosis biomarkers of glioma. J Cell Biochem. 2019. doi:10.1002/jcb.29259
29. Chen L, Wang Y, He J, Zhang C, Chen J, Shi D. Long non-coding RNA H19 promotes proliferation and invasion in human glioma cells by downregulating miR-152. Oncol Res. 2018. doi:10.3727/096504018X15178768577951
30. Zhao H, Peng R, Liu Q, et al. The lncRNA H19 interacts with miR-140 to modulate glioma growth by targeting iASPP. Arch Biochem Biophys. 2016;610:1–7. doi:10.1016/j.abb.2016.09.014
31. Li C, Lei B, Huang S, et al. H19 derived microRNA-675 regulates cell proliferation and migration through CDK6 in glioma. Am J Transl Res. 2015;7(10):1747–1764.
32. Jia P, Cai H, Liu X, et al. Long non-coding RNA H19 regulates glioma angiogenesis and the biological behavior of glioma-associated endothelial cells by inhibiting microRNA-29a. Cancer Lett. 2016;381(2):359–369. doi:10.1016/j.canlet.2016.08.009
33. Zheng J, Li XD, Wang P, et al. CRNDE affects the malignant biological characteristics of human glioma stem cells by negatively regulating miR-186. Oncotarget. 2015;6(28):25339–25355. doi:10.18632/oncotarget.4509
34. Luo W, Li X, Song Z, Zhu X, Zhao S. Long non-coding RNA AGAP2-AS1 exerts oncogenic properties in glioblastoma by epigenetically silencing TFPI2 through EZH2 and LSD1. Aging (Albany NY). 2019;11(11):3811–3823. doi:10.18632/aging.v11i11
35. Chen J, Peng X, Dai Y. The Long Non-Coding RNA (lncRNA) AGAP2-AS1 is upregulated in ovarian carcinoma and negatively regulates lncRNA MEG3. Med Sci Monit. 2019;25:4699–4704. doi:10.12659/MSM.914766
36. Shao S, Wang C, Wang S, Zhang H, Zhang Y. LncRNA STXBP5-AS1 suppressed cervical cancer progression via targeting miR-96-5p/PTEN axis. Biomed Pharmacother. 2019;117:109082. doi:10.1016/j.biopha.2019.109082
37. Cen D, Huang H, Yang L, Guo K, Zhang J. Long noncoding RNA STXBP5-AS1 inhibits cell proliferation, migration, and invasion through inhibiting the PI3K/AKT signaling pathway in gastric cancer cells. Onco Targets Ther. 2019;12:1929–1936. doi:10.2147/OTT.S194463
38. Huang J, Xie N, Huang H, Yao J, Hu W. Long noncoding RNA STXBP5-AS1 inhibits cell proliferation, migration, and invasion via preventing the PI3K/AKT against STXBP5 expression in non-small-cell lung carcinoma. J Cell Biochem. 2018.
39. Yang F, Lyu S, Dong S, Liu Y, Zhang X, Wang O. Expression profile analysis of long noncoding RNA in HER-2-enriched subtype breast cancer by next-generation sequencing and bioinformatics. Onco Targets Ther. 2016;9:761–772. doi:10.2147/OTT.S97664
40. Song J, Zhang W, Wang S, Liu K, Song F, Ran L. A panel of 7 prognosis-related long non-coding RNAs to improve platinum-based chemoresistance prediction in ovarian cancer. Int J Oncol. 2018;53(2):866–876. doi:10.3892/ijo.2018.4403
 © 2020 The Author(s). This work is published and licensed by Dove Medical Press Limited. The full terms of this license are available at https://www.dovepress.com/terms.php and incorporate the Creative Commons Attribution - Non Commercial (unported, v3.0) License.
By accessing the work you hereby accept the Terms. Non-commercial uses of the work are permitted without any further permission from Dove Medical Press Limited, provided the work is properly attributed. For permission for commercial use of this work, please see paragraphs 4.2 and 5 of our Terms.
© 2020 The Author(s). This work is published and licensed by Dove Medical Press Limited. The full terms of this license are available at https://www.dovepress.com/terms.php and incorporate the Creative Commons Attribution - Non Commercial (unported, v3.0) License.
By accessing the work you hereby accept the Terms. Non-commercial uses of the work are permitted without any further permission from Dove Medical Press Limited, provided the work is properly attributed. For permission for commercial use of this work, please see paragraphs 4.2 and 5 of our Terms.