")
Back to Journals » OncoTargets and Therapy » Volume 12
Identification of novel biomarkers and candidate small molecule drugs in non-small-cell lung cancer by integrated microarray analysis
Authors Wu Q, Zhang B, Sun Y, Xu R, Hu X, Ren S, Ma Q, Chen C, Shu J, Qi F, He T, Wang W, Wang Z
Received 18 December 2018
Accepted for publication 21 March 2019
Published 13 May 2019 Volume 2019:12 Pages 3545—3563
DOI https://doi.org/10.2147/OTT.S198621
Checked for plagiarism Yes
Review by Single anonymous peer review
Peer reviewer comments 2
Editor who approved publication: Prof. Dr. Takuya Aoki
Qiong Wu,1,2,* Bo Zhang,1,2,* Yidan Sun,3 Ran Xu,1 Xinyi Hu,4 Shiqi Ren,4 Qianqian Ma,5 Chen Chen,6 Jian Shu,7 Fuwei Qi,7 Ting He,7 Wei Wang,2 Ziheng Wang2
1Medical School of Nantong University, Nantong 226001, People’s Republic of China; 2The Hand Surgery Research Center, Department of Hand Surgery, Affiliated Hospital of Nantong University, Nantong 226001, People’s Republic of China; 3Department of Oncology, First Teaching Hospital of Tianjin University of Traditional Chinese Medicine, Tianjin 300193, People’s Republic of China; 4Department of Biochemistry & Molecular Biology, Nantong University, Nantong, Jiangsu 226001, People’s Republic of China; 5Emergency Office, Wuxi Center for Disease Control and Prevention, Wuxi 214023, People’s Republic of China; 6Department of Oncology, The Affiliated Cancer Hospital of Nanjing Medical University, Nanjing, People’s Republic of China; 7The First People‘s Hospital of Taicang City, Taicang Affiliated Hospital of Soochow University, Suzhou 215400, People’s Republic of China
*These authors contributed equally to this work
Background: Non-small-cell lung cancer (NSCLC) remains the leading cause of cancer morbidity and mortality worldwide. In the present study, we identified novel biomarkers associated with the pathogenesis of NSCLC aiming to provide new diagnostic and therapeutic approaches for NSCLC.
Methods: The microarray datasets of GSE18842, GSE30219, GSE31210, GSE32863 and GSE40791 from Gene Expression Omnibus database were downloaded. The differential expressed genes (DEGs) between NSCLC and normal samples were identified by limma package. The construction of protein–protein interaction (PPI) network, module analysis and enrichment analysis were performed using bioinformatics tools. The expression and prognostic values of hub genes were validated by GEPIA database and real-time quantitative PCR. Based on these DEGs, the candidate small molecules for NSCLC were identified by the CMap database.
Results: A total of 408 overlapping DEGs including 109 up-regulated and 296 down-regulated genes were identified; 300 nodes and 1283 interactions were obtained from the PPI network. The most significant biological process and pathway enrichment of DEGs were response to wounding and cell adhesion molecules, respectively. Six DEGs (PTTG1, TYMS, ECT2, COL1A1, SPP1 and CDCA5) which significantly up-regulated in NSCLC tissues, were selected as hub genes according to the results of module analysis. The GEPIA database further confirmed that patients with higher expression levels of these hub genes experienced a shorter overall survival. Additionally, CMap predicted the 20 most significant small molecules as potential therapeutic drugs for NSCLC. DL-thiorphan was the most promising small molecule to reverse the NSCLC gene expression.
Conclusions: Based on the gene expression profiles of 696 NSCLC samples and 237 normal samples, we first revealed that PTTG1, TYMS, ECT2, COL1A1, SPP1 and CDCA5 could act as the promising novel diagnostic and therapeutic targets for NSCLC. Our work will contribute to clarifying the molecular mechanisms of NSCLC initiation and progression.
Keywords: non-small-cell lung cancer, novel biomarkers, candidate small molecules, prognosis, bioinformatics analysis
Introduction
Lung cancer remains the leading cause of cancer morbidity and mortality worldwide. In 2018, there are 234,030 newly diagnosed lung cancer patients, accounting for 13.5% of all types of malignant tumors. In addition, lung cancer results in approximately 154,050 death cases each year, accounting for 25.3% of all cancer-related deaths; 80–85% of all lung cancer patients are diagnosed with non-small-cell lung cancer (NSCLC) subtype and 80% lung cancer-associated deaths are caused by NSCLC. The subtypes of NSCLC mainly consist of lung adenocarcinoma, lung squamous cell carcinoma and large cell lung cancer based on histological sub-classification.1–4 Although great advance has been made in the therapeutic methods for NSCLC such as surgical resection, chemotherapy, radiotherapy and targeted therapy, the patients’ prognosis is still far from ideal, with 5-year survival rate less than 20%. For advanced patients who are inoperable, chemotherapy such as platinum still remains the most ideal and important treatment strategy for NSCLC.5–7 The poor long-term survival rate of NSCLC patients is mainly attributed to the lack of specific symptoms and effective diagnostic methods at an early stage. In additionally, high metastasis rate and drug resistance are also vital factors that can not be ignored.8–10 In recent years, with our increased understanding of molecular characterization of NSCLC, molecular targeting therapies especially individualized precision treatment have undergone remarkable developments.11,12 Despite the prominent progress in the molecular diagnosis and treatment for NSCLC, substantive breakthroughs have not yet been made in patients’ survival.13 Therefore, there is still an urgent demand to identify the novel biomarkers correlated with NSCLC diagnosis and prognosis to elucidate the precise molecular mechanism of NSCLC occurrence and progression. In this study, the microarray data of GSE18842, GSE30219, GSE31210, GSE32863 and GSE40791 from Gene Expression Omnibus (GEO) database was used to identify the differential expressed genes (DEGs) between NSCLC and adjacent normal tissues. Gene Ontology (GO) and pathway enrichment analysis were performed to better understand the biological functions of these DEGs. We also established a protein–protein interaction (PPI) network associated the DEGs. Furthermore, we also identified potential candidate small molecules for a better treatment of NSCLC. Six novel biomarkers were found to be related to the pathogenesis and prognosis of NSCLC. In summary, this study aimed to exploit promising novel biomarkers for NSCLC diagnosis, prognosis and molecular targeting therapies from new insights. Figure 1 shows the workflow of our study.
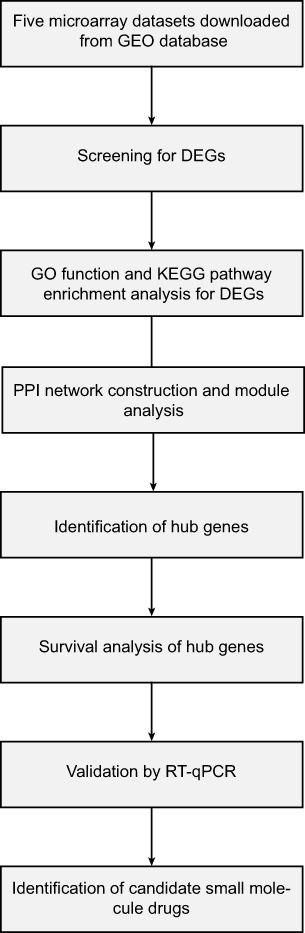 | Figure 1 The workflow of this study. |
Materials and methods
Data resources
Series matrix files of GSE18842, GSE30219, GSE31210, GSE32863 and GSE40791 were downloaded from GEO database (
Screening for DEGs
The matrix data of each dataset was performed log2 conversion and normalization using limma package of R/Bioconductor software.14 The limma package was also utilized to screen and identify the DEGs between NSCLC samples and normal tissue sample. Adjust P-value <0.05 and |log2FC| >1 were considered the statistical significance of differential expression.
Functional enrichment analysis
GO and Kyoto Encyclopedia of Genes and Genomes (KEGG) pathway enrichment analysis were performed to determine the biological functions of the overlapping DEGs. GO enrichment analysis is an extensively used method to investigate the molecular function (MF), cell component (CC) and biological process (BP) of genes or gene products. KEGG is a widely used database for systematic analysis of high-level gene functions. In this study, we carried out GO function and KEGG pathway enrichment analysis based on the platform of Database for Annotation Visualization and Integrated Discovery (DAVID,
Protein–protein interaction (PPI) network construction and module analysis
We used the online database STRING (Search Tool for the Retrieval of Interacting Genes,
Survival analysis and validation of hub genes
To further explore the roles of module genes in the NSCLC occurrence and development, we predicted the co-expression genes of module genes and the co-expression network was constructed by cBioPortal online platform (
Identification of small molecules
The CMap database (
Real-time quantitative PCR
Total RNA from tumor tissues and non-tumorous tissues was extracted with Trizol reagent (Invitrogen, Carlsbad, CA, USA) according to the protocol. cDNA was synthesized using an Omniscript Reverse Transcription kit (Qiagen, Valencia, CA, USA). Quantitative real-time PCR (qPCR) assays were performed using EvaGreen Master Mix (Biotium Inc., Hayward, CA, USA). The conditions for qPCR amplification were as follows: 95°C for 120 s followed by 40 cycles of 95°C for 15 s, annealing temperature for 45 s. Each sample was run in triplicate. Relative expression level for each target gene was normalized by the Ct value of GAPDH (endogenous reference) using a 2−ΔΔCt relative quantification method. The primers are as follows:
PTTG1 gene 5ʹ-GACTCAGGCTGGAAGATTTG-3ʹ (sense) and 5ʹ- GGGAAGGTGGGAGAAGC-3ʹ (anti-sense).
CDCA5 gene 5ʹ-TTTTCAGTTCCGTGGGTTTC-3ʹ (sense) and 5ʹ-CCCAACTAAGGCTCCCTACAT-3ʹ (anti-sense).
TYMS gene 5ʹ-AGCGAGAACCCAGACCTT-3ʹ (sense) and 5ʹ-AATAGTTGGATGCGGATTGTA-3ʹ (anti-sense).
ECT2 gene 5ʹ-AGGCGGAATGAACAGGA-3ʹ (sense) and 5ʹ-TTCATCTCCAAGCGGTAAA-3ʹ (anti-sense)
COL1A1 gene 5ʹ-CAAGGTGTTGTGCGATGACG-3ʹ (sense) and 5ʹ-CGACGCCGGTGGTTTCTT-3ʹ (anti-sense)
SPP1 gene 5ʹ-CTGCCAGCAACCGAAGT-3ʹ (sense) and 5ʹ-GTGATGTCCTCGTCTGTAGC-3ʹ (anti-sense);
All reactions were performed on the Eppendorf Mastercycler ep realplex (2S; Eppendorf, Hamburg, Germany). using following cycling parameters, 95°C for 2 min, followed by 40 cycles of 95°C for 15 s, 60°C for 45 s.
Ethics statement
This study was performed with the approval of the institutional ethics committee of the Affiliated Hospital of Nantong University. And written informed consent had been provided for the NSCLC patients included in the present study, which was conducted in accordance with the Declaration of Helsinki.
Results
Identification of DEGs in NSCLC
After integrated bioinformatical analysis for GSE18842, GSE30219, GSE31210, GSE32863 and GSE40791 datasets, a total of 408 overlapping genes were found to be differentially expressed. The volcano plot showed the up-regulated and down-regulated DEGs in each dataset with the cutoff criterion of P<0.05 and |log2FC| >1. The Venn diagrams showed the 408 overlap DEGs among the three datasets (Figure 2Ba) including 109 significantly up-regulated genes (Figure 2Bb) and 296 down-regulated genes (Figure 2Bc).
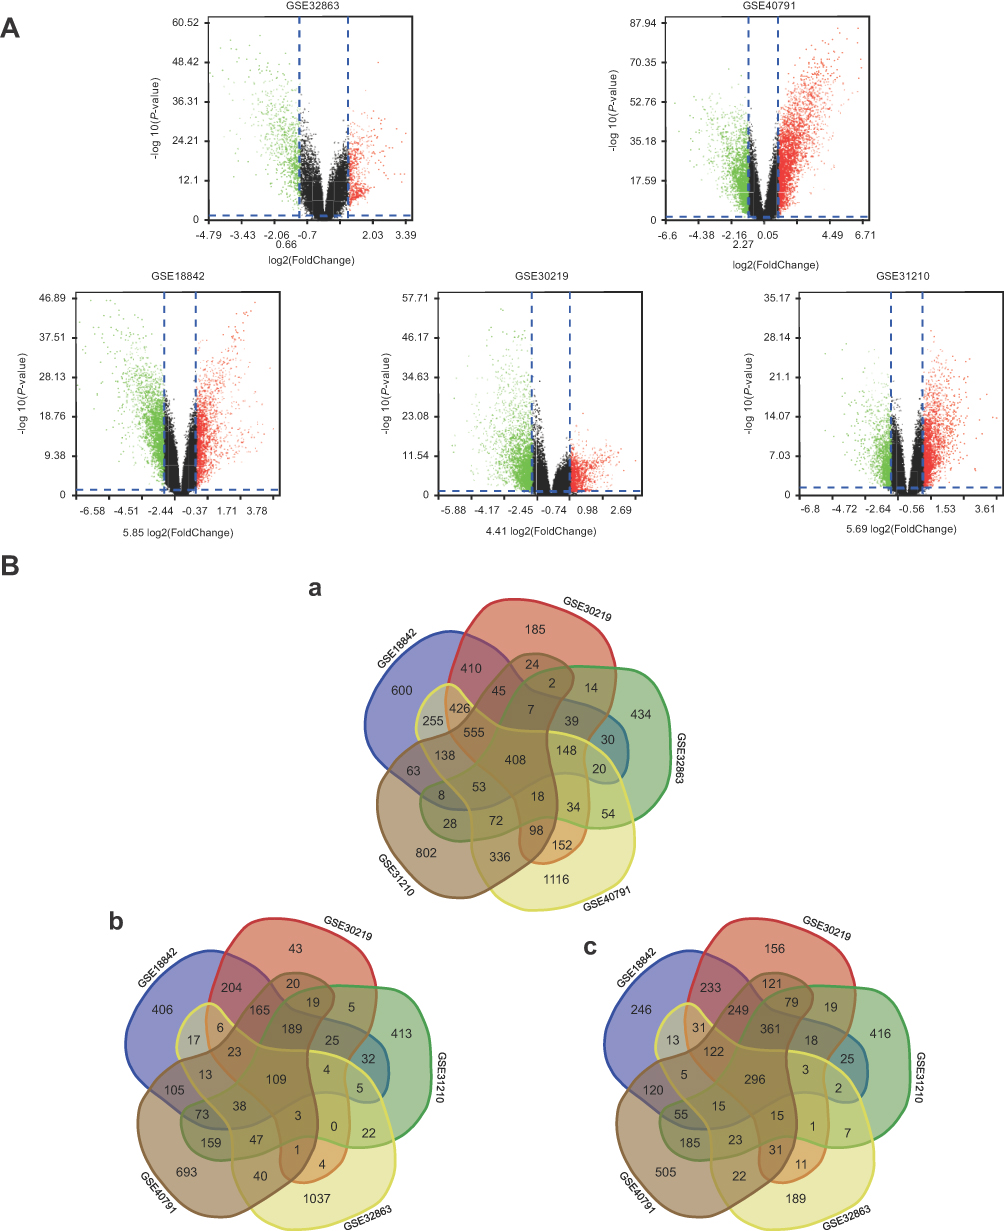 | Figure 2 (A) Volcano plot of gene expression profile data between NSCLC and normal tissues in each dataset. Red dots: significantly up-regulated genes in NSCLC; green dots: significantly down-regulated genes in NSCLC; black dots: non-differentially expressed genes. Adj. P<0.01 and |log2 FC|>1 were considered as significant. (Ba) Venn diagram of 408 overlapping DEGs from GSE18842, GSE30219, GSE31210, GSE32863 and GSE40791 datasets. (Bb) Up-regulated DEGs (Bc) Down-regulated DEGs. |
Enrichment analyses
In order to investigate the biological functions of these DEGs in NSCLC, GO and KEGG pathway, enrichment analysis was performed using DAVID. For BPs, GO analysis results indicated that up-regulated and down-regulated DEGs were significantly enriched in response to wounding, negative regulation of cell proliferation, regulation of cell proliferation, cell adhesion and response to steroid hormone stimulus. CC analysis showed that these DEGs were particularly involved in extracellular region part, extracellular region, extracellular space, proteinaceous extracellular matrix and extracellular matrix. Similarly, changes in MF of DEGs were significantly enriched in carbohydrate binding, growth factor binding, glycosaminoglycan binding, transforming growth factor beta binding and pattern binding. Furthermore, KEGG pathway enrichment analysis revealed that these DEGs were mainly enriched in cell adhesion molecules (CAMs), leukocyte transendothelial migration, TGF-beta signaling pathway, complement and coagulation cascades and ECM-receptor interaction (Figure 3 and Table 1).
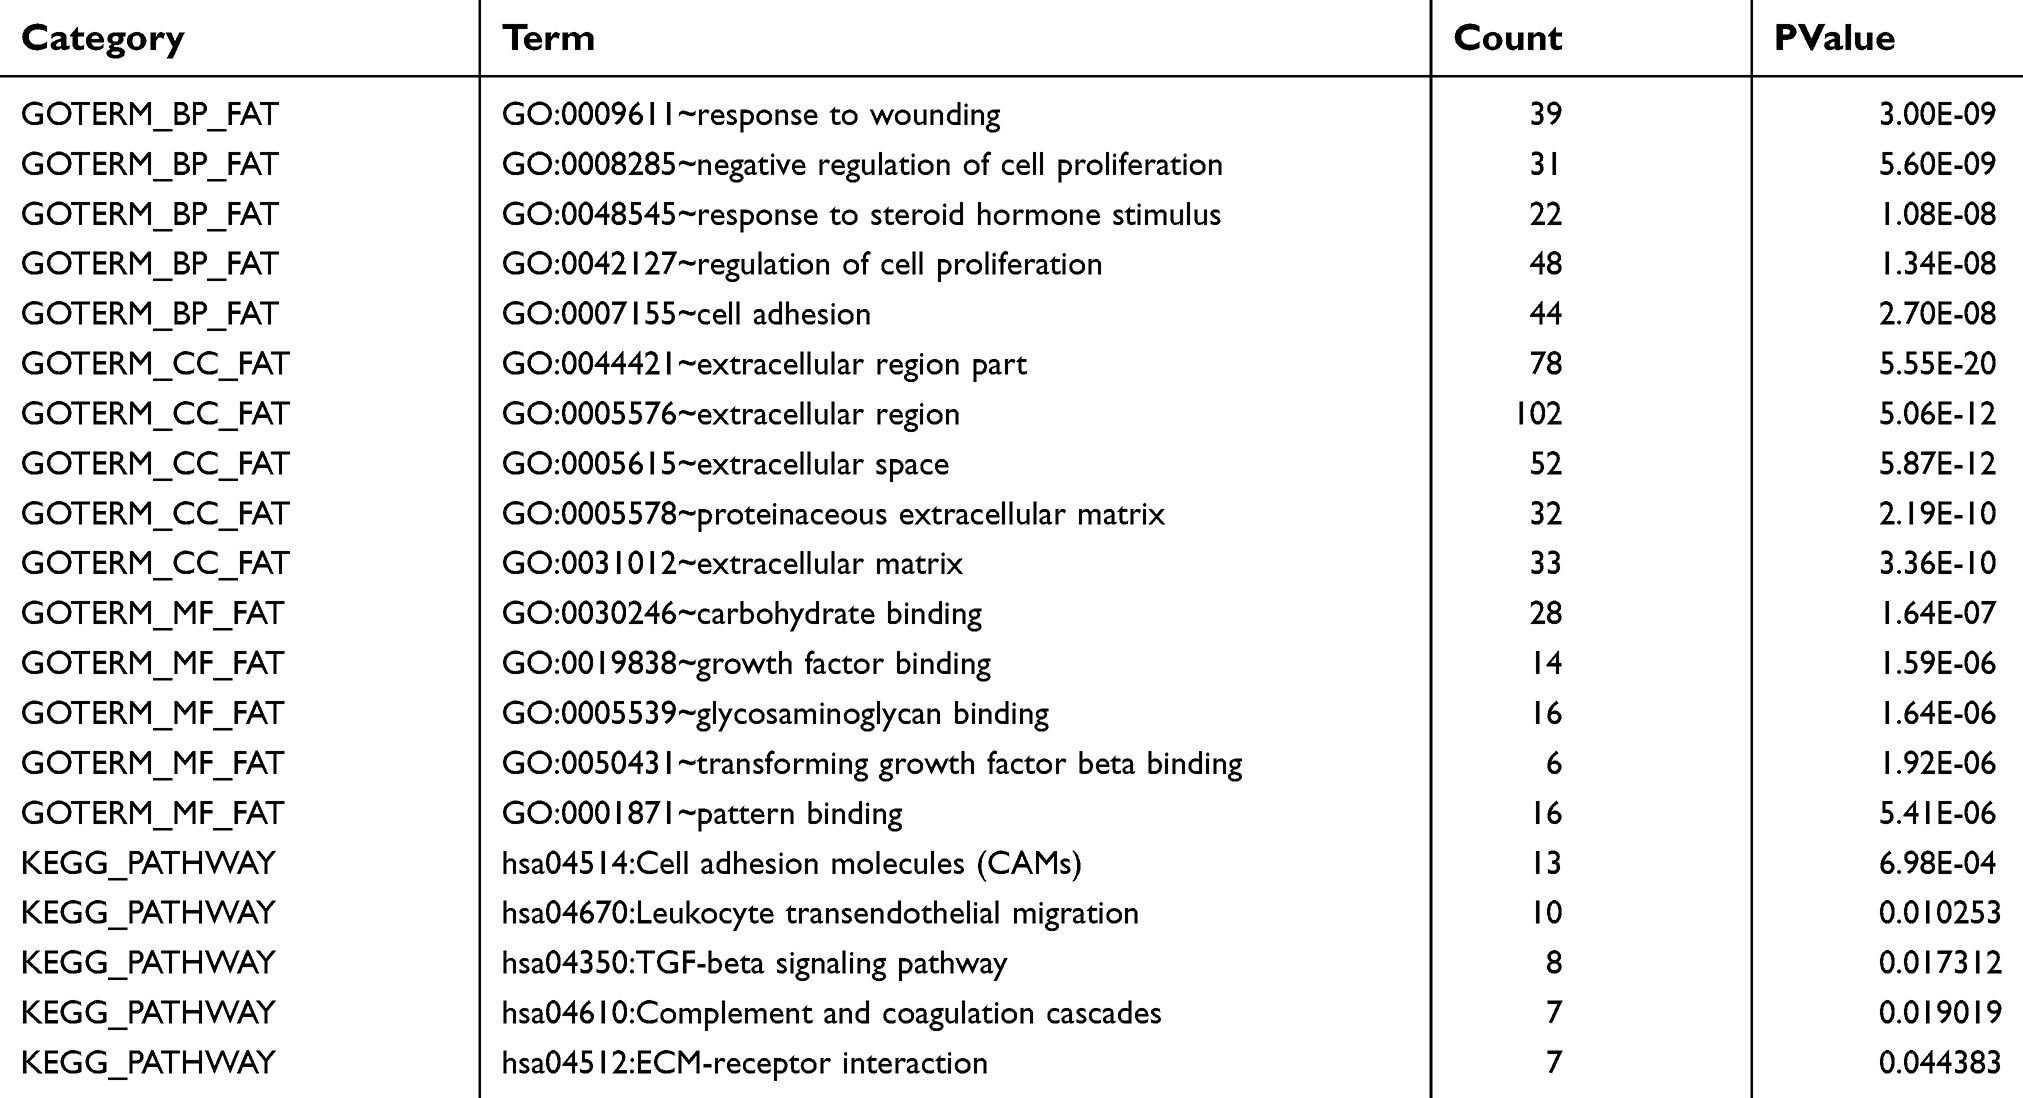 | Table 1. Functional and pathway enrichment analysis of the overlap DEGs |
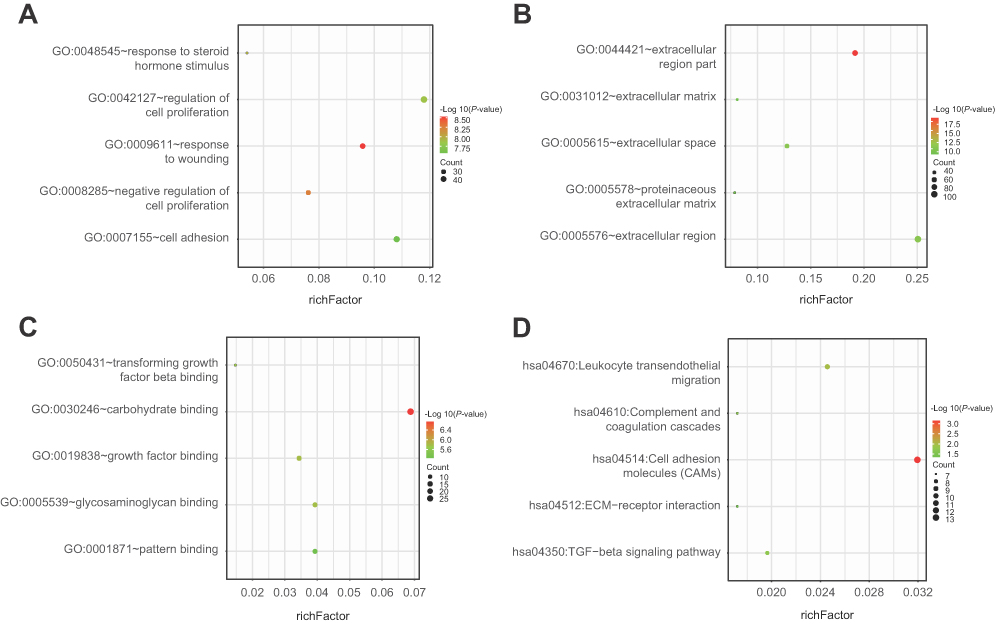 | Figure 3 Functional and signaling pathway analysis of the overlapped DEGs in NSCLC. (A) Biological processes, (B) cellular components, (C) molecular function and (D) KEGG pathway. |
PPI network construction and module analysis
The STRING database and Cytoscape were used to construct a PPI network of the potential interactions between the overlapping DEGs. As presented in Figure 4, there were 300 nodes and 1283 interactions found in the network. The top three significant modules were detected by MCODE (Figure 5). Pathway enrichment analysis suggested that the module1 genes were mainly enriched in DNA replication, cell cycle and oocyte meiosis (Figure 5A). The genes in module 2 were mainly enriched in tumor necrosis factor signaling pathway, CAMs and African trypanosomiasis (Figure 5B). The genes in module 3 were significantly enriched in PPAR signaling pathway, ECM-receptor interaction and Focal adhesion (Figure 5C) (Table 2). The heat map clearly showed the significant difference of module genes between cancer tissues and adjacent tissues(Figure 6A and B). Macromolecular complex subunit organization, S phase and cell cycle phase were the main BP of module genes (Figure 6C). Among the module genes, we selected PTTG1, TYMS, ECT2, COL1A1, SPP1 and CDCA5 with high degree of connectivity as hub genes (Table 3). The expression of hub genes in NSCLC tissues was significantly up-regulated compared to normal tissues.
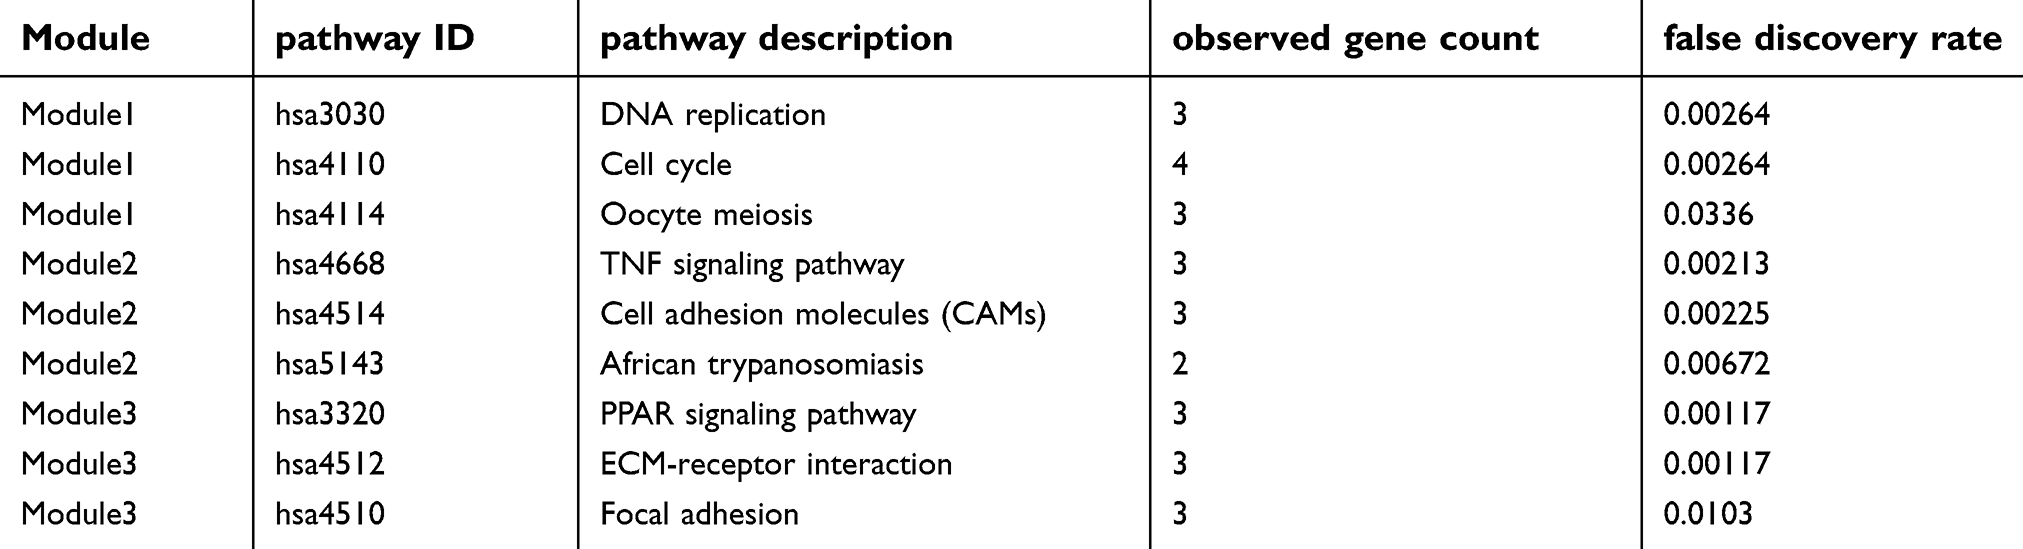 | Table 2 The pathway enrichment analysis of module genes |
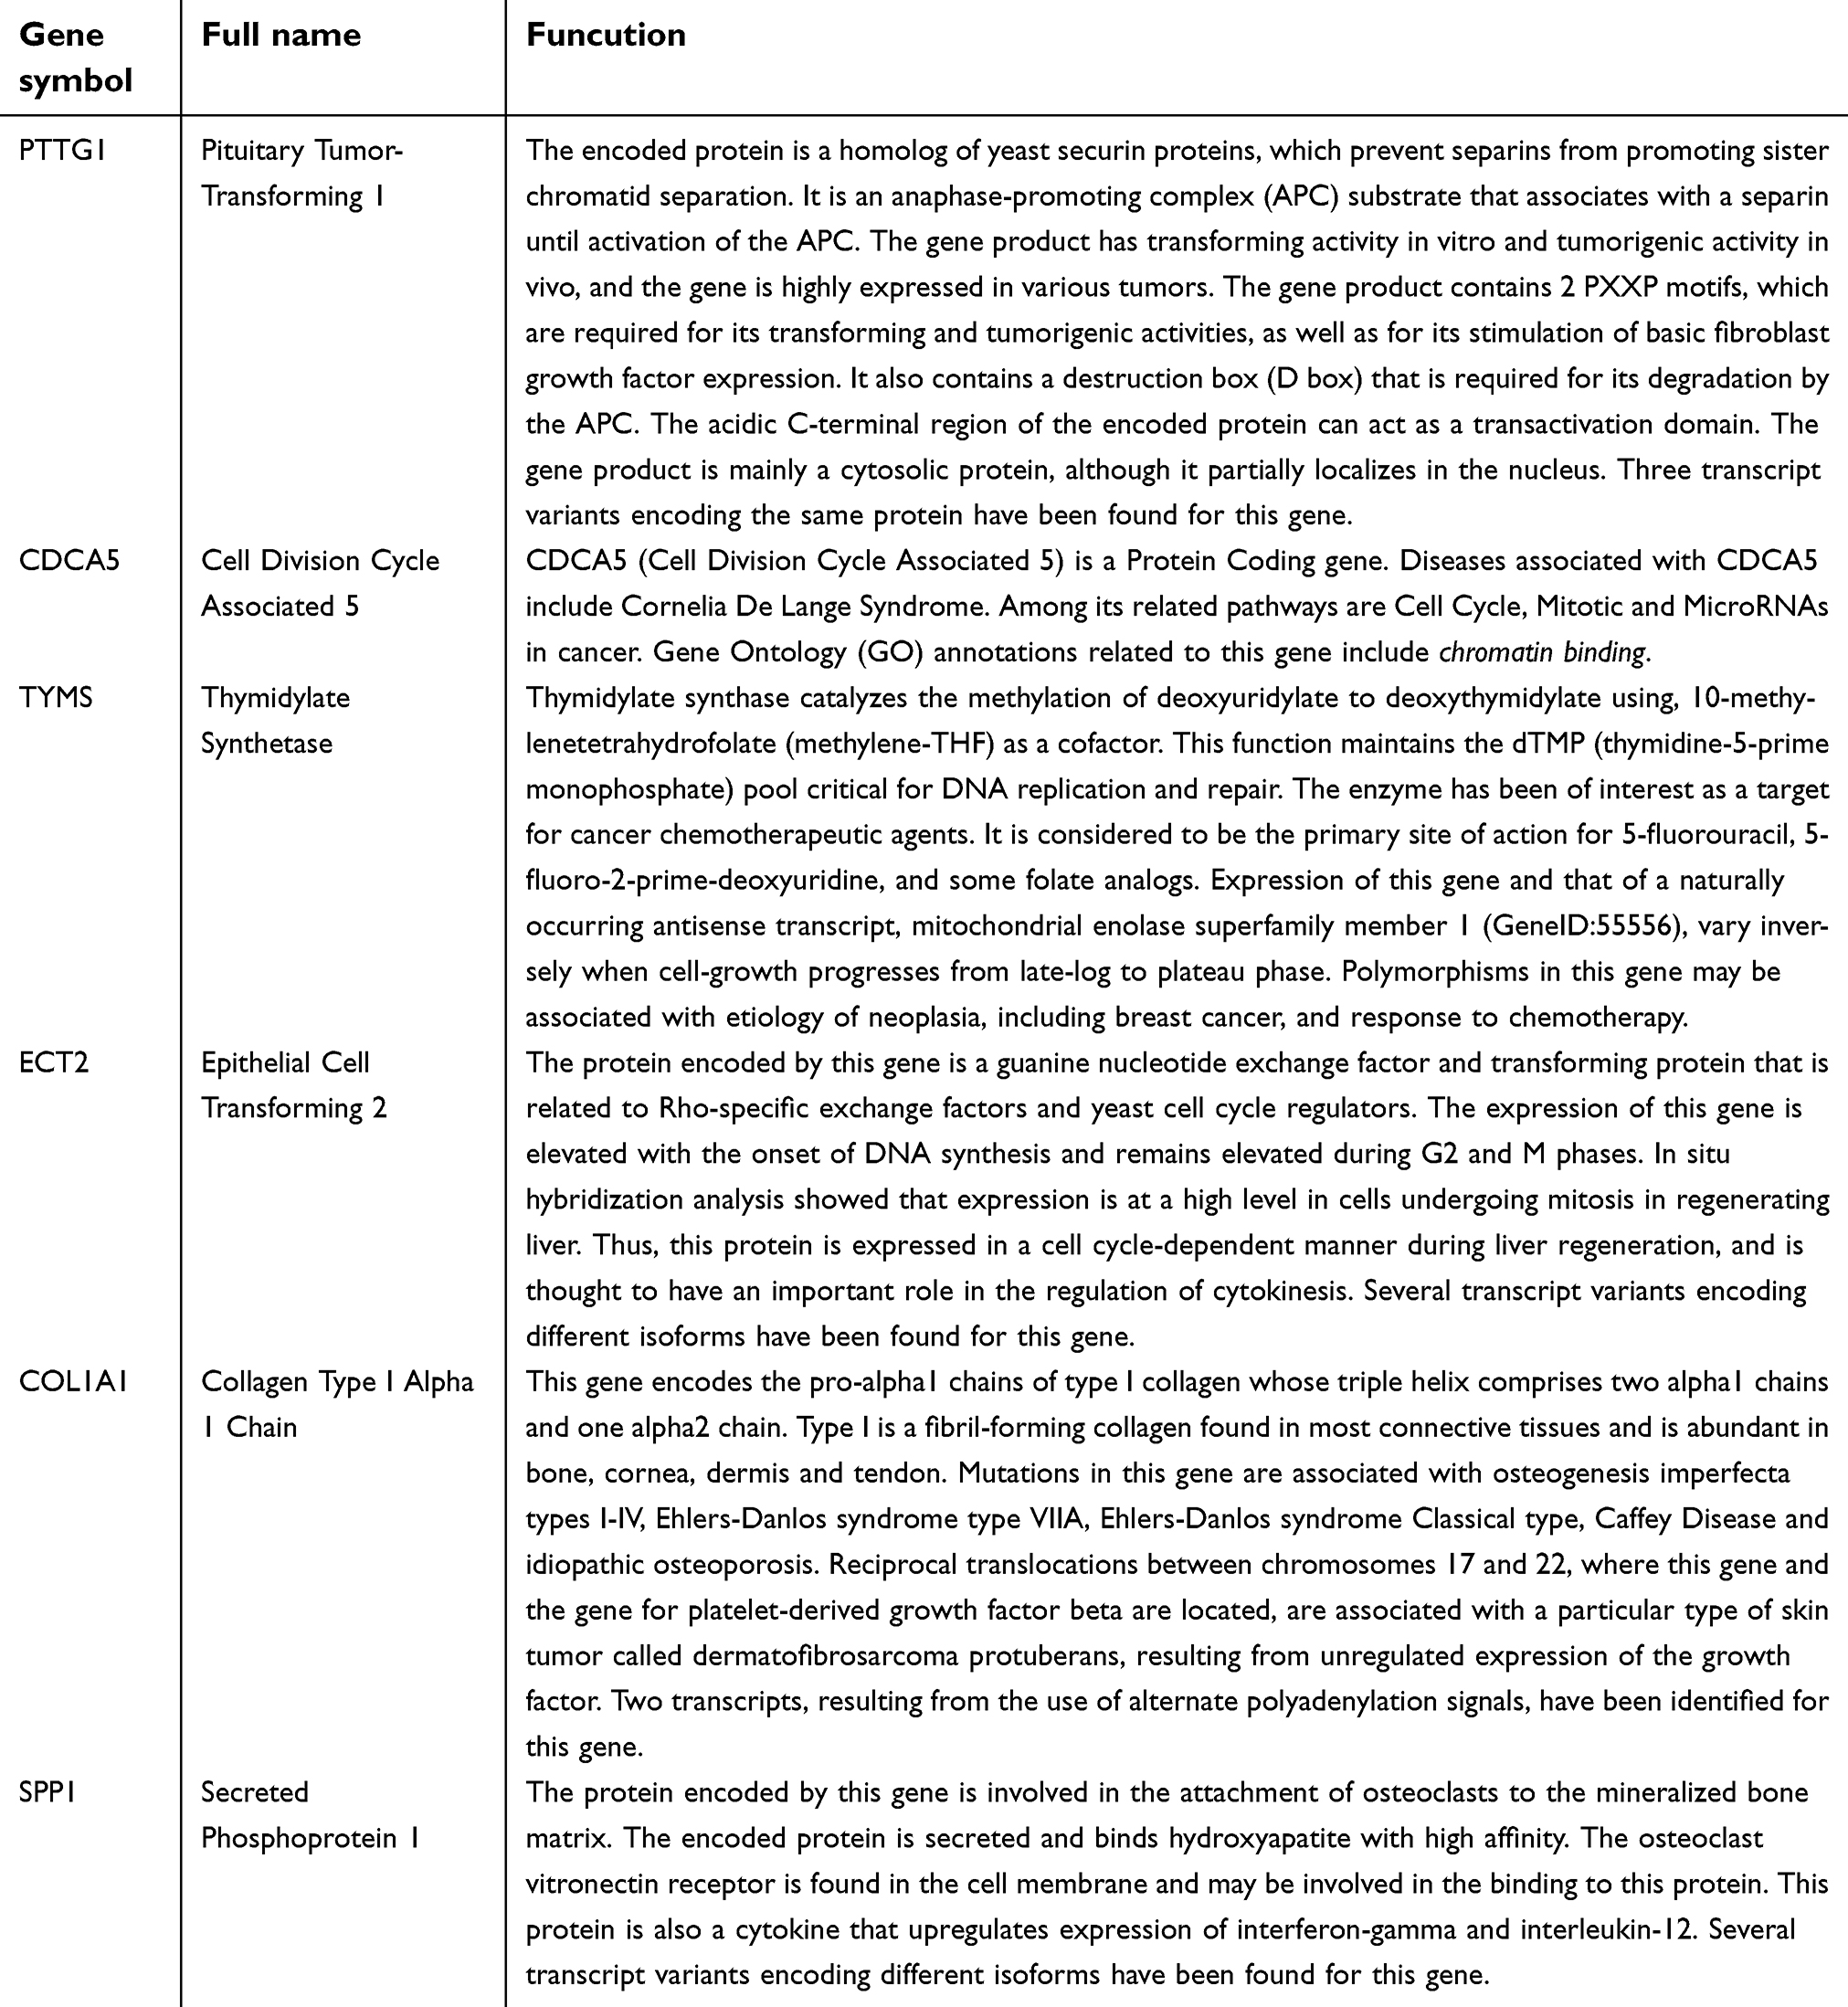 | Table 3 The full name and functional roles of hub genes |
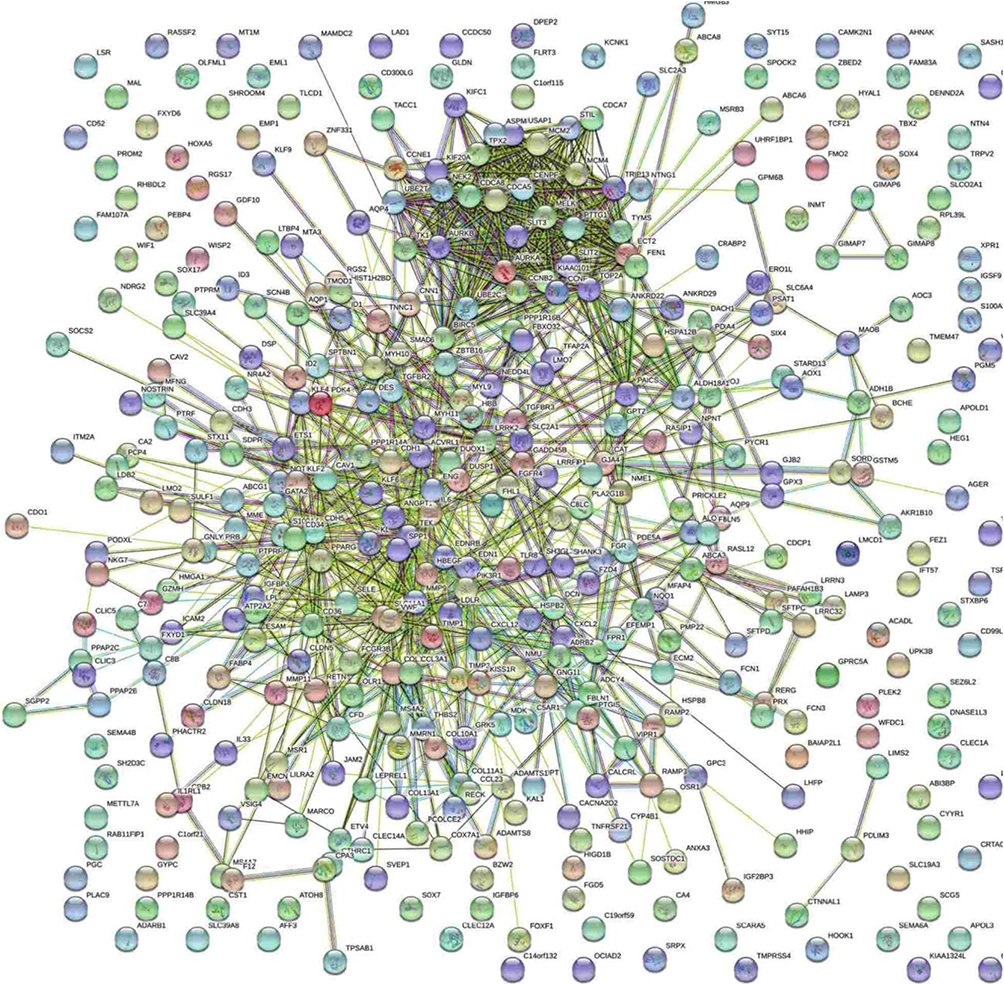 | Figure 4 The protein–protein interaction networks of overlapping DEGs. |
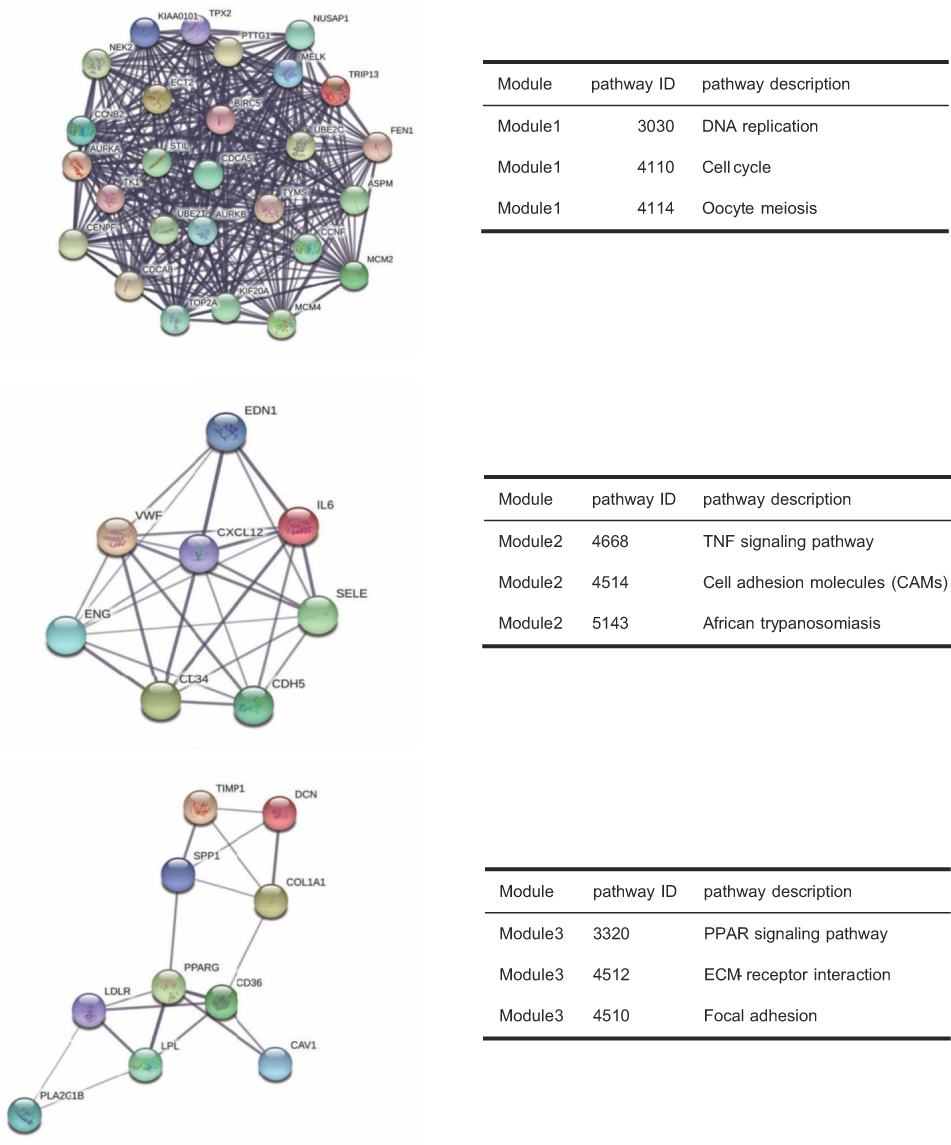 | Figure 5 The three most significant modules extracted from PPI network and KEGG pathway analysis of module genes. |
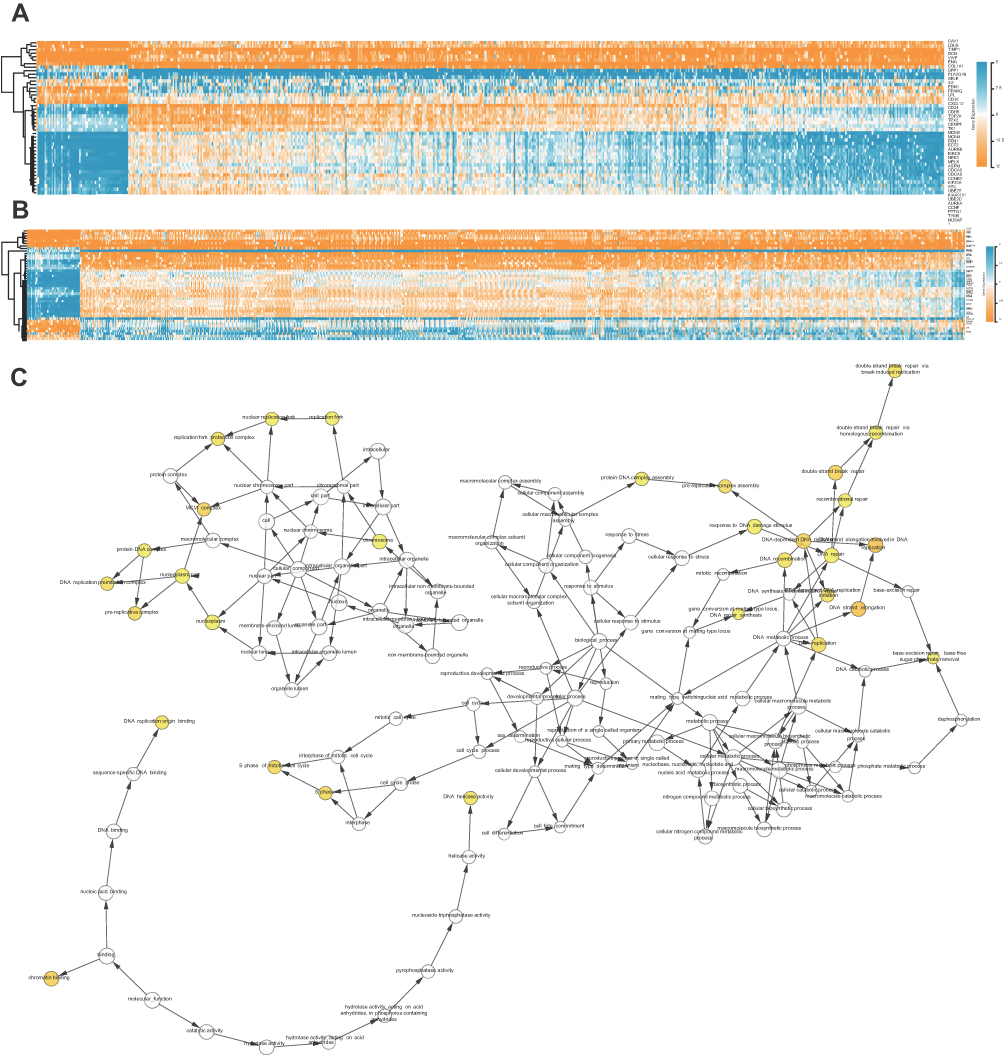 | Figure 6 (A, B) The heatmap of module genes between NSCLC (LUAD and LUSC) and normal samples. (C) The BiNGO revealed the biological process of module genes. The color depth of nodes represents the corrected P-value. The size of nodes represents the number of genes involved. |
Analysis and validation of hub genes
The prognostic information of PTTG1, TYMS, ECT2, COL1A1, SPP1 and CDCA5 was freely obtained from GEPIA database. A total of 962 NSCLC patients were available for survival analysis. It was found that the high expression level of PTTG1, TYMS, ECT2, COL1A1, SPP1 and CDCA5 was markedly associated with worse overall survival for NSCLC patients (Figures 7and 8A). This finding further confirmed the key role of these hub genes in the onset of NSCLC. Based on the immunohistochemical staining results from HPA database, the protein expression level of PTTG1, TYMS, ECT2, COL1A1, SPP1 and CDCA5 was consistent with their gene expression, that is, the protein levels of hub genes were also in a higher expression state in NSCLC tissues compared to normal tissues (Figure 7B). In addition, we established a network of module genes and their co-expression genes (Figure 9A). In summary, PTTG1, TYMS, ECT2, COL1A1, SPP1 and CDCA5 could represent the important diagnostic and prognostic biomarkers for NSCLC.
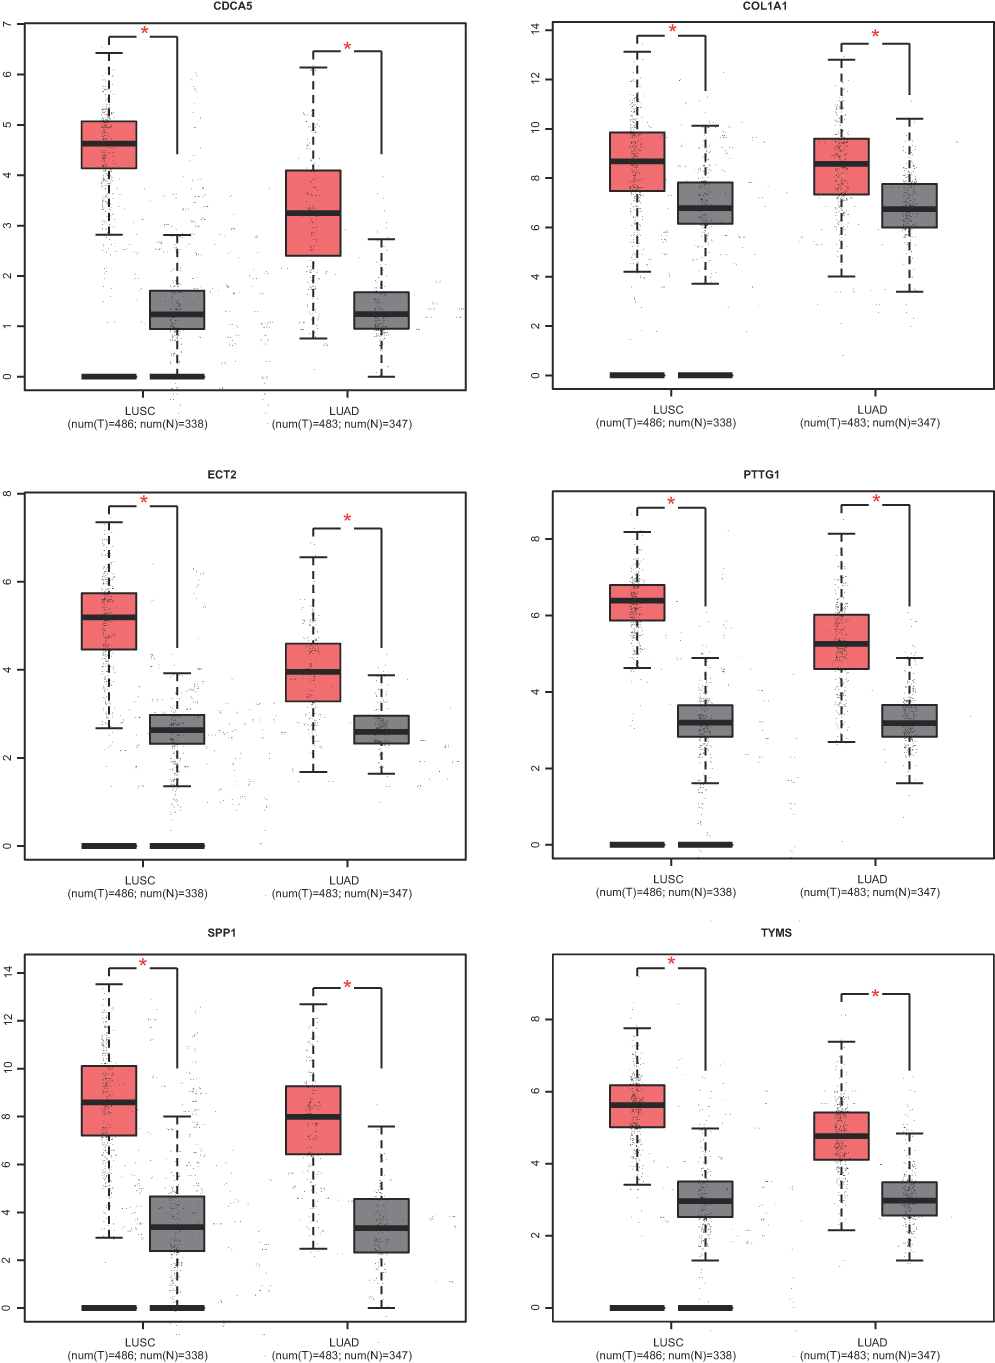 | Figure 7 The expression level of hub genes according to the GEPIA database. |
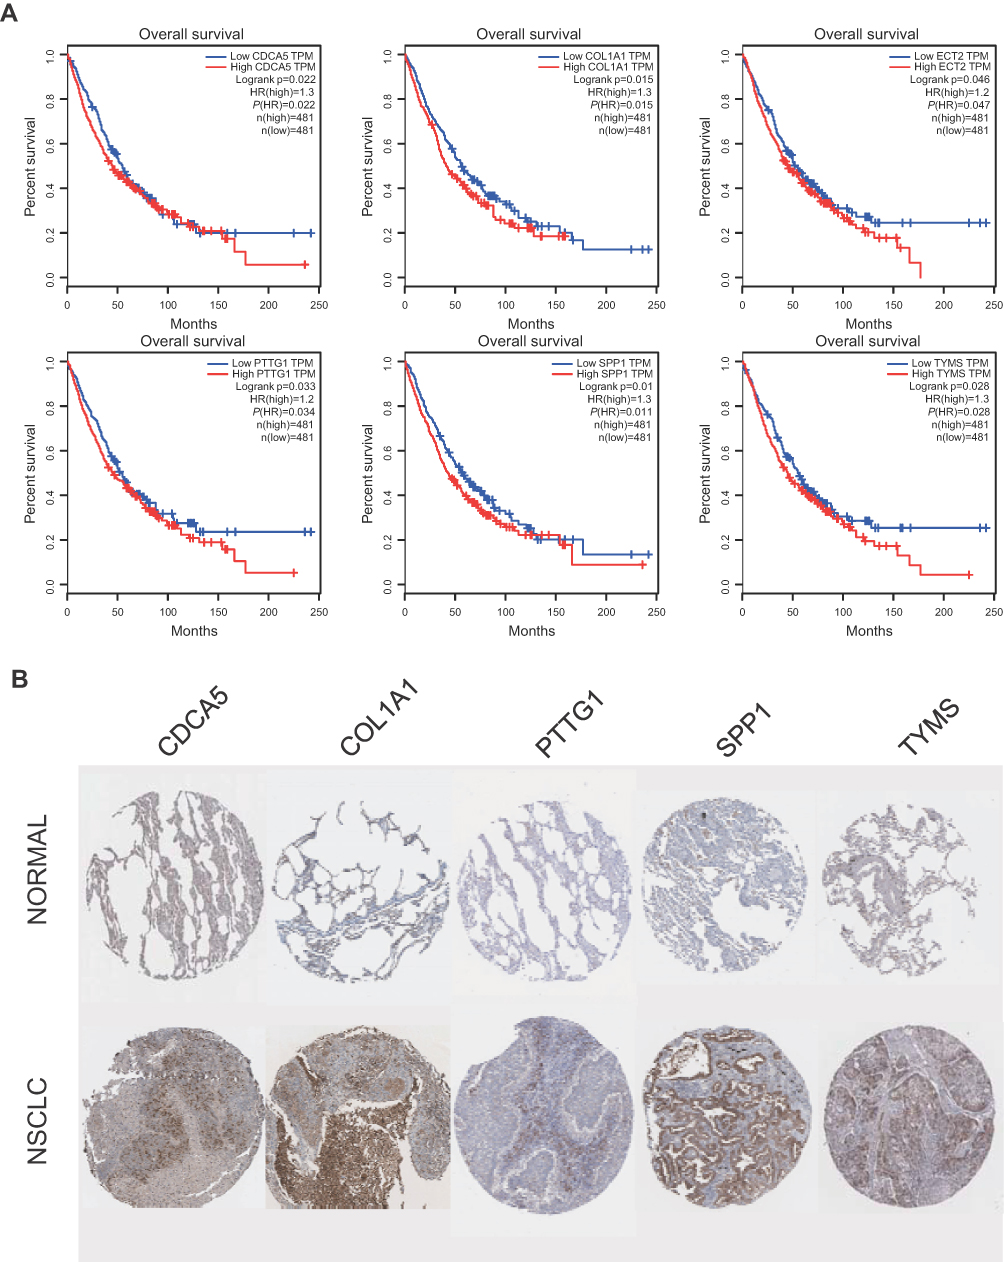 | Figure 8 (A) The survival analysis for hub genes according to the GEPIA database. (B) The protein level expression of hub genes in NSCLC and normal tissues using immunohistochemistry. |
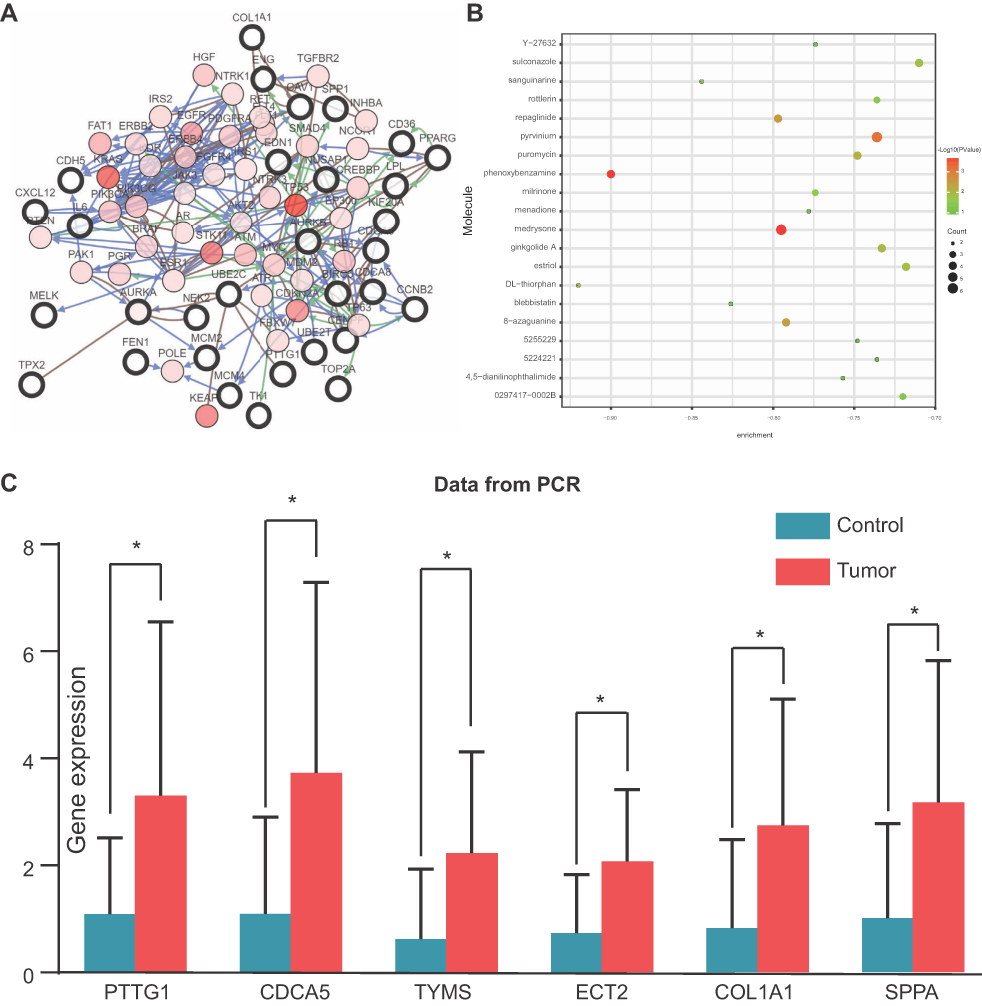 | Figure 9 (A) The network of module genes and their co-expression genes constructed by cBioPortal. Nodes with thick outline: hub genes; nodes with thin outline: co-expression genes. (B) The 20 most small molecules drugs identified by CMap database. (C) qPCR validation of these six hub genes in seven paired NSCLC samples. *P<0.05. |
Identification of related active small molecules
To identify candidate small molecule drugs targeting the gene expression of NSCLC, all the overlapping DEGs, which were divided into up-regulated and down-regulated groups, were submitted to the CMap database. The 20 most significant small molecules matched to the NSCLC gene expression changes are listed in Table 4 and Figure 9B. Among these small molecules, DL-thiorphan (enrichment score = −0.826) and phenoxybenzamine (enrichment score = −0.823) showed a highly significant negative correlation and have the potential to reverse the tumoral status of NSCLC. This analysis provided novel insights into the treatment of NSCLC. However, further studies were still needed to explore the molecular mechanism of these small molecules in NSCLC. To futher investigate the moleuclar mechinism of the hub genes in NSCLCS, we predicted potential transcription factors (Figure S1) and constructed a regulatory network of lncRNA, miRNA and mRNA (Figure S2) by Gene-Cloud Biotechnology Information (GCBI) database.
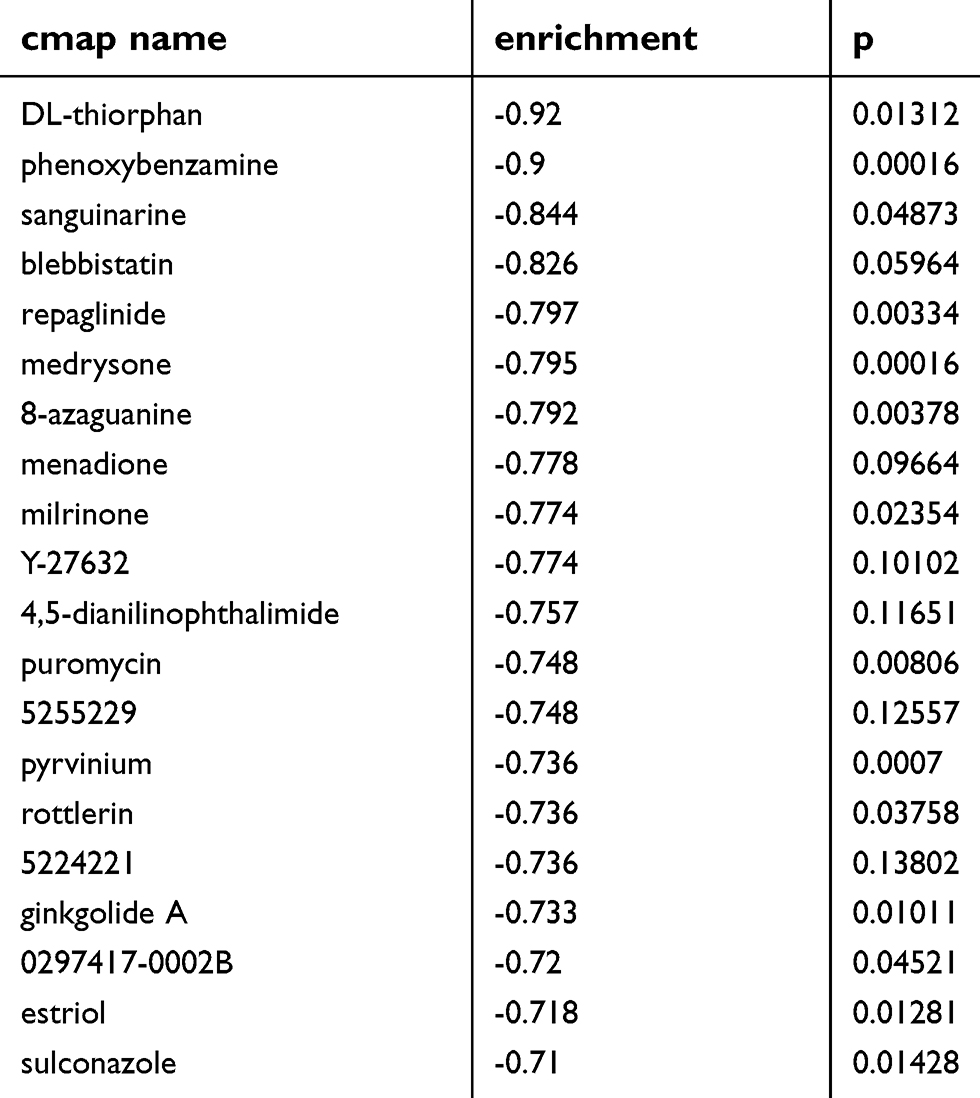 | Table 4 List of the 20 most significant small molecule drugs |
Evaluation of gene expression in NSCLC
To further verify the expression of PTTG1, CDCA5, TYMS, ECT2, COL1A1 and SPP1 genes in NSCLC tissues and corresponding adjacent normal tissues, we choose seven pairs of tumor tissues and corresponding adjacent tissues. Relative expression of PTTG1, CDCA5, TYMS, ECT2, COL1A1 and SPP1 mRNA in NSCLC and adjacent non-tumorous tissues were quantified by qPCR. The results showed that the average PTTG1, CDCA5, TYMS, ECT2, COL1A1 and SPP1 mRNA expression level in NSCLC tissues was significantly higher compared with non-tumorous tissues (*p<0.05, compared with adjacent non-tumorous tissues, Figure 9C).
Discussion
Recently, the rapid advance in microarray and high-throughput technologies has expanded the application biomedicine in clinical practice, such as cancer early diagnosis, novel targeted drug discovery and prognosis prediction. GEO database, as a public repository for archiving high-throughput microarray experimental data, has provided the powerful tools to determine key genes and pathways associated with the pathogenesis of tumors.29,30 In the present study, based on the GEO database, five gene expression profiles including 696 NSCLC samples and 237 normal samples were integrated for a comprehensive bioinformatics analysis. The aim of our study was to find the potential small molecule drugs for the treatment of NSCLC and to identify the novel biomarkers correlated with the pathogenesis and prognosis of NSCLC. A total of 408 overlapping DEGs between tumor tissues and corresponding adjacent normal tissues were identified, which consisted of 109 up-regulated genes and 296 down-regulated genes. For a better in-depth understanding of these overlapping DEGs, the GO function and KEGG pathway enrichment for these DEGs were performed. GO term analysis was carried out via the following aspects: BP, MF and CC. The BP analysis showed that these DEGs were mainly enriched in response to wounding, negative regulation of cell proliferation and regulation of cell proliferation. MF analysis indicated that these DEGs were significantly associated with carbohydrate binding, growth factor binding and glycosaminoglycan binding. Changes in CC were mainly enriched in extracellular region part, extracellular region and extracellular space. The KEGG pathway enrichment analysis revealed nine significant signaling pathways including CAMs, leukocyte transendothelial migration, TGF-beta signaling pathway, complement and coagulation cascades and ECM-receptor interaction. Multiple CAM are involved in the tumor growth, metastasis and angiogenesis. Vascular CAM-1 was first noted as an endothelial cell adhesion receptor for more than two decades, which plays a key role in leukocyte recruitment in cellular immune responses. The L1 cell adhesion molecule (L1CAM), as neural adhesion molecules, extensively participates in the progression of human malignant tumors.31,32 Targeting the TGFβ pathway has been used for various cancer therapy.33,34 An increasing number of studies reveal that the ECM-receptor interaction pathway is significantly associated with the various cancer cells proliferation and invasion. Zhang et al demonstrated that Twist2 is involved in the proliferation and invasion of kidney cancer cells through regulating the expression of two molecules in the ECM-receptor interaction pathway: ITGA6 and CD44.35 In summary, the above theories strongly supported our findings from bioinformatics analysis. The PPI network complex based on DEGs-encoding proteins was constructed and 300 nodes with 1283 interactions were obtained. The MCODE plug-in extracted three modules with the most significant degree from the PPI network. TTG1, TYMS, ECT2, COL1A1, SPP1 and CDCA5 with high degree of connectivity were selected as hub genes. Survival analysis for 962 NSCLC patients from GEPIA database showed that patients with high expression levels of PTTG1, TYMS, ECT2, COL1A1, SPP1 and CDCA5 experienced a worse prognosis than those with low expression. To validate the results of bioinformatics analysis, we performed qPCR analysis to evaluate the expression of hub genes expression in seven paired NSCLC tissues. The qPCR analysis showed the same gene expression trend as found in the GEO database, thereby verifying the reliability of our results. Additionally, the establishment of a network of lncRNA–miRNA–mRNA and the prediction of transcription factors will enhance our understanding of the mechanism of PTTG1, TYMS, ECT2, COL1A1, SPP1 and CDCA5 in the pathogenesis of NSCLC. Previous studies have proved that PTTG1 protein is abundantly expressed in various invasive tumors and hematopoietic malignant tumors, but its expression level is low or undetectable in most normal tissues. Several studies have further emphasized the role of PTTG1 in the growth and metastasis of tumors. They have shown that ectopic expression of PTTG1 enhances proliferation or invasiveness in various histologically derived cancer cell lines, whereas silencing of PTTG1 produces the opposite result.36,37 CDCA5 plays a key role in ensuring the accurate separation of sister chromatids in S and G2/M phases of cell cycle by interacting with coherents and cdk1. Additionally, CDCA5 also interacts with the key regulatory factors ERK and cyclin E1 of G1/Smitotic checkpoint. Recent studies have shown that the expression of CDCA5 in oral squamous cell carcinoma, urothelial cell carcinoma and gastric cancer, which is related to tumorigenesis and tissue invasion.38,39 ECT2 is a guanine nucleotide exchange factor (GEF), which is related to tumor cell differentiation, TNM stage, prognosis and lymph node metastasis, such as breast cancer, osteosarcoma cells, gastric cancer, and gliomas.40,41 COL1A1 is a target gene of miR-133a-3p in oral squamous cell carcinoma and miR-129-5p in gastric cancer.42,43 However, no studies have reported the potential mechanism of ITGB5 and RGS4 in the initiation and progression of NSCLC. The above studies indicated PTTG1, TYMS, ECT2, COL1A1, SPP1 and CDCA5 may also play an important role in the occurrence and development of NSCLC.
In additionally, analyzed with the overlapping DEGs and CMap database, we determined a set of small molecule drugs that had potential to reverse the gene expression changes of NSCLC. The small molecules with a highly significant negative enrichment value may become new targeted drugs for the treatment of NSCLC. DL-thiorphan, as the most significant small molecule (enrichment score = −0.826), was the most promising small molecule to reverse the abnormal NSCLC gene expression. It is worth noting that so far no research has focused on the potential role of this small molecule in NSCLC. Similarly, the relationship between phenoxybenzamine (enrichment score = −0.823) and NSCLC was also not investigated. This information is beneficial for the development of novel targeted drugs for the treatment of NSCLC. Given the emergence of these candidate biomarkers in silico, in vitro studies (with cell lines, etc.) and then in vivo experiments could be worth of interest in functional validation.
Conclusion
In this study, six key genes were identified for the first time in NSCLC by integrated bioinformatics analysis. Survival analysis revealed that high expression levels of PTTG1, TYMS, ECT2, COL1A1, SPP1 and CDCA5 were markedly associated with worse prognosis of patients. These hub genes could act as the promising novel biomarkers for the diagnosis, prognosis and treatment of NSCLC. We also revealed several crucial signaling pathways correlated with the NSCLC initiation and progression. Furthermore, we identified a set of candidate small molecule drugs which could reverse the abnormal gene expression of NSCLC. We hope the present study could provide powerful evidence for the future development of genomic individualized treatment in NSCLC.
Disclosure
The authors report no conflicts of interest in this work.
References
1. Siegel RL, Miller KD, Jemal A. Cancer statistics, 2018. CA Cancer J Clin. 2018;68(1):7–30. doi:10.3322/caac.21442
2. Ulahannan SV, Brahmer JR. Antiangiogenic agents in combination with chemotherapy in patients with advanced non-small cell lung cancer. Cancer Invest. 2011;29(4):325–337. doi:10.3109/07357907.2011.554476
3. Ramalingam SS, Owonikoko TK, Khuri FR. Lung cancer: new biological insights and recent therapeutic advances. CA Cancer J Clin. 2011;61(2):91–112. doi:10.3322/caac.20102
4. Herbst RS, Heymach JV, Lippman SM. Lung cancer. N Engl J Med. 2008;359(13):1367–1380.
5. Boolell V, Alamgeer M, Watkins DN, Ganju V. The evolution of therapies in non-small cell lung cancer. Cancers. 2015;7(3):1815–1846.
6. Khakwani A, Rich AL, Powell HA, et al. Lung cancer survival in England: trends in non-small-cell lung cancer survival over the duration of the national lung cancer audit. Br J Cancer. 2013;109(8):2058–2065.
7. Rothschild SI. [Advanced and metastatic lung cancer - What is new in the diagnosis and therapy?]. Praxis. 2015;104(14):745–750.
8. Song W, Tang Z, Li M, et al. Polypeptide-based combination of paclitaxel and cisplatin for enhanced chemotherapy efficacy and reduced side-effects. Acta Biomater. 2014;10(3):1392–1402.
9. Sibille A, Paulus A, Martin M, et al. [MANAGEMENT OF NON-SMALL CELL LUNG CANCER]. Rev Med Liege. 2015;70(9):432–441.
10. Lu X, Zhou D, Hou B, et al. Dichloroacetate enhances the antitumor efficacy of chemotherapeutic agents via inhibiting autophagy in non-small-cell lung cancer. Cancer Manag Res. 2018;10:1231–1241. doi:10.2147/CMAR.S156530
11. Niu FY, Wu YL. Personalized treatment strategies for non-small-cell lung cancer in Chinese patients: the role of crizotinib. Onco Targets Ther. 2015;8:999–1007. doi:10.2147/OTT.S64664
12. Toro M, Gomez-Lojero C, Montal M, Estrada OS. Charge transfer mediated by nigericin in black lipid membranes. J Bioenerg. 1976;8(1):19–26.
13. Ni M, Liu X, Wu J, et al. Identification of candidate biomarkers correlated with the pathogenesis and prognosis of non-small cell lung cancer via integrated bioinformatics analysis. Front Genet. 2018;9:469. doi:10.3389/fgene.2018.00173
14. Ritchie ME, Phipson B, Wu D, et al. limma powers differential expression analyses for RNA-sequencing and microarray studies. Nucleic Acids Res. 2015;43(7):e47. doi:10.1093/nar/gkv007
15.
16. Ashburner M, Ball CA, Blake JA, et al. Gene ontology: tool for the unification of biology. The Gene Ontology Consortium. Nat Genet. 2000;25(1):25–29. doi:10.1038/75556
17. Kanehisa M, Goto S. KEGG: kyoto encyclopaedia of genes and genomes. Nucleic Acids Res. 2000;28(1):
18. Dennis G
19. Huang DW, Sherman BT, Lempicki RA. Systematic and integrative analysis of large gene lists using DAVID bioinformatics resources. Nat Protoc. 2009;4(1):44–57. doi:10.1038/nprot.2008.211
20. Damian S, Andrea F, Stefan W, et al. STRING v10: protein-protein interaction networks, integrated over the tree of life. Nucleic Acids Res. 2015;43(Database issue):D447. doi:10.1093/nar/gku1003
21. Smoot ME, Ono K, Ruscheinski J, Wang PL, Ideker T. Cytoscape 2.8: new features for data integration and network visualization. Bioinformatics. 2011;27(3):431–432. doi:10.1093/bioinformatics/btq675
22. Bandettini WP, Kellman P, Mancini C, et al. MultiContrast delayed enhancement (MCODE) improves detection of subendocardial myocardial infarction by late gadolinium enhancement cardiovascular magnetic resonance: a clinical validation study. J Cardiovasc Magn Reson. 2012;14:83. doi:10.1186/1532-429X-14-83
23. Maere S, Heymans K, Kuiper M. BiNGO: a cytoscape plugin to assess overrepresentation of gene ontology categories in biological networks. Bioinformatics. 2005;21(16):3448–3449. doi:10.1093/bioinformatics/bti551
24. Cerami E, Gao J, Dogrusoz U, et al. The cBio cancer genomics portal: an open platform for exploring multidimensional cancer genomics data. Cancer Discov. 2012;2(5):401–404. doi:10.1158/2159-8290.CD-12-0095
25. Gao J, Aksoy BA, Dogrusoz U, et al. Integrative analysis of complex cancer genomics and clinical profiles using the cBioPortal. Sci Signal. 2013;6(269):pl1. doi:10.1126/scisignal.2004088
26. Tang Z, Li C, Kang B, Gao G, Li C, Zhang Z. GEPIA: a web server for cancer and normal gene expression profiling and interactive analyses. Nucleic Acids Res. 2017;45(W1):W98–w102. doi:10.1093/nar/gkx247
27. Maier T, Guell M, Serrano L. Correlation of mRNA and protein in complex biological samples. FEBS Lett. 2009;583(24):3966–3973. doi:10.1016/j.febslet.2009.10.036
28. Lamb J, Crawford ED, Peck D, et al. The connectivity map: using gene-expression signatures to connect small molecules, genes, and disease. Science. 2006;313(5795):1929–1935. doi:10.1126/science.1132939
29. Kulasingam V, Diamandis EP. Strategies for discovering novel cancer biomarkers through utilization of emerging technologies. Nat Rev Clin Oncol. 2008;5(10):588–599. doi:10.1038/ncponc1187
30. Edgar R, Domrachev M, Lash AE. Gene expression omnibus: NCBI gene expression and hybridization array data repository. Nucleic Acids Res. 2002;30(1):207–210.
31. Schlesinger M, Bendas G. Vascular cell adhesion molecule-1 (VCAM-1)–an increasing insight into its role in tumorigenicity and metastasis. Int J Cancer. 2015;136(11):2504–2514.
32. Yu X, Yang F, Fu DL, Jin C. L1 cell adhesion molecule as a therapeutic target in cancer. Expert Rev Anticancer Ther. 2016;16(3):359–371.
33. Ahmadi A, Najafi M, Farhood B, Mortezaee K. Transforming growth factor-beta signaling: tumorigenesis and targeting for cancer therapy. J Cell Physiol. 2018.
34. Gotovac JR, Fujihara KM, Phillips WA, Clemons NJ. TGF-beta signaling and its targeted therapy in gastrointestinal cancers. Discov Med. 2018;26(142):103–112.
35. Zhang HJ, Tao J, Sheng L, et al. Twist2 promotes kidney cancer cell proliferation and invasion by regulating ITGA6 and CD44 expression in the ECM-receptor interaction pathway. Onco Targets Ther. 2016;9:1801–1812.
36. Pei L, Melmed S. Isolation and characterization of a pituitary tumor-transforming gene (PTTG). Mol Endocrinol. 1997;11(4):433–441.
37. Panguluri SK, Yeakel C, Kakar SS. PTTG: an important target gene for ovarian cancer therapy. J Ovarian Res. 2008;1(1):6.
38. Chang IW, Lin VC, He HL, et al. CDCA5 overexpression is an indicator of poor prognosis in patients with urothelial carcinomas of the upper urinary tract and urinary bladder. Am J Transl Res. 2015;7(4):710–722.
39. Tokuzen N, Nakashiro K, Tanaka H, Iwamoto K, Hamakawa H. Therapeutic potential of targeting cell division cycle associated 5 for oral squamous cell carcinoma. Oncotarget. 2016;7(3):2343–2353.
40. Jin Y, Yu Y, Shao Q, et al. Up-regulation of ECT2 is associated with poor prognosis in gastric cancer patients. Int J Clin Exp Pathol. 2014;7(12):8724–8731.
41. Sano M, Genkai N, Yajima N, et al. Expression level of ECT2 proto-oncogene correlates with prognosis in glioma patients. Oncol Rep. 2006;16(5):1093–1098.
42. Oleksiewicz U, Liloglou T, Tasopoulou KM, et al. COL1A1, PRPF40A, and UCP2 correlate with hypoxia markers in non-small cell lung cancer. J Cancer Res Clin Oncol. 2017;143(7):1133–1141.
43. Li J, Ding Y, Li A. Identification of COL1A1 and COL1A2 as candidate prognostic factors in gastric cancer. World J Surg Oncol. 2016;14(1):297.
Supplementary materials
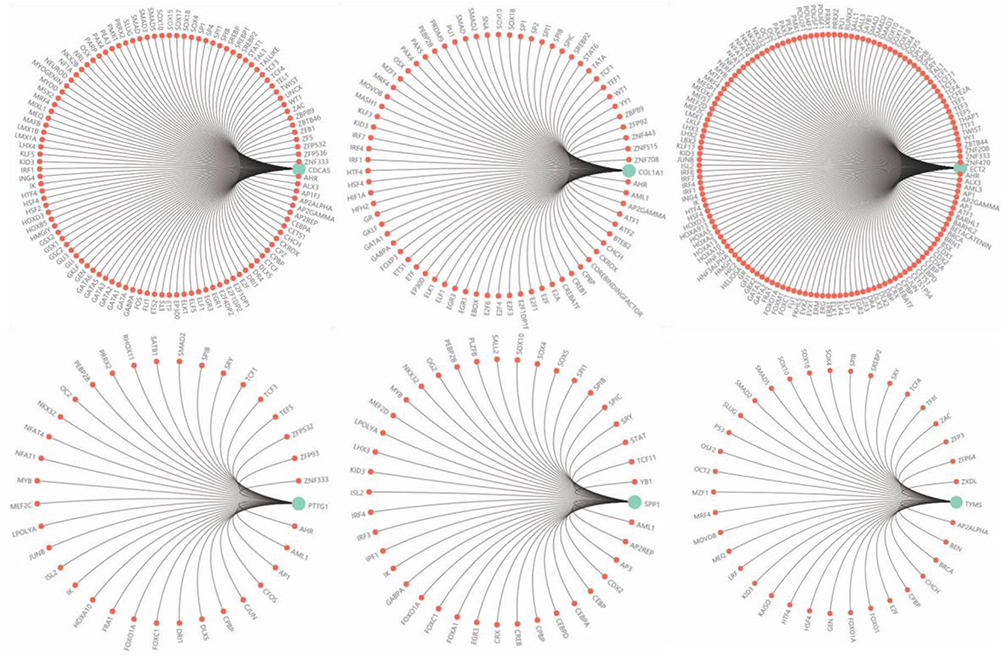 | Figure S1 The potential transcription factors associated with the expression of hub genes. |
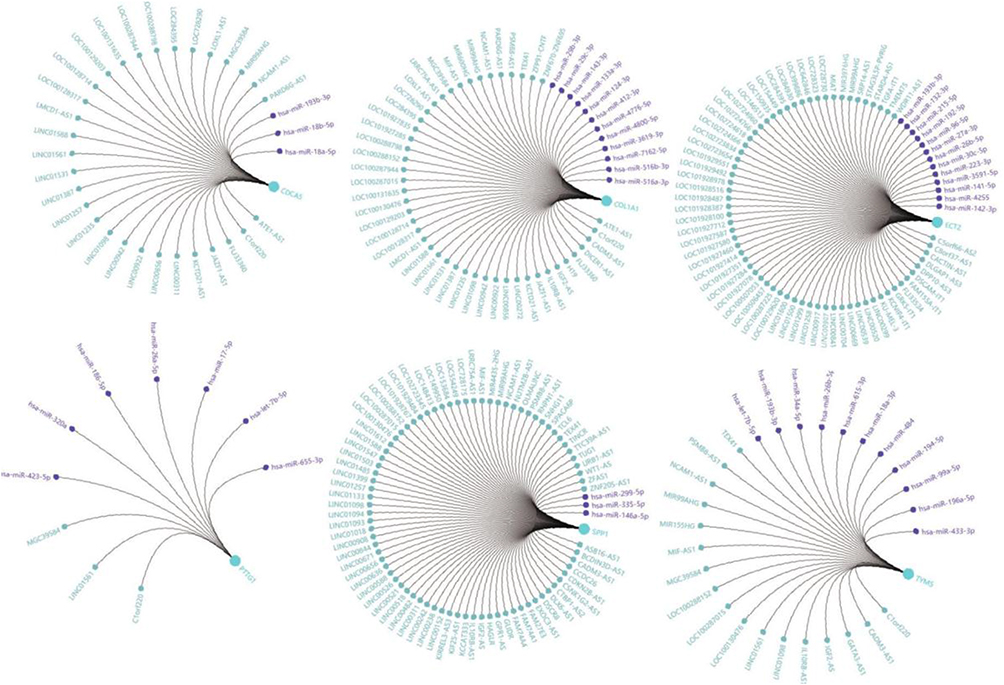 | Figure S2 A regulatory network of lncRNA-miRNA-mRNA constructed by GCBI. Purple nodes: related lncRNA; Blue nodes: targeted miRNA. |
 © 2019 The Author(s). This work is published and licensed by Dove Medical Press Limited. The full terms of this license are available at https://www.dovepress.com/terms.php and incorporate the Creative Commons Attribution - Non Commercial (unported, v3.0) License.
By accessing the work you hereby accept the Terms. Non-commercial uses of the work are permitted without any further permission from Dove Medical Press Limited, provided the work is properly attributed. For permission for commercial use of this work, please see paragraphs 4.2 and 5 of our Terms.
© 2019 The Author(s). This work is published and licensed by Dove Medical Press Limited. The full terms of this license are available at https://www.dovepress.com/terms.php and incorporate the Creative Commons Attribution - Non Commercial (unported, v3.0) License.
By accessing the work you hereby accept the Terms. Non-commercial uses of the work are permitted without any further permission from Dove Medical Press Limited, provided the work is properly attributed. For permission for commercial use of this work, please see paragraphs 4.2 and 5 of our Terms.