")
Back to Journals » Pharmacogenomics and Personalized Medicine » Volume 15
Identification of NFASC and CHL1 as Two Novel Hub Genes in Endometriosis Using Integrated Bioinformatic Analysis and Experimental Verification
Authors Chen P, Yao M, Fang T, Ye C, Du Y, Jin Y, Wu R
Received 22 December 2021
Accepted for publication 11 April 2022
Published 22 April 2022 Volume 2022:15 Pages 377—392
DOI https://doi.org/10.2147/PGPM.S354957
Checked for plagiarism Yes
Review by Single anonymous peer review
Peer reviewer comments 2
Editor who approved publication: Dr Martin H Bluth
Pei Chen, Mengyun Yao, Tao Fang, Chaoshuang Ye, Yongjiang Du, Yang Jin, Ruijin Wu
Department of Obstetrics and Gynecology, Women’s Hospital, Zhejiang University School of Medicine, Hangzhou, People’s Republic of China
Correspondence: Ruijin Wu, Department of Obstetrics and Gynecology, Women’s Hospital, Zhejiang University School of Medicine, Hangzhou, 310006, People’s Republic of China, Tel +86 571-8706223, Email [email protected]
Background: Endometriosis (EMS) is a common and highly recurrent gynecological disease characterized by chronic pain and infertility. There are no definitive therapies for endometriosis since the pathogenesis remains undetermined. This study aimed to identify EMS-related functional modules and hub genes by integrated bioinformatics analysis.
Methods: Three endometriosis expression profiling series (GSE25628, GSE23339, and GSE7305) were obtained from Gene Expression Omnibus (GEO). The EMS-related module was constructed by weighted gene co-expression network analysis (WGCNA), followed by Gene Ontology (GO) enrichment analyses. Cytohubba and the MCODE plug-ins of Cytoscape were used to screen out the hub genes, which were verified via receiver operating characteristic (ROC) curves. Immunohistochemistry was performed to verify the protein expression of the hub genes in ectopic endometrial tissues. Moreover, CIBERSORT was used to analyze the relationship between the abundance of immune cells infiltration and the expression of hub genes.
Results: Among the 18 modules obtained, the darkmagenta module was identified as the EMS-related module, genes of which were significantly enriched to terms referring to cell migration and neurogenesis. NFASC and CHL1 were screened out and prioritized as hub genes through Cytoscape and confirmed to be differentially upregulated in ectopic endometrial samples. Finally, the expression of hub genes was related to the abundance of immune cells infiltration. The higher expression of NFASC or CHL1 correlated with increased M2 macrophages and decreased natural killer (NK) cells in ectopic lesions.
Conclusion: This study provided new insights into the molecular factors underlying the pathogenesis of endometriosis and provided a theoretical basis for the potential that the two hub genes, NFASC and CHL1, might be novel biomarkers and therapeutic targets in the future.
Keywords: endometriosis, bioinformatics analysis, WGCNA, immune cell infiltration
Introduction
Endometriosis (EMS) is a chronic gynecological disease defined as implantation and periodic growth of the endometrial glands and stroma outside the uterine cavity, causing chronic pelvic pain, severe dysmenorrhea, and infertility in 10% reproductive-age women, among which the infertility rate is approximately 30–50%.1,2 Surgical excision is commonly used for the treatment of endometriosis to ameliorate symptoms and restore anatomy but is ineluctably accompanied with tissue damage and a 5-year cumulative recurrence rate of 40–50%.3,4 Postoperative hormonal intervention has been considered to reduce re-operation rates for recurrent endometriosis. A meta-analysis conducted by Muzii et al found that a continuous oral contraceptive regimen after endometriosis surgery reduced dysmenorrhea recurrence rates compared with a cyclic regimen.5 Consistently, a recent study indicated that post-operative hormonal suppression for long periods of time showed its efficacy with a decrease in the recurrence rate and an improvement in patient-reported pain.6 However, hormonal treatment blocks ovulation which conflicts with the fertility requirements of some patients.3 Therefore, an improved understanding of the etiology and associated molecular mechanisms underlying endometriosis is needed for the identification of precise molecular sub-phenotypes and new therapeutic strategies to alleviate symptoms and reduce relapse rates.1
Although multiple theories have been proposed to explain the etiology of endometriosis, the mechanisms underlying the pathogenesis remain undetermined. According to retrograde menstruation theory, menstrual endometrial cells are refluxed into the peritoneal cavity through oviducts, followed by their implantation through a multi-step process.7 After migrating to the implant site, ectopic endometrial cells require the support of the pre-disease milieu for subsequent adherence, invasion, and proliferation.8 A recent study conducted by Wang et al established a dataset of endometriosis-associated genes by text mining of the abstracts of the published literature, and found that related hub proteins were mainly involved in biological processes, including cell migration and immune response.9 Immune-related mechanisms have been reported to participate in the pathophysiology and symptomatology of EMS by promoting the survival and maintenance of endometriosis lesions.10 Numerous studies have shown systemic and local immunity changes in patients with endometriosis, which remains unknown whether they are the etiology or a consequence of the disease.11 Several types of immune cells in peritoneal fluid and endometriotic lesions, including T cells, macrophages, and natural killer (NK) cells, suffer from abnormalities in number or function.10 Analysis of the relationship between hub genes and immune infiltration may make for exploring the unknown mechanisms. In addition, NLRP3 inflammasome signaling pathway in mast cells is activated to induce the production of IL-1β and further promote lesion progression and fibrogenesis in endometriosis.12 Macrophage-derived netrin-1 is critical for neuroangiogenesis in endometriosis.13 These findings suggest that molecules correlated with infiltrated immune cells may serve as new biomarkers of endometriosis.
New sequencing technology and bioinformatics analysis have opened the door to a far better understanding of the molecular mechanisms underlying endometriosis. Some studies have analyzed the differentially expressed genes (DEGs) involved in endometriosis, and revealed that some DEGs were closely associated with cell adhesion, cell migration, hypoxia-inducible factor signaling, and immune-related mechanisms.14–16 However, traditional differential expression analysis focuses on each gene individually, lacking the account for the interconnection among genes with similar biological functions as a whole.17 Gene co-expression network analysis could show straightforward gene interactions based on the concept that genes with highly correlated expression patterns are inclined to be functionally associated. Weighted gene co-expression network analysis (WGCNA), constructing a scale-free gene co-expression network by applying the core concept of soft threshold, was widely used to cluster genes with similar expression patterns and functions into the same module, followed by the identification of specific modules and hub genes that are related to the clinical trait of interest.18 At present, WGCNA has been successfully applied to identify novel diagnostic biomarkers and potential therapeutic targets in various biological fields, such as cancer, neuropsychiatric disorder, and brain imaging data analysis, which has been proved to be more biologically significant.19,20 However, endometriosis lags behind other common diseases in the application of WGCNA. Moreover, the analysis of WGCNA-selected hub genes combined with immune infiltration analysis has not been reported in endometriosis yet.
This study aimed to explore potential biomarkers and their potential biological functions in the pathogenesis of endometriosis. Three datasets of endometriosis from Gene Expression Omnibus (GEO) were comprehensively analyzed to identify endometriosis-related gene modules and hub genes through WGCNA. The selected hub genes were validated by immunohistochemistry (IHC) analysis. In addition, the association of expressions of the hub genes with immune infiltration was detected. The bioinformatic analysis of endometriosis in our study provides adjutant insights for understanding the pathogenesis of endometriosis.
Materials and Methods
Data Collection and Processing
The Gene Expression Omnibus (GEO, https://www.ncbi.nlm.nih.gov/geo/) is a public functional genomics database supported by the National Center for Biotechnology Information (NCBI). To expand the sample size and obtain an integrated dataset containing ectopic endometrium samples (Ec), eutopic endometrium samples (Eu, endometrial tissues growing in the uterine cavity in patients with endometriosis), and control endometrium samples (Ctrl, endometrial tissues growing in uterine cavity in patients without endometriosis), three gene expression datasets including GSE25628, GSE23339, and GSE7305 were downloaded from GEO. These three GEO series (GSEs) contained array-based expression profiles of 28 Ec samples and 18 Eu samples collected from patients with endometriosis, as well as 15 Ctrl samples collected from participants without endometriosis (Table S1). GSE25628, GSE23339, and GSE7305 data were combined into an integrated dataset using Perl scripts.21 The integrated dataset was then batch-normalized using the ComBat function in the sva package under the R environment (version 3.5.3).22 The effect of the correction was detected by the principal component analysis (PCA).
Weighted Gene Co-Expression Network Construction and Modules Partition
In order to reduce the background noise, the variance-related filtering was performed on processed data, and the top 50% were screened for subsequent WGCNA analyses. The WGCNA package18 under the R environment was used for the scale-free gene co-expression network construction and modules division. First, Pearson’s correlation coefficient was calculated for all gene pairs to construct a correlation matrix. Secondly, the soft-thresholding power (β) was calculated using the pickSoftThreshold function of the WGCNA package to simultaneously maximize the model fit of the scale-free topology (R2 > 0.85) and the mean connectivity for the conversion of the correlation matrix into an adjacency matrix.23,24 Thirdly, the TOM similarity function in the WGCNA package was used to transform the adjacency matrix into a topological overlap matrix (TOM) for similarity measure. The corresponding dissimilarity (1-TOM) of genes was then calculated, according to which the hierarchical clustering tree, also known as gene dendrogram, was constructed by average linkage hierarchical clustering.21 Based on the dendrogram, dynamic tree cut method was used for module division. Specifically, genes with a similar expression mode were classified into the same module that met a minimum size of 30 genes. The dissimilarity of modules was calculated based on module eigengene (ME) using the moduleEigengenes function of the WGCNA package.17 Highly similar modules were merged using the merge Cut Height of 0.25.25
Clinically Significant Modules Identification
In order to identify clinically significant modules, the module-clinical trait correlation was assessed by calculating the correlation between module eigengene and phenotype (including Ctrl, Eu, and Ec). In modules related to a trait of interest, which meant EMS-related module in this study, measurement of gene significance (GS) and module membership (MM) was performed on each intra-modular gene, and the correlation between GS and MM was assessed by a scatterplot of GS (y-axis) vs MM (x-axis). For each gene, GS referred to the log10 conversion of the p value in the linear regression between the expression value and the phenotype. MM was fuzzily defined as the correlation between the gene expression profile and the module eigengene of a given module. High values of GS and MM as well as a preferable correlation between GS and MM were indispensable for genes in an eligible trait-related module.
Enrichment Analysis
To further explore the biological significance of genes in the EMS-related module selected by WGCNA, Gene Ontology (GO) enrichment analyses were conducted and visualized using the cluster Profiler package under the R environment with a cut-off criterion of p < 0.05.26,27
Identification and Assessment of Hub Genes in the EMS-Related Module
Based on the enriched terms of GO enrichment analysis, hub genes were screened out from the EMS-related module. Certain GO terms were regarded as endometriosis-related gene clusters, based on which sub-networks were extracted from the WGCNA network and imported into the Cytoscape software. The Cytohubba, a plug-in of Cytoscape, was then used to calculate the Maximal Clique Centrality (MCC) of genes in the sub-network. Genes were sorted according to the values of MCC for the identification of hub genes.
Hub genes should be highly correlated with both clinical traits of interest and modules, which suggested the important role of hub genes in the pathophysiology of endometriosis. In order to confirm the reliability of selected hub genes, MCODE, another plug-in of Cytohubba, was applied. The values of GS and MM of selected hub genes were also checked for validation. The receiver operating characteristic (ROC) curve analysis was carried out on GraphPad Prism (GraphPad Prism Version 8.2.1) to assess the utility of selected genes for distinguishing ectopic endometrial samples from non-ectopic endometrial samples.28
Immunohistochemistry
The translational-level validation of selected hubs genes from the EMS-related module was carried out by immunohistochemistry. The study was approved by the Ethics Committee of Women’s Hospital, School of Medicine, Zhejiang University (IRB-20200096-R), and complied with the Declaration of Helsinki. All samples were obtained with written informed consent from patients. Totally 80 paraffin-embedded tissue samples, including 26 Ec (ectopic endometriotic tissues from patients with endometriosis), 26 Eu (endometrial tissues growing in the uterine cavity in patients with endometriosis), and 28 Ctrl (endometrial tissues growing in the uterine cavity in patients without endometriosis undergoing hysteroscopy for hydrosalpinx, mediastinal uterus or other benign gynecological diseases), were obtained from Women’s Hospital, School of Medicine, Zhejiang University. The ages of the patients ranged from 24 to 40. All the endometriosis patients were diagnosed with stage III–IV endometriosis according to the revised AFS classification. All specimens were in the proliferative phase of the cycle from patients who had regular menstruation and did not receive hormone treatment within 6 months before surgery. Patients with diabetes mellitus, hypertension, autoimmune disorder, neoplastic, or severe medical diseases were excluded from this study.
The immunohistochemistry for validation was performed according to the previous publication.29 In brief, paraffin-embedded tissues were cut into 5-μm sections, followed by deparaffinization and rehydration. The sections were heated in citrate (pH 6.0, >95°C, 10 min) for antigen retrieval and then incubated with 3% hydrogen peroxide for 10 min to quench endogenous peroxidase. After rinsing in PBS, the sections were incubated with indicated primary antibodies (room temperature, 60 min): NFASC (1:700, ab31457, Abcam), CHL1 (1:300, ab106269, Abcam). After removing primary antibodies, sections were then incubated with secondary antibodies (DAKO, Denmark) at room temperature for 60 min, followed by staining using diaminobenzidine (DAKO, Denmark) as a chromogen.
The staining was semiquantitatively evaluated under a microscope (Leica LMD, Germany) based on the Immuno-Reactivity Score (IRS).30 In brief, the IRS was defined as the product of the percentage of positive-stained cells (graded as 0 = no staining, 1 = 1–10%, 2 = 11–50%, 3 = 51–80%, 4 = 81–100%) and the intensity scores (graded as 0 = no staining, 1 = weak staining, 2 = moderate staining, 3 = strong staining). Each section was quantified in 5 different fields at a ×400 magnification by two blinded observers. Data were statistically analyzed by Kruskal–Wallis nonparametric test followed by Dunn’s multiple comparison post hoc test. P < 0.05 was considered to be statistically significant.
Correlation Between Gene Expression and Immunity
For each hub gene, samples were divided into two groups based on median gene expression. CIBERSORT algorithm was used to calculate the infiltration level of 22 types of immune cells.31 The correlation between the hub genes and different immune cells was analyzed using the corrplot package in R.32
Results
Evaluation of Data
To comprehensively study gene expression in endometriosis, three datasets (GSE25628, GSE23339, and GSE7305) were merged into an integrated dataset. PCA analysis showed that the batch effects were successfully removed after batch normalization (Figure 1A and B). The sample dendrogram with a trait heat map (Figure 1C) represented similarity between Ctrl and Eu samples and distinct difference between these two phenotypes and the Ec sample, which was consistent with the general cognition. Similarly, the batch row in the heat map showed that the clustering result of samples was independent of the GEO series, indicating the satisfactory elimination of batch effects. Details of the samples were available at the Supplementary Material Table S1.
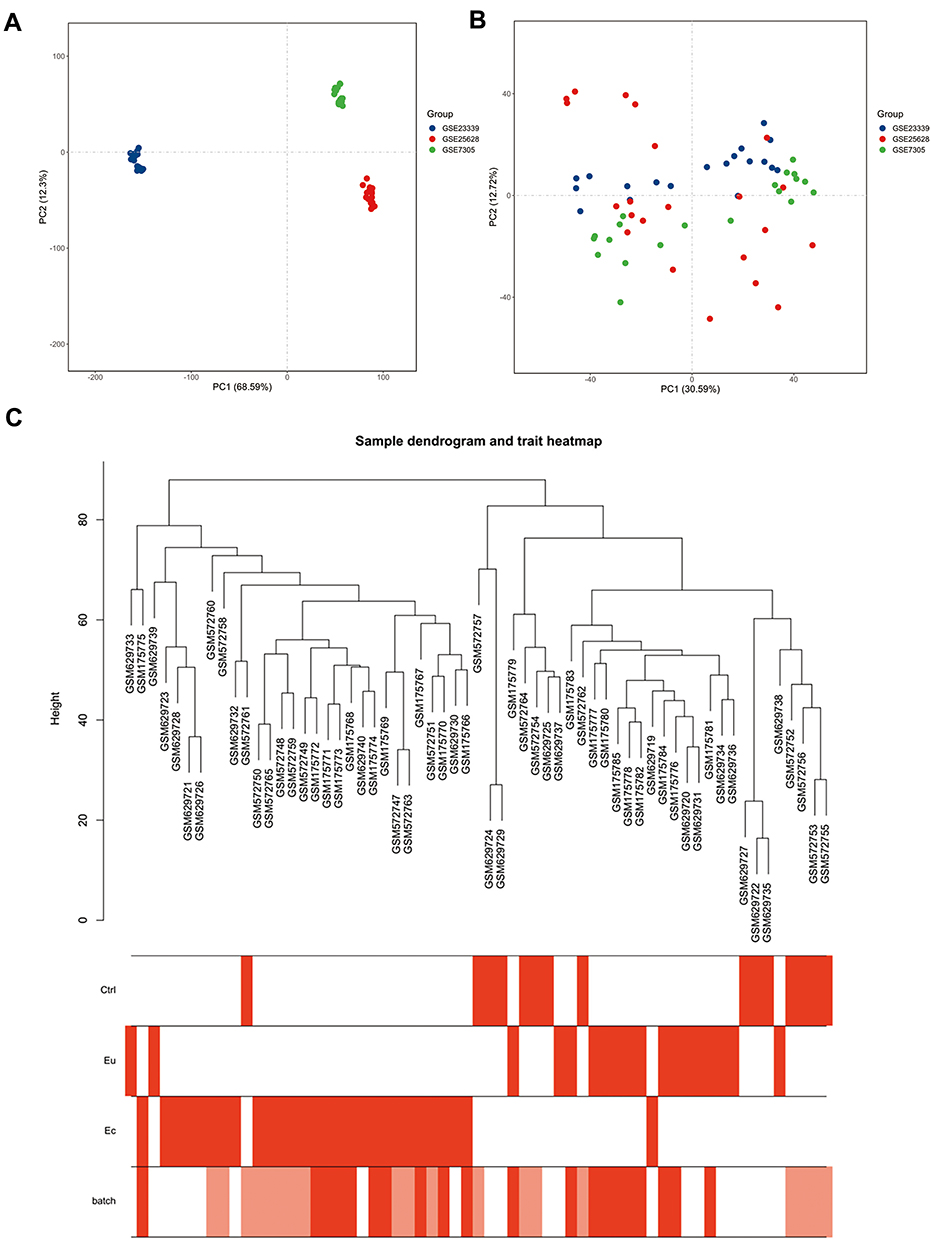 |
Figure 1 Gene expression patterns across datasets. (A and B) Principal component analysis (PCA) of gene expression profiles without (A) and with (B) the removal of batch effect. (C) Sample cluster dendrogram and clinical trait heat map of 15 Ctrl, 18 Eu and 28 Ec samples. The batch row corresponded to the sample series: white, GSE25628; pink, GSE23339; red, GSE7305. |
Weighted Gene Co-Expression Network Construction and Modules Partition
The soft-thresholding power of β=10 was determined to simultaneously satisfy the model fit of the scale-free topology (R2 > 0.85) and high connectivity among genes for the construction of a scale-free gene co-expression network (Figure 2A and B). After construction of gene dendrogram using average linkage hierarchical clustering, preliminary module division was carried out by dynamic tree cut (Figure 2C), followed by merging of similar modules on the condition that merges Cut Height was set to 0.25. Finally, a total of 18 modules, ranging from 47 to 1902 genes per module, were identified and marked with different colors (Figure 2C and Table S2), of which the grey module was of no value for further analysis since it stored genes that could not be classified into any specific modules with low intra-modular connectivity. In order to evaluate the modules division, one thousand genes were randomly selected from the whole network as a representative, of which the correlations were calculated and displayed in the network heat map plot (Figure 2D). Figure 2D shows high intra-modular connectivity as well as low extra-modular connectivity, suggesting the rationality of modules division. The eigengene dendrogram (Figure 2E) and eigengene adjacency heat map (Figure 2F) indicated that the 18 modules were mainly clustered into two clusters.
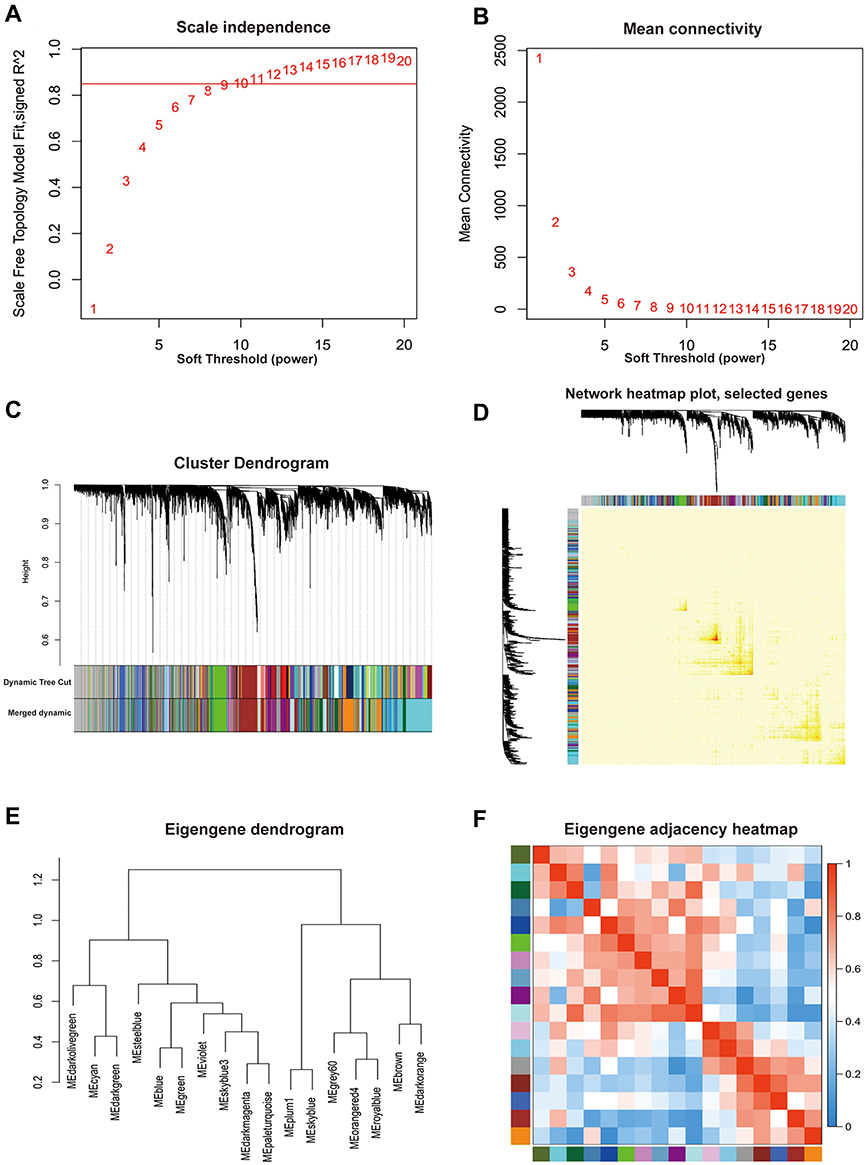 |
Figure 2 Division and validation of modules based on the scale-free co-expression network constructed according to a soft-thresholding power. (A) Scale-free topology fit index as a function of soft-thresholding power ranging from 1 to 20. The red line meant that the value of scale-free topology fit index was 0.85. (B) Mean connectivity as a function of soft-thresholding power ranging from 1 to 20. The soft-thresholding power of β=10 was determined as the beat fit since it had highest value of mean connectivity when the scale-free topology fit index was over 0.85. (C) Cluster dendrogram of all included genes based on the dissimilarity (1-TOM) of genes. The divided modules were labeled by different color and exhibited below the cluster dendrogram. The top row represented preliminary modules divided by dynamic tree cut and the bottom row represented the final modules division with the merge Cut Height set to 0.25. (D) Network heat map plot of 1000 randomly selected genes. The more saturated red color represented the higher co-expression interconnection of pair-wise genes. Diagonal-distributed red color indicated high intra-modular connectivity and low extra-modular connectivity. (E) Clustering dendrogram of merged module eigengene. (F) Eigengene adjacency heat map plot of merged modules. The color represented the adjacency of corresponding modules where red meant high adjacency and blue meant low adjacency. |
Identification and Validation of Clinically Significant Modules
The module-traits correlations were calculated and shown in Figure 3A. The darkmagenta module (cor = 0.82, p = 5e-16) showed high correlations between the Ec-trait and their module eigengene, indicating that this module might be involved in the formation and development of ectopic lesions. In order to assess the reliability of the darkmagenta module being regarded as the EMS-related module, the scatterplots of gene significance (GS) vs module membership (MM) in the darkmagenta module were constructed, respectively (Figure 3B). The GS and MM of genes in the module were highly correlated (cor = 0.88, p < 1e-200). In addition, the majority of nodes were distributed in the region of the upper right with high values of both GS and MM, indicating that genes in the darkmagenta module were highly correlated with both the Ec-trait and corresponding module eigengene and thus appropriate for further analysis and hub genes identification.
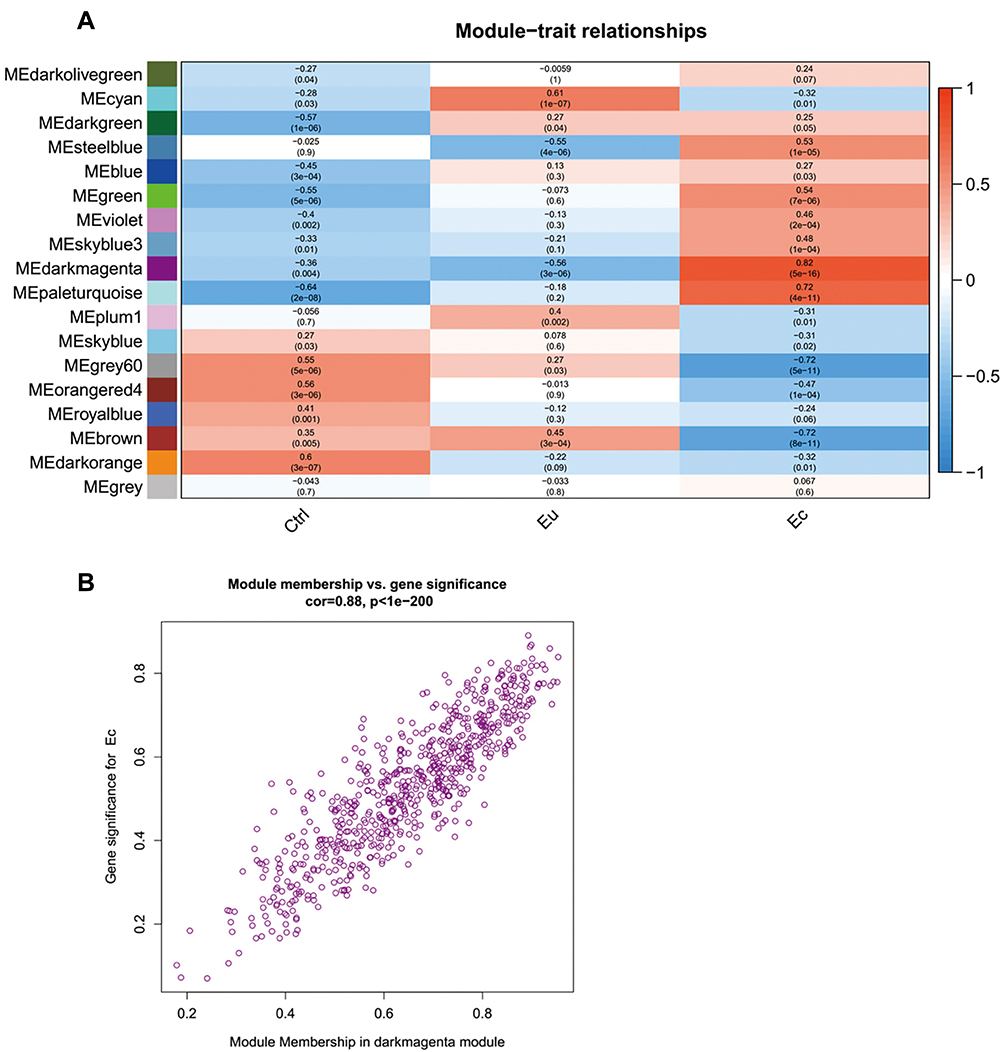 |
Figure 3 Identification and assessment of the EMS-related module. (A) Heat map plot of module-trait relationship. The correlation coefficients and corresponding p-value were represented in each square and the color bar was ranked by correlation coefficients. (B) Scatterplots of gene significance (GS) vs module membership (MM) in the darkmagenta module. |
Enrichment Analysis of the Darkmagenta Module
In order to explore the biological characteristics and involved pathways of genes in the EMS-related module, GO enrichment analysis was conducted (Figure 4). Genes in darkmagenta module were significantly enriched to terms referring to cell communication, migration, and adhesion, such as “extracellular matrix” (GO: GO:0031012, gene count = 39, p = 8.72E-05), and “cell adhesion molecule binding” (GO: GO:0050839, gene count = 36, p = 0.00253), which suggested that genes in the EMS-related module might be involved in the occurrence and development of endometriosis by influencing these biological functions. Notably, genes in the darkmagenta module were enriched to terms about neurogenesis, such as “axon development” (GO:0061564, gene count = 43, p = 3.76E-06), “axonogenesis” (GO:0007409, gene count = 37, p = 5.90E-05), and “positive regulation of neurogenesis” (GO:0050769, gene count = 38, p = 4.23E-04), indicating the potential role of darkmagenta module genes in neurogenesis at the site of ectopic lesions and EMS-related pain.
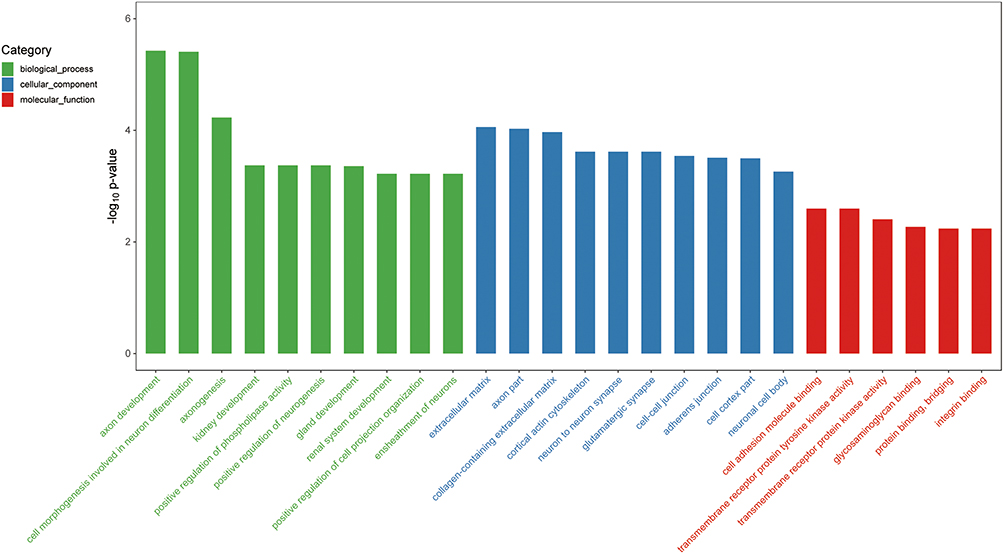 |
Figure 4 GO enrichment analysis of genes in the darkmagenta module. Top significantly enriched GO biological process terms, molecular function terms and cellular component terms of genes in the darkmagenta module. |
Identification and Assessment of Hub Genes in the Darkmagenta Module
In the GO enrichment analysis of genes in darkmagenta module, considerable parts of enriched GO terms were involved in neurogenesis especially in axon development. It has been reported that abnormal distribution of pelvic nerves might lead to endometriosis-associated pain.33 Hence, two clusters ranked at the top three of GO biological process named “axon development” and “axonogenesis” were chosen for further analysis. Analogously, co-expression gene pairs and corresponding relations between these two clusters were extracted from the darkmagenta weighted co-expression network and imported to Cytoscape. After calculating MCC values of genes in sub-networks by Cytohubba, genes with the top 10 MCC values were highlighted and ranked by colors (Figure 5A and B). In the “axon development” sub-network, the MCC value of NFASC was the largest, and the left top genes were PPP3CB, ECM2, ROBO3, NTRK2, NCAM1, PRELP, PLP1, BDNF, and CHL1. In the “axonogenesis” sub-network, the MCC value of NFASC was also the largest, and the left top genes were PRELP, EPHA4, CHL1, PTRZ1, NCAM1, NTRK2, SPTBN1, NRP2, and ROBO3. Six genes including NFASC, ROBO3, NTRK2, NCAM1, PRELP, and CHL1 were overlapped, of which NFASC had the largest MCC value in both sub-networks and was identified as a key gene from the darkmagenta module.
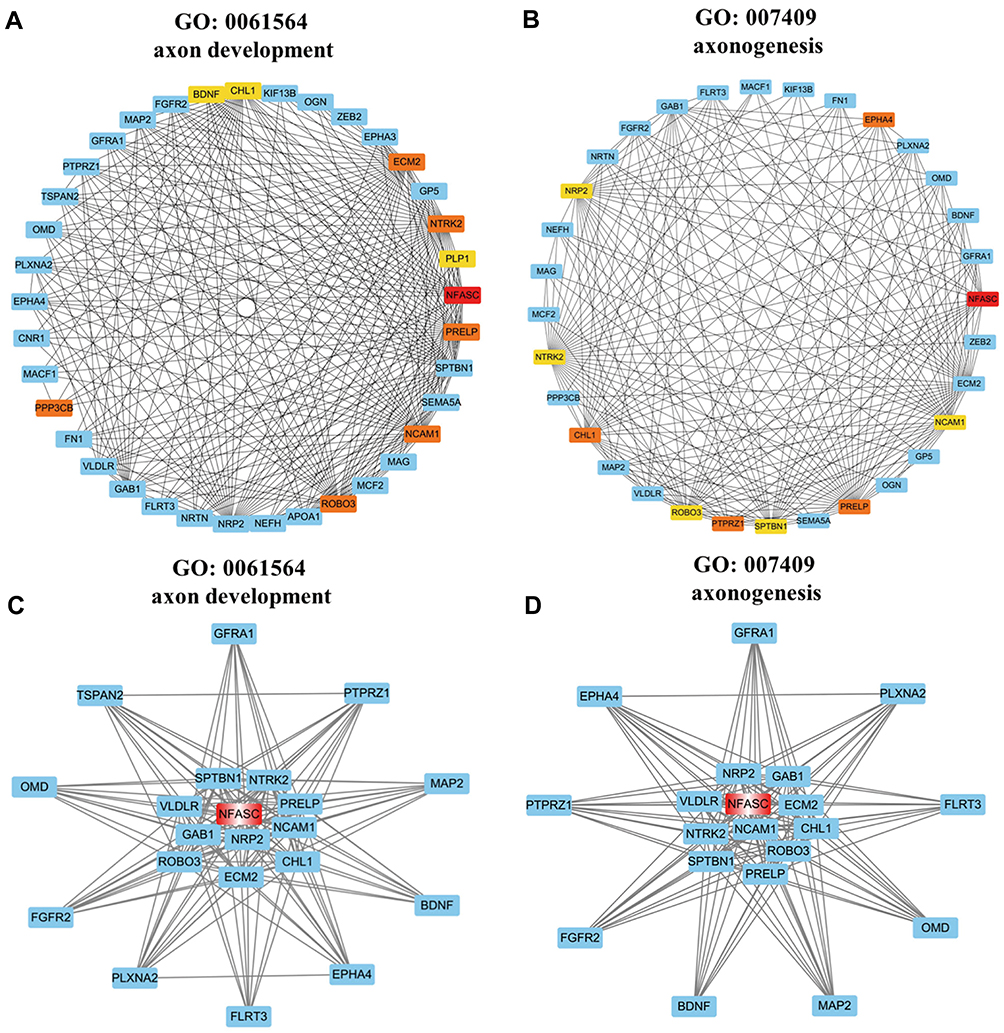 |
Figure 5 Sub-networks and functional clusters extracted from the weighted co-expression network of the darkmagenta module based on selected GO terms. The nodes represented genes and the edges represented the weighted correlation of genes in sub-network. (A and B) Sub-network of the GO term named “axon development” (A) and “axonogenesis” (B) extracted by Cytohubba. The depth of red-yellow represented the genes with top values of MCC and the more saturated red color represented the higher MCC value. (C and D) Functional cluster of the GO term named “axon development” (C) and “axonogenesis” (D) extracted by MCODE and the hub gene was labeled by red color. |
The plug-in MCODE was used to extract two major functional clusters from sub-networks, respectively, in which NFASC sat in the central region of both functional clusters (Figure 5C and D). Combined with relevant literature, hub genes NFASC and CHL1, which both encode members of the L1 Cell Adhesion Molecule (L1CAM) protein family, were ultimately selected as genes of interest from the darkmagenta module.34 The MM and GS values of NFASC (MM = 0.79, GS = 0.703) and CHL1 (MM = 0.87, GS = 0.77) indicated that NFASC and CHL1 were highly correlated with the Ec trait and played an important role in the darkmagenta module.
Validation of Hub Genes in the Darkmagenta Module
Based on the above analysis and available knowledge in the literature, NFASC and CHL1 were considered more likely to be associated with the Ec trait and were selected out of the hub genes from the darkmagenta module. To validate the diagnostic significance of NFASC and CHL1, ROC analysis was carried out. The results showed high accuracy of NFASC (AUC = 0.915, p < 0.0001) and CHL1 (AUC = 0.943, p < 0.0001) to discriminate ectopic endometrial samples from non-ectopic endometrial samples, suggesting the two hub genes as potential biomarkers for Ec (Figure 6A and B). Immunohistochemistry was performed to further validate the protein expression status of NFASC and CHL1. For NFASC and CHL1, Ec samples got significantly higher expression than that of Eu and Ctrl (Figure 6C and D). Taken together, NFASC and CHL1 showed good predictive performance in distinguishing ectopic and non-ectopic endometrial samples, which confirmed the reliability of our bioinformatics analyses.
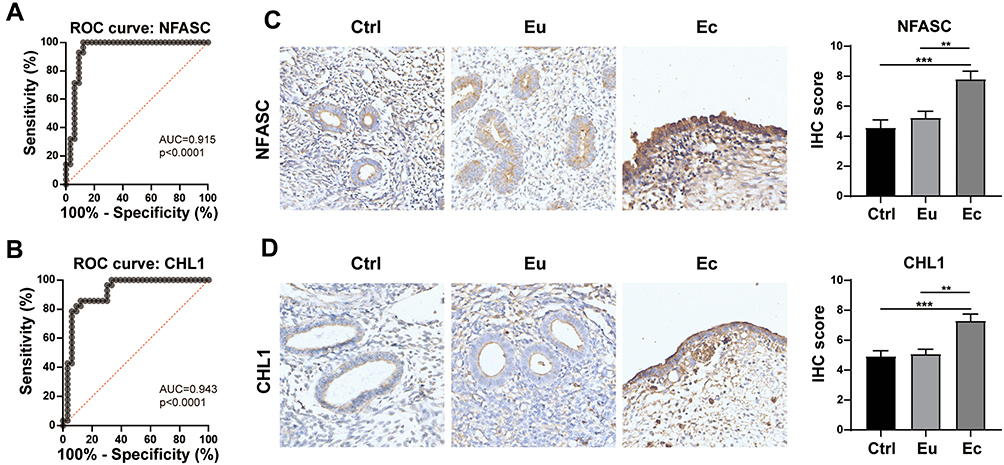 |
Figure 6 Validation of hub genes in the darkmagenta module. (A and B) ROC curves of NFASC (A) and CHL1 (B) for distinguishing ectopic endometrial samples from non-ectopic endometrial samples. (C and D) Relative protein expressions of NFASC (C) and CHL1 (D) in the Ctrl, Eu and Ec, as determined by IHC staining. Scale Bars = 50 μm. **p < 0.01, ***p < 0.001. |
The Relationship Between Hub Genes and Infiltrating Immune Cells
To better understand the role of NFASC and CHL1 in endometriosis, immune cell infiltration analysis using CIBERSORT was performed on an integrated dataset, in which samples were classified into high- and low-expression groups based on the median gene expression of NFASC or CHL1.
A significant difference in the abundance of infiltrated immune cells between the high- and low-expression groups of either NFASC or CHL1 was observed (Figure 7A and B). As shown in Figure 7C and D, samples with a high expression of both NFASC and CHL1 had significantly low infiltration of activated NK cells, resting NK cells, regulatory T cells, follicular helper T cells, and activated dendritic cells, while they had significantly high infiltration of M2 macrophages. Also, higher proportions of M1 macrophages, M0 macrophages and CD4 memory resting T cells, and lower proportions of plasma cells were observed in samples with a high expression of CHL1. Besides, infiltration levels of monocytes were elevated in high-NFASC groups. Since the two genes were significantly involved in the immunocytes infiltration of endometrial samples, we further evaluated their association with immune cells. As shown in Figure 7E and F, both NFASC and CHL1 were most positively correlated with M2 macrophages and negatively correlated with activated NK cells.
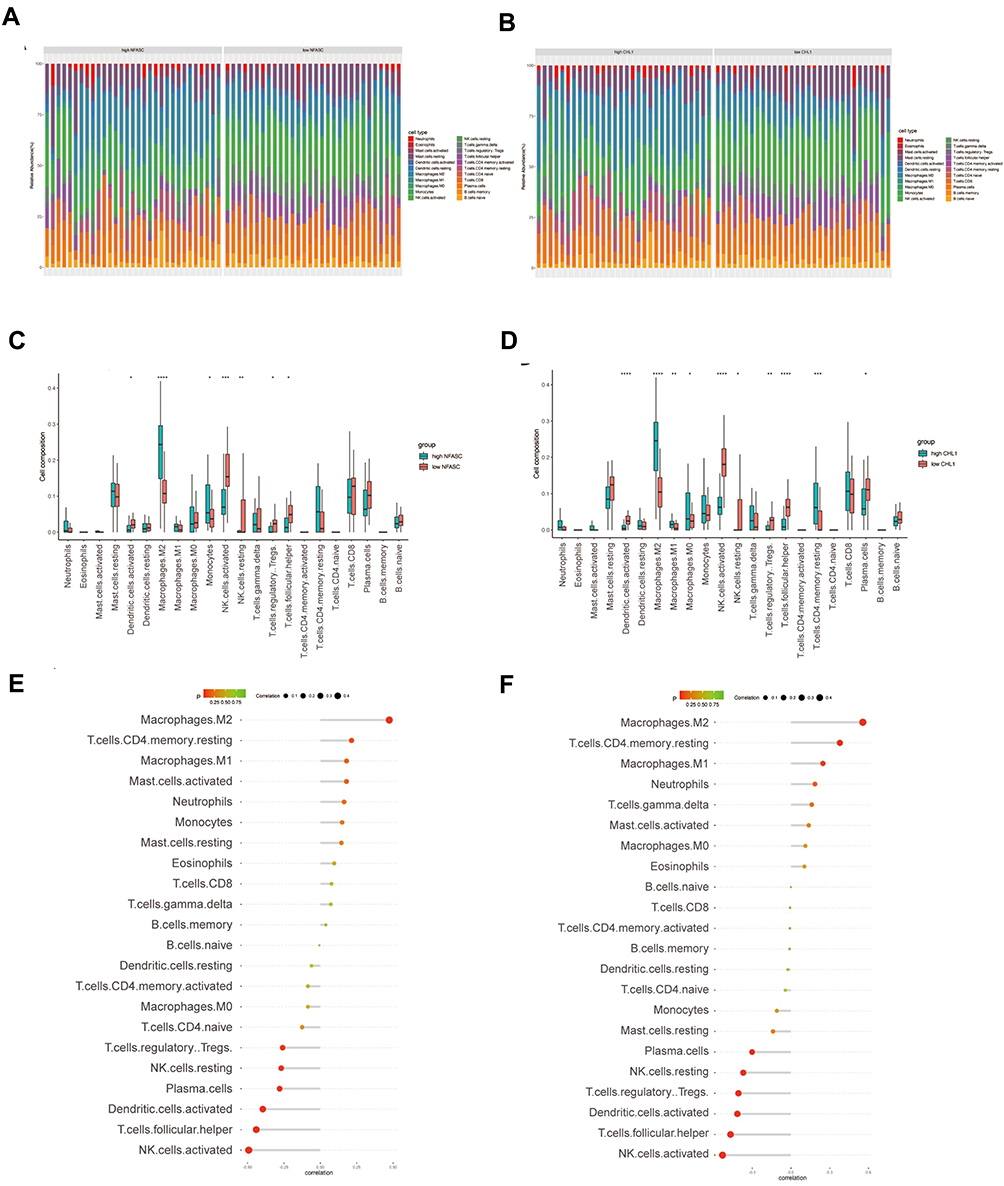 |
Figure 7 The relationship between hub genes and infiltrating immune cells. For each hub gene, samples were divided into two groups (high expression or low expression group) based on median gene expression. (A and B) The stacked bar chart shows the infiltration ratio of 22 types of immune cells in each sample of in the high- or low-NFASC (A) and high- or low-CHL1 (B) groups, respectively. (C) Box plot shows the infiltration difference of immune cells between the high- and low-NFASC groups. (D) Box plot shows the infiltration difference of immune cells between the high- and low-CHL1 groups. (E and F) The relationship between NFASC (E) or CHL1 (F) and immune infiltrating cells, respectively. |
Discussion
In this study, we obtained endometriosis expression profiling named GSE25628, GSE23339, and GSE7305 from GEO. The EMS-related module was identified by WGCNA, and hub genes were screened from EMS-related module using the MCC method combined with relevant literature, namely, NFASC and CHL1. The ROC curve analyses showed a potential diagnostic value of the two genes in endometriosis. We collected clinical samples and further validated the two genes of interest using immunohistochemistry. Moreover, we explored the association between hub genes and immune cell infiltration in endometriosis. These results provided potential mechanisms and novel biomarkers of EMS for future research.
Pelvic pain is one of the clinical landmarks of endometriosis. Notably, novel mechanisms, including neurogenesis and neuropathic hyperalgesia, are likely to contribute to endometriosis-associated pain. The presence of nerve fibers in ectopic endometrial lesions and their density are closely associated with the pain severity of endometriosis.35 In our study, functional term enrichment indicates that genes of the EMS-related darkmagenta module may play a role in neurogenesis. NFASC and CHL1, the two hub genes screened out from the darkmagenta module, encode the neurofascin protein (NFASC) and the Close Homolog of L1 protein (CHL1), respectively, both of which are members of the L1 Cell Adhesion Molecule (L1CAM) family. Sharing homology with CHL1 and NFASC, L1CAM has been reported to be upregulated in atypical endometriosis, which exacerbates pain in endometriosis by promoting nerve growth.36 Previous studies have identified NFASC and CHL1 participate in the regulation of neural development and function.37 Furthermore, neurofascin is associated with the aggregation of ion channels in nerve fibers as a scaffolding protein.38,39 The increased expression of ion channels induces increased responsiveness of nociceptors, leading to the enhancement of pain perception in endometriosis.40 That is, NFASC may participate in the neuropathic hyperalgesia that causes EMS-related pain. Although there is currently a lack of relevant research, NFASC and CHL1 may be involved in EMS-associated pelvic pain, which is worth further investigation.
The occurrence and development of endometriosis is closely related to biological processes, such as cell communication, migration, adhesion, and proliferation according to retrograde menstruation theory.7 In our study, genes in the EMS-related module were also significantly enriched to terms referring to cell migration and adhesion, such as “extracellular matrix” and “cell adhesion molecule binding”, indicating that the potential role of darkmagenta module genes in the occurrence and development of endometriosis. As adhesion proteins, NFASC and CHL1 have been reported to mediate cell motility and signal transduction through interaction with different types of molecules, including integrins.41,42 CHL1 has been reported to be upregulated in glioma and endometrial cancer, and knockdown of CHL1 inhibited cell proliferation and migration of glioma cells and EC cells, suggesting the potential of CHL1 to be a therapeutic target in the clinical management of cancer.43,44 Similarly, Samulin et al showed that NFASC could promote lung cancer cell migration and invasion through the arrangement of actin cytoskeleton and F-actin networks.41 Another study reported that NFASC was targeted and inhibited by miR-3650, leading to the inhibition of migration and epithelial–mesenchymal transition of hepatocellular carcinoma cells.45 Consistent with our result, the expression of CHL1 was found to be increased in endometriosis in another study.46 Taken together, NFASC and CHL1 might play a significant role in the formation of ectopic endometrial lesions. All these results confirmed the importance of NFASC and CHL1 in cell migration and invasion, which suggested that NFASC and CHL1 might play a significant role in the formation of ectopic endometrial lesions.
The dysregulation of the function and number of immune cells also affects the initiation, progression, and clinical manifestations of endometriosis. Searching for hub genes of endometriosis and investigating their interactions with immune cells infiltration may yield insight into potential disease mechanisms and facilitate clinical decision-making. In our study, immune cells analysis showed that NFASC and CHL1 influenced immune cell infiltrate property of endometriosis, with particularly significant effects on macrophages M2 and activated NK cells. Studies have demonstrated increased activation of macrophages accompanied by their dysfunction in endometriosis, which is considered as a disease of macrophages.47 The high expression of M2 macrophages was found in endometriosis, contributing to the development of endometriosis by promoting angiogenesis and nerve growth.16,48 Furthermore, M2 macrophages might impair the immune response of NK cells. A decrease in the number and function of NK cells leads to reduced cytotoxicity and reduced elimination of ectopic endometrial cells.48,49 In our study, M2 macrophage infiltration was increased, and NK cells were down-regulated in ectopic endometrial tissues with high NFASC expression or high CHL1 expression. Up to now, nothing is known regarding the role of NFASC and CHL1 in the immune mechanisms of endometriosis. NFASC has been reported as a potential immune response gene related to the immunopathogenesis of Severe COVID-19.50 CHL1-deficient reduced recruitment of macrophages, inhibited Th17 cells differentiation and promoted Treg cells differentiation in IBD mice.51 Taken together, NFASC and CHL1 may be involved in the immune dysregulation function of endometriosis. Our results suggested that NFASC and CHL1 were related to endometriosis progression and could serve as biomarkers for a novel potential strategy and a predictor for immunocyte infiltration in endometriosis.
In this study, we used integrated bioinformatics analysis to identify hub genes related to endometriosis. However, the results obtained through big data analysis were speculative and descriptive. To address this limitation, we used immunohistochemistry to validate the protein expression levels of NFASC and CHL1. Our experimental results demonstrated the reliability of our bioinformatics analysis to a certain extent. Still, further research in vitro and in vivo is required to validate the functions of hub genes in endometriosis and enhance our understanding of the pathogenesis of endometriosis.
Conclusion
We identified and validated two key genes in endometriosis by integrating multiple bioinformatics tools, which showed a good performance in distinguishing ectopic endometrial samples from non-ectopic endometrial samples. NFASC and CHL1 may serve as potential biomarkers of endometriosis. We also evaluated the relationship between the two selected genes and immune cell infiltration to explore the molecular mechanism of endometriosis, which might benefit future therapy. Further investigations will be performed in the future to support our conclusions.
Abbreviations
EMS, endometriosis; GEO, Gene Expression Omnibus; WGCNA, weighted gene co-expression network analysis; GO, Gene Ontology; ROC, receiver operating characteristic; NK, natural killer; DEGs, differentially expressed genes; IHC, immunohistochemistry; NCBI, National Center for Biotechnology Information; PCA, principal component analysis; TOM, topological overlap matrix; ME, module eigengene; GS, gene significance; MM, module membership; MCC, Maximal Clique Centrality; IRS, Immuno-Reactivity Score.
Data Sharing Statement
The endometriosis datasets of expression profiling including GSE25628, GSE23339 and GSE7305 were downloaded from the GEO database (https://www.ncbi.nlm.nih.gov/geo/).
Ethics Approval and Informed Consent
The study was approved by the Ethics Committee of Women’s Hospital, School of Medicine, Zhejiang University (IRB-20200096-R), in accordance with the principles of the Declaration of Helsinki. All clinical samples were obtained with written informed consent from patients.
Acknowledgment
We thank Yanhong Shou for her technical assistance.
Author Contributions
All authors made a significant contribution to the work reported, whether that is in the conception, study design, execution, acquisition of data, analysis and interpretation, or in all these areas; took part in drafting, revising or critically reviewing the article; gave final approval of the version to be published; have agreed on the journal to which the article has been submitted; and agree to be accountable for all aspects of the work.
Funding
This work was supported by Ministerial and Provincial Joint Construction Major Projects of Zhejiang province (No. WKJ-ZJ-1907) and Key Research and Development Program of Zhejiang Province (No. 2021C03095).
Disclosure
The authors have declared no conflicts of interest in this work.
References
1. Zondervan KT, Becker CM, Missmer SA. Endometriosis. N Engl J Med. 2020;382:1244–1256. doi:10.1056/NEJMra1810764
2. Prescott J, Farland LV, Tobias DK, et al. A prospective cohort study of endometriosis and subsequent risk of infertility. Hum Reprod. 2016;31(7):1475–1482. doi:10.1093/humrep/dew085
3. Chapron C, Marcellin L, Borghese B, Santulli P. Rethinking mechanisms, diagnosis and management of endometriosis. Nat Rev Endocrinol. 2019;15:666–682. doi:10.1038/s41574-019-0245-z
4. Guo S-W. Recurrence of endometriosis and its control. Hum Reprod Update. 2009;15(4):441–461. doi:10.1093/humupd/dmp007
5. Muzii L, Di Tucci C, Achilli C, et al. Continuous versus cyclic oral contraceptives after laparoscopic excision of ovarian endometriomas: a systematic review and metaanalysis. Am J Obstet Gynecol. 2016;214:203–211. doi:10.1016/j.ajog.2015.08.074
6. Zakhari A, Delpero E, McKeown S, et al. Endometriosis recurrence following post-operative hormonal suppression: a systematic review and meta-analysis. Hum Reprod Update. 2021;27(1):27. doi:10.1093/humupd/dmaa043
7. Maignien C, Santulli P, Chouzenoux S, et al. Reduced α-2,6 sialylation regulates cell migration in endometriosis. Hum Reprod. 2019;34(3):479–490. doi:10.1093/humrep/dey391
8. Shigesi N, Kvaskoff M, Kirtley S, et al. The association between endometriosis and autoimmune diseases: a systematic review and meta-analysis. Hum Reprod Update. 2019;25(4):486–503. doi:10.1093/humupd/dmz014
9. Wang Y, Zhu S, Liu C, Deng H, Zhang Z. Text mining and hub gene network analysis of endometriosis. Biomed Res Int. 2021;2021:5517145. doi:10.1155/2021/5517145
10. Wang Y, Nicholes K, Shih I-M. The origin and pathogenesis of endometriosis. Annu Rev Pathol. 2020;15(1):71–95. doi:10.1146/annurev-pathmechdis-012419-032654
11. Zondervan KT, Becker CM, Koga K, et al. Endometriosis. Nat Rev Dis Primers. 2018;4:9. doi:10.1038/s41572-018-0008-5
12. Guo X, Xu X, Li T, et al. NLRP3 inflammasome activation of mast cells by estrogen the nuclear-initiated signaling pathway contributes to the development of endometriosis. Front Immunol. 2021;12:749979. doi:10.3389/fimmu.2021.749979
13. Guo X, Ding S, Li T, et al. Macrophage-derived netrin-1 is critical for neuroangiogenesis in endometriosis. Int J Biol Macromol. 2020;148:226–237. doi:10.1016/j.ijbiomac.2020.01.130
14. Chen M, Zhou Y, Xu H, et al. Bioinformatic analysis reveals the importance of epithelial-mesenchymal transition in the development of endometriosis. Sci Rep. 2020;10(1):8442. doi:10.1038/s41598-020-65606-9
15. Dai -F-F, Bao A-Y, Luo B, et al. Identification of differentially expressed genes and signaling pathways involved in endometriosis by integrated bioinformatics analysis. Exp Ther Med. 2020;19:264–272. doi:10.3892/etm.2019.8214
16. Peng Y, Peng C, Fang Z, Chen G. Bioinformatics analysis identifies molecular markers regulating development and progression of endometriosis and potential therapeutic drugs. Front Genet. 2021;12:622683. doi:10.3389/fgene.2021.622683
17. Niemira M, Collin F, Szalkowska A, et al. Molecular signature of subtypes of non-small-cell lung cancer by large-scale transcriptional profiling: identification of key modules and genes by weighted gene co-expression network analysis (WGCNA). Cancers. 2019;12:37. doi:10.3390/cancers12010037
18. Langfelder P, Horvath S. WGCNA: an R package for weighted correlation network analysis. BMC Bioinform. 2008;9(1):559. doi:10.1186/1471-2105-9-559
19. Pol SU, Polanco JJ, Seidman RA, et al. Network-based genomic analysis of human oligodendrocyte progenitor differentiation. Stem Cell Reports. 2017;9:710–723. doi:10.1016/j.stemcr.2017.07.007
20. Heiland DH, Simon-Gabriel CP, Demerath T, et al. Integrative diffusion-weighted imaging and radiogenomic network analysis of glioblastoma multiforme. Sci Rep. 2017;7(1):43523. doi:10.1038/srep43523
21. Cui Z, Bhandari R, Lei Q, et al. Identification and exploration of novel macrophage M2-related biomarkers and potential therapeutic agents in endometriosis. Front Mol Biosci. 2021;8:656145. doi:10.3389/fmolb.2021.656145
22. Leek JT, Johnson WE, Parker HS, Jaffe AE, Storey JD. The sva package for removing batch effects and other unwanted variation in high-throughput experiments. Bioinformatics. 2012;28(6):882–883. doi:10.1093/bioinformatics/bts034
23. Riddell EA, Roback EY, Wells CE, Zamudio KR, Sears MW. Thermal cues drive plasticity of desiccation resistance in montane salamanders with implications for climate change. Nat Commun. 2019;10(1):4091. doi:10.1038/s41467-019-11990-4
24. Berto S, Mendizabal I, Usui N, et al. Accelerated evolution of oligodendrocytes in the human brain. Proc Natl Acad Sci U S A. 2019;116(48):24334–24342. doi:10.1073/pnas.1907982116
25. Katrib A, Jeong -H-H, Fransen NL, Henzel KS, Miller JA. An inflammatory landscape for preoperative neurologic deficits in glioblastoma. Front Genet. 2019;10:488. doi:10.3389/fgene.2019.00488
26. Ashburner M, Ball CA, Blake JA, et al. Gene ontology: tool for the unification of biology. The gene ontology consortium. Nat Genet. 2000;25(1):25–29. doi:10.1038/75556
27. Yu G, Wang L-G, Han Y, He Q-Y. clusterProfiler: an R package for comparing biological themes among gene clusters. OMICS. 2012;16(5):284–287. doi:10.1089/omi.2011.0118
28. MacMullan MA, Ibrayeva A, Trettner K, et al. ELISA detection of SARS-CoV-2 antibodies in saliva. Sci Rep. 2020;10(1):20818. doi:10.1038/s41598-020-77555-4
29. Chen C, Zhou Y, Hu C, et al. Mitochondria and oxidative stress in ovarian endometriosis. Free Radic Biol Med. 2019;136:22–34. doi:10.1016/j.freeradbiomed.2019.03.027
30. Musa J, Cidre-Aranaz F, Aynaud -M-M, et al. Cooperation of cancer drivers with regulatory germline variants shapes clinical outcomes. Nat Commun. 2019;10(1):4128. doi:10.1038/s41467-019-12071-2
31. Newman AM, Steen CB, Liu CL, et al. Determining cell type abundance and expression from bulk tissues with digital cytometry. Nat Biotechnol. 2019;37(7):773–782. doi:10.1038/s41587-019-0114-2
32. Xue G, Hua L, Zhou N, Li J. Characteristics of immune cell infiltration and associated diagnostic biomarkers in ulcerative colitis: results from bioinformatics analysis. Bioengineered. 2021;12(1):252–265. doi:10.1080/21655979.2020.1863016
33. McKinnon BD, Bertschi D, Bersinger NA, Mueller MD. Inflammation and nerve fiber interaction in endometriotic pain. Trends Endocrinol Metab. 2015;26:1–10. doi:10.1016/j.tem.2014.10.003
34. Grońska-Pęski M, Schachner M, Hébert JM. L1cam curbs the differentiation of adult-born hippocampal neurons. Stem Cell Res. 2020;48:101999. doi:10.1016/j.scr.2020.101999
35. Asante A, Taylor RN. Endometriosis: the role of neuroangiogenesis. Annu Rev Physiol. 2011;73(1):163–182. doi:10.1146/annurev-physiol-012110-142158
36. Finas D, Huszar M, Agic A, et al. L1 cell adhesion molecule (L1CAM) as a pathogenetic factor in endometriosis. Hum Reprod. 2008;23:1053–1062. doi:10.1093/humrep/den044
37. Herron LR, Hill M, Davey F, Gunn-Moore FJ. The intracellular interactions of the L1 family of cell adhesion molecules. Biochem J. 2009;419(3):519–531. doi:10.1042/BJ20082284
38. Burnor E, Yang L, Zhou H, et al. Neurofascin antibodies in autoimmune, genetic, and idiopathic neuropathies. Neurology. 2018;90(1):e31–e38. doi:10.1212/WNL.0000000000004773
39. Smith LB, Kasai S, Scott JG. Voltage-sensitive sodium channel mutations S989P + V1016G in Aedes aegypti confer variable resistance to pyrethroids, DDT and oxadiazines. Pest Manag Sci. 2018;74:737–745. doi:10.1002/ps.4771
40. Greaves E, Grieve K, Horne AW, Saunders PTK. Elevated peritoneal expression and estrogen regulation of nociceptive ion channels in endometriosis. J Clin Endocrinol Metab. 2014;99:E1738–E1743. doi:10.1210/jc.2014-2282
41. Samulin Erdem J, Arnoldussen YJ, Skaug V, Haugen A, Zienolddiny S. Copy number variation, increased gene expression, and molecular mechanisms of neurofascin in lung cancer. Mol Carcinog. 2017;56(9):2076–2085. doi:10.1002/mc.22664
42. Buhusi M, Midkiff BR, Gates AM, et al. Close homolog of L1 is an enhancer of integrin-mediated cell migration. J Biol Chem. 2003;278:25024–25031. doi:10.1074/jbc.M303084200
43. Shi Y, Zha J, Zuo M, Yan Q, Song H. Long noncoding RNA CHL1-AS1 promotes cell proliferation and migration by sponging miR-6076 to regulate CHL1 expression in endometrial cancer. J Cell Biochem. 2020;121(3):2655–2663. doi:10.1002/jcb.29486
44. Yang Z, Xie Q, Hu C-L, et al. CHL1 is expressed and functions as a malignancy promoter in glioma cells. Front Mol Neurosci. 2017;10:324. doi:10.3389/fnmol.2017.00324
45. Wu J, Huang W-J, Xi H-L, et al. Tumor-suppressive miR-3650 inhibits tumor metastasis by directly targeting NFASC in hepatocellular carcinoma. Aging. 2019;11(11):3432–3444. doi:10.18632/aging.101981
46. Zhang C, Wu W, Ye X, et al. Aberrant expression of CHL1 gene and long non-coding RNA CHL1-AS1, CHL1-AS2 in ovarian endometriosis. Eur J Obstet Gynecol Reprod Biol. 2019;236:177–182. doi:10.1016/j.ejogrb.2019.03.020
47. Zou G, Wang J, Xu X, et al. Cell subtypes and immune dysfunction in peritoneal fluid of endometriosis revealed by single-cell RNA-sequencing. Cell Biosci. 2021;11(1):98. doi:10.1186/s13578-021-00613-5
48. Ma J, Zhang L, Zhan H, et al. Single-cell transcriptomic analysis of endometriosis provides insights into fibroblast fates and immune cell heterogeneity. Cell Biosci. 2021;11(1):125. doi:10.1186/s13578-021-00637-x
49. Guo S-W, Du Y, Liu X. Platelet-derived TGF-β1 mediates the down-modulation of NKG2D expression and may be responsible for impaired natural killer (NK) cytotoxicity in women with endometriosis. Hum Reprod. 2016;31(7):1462–1474. doi:10.1093/humrep/dew057
50. Hammoudeh SM, Hammoudeh AM, Bhamidimarri PM, et al. Systems immunology analysis reveals the contribution of pulmonary and extrapulmonary tissues to the immunopathogenesis of severe COVID-19 patients. Front Immunol. 2021;12:595150. doi:10.3389/fimmu.2021.595150
51. Yao J, Gao R, Luo M, et al. Close homolog of L1-deficient ameliorates inflammatory bowel disease by regulating the balance of Th17/Treg. Gene. 2020;757:144931. doi:10.1016/j.gene.2020.144931
 © 2022 The Author(s). This work is published and licensed by Dove Medical Press Limited. The full terms of this license are available at https://www.dovepress.com/terms.php and incorporate the Creative Commons Attribution - Non Commercial (unported, v3.0) License.
By accessing the work you hereby accept the Terms. Non-commercial uses of the work are permitted without any further permission from Dove Medical Press Limited, provided the work is properly attributed. For permission for commercial use of this work, please see paragraphs 4.2 and 5 of our Terms.
© 2022 The Author(s). This work is published and licensed by Dove Medical Press Limited. The full terms of this license are available at https://www.dovepress.com/terms.php and incorporate the Creative Commons Attribution - Non Commercial (unported, v3.0) License.
By accessing the work you hereby accept the Terms. Non-commercial uses of the work are permitted without any further permission from Dove Medical Press Limited, provided the work is properly attributed. For permission for commercial use of this work, please see paragraphs 4.2 and 5 of our Terms.