")
Back to Journals » International Journal of Nanomedicine » Volume 13
Identification of mycolic acid forms using surface-enhanced Raman scattering as a fast detection method for tuberculosis
Authors Perumal J , Dinish US, Bendt AK , Kazakeviciute A, Fu CY, Ong ILH, Olivo M
Received 17 April 2018
Accepted for publication 8 June 2018
Published 4 October 2018 Volume 2018:13 Pages 6029—6038
DOI https://doi.org/10.2147/IJN.S171400
Checked for plagiarism Yes
Review by Single anonymous peer review
Peer reviewer comments 3
Editor who approved publication: Dr Thomas Webster
Jayakumar Perumal,1 US Dinishm,1 Anne K Bendt,2 Agne Kazakeviciute,1,3 Chit Yaw Fu,1 Irvine Lian Hao Ong,4 Malini Olivo1
1Laboratory of Bio-optical Imaging, Singapore Bioimaging Consortium, Agency for Science, Technology, and Research (A*STAR), Singapore; 2Singapore Lipidomics Incubator, Life Sciences Institute, National University of Singapore, Singapore; 3Department of Statistical Science, University College London, London, UK; 4Matralix Pte Ltd, Singapore
Background: Tuberculosis (TB) is the ninth leading cause of death worldwide and the leading cause from a single infectious agent, based on the WHO Global Tuberculosis Report in 2017. TB causes massive health care burdens in many parts of the world, specifically in the resource constrained developing world. Most deaths from TB could be prevented with cost effective early diagnosis and appropriate treatment.
Purpose: Conventional TB detection methods are either too slow as it takes a few weeks for diagnosis or they lack the specificity and accuracy. Thus the objective of this study was to develop a fast and efficient detection for TB using surface enhanced Raman scattering (SERS) technique.
Methods: SERS spectra for different forms of mycolic acids (MAs) that are both synthetic origin and actual extracts from the mycobacteria species were obtained by label-free direct detection mode. Similarly, we collected SERS spectra for γ-irradiated whole bacteria (WB). Measurements were done using silver (Ag) coated silicon nanopillar (Ag SNP) as SERS substrate.
Results: We report the SERS based detection of MA, which is a biomarker for mycobacteria species including Mycobacterium tuberculosis. For the first time, we also establish the SERS spectral characterization of the three major forms of MA – αMA, methoxy-MA, and keto-MA, in bacterial extracts and also in γ-irradiated WB. We validated our findings by mass spectrometry. SERS detection of these three forms of MA could be useful in differentiating pathogenic and nonpathogenic Mycobacterium spp.
Conclusions: We have demonstrated the direct detection of three major forms of MA – αMA, methoxy-MA, and keto-MA, in two different types of MA extracts from MTB bacteria, namely delipidated MA and undelipidated MA and finally in γ-irradiated WB. In the near future, this study could pave the way for a fast and efficient detection method for TB, which is of high clinical significance.
Keywords: Mycobacterium tuberculosis, MTB, nontuberculosis mycobacteria, NTM, mycolic acid, MA, SERS, silver-coated silicon nanopillars, Ag SNPs, liquid chromatography mass spectrometry, LC-MS
Introduction
Tuberculosis (TB) is one of the oldest infectious diseases. Even though good anti-TB drug exists, TB remains a major global health threat in many underdeveloped regions. According to the World Health Organization, TB accounts for 1.4 million deaths annually and close to 10 million newly infected people worldwide.1–3 In order to stop the global emergence of TB infections, rapid and reliable diagnosis of the causative agent, Mycobacterium tuberculosis (MTB), is crucial to begin adequate drug treatment. In countries where TB is endemic, the gold standard for diagnosis is still sputum-smear microscopy, followed by culturing of the bacteria. Its major limitations are low sensitivity and specificity (~60%) and long incubation of up to 6 weeks.4,5 The primary need is also to distinguish TB from all the other conditions (ie, infections) that may cause very similar clinical symptoms.
Emerging novel technologies, such as the GeneXpert system, rely on DNA amplification and are considered costly and potentially risky options, due to the fragile nature of the analyte.6–8 A number of approaches have proposed the use of mycolic acid (MA) as a marker for TB detection.8,9 MAs are long-chain fatty acids characteristic of mycobacteria, including M. tuberculosis. Due to their high abundance (up to 50% of bacterium dry weight is made up of MA) and their stable and inert nature, they are attractive targets for the direct detection of mycobacteria. Since MAs are characteristic of mycobacteria and humans do not synthesize any similar molecules, the detection of MA in a patient sample can serve as a surrogate marker for the infection.
There is great chemical diversity within the molecular structures of MA, mainly caused by differences in their chain lengths (ie, number of carbon atoms) and in the type and position of different functional groups on their meromycolate chain. The three main forms are αMA (AMA), methoxy-MA (MMA), and keto-MA (KMA). In MTB, AMA accounts for roughly 50%, while KMA and MMA constitute around 25% each.8 The chemical diversity within MA has been successfully used for classification of different mycobacterial strains and species employing chemometric methods.8 Importantly, it has been demonstrated that while AMA and KMA exist in all mycobacteria, MMA seems to be present mainly in pathogenic species,10,11 though this is still a topic of debate.
Recently, surface-enhanced Raman scattering (SERS) has emerged as a highly promising bioanalytical tool, because it enhances vibrational “fingerprint” Raman spectra of analytes, which allows for simultaneous multiplex detection with very high sensitivity.12–16 In this context, the use of SERS as a fast and reliable technique for the detection of MA holds significance. Raman spectroscopy has been successfully employed for the detection and characterization of various bacteria and virus species.12,13,17,18 In one of the pioneering studies of SERS for MA characterization, Omar et al extracted MA from MTB and non-TB mycobacteria strains and compared it with chromatography, mass spectrometry, and nuclear magnetic resonance.19 They also employed statistical analysis on Raman spectra for successful classification and identification of the mycobacterial species. In a follow-up study, Muhlig et al employed an easy and fast approach to disrupt mycobacteria and subsequently record its SERS spectra in a microfluidic platform. They successfully differentiated bacterial species using spectral profiles of whole MA.20
Though these studies established the potential of SERS for the detection of MA, detailed analysis and spectral characterization of various forms of MA are still lacking, because their relative presence generates better understanding of the various Mycobacterium spp. In this study, we initially carried out SERS spectral characterization of AMA, KMA, and MMA using synthetic MA samples adsorbed on a silver (Ag)-coated silicon nanopillar (Ag SNP) substrate. After establishing the spectral profiles of these samples, we detected their presence in delipidated (DL) and undelipidated (UDL) MA extracts from MTB and non-TB Mycobacterium spp. using the Ag-SNP substrate.
It should be noted that extraction of MA from mycobacterial cells for subsequent analysis requires the use of solvents and involves a rather lengthy procedure.21 In this context, having a detection method sensitive enough to detect various forms of MA directly from whole bacteria without the need for extraction would greatly facilitate fast and efficient detection, which has great potential for clinical translation. In this scenario, herein we also demonstrate the direct detection and classification of KMA, MMA, and AMA in γ-irradiated whole bacteria. To the best of our knowledge, this is the first SERS study on the various forms of MA in DL and UDL bacterial extracts and also in whole bacteria.
Methods
Materials
All chemicals were obtained from Sigma-Aldrich and used as received. Field-emission scanning electron microscopy (FE-SEM; JEOL USA, Inc., Peabody, MA, USA) was used for imaging the SERS substrates. Methanol, ethanol, and chloroform were purchased from Sigma-Aldrich. Metal targets for Ag deposition were obtained from Ted Pella. Synthetically pure MA forms were obtained from Avanti Polar Lipids. All the MTB used in the study was γ-irradiated and obtained from BEI Resources.
Extraction protocol
The H37Rv strain of γ-irradiated whole cells (NR14819, belonging to the MTB family) were used for MA extraction as described in the product-information sheet.22 These bacteria were inactivated by exposure to 2.4 mrad of ionizing γ-irradiation using a 137Cs source. Confirmation of inactivation was attained with Alamar blue assay. Delipidated MA extraction protocol from the MTB bacteria is described in detail, in the Supplementary material.
Silicon nanopillar-substrate fabrication
In brief, we did not use any sophisticated lithographic processes, such as mask aligners, photolithography, or E-beam lithography, to fabricate the nanostructures. Instead, we tapped into the anomaly that is inherent in semiconductor processing during the silicon-etching phase (Bosch process). During this phase, generation of Si grass takes place if the etching conditions are not controlled. In our study, we capitalized on this and made conditions favorable for uniform Si-grass growth. Mainly, we used SF6 and O2 as the etching media in the inductively coupled plasma etcher for our application. By controlling etching time and oxide thickness on the Si wafer, we were able successfully to generate randomly arranged nanoscale Si grass with spatial distribution <100 nm and length ~200–220 nm. The resultant SNP substrate was coated with 150 nm Ag using an E-beam evaporation system. Scanning electron microscopy of the substrate is shown in Figure 1.
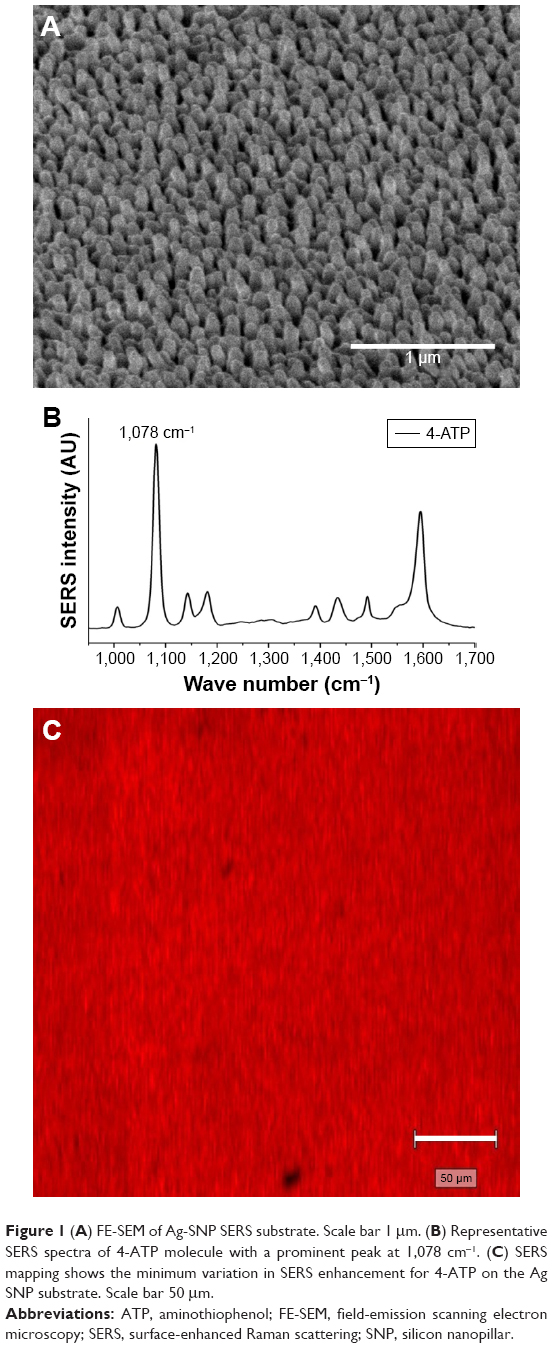 | Figure 1 (A) FE-SEM of Ag-SNP SERS substrate. Scale bar 1 μm. (B) Representative SERS spectra of 4-ATP molecule with a prominent peak at 1,078 cm−1. (C) SERS mapping shows the minimum variation in SERS enhancement for 4-ATP on the Ag SNP substrate. Scale bar 50 μm. |
Raman probe
4-Aminothiophenol (4-ATP) was used as the Raman-active molecule to estimate the performance of the fabricated SERS substrate. First, 100 μM 4-ATP (in 100% ethanol) was prepared and sonicated for 10 minutes to dissolve the analyte. Then, Ag-SNP substrates with randomly distributed SNPs were incubated with 4-ATP solution for 1 hour and subsequently washed with pure ethanol. This resulted in the formation of a monolayer of 4-ATP on the Ag-SNP substrates. Throughout the experiment, we monitored SERS intensity at a 1,078 cm−1 peak from 4-ATP to evaluate the reproducibility of the substrates.
SERS measurement
We used a Renishaw InVia Raman microscope with 785 nm excitation for acquisition of SERS spectra. This Raman system was integrated with a microscope (Leica), and laser light was coupled through an objective lens (50×, 0.75 nA), which was used to excite the sample and also to collect the scattered Raman signal. The dominant Rayleigh scattering was blocked with the help of a notch filter, and the beam spot on the sample was ~1 μm. Integration time was fixed at 10 seconds for spectral acquisition. For SERS measurement, extracted MA was dissolved in chloroform:methanol (9:1) medium. Whole MTB bacteria were also suspended in the same solvent medium. For each SERS measurement, about 5 μL sample was dropped onto the Ag-SNP substrate. For each sample, several scans were collected at various spots on the SERS substrate. After collecting SERS spectra from many locations of the substrates, postprocessing was done using WiRE 3.4 software (Renishaw plc., Gloucestershire, UK) associated with the instrument. Background subtraction was done by cubic spine interpolation. The instrument was calibrated with a standard silicon signal at 520 cm−1.
Supporting information
See Supplementary material for details on vibrational mode assignment of obtained SERS spectra, extraction of MA, mass spectroscopy, chemometric data analysis, and substrate-reproducibility study.
Results and discussion
SERS substrate characterization
Field-emission scanning electron microscopy of Ag SNPs is shown in Figure 1A and indicates the uniform distribution of the nanostructures. Intensity mapping of the 1,078 cm−1 peak from 4-ATP was used to estimate the uniformity in SERS enhancement from the substrate. Figure 1B shows representative SERS spectra of 4-ATP on Ag SNPs. As shown in Figure 1C, the approximate mapping area was 250×250 μm. We were able clearly to observe uniform SERS enhancement all over the substrate. The high enhancement region is shown in bright red, while relatively low-enhancement regions are shown in shades of black, where dark patches correspond to the area devoid of nanostructures. On average, estimated variation in signal enhancement was <10%, which is considered quite good in terms of reproducibility. We also evaluated substrate reproducibility using KMA molecules (Figure S1).
SERS characterization of synthetic MA
We established SERS spectral profiles of various forms of MA, as shown in Figure 2A. Notable peaks that consistently represented KMA were 713, 801, 854, 1,006, 1,132, 1,235, 1,276, 1,388, 1,452, 1,561, 1,589, and 1,629 cm−1. Table S1 lists the vibrational modes corresponding to these bands that have high intensities.14,16–20 In the case of AMA and MMA, both possessed overlapping Raman bands, particularly at 760, 808, 838, 857, 932, 964, 1,003, 1,139, 1,159, 1,258, 1,376, 1,493, 1,598, and 1,632 cm−1.
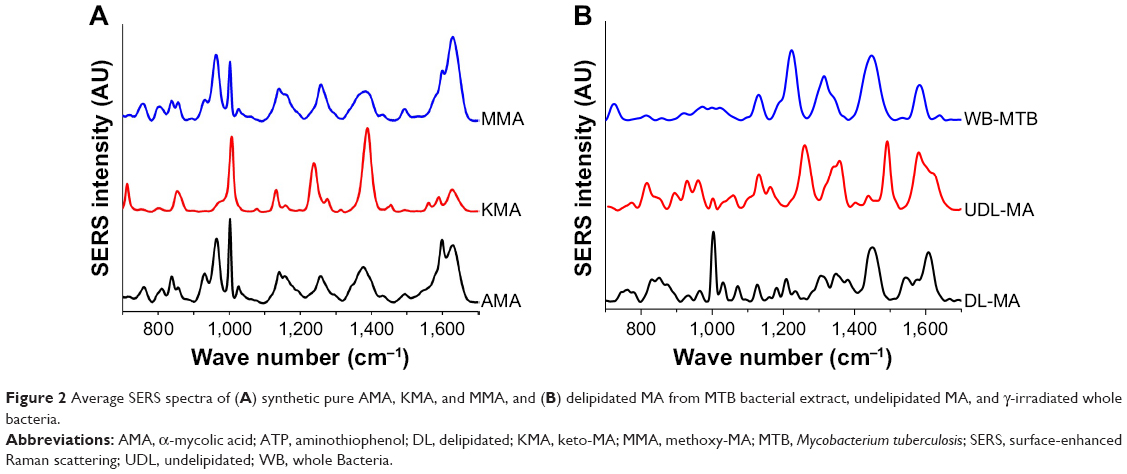 | Figure 2 Average SERS spectra of (A) synthetic pure AMA, KMA, and MMA, and (B) delipidated MA from MTB bacterial extract, undelipidated MA, and γ-irradiated whole bacteria. |
Since the spectral profiles of AMA and MM are quite similar, chemometric methods were employed for their differentiation. Supervised classification was used to distinguish AMA observations from MMA. Since the data set was multidimensional, ie, the number of variables (wave numbers at which we recorded SERS intensity) was much higher than the number of AMA and MMA observations, we had to apply dimension-reduction techniques prior to classification. We used principal-component analysis and functional principal-component analysis for dimensionality reduction and logistic regression, as well as linear discriminant analysis for classification. As a result, in external validation of the four methods, we were able to distinguish AMA from MMA with 90% accuracy. Details of the analysis are provided in Tables S2 and S3.
SERS study of MA extracts from MTB
After demonstrating the power of differentiating MA using chemometric analysis, similar analysis was also performed for MA in the bacterial extracts. Extraction of MA was performed using an established protocol.19 Two different types of MA extracts were prepared: DL MA, which results in the purest form of MA obtained from MTB and contains only the covalently bound MA from the cell wall; and UDL MA, which involves a much simpler extraction process and hence contains cell-wall phospholipids and noncovalently bound MA associated with the bacterial cell wall, in addition to covalently bound MA. SERS spectra of these MAs are shown in Figure 2B. The spectra of DL MA exhibited consistent peaks at 857, 932, 964, 1,003, 1,032, 1,073, 1,128, 1,160, 1,207, 1,235, 1,258, 1,348, 1,385, 1,445, 1,572, 1,598, and 1,632 cm−1, while for UDL MA salient peaks were at 857, 1,003, 1,032, 1,061, 1,131, 1,160, 1,231, 1,261, 1,441, 1,492, 1,580, and 1,630 cm−1. Vibrational mode assignments for the aforementioned peaks are included in Table S1.
In comparison with the spectra from synthetic MA, the following corresponding bands were observed in the extracts: 857, 932, 1,003, 1,159, 1,354, and 1,598 cm−1 from AMA and MMA, and 1,132, 1,235, and 1,452 cm−1 from KMA. As shown in Figure 3, we validated the presence of three MA forms in all bacterial extracts using mass spectrometry, which is the most commonly used analytical tool to detect and quantify MA. As expected, the vast majority of MAs were AMA (53%–59%), followed by KMA (28%–33%) and MMA (12%–14%).
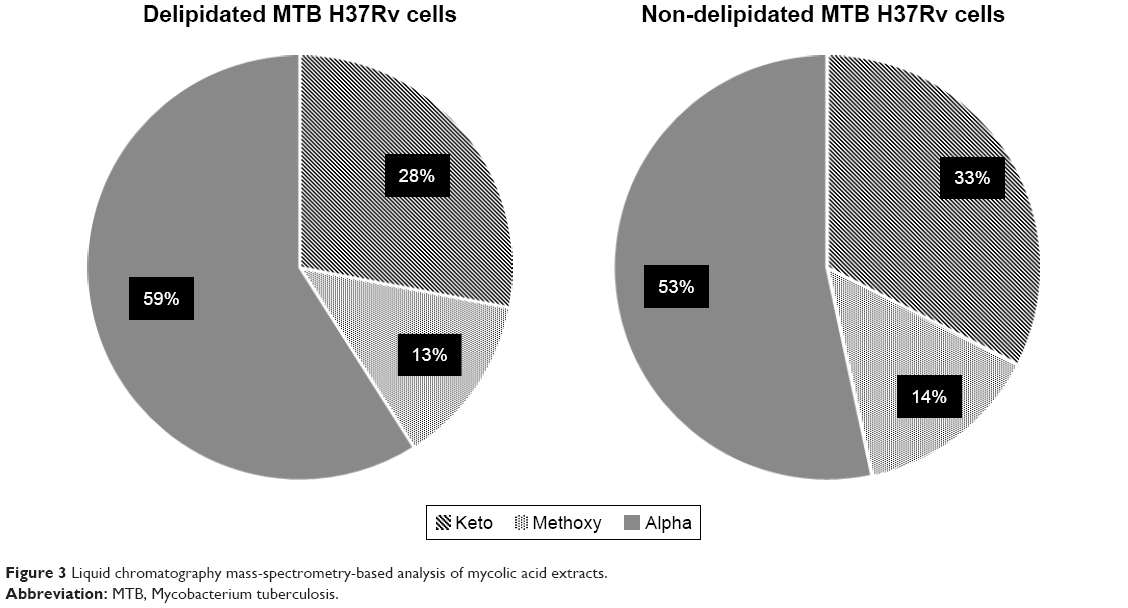 | Figure 3 Liquid chromatography mass-spectrometry-based analysis of mycolic acid extracts. |
SERS study of MA in intact MTB
SERS spectra of whole, intact MTB were obtained without any extraction method for disintegrating the cell membrane. Prominent Raman bands were observed at 714, 857, 918, ~1,000, ~1,025, 1,130, 1,141, 1,231, 1,245, 1,314, 1,343, 1,450, 1,585, and 1,636 cm−1 (Figure 2B). It was noted that SERS spectra of whole MTB-derived MA exhibited broader peaks, possibly as a result of contributions from multiple lipid components present in the bacteria that closely resembled targeted MA. This may have included various types of phospholipids and total MA that were covalently bound to the cell wall and also membrane proteins.
We observed specific Raman bands corresponding to different forms of MA in whole MTB without a sophisticated extraction protocol or any preprocessing, which is highly promising. The relative ratios of the three forms of MA are potential indicators of the pathogenicity of MTB. For instance, pathogenic TB-causing MTB strains have been described as having a higher relative ratio of MMA to the other MA forms.10,11
Conclusion
In this proof-of-concept study, SERS spectra of three major forms of MA – AMA, MMA, and KMA – which constitute the total MA present in mycobacteria, were identified successfully using Ag-SNP SERS substrates. Label-free MA characterization was performed for the MA derived from three different sources. To the best of the authors’ knowledge, this is the first such study to demonstrate SERS spectra of various forms of MA. Currently, we are developing sophisticated analytical and statistical tools to evaluate the relative abundance of these forms of MA. In future, this study might pave the way for a facile, highly adoptable, fast, and cost-effective analytical technique to identify the presence of different MA forms and their relative abundance directly from whole bacteria, without involving any laborious extraction methods. The potential ability of the proposed technique to detect the presence of TB directly from sputum samples of suspect carriers, especially in resource-scarce places and developing countries where expensive specialized equipment is unavailable, is highly promising.
Acknowledgments
This work was supported by intramural funding from the Biomedical Research Council of the Agency for Science, Technology, and Research (A*STAR), Singapore. The authors would like to express their gratitude to Dr Renuga Gopal and Thomas Yong (Matralix Pte Ltd, Singapore) for providing the γ-irradiated MTB samples, Prof Saif A Khan (National University of Singapore) for his constructive suggestions in experiment planning, and Jolander Lim (SLING Research Group, National University of Singapore) for the excellent technical help with the mass spectrometry. The authors would also like to thank Douglas Goh and Dr Tianxun Gong (Singapore Bioimaging Consortium) for their assistance in data acquisition.
Disclosure
The authors report no conflicts of interest in this work.
References
Raviglione M, Sulis G. Tuberculosis 2015: Burden, challenges and strategy for control and elimination. Infect Dis Rep. 2016;8(2):6570. | ||
World Health Organization. Global tuberculosis report 2015. Available from: http://apps.who.int/iris/bitstream/handle/10665/191102/9789241565059_eng.pdf;jsessionid=BF55634B83BC6F333F89A8E77B1899E2?sequence=1. Accessed September 12, 2018. | ||
World Health Organization. Global tuberculosis report 2017. Available from: http://apps.who.int/iris/bitstream/handle/10665/259366/9789241565516-eng.pdf?sequence=1. Accessed September 12, 2018. | ||
Ryu YJ. Diagnosis of pulmonary tuberculosis: recent advances and diagnostic algorithms. Tuberc Respir Dis. 2015;78(2):64–71. | ||
Parsons LM, Somoskövi A, Gutierrez C, et al. Laboratory diagnosis of tuberculosis in resource-poor countries: challenges and opportunities. Clin Microbiol Rev. 2011;24(2):314–350. | ||
Deggim V, Somoskovi A, Voit A, Böttger EC, Bloemberg GV. Integrating the Xpert MTB/RIF assay into a diagnostic workflow for rapid detection of Mycobacterium tuberculosis in a low-prevalence area. J Clin Microbiol. 2013;51(7):2396–2399. | ||
Lawn SD, Nicol MP. Xpert MTB/RIF assay: development, evaluation and implementation of a new rapid molecular diagnostic for tuberculosis and rifampicin resistance. Future Microbiol. 2011;6(9):1067–1082. | ||
Shui G, Bendt AK, Jappar IA, et al. Mycolic acids as diagnostic markers for tuberculosis case detection in humans and drug efficacy in mice. EMBO Mol Med. 2012;4(1):27–37. | ||
Marrakchi H, Lanéelle MA, Daffé M. Structures mycolic acids: biosynthesis, and beyond. Chem Biol. 2014;21:67–85. | ||
Yuan Y, Zhu Y, Crane DD, Barry CE. The effect of oxygenated mycolic acid composition on cell wall function and macrophage growth in Mycobacterium tuberculosis. Mol Microbiol. 1998;29(6):1449–1458. | ||
Forrellad MA, Klepp LI, Gioffré A, et al. Virulence factors of the Mycobacterium tuberculosis complex. Virulence. 2013;4(1):3–66. | ||
Buijtels PC, Willemse-Erix HF, Petit PL, et al. Rapid identification of mycobacteria by Raman spectroscopy. J Clin Microbiol. 2008;46(3):961–965. | ||
Driskell JD, Zhu Y, Kirkwood CD, Zhao Y, Dluhy RA, Tripp RA. Rapid and sensitive detection of rotavirus molecular signatures using surface enhanced Raman spectroscopy. PLoS One. 2010;5(4):e10222. | ||
Kho KW, Dinish US, Kumar A, Olivo M. Frequency shifts in SERS for biosensing. ACS Nano. 2012;6(6):4892–4902. | ||
Perumal J, Gong T, Dinish US, Buddharaju KD, Lo Guo-Qiang P, Olivo M. Development of optimized nanogap plasmonic substrate for improved SERS enhancement. AIP Adv. 2017;7(5);055017. | ||
Perumal J, Kong KV, Dinish US, Bakker RM, Olivo M. Design and fabrication of random silver films as substrate for SERS based nano-stress sensing of proteins. RSC Adv. 2014;4(25):12995. | ||
Liu TT, Lin YH, Hung CS, et al. A high speed detection platform based on surface-enhanced Raman scattering for monitoring antibiotic-induced chemical changes in bacteria cell wall. PLoS One. 2009;4(5):e5470. | ||
Jarvis RM, Goodacre R. Characterisation and identification of bacteria using SERS. Chem Soc Rev. 2008;37(5):931. | ||
Rivera-Betancourt OE, Karls R, Grosse-Siestrup B, Helms S, Quinn F, Dluhy RA. Identification of mycobacteria based on spectroscopic analyses of mycolic acid profiles. Analyst. 2013;138(22):6774. | ||
Mühlig A, Bocklitz T, Labugger I, et al. LOC-SERS: a promising closed system for the identification of mycobacteria. Anal Chem. 2016;88(16):7998–8004. | ||
Dupont C, Kremer L. Extraction and purification of mycobacterial mycolic acids. Bio Protoc. 2014;4(20):1–7. | ||
Mycobacterium tuberculosis [product Information sheet]. Virginia: BEI Resources; 2018. Available from: https://www.beiresources.org/Catalog/antigen/NR-14819.aspx. Accessed September 8, 2018. |
Supplementary materials
Extraction of mycolic acid from delipidated bacteria
For the initial delipidation of bacteria, 100 mg bacteria was treated with 1 mL chloroform–methanol (2:1 v:v) in Pyrex glass culture tubes and shaken overnight at 40°C to inactivate the pathogens and extract free lipids. Two blanks containing only 1 mL chloroform–methanol (2:1 v:v) were also included in the extraction to serve as controls. After overnight incubation, the mixtures were transferred to screw-capped tubes and rinsed once with 500 μL H2O. Delipidation was carried out by vortexing the mixture thoroughly for 1 minute and centrifuging at 14,000 rpm for 10 minutes at room temperature. The lower organic phase (containing free lipids) was removed. To reduce ion suppression by phospholipids and hydrolyzed fatty acids, a second delipidation with additional 500 μL chloroform was carried out by repeating the above steps. The upper aqueous phase and the lower organic phase were carefully removed. The intermediate layer was transferred to a fresh tube and dried.
These delipidated bacteria were then used for mycolic acid (MA) extraction, as described by Rivera-Betancourt et al5 (Dluhy protocol). In brief, 2 mL 20% methanolic KOH was added to 100 mg delipidated cells. Samples were incubated at 80°C for 30 minutes, then autoclaved at 121°C for 30 minutes. Chloroform (2 mL) was added, followed by 1.5 mL 50% HCl. Samples were centrifuged at 2,000 rpm at room temperature for 10 minutes. The chloroform layer was collected and air-dried overnight at room temperature.
Vibrational mode assignment for SERS spectra obtained
Vibrational mode assignments of the various surface-enhanced Raman scattering (SERS) peaks obtained from Mycobacterium tuberculosis (MTB) extracts and the whole MTB are listed in Table S1.
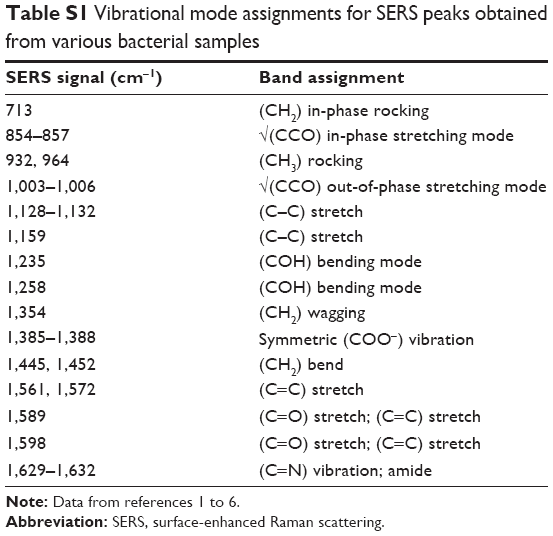 | Table S1 Vibrational mode assignments for SERS peaks obtained from various bacterial samples |
Liquid chromatography mass-spectrometry (LC-MS) analysis of MA
LC-MS/MS analysis was conducted on an Agilent 6490 mass spectrometer coupled to an Agilent 1290 Infinity LC. Electrospray ionization in negative-ion mode using multiple-reaction monitoring was performed: dwelling time 15 seconds, fragmentor 380 V, collision energy 60 V, cell-accelerator voltage 5 V, and MS1 and MS2 unit resolution. Source parameters were gas temperature 2,000°C, gas flow 14 L/min, nebulizer 350 PSIG, sheath gas temperature 3,500°C, and sheath gas flow 11 L/min. High-performance LC conditions for the analysis of MA were carried out as follows: a Maisch Reprospher C8-DE column of 1.8 μm (50×2 mm) was used to separate lipids. Methanol:5 mM ammonium acetate (99:1) and isopropanol:hexane:5 mM ammonium acetate (79:20:1) were used as mobile phases A and B, respectively, under gradient elution: 100% A for 1 minute, linearly changed to 100% B in 12 minutes, and maintained for 1 minute, then switched linearly to 100% A in 0.1 minute, followed by equilibration for 1.9 minutes. Column temperature was kept at 450°C throughout the analysis. Extracted MA was resuspended in mobile phase B and samples injected at a volume of 2 μL into the LC-MS/MS system at a flow rate of 0.3 mL/min. Agilent MassHunter workstation software (version B.08.00/build 8.0.8023.5 SP1) was used for LC-MS data acquisition and analysis. The signal intensity of each multiple-reaction-monitoring value was normalized to the total MA count or an internal standard for quantitative comparisons.
LC-MS was used to quantify a total of 116 molecular species comprising the three classes αMA (AMA; 60), keto-MA (KMA; 34), and methoxy-MA (MMA; 22) isolated from M. tuberculosis H37Rv cells following the Dluhy protocol. Concentration was 5 μg/mL. Relative abundance of each molecular species was calculated by normalizing against the total count for its respective class.
Chemometric data analysis
Before analysis, we processed spectral data, including normalization, smoothing, scaling, and concentration for differentiation of AMA and MMA. Note that logistic regression (LR) methods can be used directly only for binary (two-class) classification, while linear discriminant analysis (LDA) methods can be used for differentiating any number of classes that may be useful when differentiating AMA vs MMA vs KMA.
Validation
To test various data classification algorithms on the data, the following validation strategy was used:
- First, the data are randomly split into a training set (~80% of both groups) and a validation set (~20% of both groups).
- The training set is used to train the classifier. This is done by randomly dividing the training set into two parts, one of which is used for estimating the model parameters and the other for testing. The final estimates of model parameters are set to those that minimize the misclassification error on the testing set.
- The validation set is used to calculate the misclassification rate.
- Steps 1–3 represent one run: 100 such runs are done to account for the effects of random division of the data set, and the average misclassification rate is then reported.
The results of various classification methods are presented in Table S2. The functional methods performed similarly to their nonfunctional counterparts. When optimizing the parameter L, a tiebreaker was performed by choosing the maximum number L from the set {1,2, Lmax}. At each iteration (ie, for each run), the maximal candidate value of L was set to Lmax, where Lmax is the maximal number of components, explaining at least 1% of variance in the training set. This was done to avoid having a large number of retained principal components, which would imply overfitting to the training set.
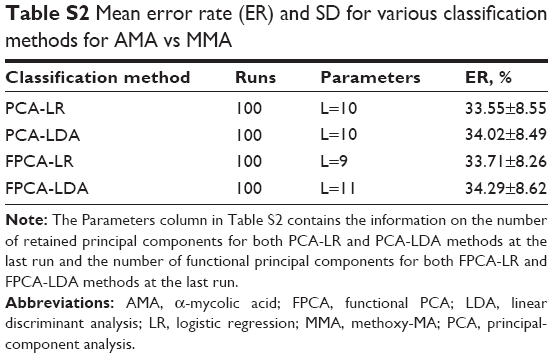 | Table S2 Mean error rate (ER) and SD for various classification methods for AMA vs MMA |
External validation
For external validation, we joined the AMA and MMA data sets to obtain one big training data set, on which we trained the classifiers. Evaluation of the performance of each of the classifiers was then done on the third external data set, which contained ten MMA observations. In the classifier training stage, the number of retained principal components was L=2. This was because the third (validation) data set seemed to differ a lot from the first two. Therefore, by using L=2, we were able to use only the minimal information of the joint training set for classification of the data in the validation set.
Results of the external validation are presented in Table S3. As we can see from Table S3, PCA-LR and PCA-LDA methods together with their functional equivalents had 90% correct label predictions. This demonstrated that in addition to the standard binary-classification methods for high-dimensional data, such as PCA-LR or PCA-LDA, functional classification methods, such as FPCA-LR and FPCA-LDA, were also used successfully for differentiation of AMA and MMA. The functional classification methods outperformed the standard nonfunctional ones in the presence of high measurement noise or outliers, for example.
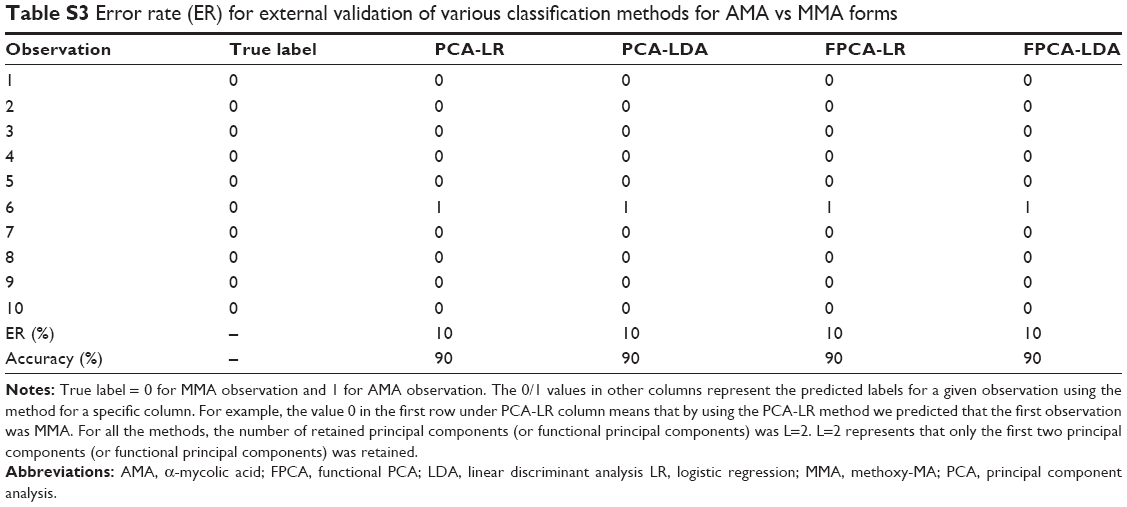 | Table S3 Error rate (ER) for external validation of various classification methods for AMA vs MMA forms |
Reproducibility study of Ag-SNP substrate using KMA
In order to reemphasize reproducibility, we acquired KMA spectra from different locations. Figure S1A shows the average SERS-signal intensity for the KMA peak at 1,006 cm−1, with the error bar indicating the SD. Variation was found to be within 10%. Figure S1B shows individual spectra from different substrate locations indicating high reproducibility.
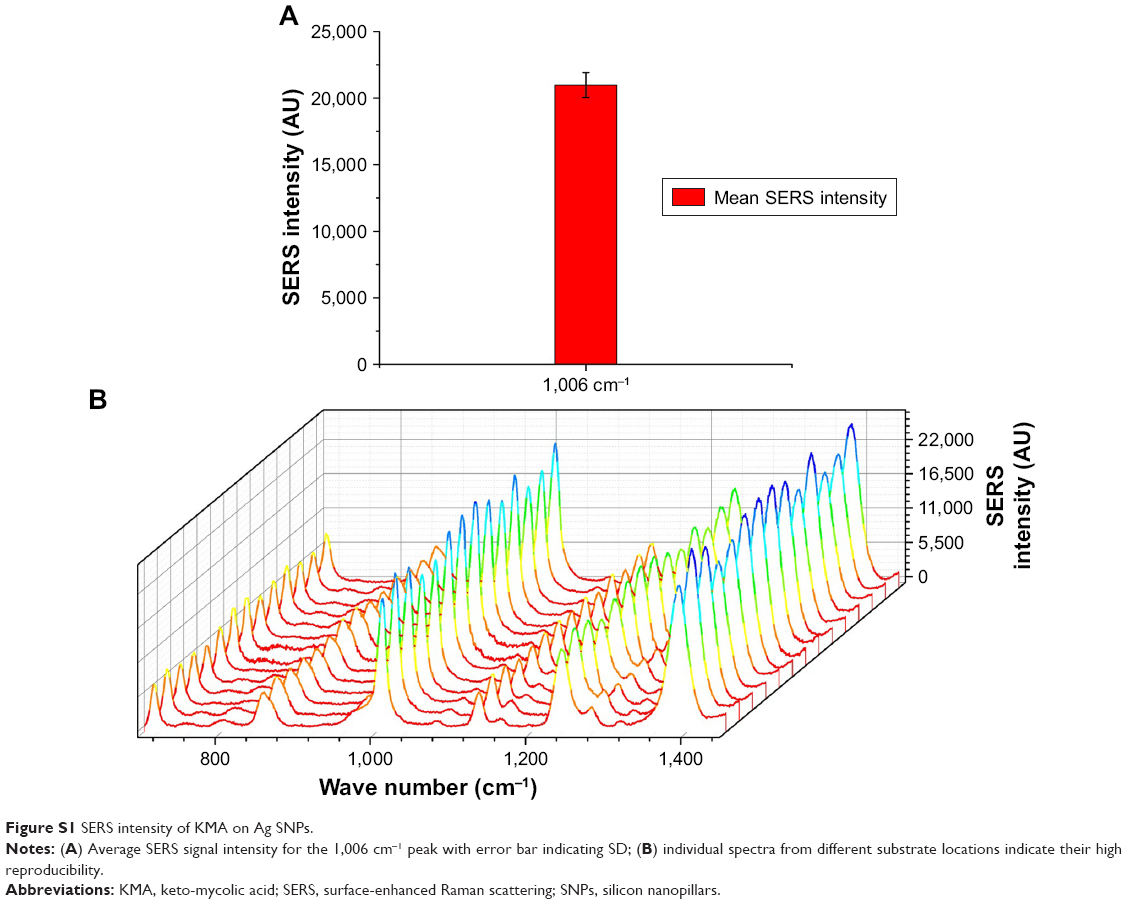 | Figure S1 SERS intensity of KMA on Ag SNPs. |
References
Kho KW, Dinish US, Kumar A, Olivo M. Frequency shifts in SERS for biosensing. ACS Nano. 2012;6:4892–4902. doi:10.1021/nn300352b. | ||
Perumal J, Kong KV, Dinish US, Bakker RM, Olivo M. Design and fabrication of random silver films as substrate for SERS based nano-stress sensing of proteins. RSC Adv. 2014;4:12995. doi:10.1039/c3ra44867c. | ||
Liu TT, Lin YH, Hung CS, et al. A high speed detection platform based on surface-enhanced Raman scattering for monitoring antibiotic-induced chemical changes in bacteria cell wall. PLoS One. 2009;4. doi:10.1371/journal.pone.0005470. | ||
Jarvis RM, Goodacre R. Characterisation and identification of bacteria using SERS. Chem Soc Rev. 2008;37:931. doi:10.1039/b705973f. | ||
Rivera-Betancourt OE, Karls R, Grosse-Siestrup B, Helms S, Quinn F, Dluhy RA. Identification of mycobacteria based on spectroscopic analyses of mycolic acid profiles. Analyst. 2013;138:6774. doi:10.1039/c3an01157g. | ||
Mühlig A, Bocklitz T, Labugger I, et al. LOC-SERS: A promising closed system for the identification of mycobacteria, Anal Chem. 2016;88:7998–8004. doi:10.1021/acs.analchem.6b01152. |
 © 2018 The Author(s). This work is published and licensed by Dove Medical Press Limited. The full terms of this license are available at https://www.dovepress.com/terms.php and incorporate the Creative Commons Attribution - Non Commercial (unported, v3.0) License.
By accessing the work you hereby accept the Terms. Non-commercial uses of the work are permitted without any further permission from Dove Medical Press Limited, provided the work is properly attributed. For permission for commercial use of this work, please see paragraphs 4.2 and 5 of our Terms.
© 2018 The Author(s). This work is published and licensed by Dove Medical Press Limited. The full terms of this license are available at https://www.dovepress.com/terms.php and incorporate the Creative Commons Attribution - Non Commercial (unported, v3.0) License.
By accessing the work you hereby accept the Terms. Non-commercial uses of the work are permitted without any further permission from Dove Medical Press Limited, provided the work is properly attributed. For permission for commercial use of this work, please see paragraphs 4.2 and 5 of our Terms.