")
Back to Journals » Journal of Hepatocellular Carcinoma » Volume 9
Identification of KRBA1 as a Potential Prognostic Biomarker Associated with Immune Infiltration and m6A Modification in Hepatocellular Carcinoma
Authors Liu Y, Fu B, Yu Z, Song G, Zeng H, Gong Y, Ding Y, Huang D
Received 15 March 2022
Accepted for publication 21 May 2022
Published 31 May 2022 Volume 2022:9 Pages 497—516
DOI https://doi.org/10.2147/JHC.S363862
Checked for plagiarism Yes
Review by Single anonymous peer review
Peer reviewer comments 4
Editor who approved publication: Prof. Dr. Imam Waked
Yue Liu,1,2 Bidong Fu,2 Zichuan Yu,2 Gelin Song,2 Hong Zeng,2 Yiyang Gong,2 Yongqi Ding,2 Da Huang3
1Second Affiliated Hospital of Nanchang University, Nanchang, Jiangxi Province, 330000, People’s Republic of China; 2Second College of Clinical Medicine, Nanchang University, Nanchang, Jiangxi Province, 330000, People’s Republic of China; 3Department of Thyroid Surgery, Second Affiliated Hospital of Nanchang University, Nanchang, Jiangxi Province, 330000, People’s Republic of China
Correspondence: Da Huang, Department of Thyroid Surgery, Second Affiliated Hospital of Nanchang University, No. 1 Minde Road, Nanchang, Jiangxi, 330006, People’s Republic of China, Tel +86 13576113993, Email [email protected]
Purpose: Hepatocellular carcinoma (HCC) is a malignancy with high incidence, but its prognosis is not optimistic. KRBA1 is a member of the KRAB family and participates in the regulation of gene transcription. However, no studies have focused on the role of KRBA1 in HCC.
Patients and Methods: In this study, we first analyzed the expression of KRBA1 in HCC using TCGA and ICGC databases and validated by Immunohistochemistry in clinical HCC samples. The Wilcoxon rank-sum test was used to determine the relationship between KRBA1 expression and clinicopathological features. Subsequently, we used Kaplan-Meier online website analysis and Cox regression model to predict the prognostic value of KRBA1 in HCC patients. Furthermore, the functions of KRBA1 were identified by enrichment analysis. TIMER and GSCALite were used to investigate the relationship between KRBA1 expression in HCC and immune infiltration and drug targets, respectively. Finally, the relationship between KRBA1 expression and m6A modification in HCC was analyzed using the TCGA and ICGA datasets.
Results: The results showed that KRBA1 was upregulated in HCC and was associated with many clinicopathological features. High KRBA1 causes poor overall survival and may be an independent risk factor for HCC. KRBA1 tends to be hypermethylated and associated with poor prognosis in HCC compared with normal tissues. Enrichment analysis indicates that KRBA1 is associated with cell cycle and immune processes, and TIMER analysis shows that KRBA1 expression is associated with infiltration levels and immune characteristics of various immune cells. Silenced KRBA1 evidently reduced three chemokine expression in HCC cells. Drug sensitivity analysis showed that KRBA1 was sensitive to 39 drug small molecules. KRBA1 showed a strong positive correlation with five m6A related genes.
Conclusion: KRBA1 is a prognostic biomarker associated with HCC immunity and m6a modification, serving as an effective target for the diagnosis and treatment of HCC.
Keywords: KRBA1, prognosis, biomarker, immune infiltration, hepatocellular carcinoma, m6A modification
Introduction
Primary liver cancer (PLC) is a type of malignant tumor of the digestive system, among which hepatocellular carcinoma (HCC) is the main histological type of PLC.1 HCC is the fifth most common cancer worldwide and ranks second in cancer-related deaths.2,3 For the past few years, the morbidity and death rate of HCC have been rising in many regions due to the hidden incidence and rapid development of HCC, and most patients have reached an advanced stage when they are diagnosed.4 The detection of Alpha-fetoprotein (AFP), B-ultrasound sound, and computed tomography imaging are the main methods for the diagnosis of HCC at present, but the rate of misdiagnosis and missed diagnosis are still high.5–7 While the identification of useful biomarkers for surveillance and early diagnosis of HCC is still insufficient. Accordingly, there is an urgent need to explore advanced early diagnostic markers and treatment targets to improve the prognosis of HCC patients.
It was reported that the KRAB domain acts as a platform for the recruitment of a transcriptional inhibitory complex (including histone deacetylase), involved in the maintenance of nucleoli, cell differentiation, cell proliferation, apoptosis, deacetylase, and tumor transformation.8 According to the NCBI database, we know that KRBA1 (as a gene containing the KRAB-A domain) is located on human chromosome 7. The KRAB domain is generally associated with the transcriptional regulation of gene expression, and the gene KRBA2 containing the KRAB domain has been shown to be a transcription factor.9,10 However, based on existing reports, our knowledge of KRBA1 is very limited. It has been reported that KRBA1 plays a role as a novel stop-gain mutation in familial neurodegenerative diseases,11 but no study has reported whether KRBA1 affects tumor progression. Therefore, we conducted this study to discover the effect of KRBA1 on HCC.
In this study, we evaluated KRBA1 expression in HCC by using two public databases and clinical samples. To explore the relationship between the expression of KRBA1 and the clinicopathological characteristics of HCC, we used the Wilcoxon rank sum test. To determine the effect of KRBA1 expression on the prognosis of HCC, we used the Kaplan-Meier method. We investigated the transcriptomic alterations and functional networks associated with KRBA1 in HCC and explored the relationship of KRBA1 with immune infiltration, m6A modification, and drug sensitivity in HCC. Our work demonstrates that KRBA1 is a novel HCC biomarker that can contribute to prognosis and treatment.
Materials and Methods
Data Source and Processing
The Cancer Genome Atlas (TCGA) database (https://cancergenome.nih.gov) was used to obtain the expression profiles of different genes in LIHC and corresponding clinical information.12 In terms of gene expression, this study contains 374 cancer samples and 50 normal samples. The file type is HTSeq-FPKM. We got clinical information from 377 clinical samples. In addition, RNA-seq data and clinical information were also acquired from the ICGC website. [LINC-JP] Liver Cancer - NCC, JP datasets included 202 normal samples and 243 tumor samples, as well as 260 clinical information samples.
Patients and Tumor Specimens
Human HCC tissues and matched adjacent tissues were obtained from 40 patients undergoing nephrectomy in the Second Affiliated Hospital of Nanchang University from January 2018 to January 2021. The patient’s informed consent was obtained. At the same time, the research ethics committee of the Second Affiliated Hospital of Nanchang University agreed to experiment.
GEPIA Database Analysis
The Gene expression profiling interactive analysis (GEPIA) database (http://gepia.cancer-pku.cn/) was employed to visualize clinicopathological features, overall survival (OS) and disease-free survival (DFS) curves.13 The overall survival of the m6A correlation genes IGF2BP2, RBM15B, YTHDF1, HNRNPA2B1, and METTL3 in the HCC was also generated through this site.
Immunohistochemistry
Cut formalin-fixed, paraffin-embedded HCC tissue into 4 μm-thick sections. After deparaffinization, rehydration, and microwave heating in microwave-heated antigen unmasking solution (EDTA, pH8.0) to repair the antigen, 30 minutes in total was used to seal the sections with goat serum. Next, incubate the sections overnight with anti-KRBA1 monoclonal antibody (KRBA1-Novus Biologicals-Catalog number: NBP2-58786) at 4°C. After that, HRP-conjugated secondary antibody (Boster) was allowed to stand at room temperature for 2 hours. Subsequently, the two-step method (catalog no: PV-9000; ZSGB-BIO Co., Ltd., Beijing, China) were used for immunostaining. Finally, three pathologists who were unaware of the clinical parameters assessed the staining intensity and the percentage of positive cells semi-quantitatively.14
UALCAN Database Analysis
UALCAN (http://ualcan.path.uab.edu/) is an integrated and accessible online website for analyzing cancer OMICS data.15 We employed the UALCAN database to study the transcription, expression, methylation, and prognosis of genes in TCGA LIHC datasets.
MethSurv Tool
MethSurv (https://biit.cs.ut.ee/methsurv/) is an interactive and amicable site furnishing univariable and multivariable survival analysis based on DNA methylation biomarkers.16 We investigated the prognostic value and expression level of CpG methylation of KRBA1 in HCC.
LinkedOmics Analysis
LinkedOmics (http://www.linkedomics.org/login.php) database was employed to explore co-expressed genes of KRBA1 in LIHC.17 The generating volcano plots, heat maps, and scatter plots could display the co-expressed genes which were analyzed by statistical methods. Gene set enrichment analysis (GSEA) can also be found in LinkedOmics functional modules to execute Gene Ontology (GO) term annotation, Kyoto Encyclopedia of Genes and Genomes (KEGG) pathway analysis. The Spearman correlation test was used for statistical analysis.
GeneMANIA Analysis
GeneMANIA (http://www.genemania.org) is an analytical tool to analyze the interaction of gene clusters including physical interactions, gene co-expression, gene co-localization, gene enrichment analysis, and website prediction.18 Interactions between KRBA1 and the top 4 positive correlation genes were analyzed. In the displayed results, the protein is represented by a small circle, and the strength of the interaction is represented by the size of the circle.
Gene Set Enrichment Analysis (GSEA)
GSEA can be used to analyze and explain genome-wide expression profiles based on biological background.19 GSEA v4.1.0 software was used to conduct a group study on the RNA-sequencing data of 374 TCGA LIHC patients downloaded from Genomic Data Commons (https://portal.gdc.cancer.gov/). We divided the sample into high and low expression groups and set the following parameters: gene set database: h. All. V7.4 Symbols. gmt (Hallmarks); the number of permutations: 1000; P value <0.05; false discovery rate (FDR) <0.25.
TIMER Database Analysis
TIMER is a comprehensive web using to analyze the levels of immune invasion in diverse cancers (https://cistrome.shinyapps.io/timer/).20 “Diff Exp” module was employed to determine the expression of KRBA1 in diverse tumors. The correlation of tumor infiltrating immune cells (B cells, CD4+ T cells, CD8+ T cells, Neutrophils, Macrophages, and Dendritic cells) with mRNA expression and copy number variation of KRBA1 in LIHC was evaluated by “Gene” and “ SCNA” module. The pertinence between KRBA1 and immune cells’ gene markers in LIHC were verified using the “Correlation”.
HCMDB Database Analysis
The Hepatocellular Cancer Database (HCCDB) (http://lifeome.net/database/hccdb/home.html) is a database of HCC expression maps containing 15 open HCC gene expression datasets amount to 3917 samples.21 We used HCCDB to study the difference of KRBA1 expression between tumors and adjacent tissues.
TISIDB
TISIDB (http://cis.hku.hk/TISIDB/) is a compositive repository online website probing of interactions between tumors and the immune system.22 We employed it to dissect KRBA1 expression of different immune subtypes in LIHC.
Cell Culture
We bought the Human HCC cell lines LM3 from the Shanghai Institute of Cell Biology in China. Transfection Human HCC cell lines LM3 were maintained with 5% CO2 at 37◦C in DMEM (HyClone Germany) with 10% fetal bovine serum (GIBCO USA).
Real-Time RT-PCR Analyses
Total RNAs were extracted using the QIAGEN RNeasy mini kit, and reverse transcription reactions were performed using the ABI Taqman Reverse Transcription Reagents. After mixing the generated cDNA templates with primers/probes and ABI Taqman Fast Universal PCR Master Mix, reactions were performed with the ABI-7900 Fast Real-time PCR system and SYBR green qPCR Mastermix from Agilent Technologies Stratagene.
Kaplan-Meier Plotter Database Analysis
The prognostic value of KRBA1 was analyzed in liver cancer using the KM Plotter database (http://kmplot.com). The patients’ specimens were split into two groups according to the median value of expression level to analyze the overall survival (OS), replace-free survival (RFS), progression-free survival (PFS), and disease special survival (DSS).
GSCALite Analysis
GSCALite (http://bioinfo.life.hust.edu.cn/web/GSCALite/) is a multifunctional genomics online portal for analyzing gene expression, methylation, single nucleotide variation, pathway activity and drug susceptibility.23 In this research, the GSCALite tool was used to analyze the pathway activities and drug sensitivity of KRBA1, KCTD17, TRIM17, ARHGEF2, and WNK2.
Statistical Analysis
All statistical analysis in this research was completed by R software (version 3.6.3). The “limma” and “beeswarm” packages of “R” and the rank-sum test were used for detecting the different expressions of KRBA1 between LIHC samples and normal samples.24 Wilcoxon signed-rank test or Kruskal–Wallis test and logistic regression were used to scrutinize the relevancy between KRBA1 expression and clinicopathological features. Then generating Kaplan-Meier survival curve and using Log rank test to explore the survival distribution of patients with different expression levels and to evaluate whether differential gene expression had a significant impact on the prognosis of patients (P <0.05). The “survival” and “survminer” packages of “R” were used to construct Cox models, and the factors significantly correlated with prognosis were screened out by Univariate and Multivariate Cox regression analysis (P <0.05). Finally, the ROC curve generated by “survival ROC” was used to evaluate the predictive ability of KRBA1 expression levels on one-year, three-year, or five-year survival.
Results
The Expression of KRBA1 in LIHC and Other Cancers
To investigate the differential expression of KRBA1, we first studied the expression of KRBA1 in LIHC and other tumors by using the TIMER database. As shown in Figure 1A, the mRNA expression of KRBA1 was significantly elevated in tumor tissues. Meanwhile, we also found a higher expression level of KRBA1 mRNA in more than 10 tumors than in corresponding adjacent tissues. Then 10 HCC cohorts from the HCCDB database were used for our analysis, and the results also confirmed that KRBA1 mRNA expression was significantly increased in HCC tissues compared with adjacent normal groups (Figure 1B). However, not all the results in each group were meaningful, so we downloaded 374 LIHC tissue samples and 50 paracancerous normal tissue samples from the TCGA database for further study. The results showed that KRBA1 was highly expressed in LIHC tissues compared with paracarcinoma tissues (Figure 1C). In addition, we analyzed the expression of KRBA1 by utilizing 50 pairs of matched cancer and paracancerous tissue samples in the TCGA database. Similarly, KRBA1 was overexpressed in HCC tissues (Figure 1D). Recordset LIRI-JP (Liver Cancer RIKEN, JP) downloaded from the ICGC database again verified our previous results are credible (Figure 1E). Next, we obtained the immunohistochemistry (IHC) results from clinical samples to verify the difference in KRBA1 protein expression (Figure 1F). We found that the expression of KRBA1 protein in HCC tissues was higher than that in normal tissues. All in all, our results demonstrated that KRBA1 mRNA and protein expression are overexpressed in HCC.
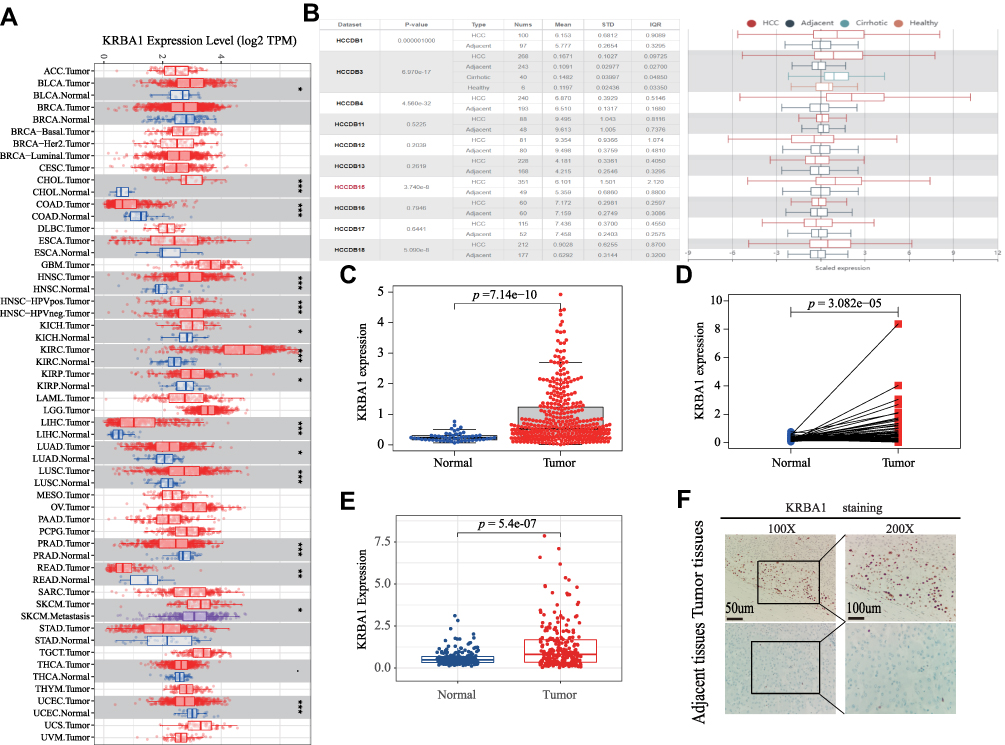 |
Figure 1 KRBA1 expression levels in LIHC and Other Cancers. (A) The mRNA expression levels of KRBA1 in pan-cancers based on the TIMER database. (B) The mRNA expression levels of KRBA1 in HCC and normal tissues based on the HCCDB database. (C) The mRNA expression levels of KRBA1 in 374 tumor cases and 50 normal tissues cases based on TCGA database. (D) The mRNA expression levels of KRBA1 in 50 pairs of matched tumor and normal tissue cases based on TCGA database. (E) The mRNA expression levels of KRBA1 based on ICGC database. (F) Typical images of IHC in 40 pairs of HCC tissues showing the protein expression of KRBA1 in HCC and adjacent tissues. Abbreviations: LIHC, liver hepatocellular carcinoma; IHC, immunohistochemistry. |
Correlation Between KRBA1 Expression and Clinicopathological Features in LIHC
Analysis of data for 377 clinical samples downloaded from the TCGA database with the Wilcoxon rank-sum test indicated that the expression of KRBA1 was significantly associated with clinical characteristics such as stage (p =5.392e−04), grade (p =0.043), tumor size (p =4.045e−04) and sex (p =0.023) (Figure 2). Subsequently, we obtained the same results through logistic regression analysis: upregulation of KRBA1 expression was associated with age, sex, clinical stage, and T classification but not with clinicopathological N stage or M stage (Supplementary Table 1). In addition, we obtained similar results by analysis of the UALCAN and GEPIA databases and further found that KRBA1 expression was correlated with clinicopathological features such as TP53 mutation status and histological subtype (Supplementary Figure 1). Collectively, our findings show that the expression level of KRBA1 in LIHC patients is consistent with the basic clinicopathological features.
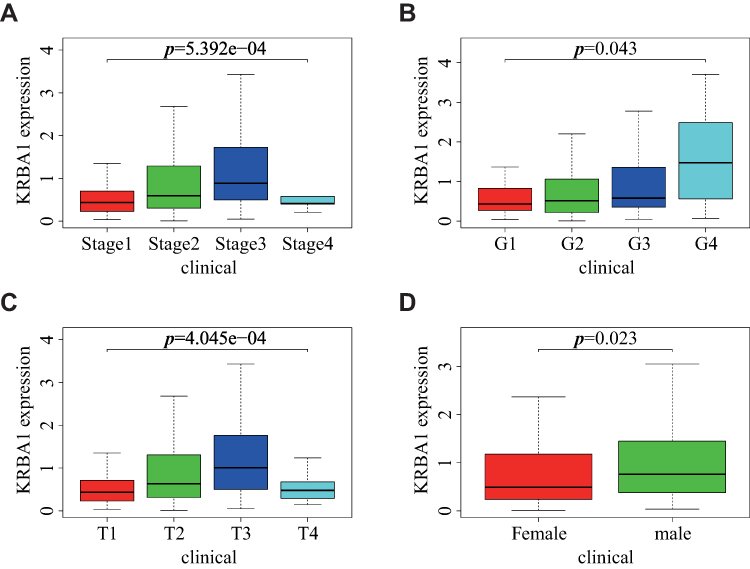 |
Figure 2 Relationship between KRBA1 expression and clinicopathological features. (A) stage; (B) grade; (C) T classification; (D) gender. |
KRBA1 Expression is an Independent Prognostic Factor Correlated with Poor Prognosis in LIHC Patients
Multiple databases were used to evaluate the value of differential KRBA1 expression in predicting HCC prognosis. We first used the GEPIA database to analyze the relationship between KRBA1 expression and prognosis, and the results showed that in the LIHC dataset, patients with high KRBA1 expression had shorter overall survival (OS) and disease-free survival (DFS) times than patients with low KRBA1 expression (Supplementary Figure 2A and B). Next, we reverified the survival of HCC patients in the Kaplan–Meier Plotter database and found that patients with high KRBA1 expression had shorter OS, DFS, PFS, and DSS times (Figure 3A–D). In addition, the results from UALCAN database analysis showed that high KRBA1 expression was significantly associated with short survival times in the subgroup analysis of HCC patients stratified by tumor grade, sex, and race (Supplementary Figure 2C–F).
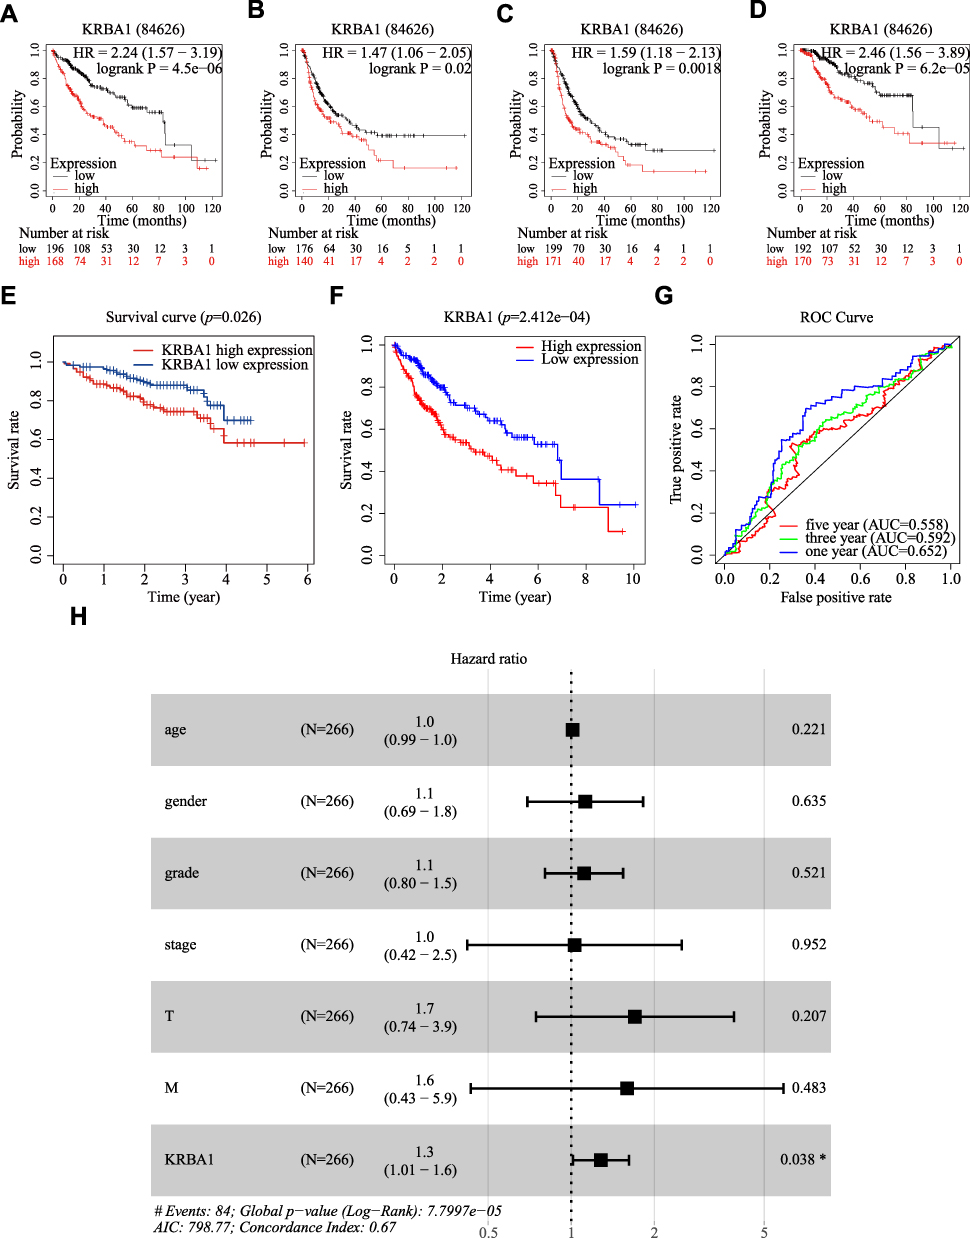 |
Figure 3 KRBA1 expression is an independent prognostic factor correlated with poorer prognosis of LIHC patients. (A–D) Relationship between KRBA1 expression and OS, DFS, PFS and DSS based on Kaplan-Meier Plotter database. (E) Relationship between KRBA1 expression and Survival based on ICGC database. (F) HCC patients with lower expression level of KRBA1 had favorable prognosis based on 240 patients downloaded from TCGA. (G) ROC curves for the 1-, 3-, and 5-year survival according to the expression level of KRBA1. (H) A forest plot of the results of the multivariate analysis. *p< 0.05; **p< 0.01; ***p< 0.001. Abbreviations: AUC, area under the curve; ROC, receiver operating characteristic; HR, hazard ratio; CI, confidence interval; T, tumor; N, node, M, metastasis; OS, overall survival; AIC, Akaike’s information criterion. |
Then, Kaplan–Meier analysis was performed on 240 patients whose information was downloaded from the ICGC Data Portal and the TCGA database, and survival curves were constructed. In addition, ROC curves were constructed to further explore the prognostic value of KRBA1. The results showed that high KRBA1 expression was significantly correlated with a low OS rate (Figure 3E and F), and the AUC values of the ROC curve indicated significant accuracy (1-year AUC: 0.652, 3-year AUC: 0.592, and 5-year AUC: 0.558), suggesting that KRBA1 expression was an effective predictor of survival in HCC patients (Figure 3G). Finally, univariate and multivariate Cox regression models were used to analyze the relationship between clinical features and prognosis in patients with LIHC. Multivariate analysis showed that KRBA1 expression was an independent prognostic factor (Figure 3H). Taken together, these results suggest that KRBA1 expression is an independent prognostic marker in LIHC and that high KRBA1 expression is associated with poor prognosis in LIHC.
The Promoter Methylation Level of KRBA1 in LIHC
Methylation is considered an important epigenetic modification mechanism that plays an important role in gene expression and is thus closely related to the development of tumors.25,26 We first detected the methylation level of the KRBA1 promoter using the UALCAN database to explore its correlation with the high expression of KRBA1 in tumor tissues to explain the possible mechanism of its involvement in hepatocellular carcinogenesis. We found that the KRBA1 promoter was hypermethylated in LIHC tissues compared to normal tissues (Figure 4A). In addition, promoter methylation in KRBA1 expression subgroups was analyzed according to different clinical characteristics. We found that promoter methylation levels in patients were positively correlated with age and body weight (Figure 4B and C). Then, we used MethSurv to further explore the methylation of KRBA1 by evaluating the prognostic value of each CpG in TCGA data. Overall, KRBA1 methylation levels were high in LIHC (Figure 4D). We found that 4 of the 14 CpG sites associated with hypermethylation were positively associated with poor prognosis (P< 0.05): cg23371350, cg05997116, cg24501315, and cg04468334 (Figure 4E–H). These results suggest that hypermethylation may be associated with the abnormal expression of KRBA1.
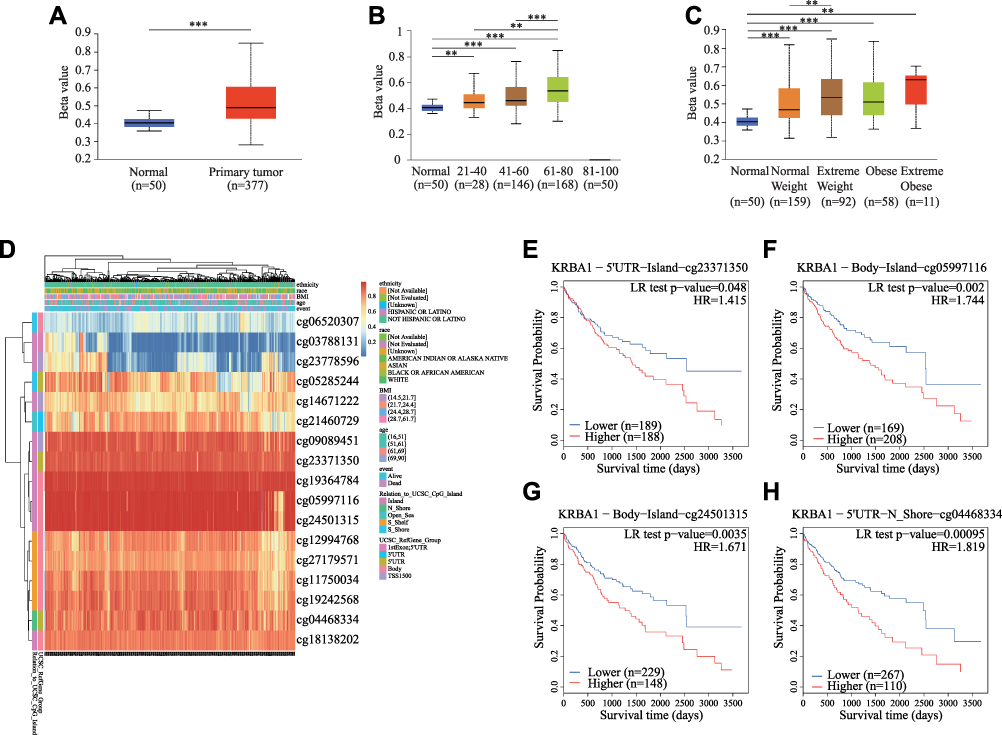 |
Figure 4 The KRBA1 DNA methylation levels and its prognostic value. (A) Sample type; (B) Patient’s age; (C) Patient’s weight; (D) The visualization between the methylation level and the KRBA1 expression. (E–H) The Kaplan-Meier survival curve of the promoter methylation of KRBA1. *p < 0.05; **p < 0.01; ***p < 0.001. |
Potential Pathway Regulated by KRBA1 in LIHC
Since the high expression levels of KRBA1 have significant prognostic value in LIHC, we decided to explore which regulatory pathways KRBA1 is involved in. We explored the co-expressed genes of KRBA1 in LIHC with the LinkedOmics database. Based on the Spearman test, 6526 genes (dark red dots) revealed positive associations with KRBA1, whereas 2590 genes (dark green dots) indicated negative associations (false discovery rate, FDR< 0.01) (Figure 5A). The top 50 genes that were positively and negatively associated with KRBA1 are shown by heatmap (Figure 5B and C). Moreover, KRBA1 and the top 4 significant genes, including KCTD17, TRIM17, ARHGEF2, and WNK2, were significantly positively related to KRBA1 in LIHC. They were considered to be important influencing genes that play a role in KRBA1, namely, hub genes (Figure 5D–G).
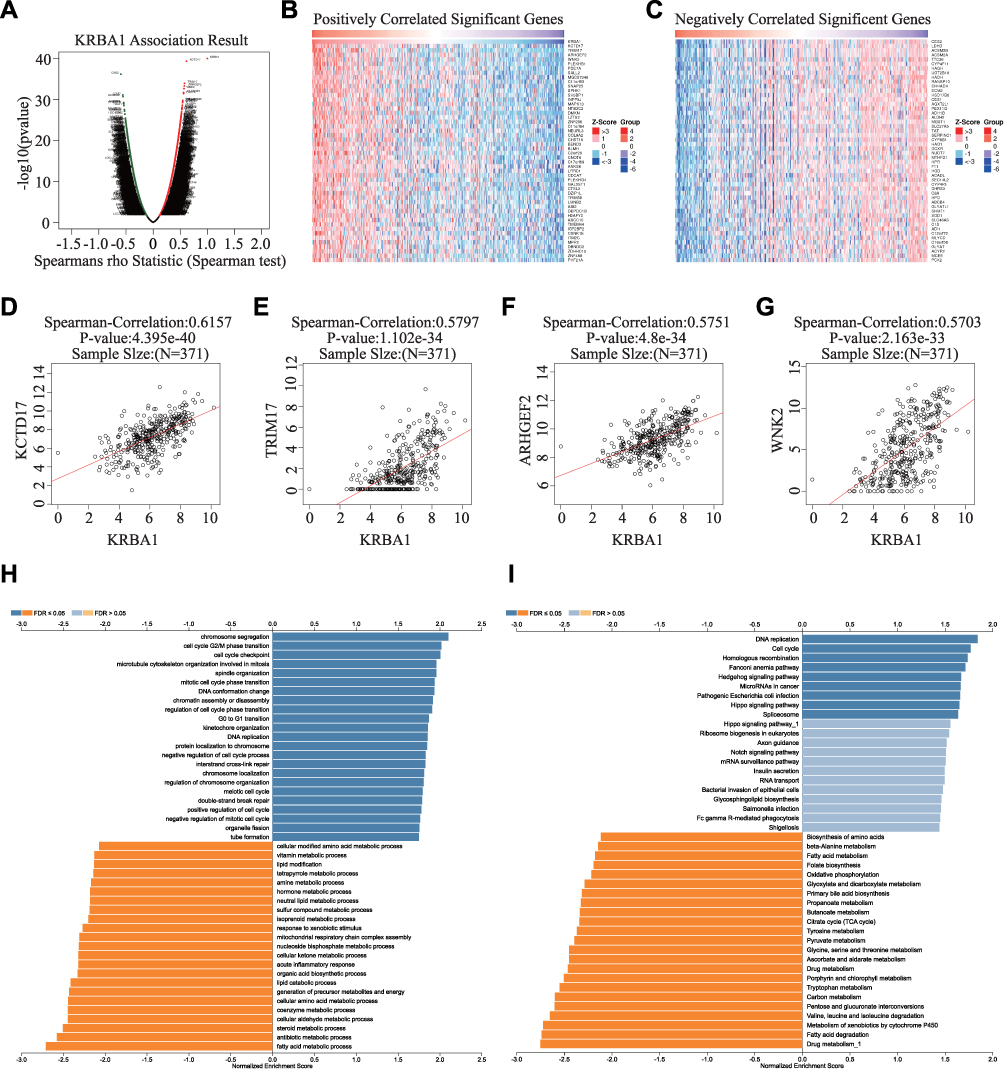 |
Figure 5 The potential KRBA1-regulated pathway. (A) The volcano plot of KRBA1 co-expressed genes in LIHC. (B and C) Heat maps showing genes positively and negatively related to KRBA1 in the LIHC (TOP 50). (D–G) The scatter plot showed correlation between the hub genes and KRBA1 in LIHC. (H and I) GO analysis (biological process) and KEGG pathways of KRBA1 in the LIHC cohort. |
Next, Gene Ontology (GO) enrichment analysis suggested that KRBA1 might participate in chromosome segregation, cell cycle G2/M phase transition, cell cycle checkpoint, and G0 to G1 transition (Figure 5H). Kyoto Encyclopedia of Genes and Genomes (KEGG) pathway analysis suggested that KRBA1 may be related to the regulation of DNA replication, and cell cycle, etc. (Figure 5I). These results suggest that KRBA1 may have a marked effect on the cell cycle in LIHC.
To further investigate the potential regulatory pathway of KRBA1 in LIHC, we used Gene Set Enrichment Analysis (GSEA) to evaluate the different KRBA1 expression groups based on TCGA LIHC data sets. The GSEA analysis showed that ubiquitin-mediated proteolysis, cell cycle pathways in cancer, Wnt signaling pathway, mTOR signaling pathway, Fc gamma R-mediated phagocytosis, Notch signaling pathway, DNA replication, melanoma, regulation of autophagy, p53 signaling pathway, and apoptosis were enriched in the KRBA1 high expression group (Supplementary Figure 3) (Supplementary Table 2). On the contrary, the metabolism of various substances and amino acids was enriched in the KRBA1 low expression group (Supplementary Table 3).
Association Between KRBA1 and Immune Infiltration in LIHC
In view of the close relationship between immunological features and tumor development, we explored the relationship between KRBA1 and infiltrating immune cells using the TIMER database. The KRBA1 expression was positively related to the infiltration of B cells, CD8+ T cells, CD4+ T cells, macrophages, neutrophils, and dendritic cells (Figure 6A, P< 0.05). Afterwards, the correlation between the copy number variation (CNV) of KRBA1 and the level of immune cell infiltration was considered for our study. The results demonstrated that KRBA1 CNV was correlated with neutrophil infiltration (Figure 6B). To deeply study the associations between KRBA1 and a variety of immune cells, the relationship between KRBA1 expression and markers of relevant immune cell genes was considered in our study. We detected the expression of KRBA1 in different immune subgroups by LIHC using TISIDB (Figure 6C). We found higher KRBA1 expression in the C1 (wound healing) and C2 (IFN-gamma dominant) subgroups, whereas lower in the C6 (TGF-β dominant) subgroup. In addition, KRBA1 was positively correlated with chemokines CXCL1, CXCL3, and CCL20 (Figure 6D). Furthermore, our experiments using immune-related chemokine expression in HCCLM3 cells revealed that CXCL1, CXCL3, and CCL20 expression were all down-regulated in shKRBA1 cells (Figure 6E). We speculated that the high expression of KRBA1 could promote the expression of CXCL1, CXCL3, and CCL20 and then regulate HCC development.
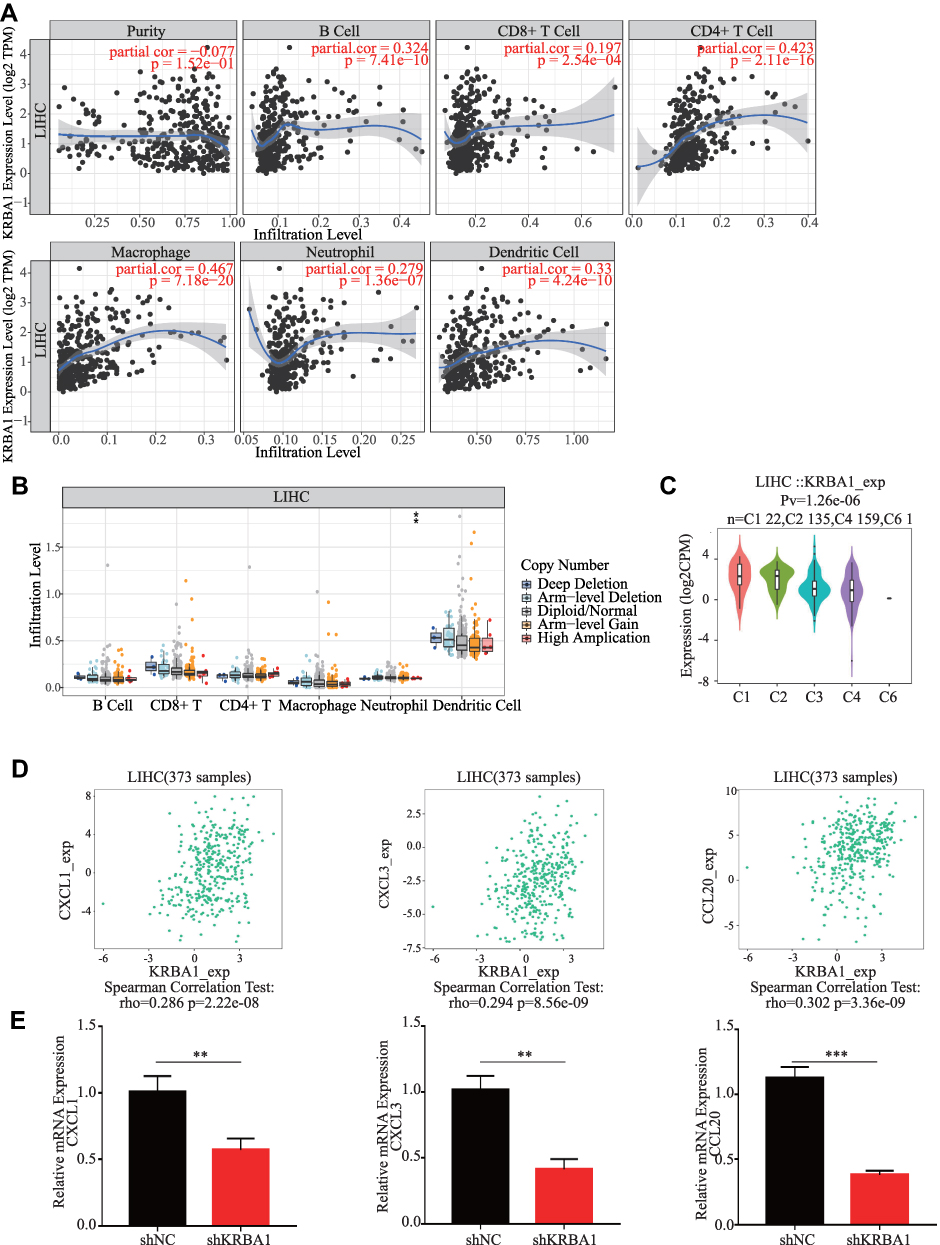 |
Figure 6 KRBA1 is associated with immune cell infiltration. (A) The correlation between the tumor infiltrating immune cells and the expression of KRBA1 in LIHC. (B) The connection between the CNV of KRBA1 and the immune cell infiltration level in LIHC. (C) Associations between KRBA1 expression and immune subtypes in LIHC. (D) The connection between the expression of KRBA1 and three chemokines. (E) Immune-related chemokines expression in KRBA1 silenced HCC cells. *p < 0.05, **p < 0.01, ***p < 0.001. Abbreviation: CNV, copy number variation. |
Furthermore, we adjusted the correlation coefficient according to tumor purity. For the above-mentioned results, KRBA1 was positively correlated with most of the gene markers that we selected for immune cells, including gene markers of B cells, T cells (general), CD8+ T cells, etc. (Figure 7). More detailed information about KRBA1 and immune cell marker genes is shown in Supplementary Table 4.
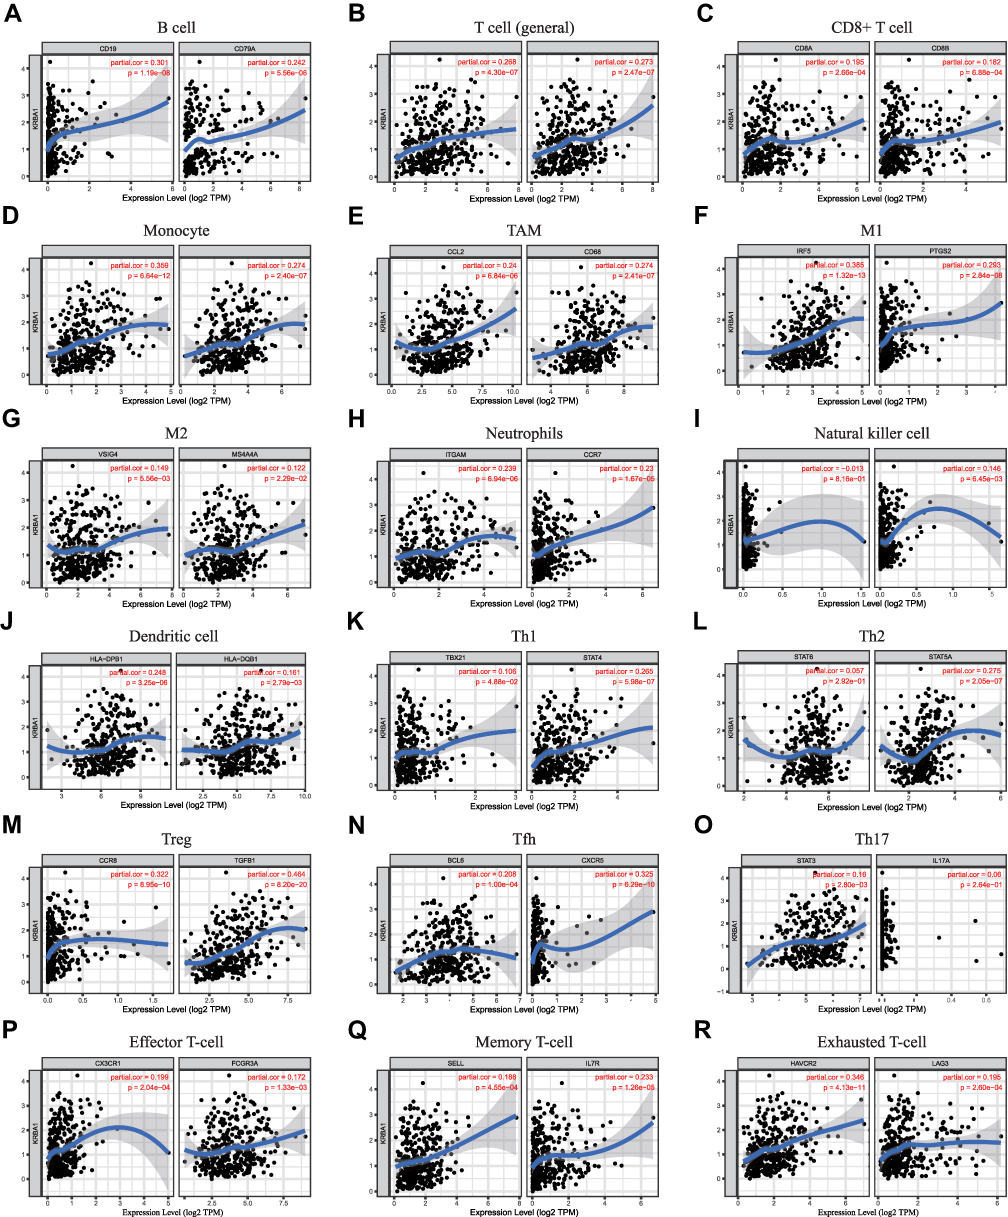 |
Figure 7 Correlations between KRBA1 expression and immune cells’ gene markers in LIHC. (A) B cell; (B) T cell (general); (C) CD8+ T cell; (D) Monocyte; (E) TAM; (F) M1; (G) M2; (H) Neutrophils; (I) Natural killer cell; (J) Dendritic cell; (K) Th1; (L) Th2; (M) Treg; (N) Tfh; (O) Th17; (P) Effector T-cell; (Q) Memory T-cell; (R) Exhausted T-cell. |
Since the expression of KRBA1 is clearly related to immune infiltration and poor prognosis in LIHC, we investigated whether the expression of KRBA1 affects the prognosis of LIHC due to immune invasion. We used KM Plotter to analyze the expression of KRBA1 in LIHC-related immune cell subgroups (Figure 8). We found that whether B cells, CD4+ memory T cells, CD8+ T cells, Macrophages, and Natural killer T cells were enriched or not, high expression of KRBA1 will lead to poor prognosis in HCC patients. However, the high expression level of KRBA1 in enriched Treg, Th1, and Th2 was associated with poor prognosis, but there was no significant correlation between its decreased subgroups. These results suggest that the effect of KRBA1 on the prognosis of LIHC patients may be due to the immune infiltration of Treg, Th1, and Th2 cells. Overall, our study suggests that KRBA1 is feasible to influence the development of LIHC and lead to poor prognosis by modulating immune infiltration.
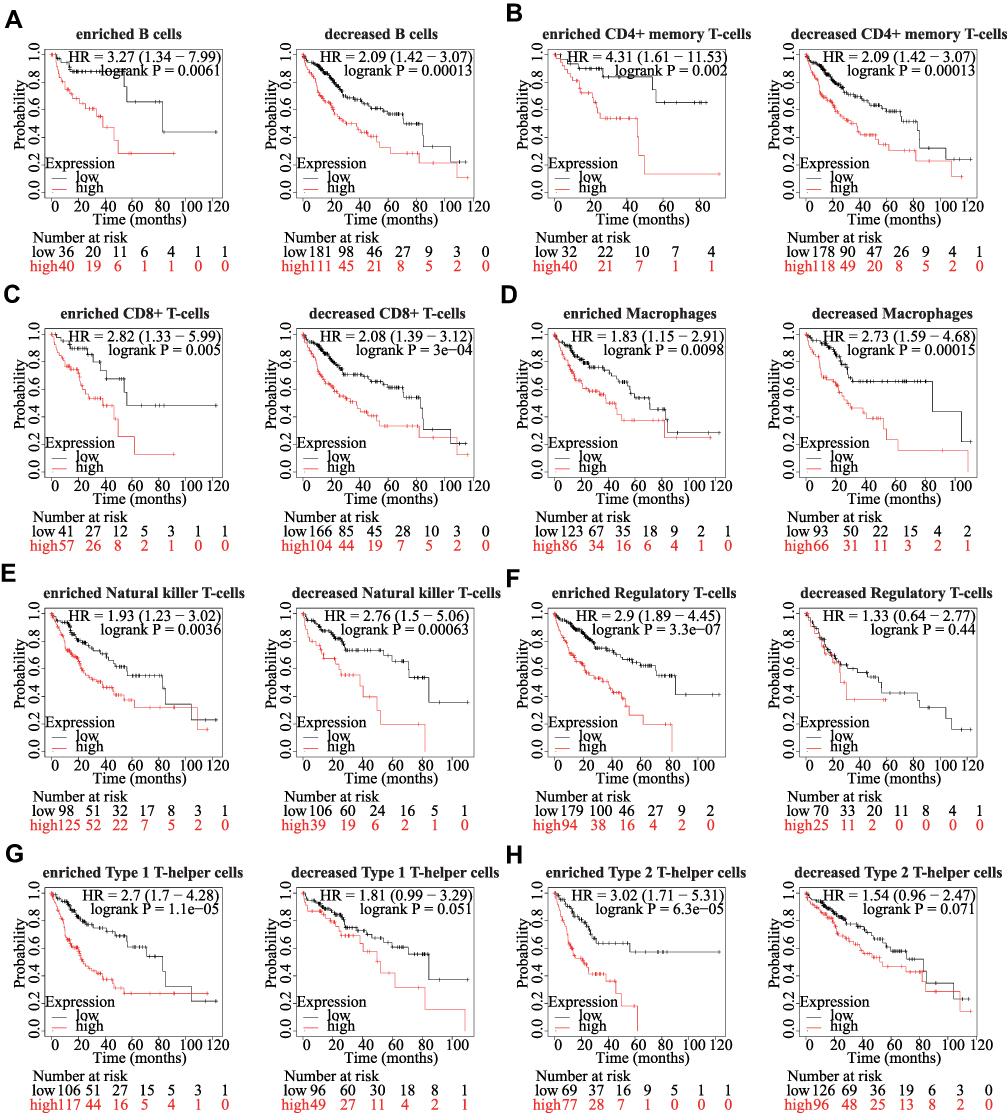 |
Figure 8 Comparison of Kaplan-Meier survival curves of KRBA1 in LIHC based on enriched or decreased immune cell subgroups. (A) B cells; (B) CD4+ memory T-cells; (C) CD8+ T-cells; (D) Macrophages; (E) Natural killer T-cells; (F) Regulatory T-cells; (G) Type 1 T-helper cells; (H) Type 2 T-helper cells; *p < 0.05, **p < 0.01, ***p < 0.001. |
Correlation of KRBA1 Expression with m6A Modification in LIHC
The function of the m6A modification in HCC has been extensively studied in recent years, and it plays a significant role in the development of HCC. The relationship between KRBA1 expression and 21 m6A-related genes expression in HCC was investigated by analyzing the TCGA-LIHC and ICGC datasets. The results showed that, except for FTO and METTL14, KRBA1 expression was positively associated with other m6A-related genes in both the TCGA-LIHC and ICGC datasets (Figure 9A and B, P< 0.05). Scatterplots show correlations between some of these genes and KRBA1 expression (Figure 9C). Meanwhile, we attempted to analyze the expression differences of m6A-related genes between the high and low expression groups of KRBA1 in TCGA LIHC samples to determine whether there were differences in m6A modification between the high and low expression groups of KRBA1 in LIHC (Figure 9D). Interestingly, all of the 21 m6A-related genes showed higher expression in the KRBA1 high expression group (P< 0.05). The Venn plots showed the correlation of genes in the TCGA and ICGC datasets were not less than 0.45 (Figure 9E), which are IGF2BP2, RBM15B, YTHDF1, HNRNPA2B1, and METTL3, respectively. The Kaplan-Meier curves obtained from GEPIA showed that the high expression of RBM15B, YTHDF1, HNRNPA2B1, and METTL3 was strongly related to the poor prognosis of LIHC (P< 0.01), while the IGF2BP2 expression was not related to the poor prognosis of LIHC except for IGF2BP2 (Figure 9F). These results indicated that KRBA1 might be strongly linked to the m6A modification of LIHC, especially through its regulation of RBM15B, YTHDF1, HNRNPA2B1, and METTL3, which ultimately affects LIHC progression and prognosis.
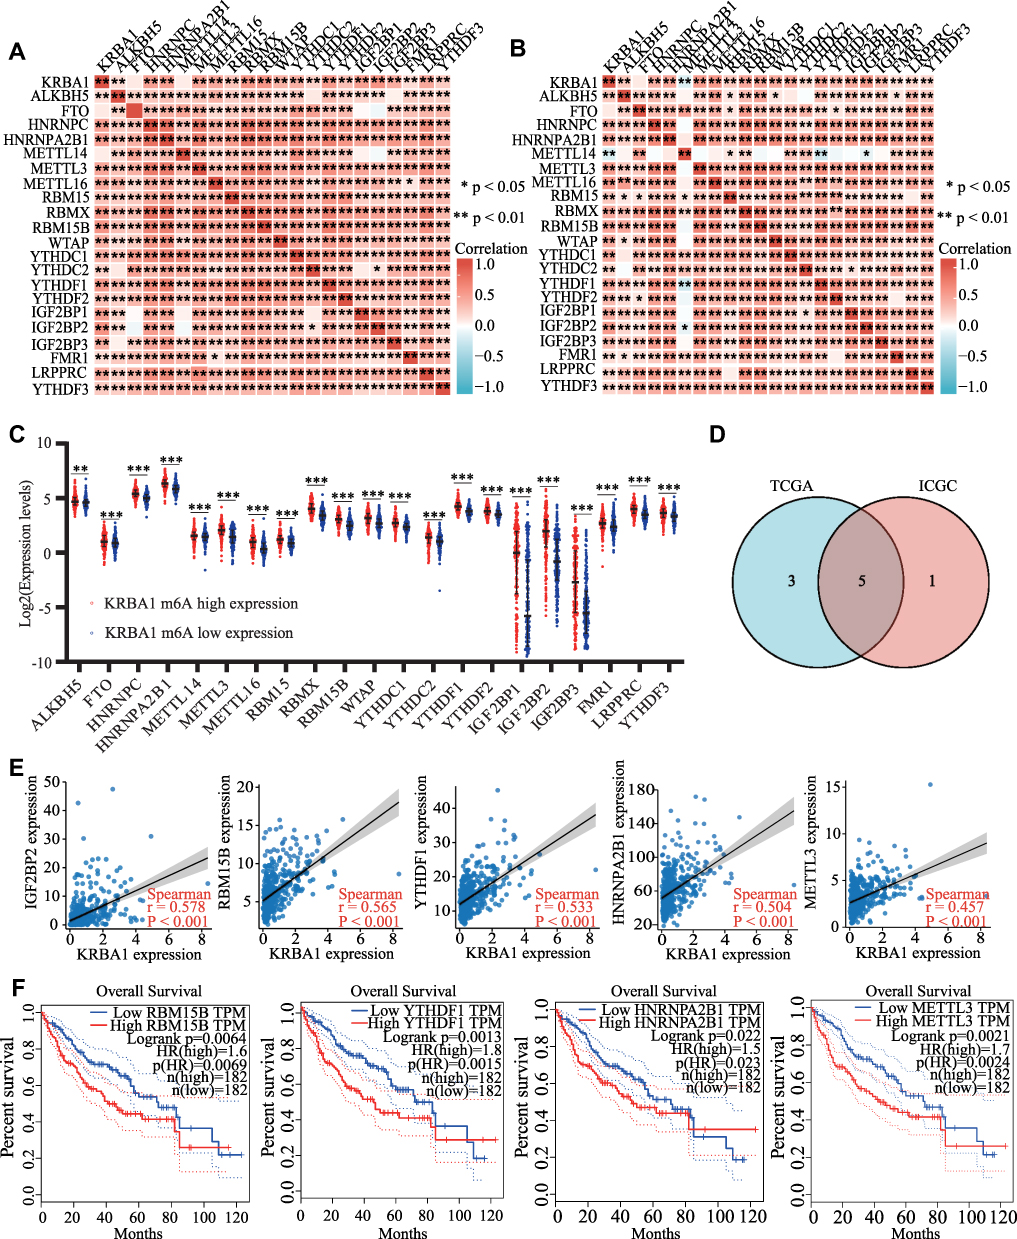 |
Figure 9 Correlations of KRBA1 Expression with m6A modification in LIHC. (A and B) TCGA LIHC and ICGC data sets analyzed the correlation between the KRBA1 and 21 m6A-related genes expression in LIHC. (C) Draw a scatter plot to show the correlation between the KRBA1 and the m6A related genes expression, include IGF2BP2, RBM15B, YTHDF1, HNRNPA2B1 and METTL3. (D) The differential expression of m6A related genes between high and low KRBA1 expression groups in LIHC tumor samples. (E) Venn diagram showed both expression correlation and differential expression of genes, including IGF2BP2, RBM15B, YTHDF1, HNRNPA2B1 and METTL3. (F) Kaplan-Meier curve of RBM15B, YTHDF1, HNRNPA2B1 and METTL3. *p < 0.05; **p < 0.01; ***p < 0.001. Abbreviation: ns, not significant. |
The Interrelationship, Cancer Pathway and Drug Susceptibility Analysis of KRBA1 and 4 Hub Genes
KRBA1 and the top 4 positive correlation genes, including WNK2, TRIM17, KCTD17, and ARHGEF2 were chosen as the hub genes for interrelationship, cancer pathway, and drug susceptibility analysis. We constructed these 5 genes interaction networks using GeneMANIA online tools to identify possible interactions between these five genes and other cancer-related genes. The outcomes indicated that these five genes were closely related to 20 genes (Figure 10A). Subsequently, the GSCALite tool was employed to describe the potential effects of these five genes on the classical cancer pathways. The outcome showed that these five genes, particularly KRBA1, could perform regulatory functions in the cancer process via activating DNA Damage Response, EMT, PI3K/AKT, RAS/MAPK, TSC/mTOR pathways and inhibiting Apoptosis, Cell Cycle, Hormone AR, Hormone ER, RTK pathways (Figure 10B). Since drug sensitivity has an important clinical value, the GSCALite tool was used to probe the correlation between KRBA1 expression and multiple drug sensitivities on the basis of the The Cancer Therapeutics Response Portal (CTRP). As shown in the results, the cells with high expression of KRBA1 were sensitive to 39 drugs or small molecules. Moreover, we caught sight of the cells with high expression of KRBA1 being resistant to trametinib and abiraterone drugs (Figure 10C). Therefore, these outcomes offer fresh and alternative treatment strategies for the sick suffering from LIHC with high KRBA1 expression.
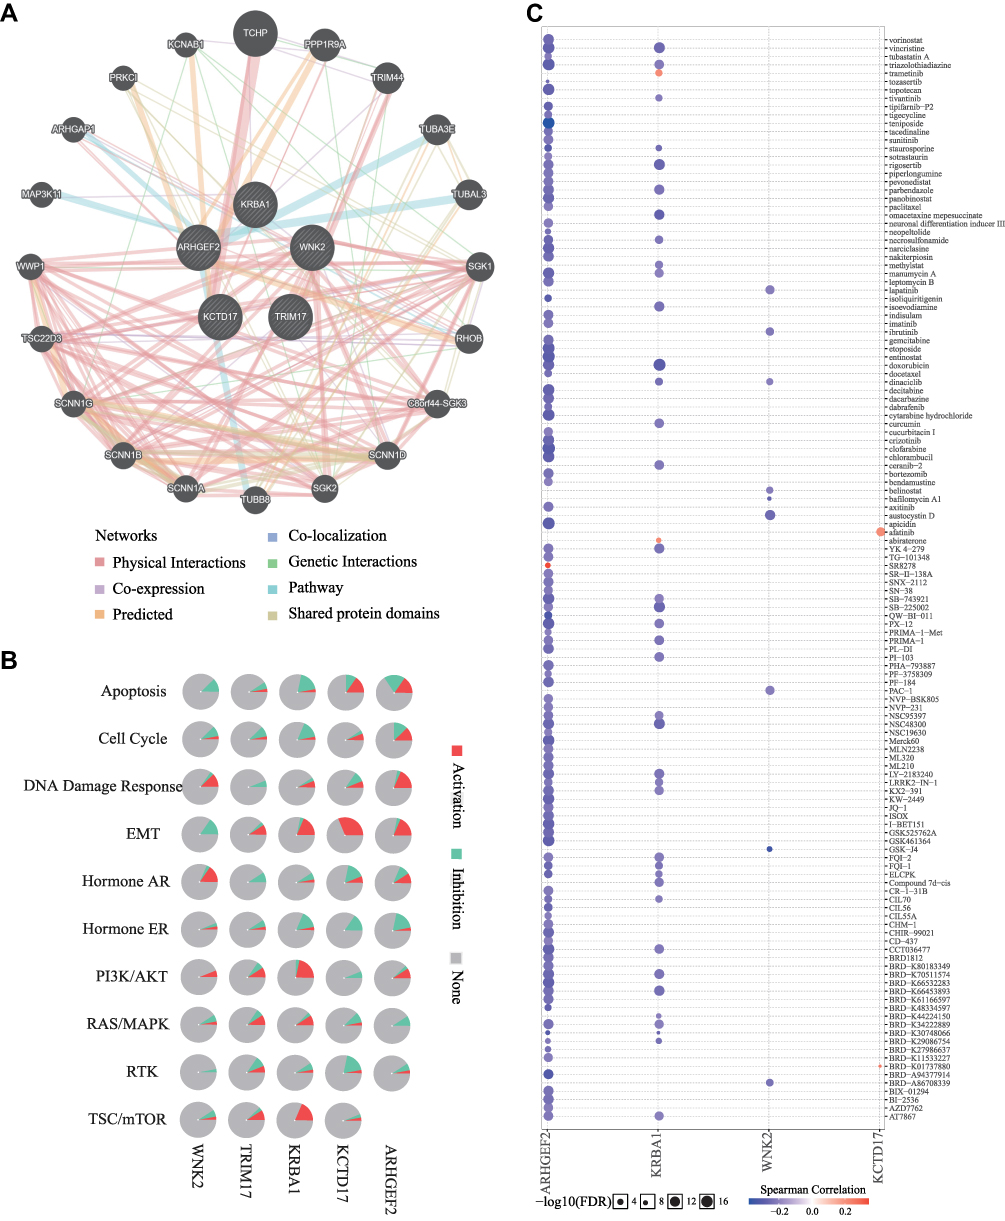 |
Figure 10 The interrelationship, cancer pathway and drug susceptibility analysis of 5 hub genes. (A) Interaction network of KRBA1 networks (GeneMANIA). The different colors at the edges of the network represent the applied enrichment methods: physical interactions, co-expression, predicted, co-localization, pathways, genetic interactions, and shared protein domains. (B) The role of KRBA1 in cancer related pathways. (C) Drug susceptibility analysis of KRBA1 and 3 hub genes according to The Cancer Therapeutics Response Portal (CTRP) database. |
Discussion
Hepatocellular carcinoma (HCC) accounts for more than 90% of primary liver tumors and usually occurs after cirrhosis is established.27 Due to its characteristics of slow detection and rapid progression, the 5-year survival rate of HCC is only 18%.28 Early detection and treatment of HCC will greatly improve the patient survival rate. Recently, a number of studies have been conducted on the diagnostic and prognostic assessment of cancer patients by using biomarkers. The detection of tumor-related molecular characteristics is a feasible approach for monitoring the development and progression of tumors.29 However, due to the reliability and effectiveness of their measurement, most biomarkers for liver cancer cannot currently be used in clinical settings, and research on these biomarkers still faces challenges. Consequently, it is important to confirm more potential biomarkers to guide the clinical diagnosis and treatment of HCC patients. In this study, we used bioinformatic analysis and in vitro experiments to study the expression and prognostic value of KRBA1 and its relationship with cell cycle progression, immune infiltration, m6A modification, and drug sensitivity in HCC.
In our study, KRBA1 was found to be overexpressed in liver cancer databases and clinical samples, and this abnormal expression was widespread across more than 10 cancers. Subsequently, we found that in HCC patients, there was a correlation of KRBA1 expression with prognosis and clinicopathological features. Higher KRBA1 expression tended to be associated with older age, higher clinical stage, and higher T stage, and high KRBA1 expression independently predicted poor prognosis in HCC patients. There is a strong link between epigenetic changes and hepatoma development, and many studies have reported that epigenetic dysregulation may be responsible for the molecular and clinicopathological heterogeneity of HCC;30–32 for example, DNA hypermethylation is considered an early event in HCC.33 Our study showed that the KRBA1 promoter was also hypermethylated in HCC and was positively associated with age and body weight. Moreover, for many CpG sites, we observed that hypermethylation is correlated with poor prognosis in HCC patients. These findings suggest that both high expression and hypermethylation of KRBA1 predict poor prognosis in HCC patients.
To further elucidate the molecular functions and unknown mechanisms by which KRBA1 affects the development of HCC, we investigated the enrichment of its coexpressed genes. We found that KRBA1 has biological functions such as regulating cell cycle progression and immune-related responses. Many genes have been reported to enhance hepatocyte proliferation by controlling the cell cycle to lead to the initiation of liver cancer.34 For example, PCK1 inhibits cell cycle progression and hepatoma cell proliferation through AMPK/P27.35 As a latent target for HCC diagnosis and therapy, SNHG1 inhibits the transcription of CDKN1A and CDKN2B, which leads to cell cycle inhibition.36 MAPRE1 expression is significantly increased in HCC tissues and binds to CDK2, leading to its hyperphosphorylation and thus promoting HCC cell proliferation.37 In addition, the Hedgehog signaling pathway, which is significantly associated with KRBA1, has been proposed to be a vital pathway in the establishment and progression of HCC. In the setting of chronic liver injury, hedgehog signaling molecules participate in transforming precancerous lesions into malignant lesions and activating GLI target genes are responsible for the drug resistance of hepatoma cells, and play a role in matrix metalloproteinase upregulation.38 Whether KRBA1 can promote hepatocyte transformation by regulating the Hedgehog signaling pathway remains to be further explored by molecular experiments.
HCC is a typical immune-related tumor because the liver can stimulate the immune response.39 One of the features during HCC initiation and progression is immune escape.40 Studies have suggested that many immunosuppressive mechanisms, such as intracellular accumulation of immunosuppressive cell masses, antigen expression, and activation of numerous suppressive receptor–ligand pathways, promote the persistence of HCC, which facilitates the mechanism of HCC.41 The degree of immunosuppression in the tumor microenvironment (TME) is tightly connected with poor prognosis in HCC patients.42 Our study found that infiltration of B cells, CD4+ T cells, CD8+ T cells, neutrophils, macrophages, and dendritic cells positively correlated with KRBA1 expression, suggesting a relationship between KRBA1 expression and immune cells. Cell experiments confirmed that interfering with KRBA1 significantly reduced the expression of the chemokines CXCL1, CXCL3, and CCL20, whose expression is positively correlated with KRBA1 expression. Immune checkpoints that have been studied over the past few years include cytotoxic T lymphocyte protein-4 (CTLA-4),43 programmed cell death protein-1 and its ligands (PD-1 and PD-L1, respectively),44 which function as key regulators of cancer immune escape and are closely related to the development and progression of liver cancer. We first found a significant correlation of KRBA1 expression with various T cells. Then, gene markers in various T cells were found to be positively associated with KRBA1 expression, and high expression levels of KRBA1 in the enriched Treg, Th1, and Th2 cells were correlated with poor prognosis. These results suggest that KRBA1 may regulate the development and prognosis of HCC by regulating T-cell infiltration.
As the most common form of mRNA modification, m6A is currently a hot topic in cancer therapy.45,46 The impact of m6A modification on the prognosis and progression of HCC has also been widely studied in the last few years, and a large number of m6A-related genes participate in promoting the progression of HCC.47 Many studies have pointed out that some m6A regulators are mutated and dysregulated in hepatocellular carcinoma and are closely associated with the clinicopathological features as well as the prognosis of patients with hepatocellular carcinoma.48 In the process of HCC carcinogenesis, m6A-related genes have been reported to be involved in various aspects including tumour formation, angiogenesis, proliferation, invasion, metastasis and tumour microenvironment, and immune regulation.49,50 Based on the available reports, we found that different m6A-related factors are differentially expressed or functionally inconsistent in HCC, which may stem from the different biological functions triggered by the signalling pathways affected by the different downstream targets of m6A.51 However, there is no research on the relationship between KRBA1 and m6A in tumors. Our results found a strong positive correlation between KRBA1 m6A modification and gene expression, especially for the five genes IGF2BP2, METTL3, YTHDF1, RBM15B, and HNRNPA2B1. Studies have shown that these five genes are correlated with the development of HCC. For instance, IGF2BP2 can disrupt the normal cell cycle and tumor microenvironment, promoting the progression of HCC.52 METTL3 is upregulated in HCC and contributes to the progression of HCC through an m6A-YTHDF2-dependent mechanism.53 The expression of YTHDF1, RBM15B and HNRNPA2B1 is also high in HCC and leads to poor prognosis in patients with HCC.54–56 These results suggest that the oncogenic effect of the KRBA1 gene is related to its m6A modification, which may affect mRNA methylation levels in HCC cells through its association with IGF2BP2, METTL3, YTHDF1, RBM15B, and HNRNPA2B1 and ultimately affect the progression of HCC.
The effect of drug therapy in the treatment of HCC cannot be ignored.57 However, patients with advanced stages often develop drug resistance. Currently, there are still problems with low specificity and high resistance to targeted drugs for HCC. In our study, KRBA1ʹs significant expression was sensitive to 39 drugs or micro-molecules. In particular, increased KRBA1 expression is resistant to trametinib and abiraterone, which might provide a new therapeutic method for HCC patients.
Conclusion
In conclusion, the overexpression and hypermethylation of KRBA1 are found in HCC and clearly correlated with clinicopathological stage and poor prognosis, which affects the cell cycle and immune cell infiltration levels of HCC and is strongly linked to m6A modification. These suggest that KRBA1 can serve as an inchoate diagnostic marker and immune-related therapeutic object, with the opportunity to update diagnostic and treatment options, while providing a new reference for further exploration of cancer immunotherapy.
Data Sharing Statement
All data was obtained from The Cancer Genome Atlas (TCGA, https://tcga-data.nci.nih.gov/tcga/) and International Cancer Genome Consortium (ICGC, https://dcc.icgc.org).
Research Ethics and Consent
All of experiments in this paper obey the principles stated in the Declaration of Helsinki.
Consent for Publication
All authors have read and approved the content and agree to submit for consideration for publication in the journal.
Funding
This study was supported by grants from the Project of Department of Education of Jiangxi Procince of China (no.GJJ200244).
Disclosure
The authors report no conflicts of interest in this work.
References
1. Villanueva A, Longo DL. Hepatocellular carcinoma. N Engl J Med. 2019;380(15):1450–1462. doi:10.1056/NEJMra1713263
2. Jemal A, Bray F, Center MM, Ferlay J, Ward E, Forman D. Global cancer statistics. CA Cancer J Clin. 2011;61(2):69–90. doi:10.3322/caac.20107
3. Torre LA, Bray F, Siegel RL, Ferlay J, Lortet-Tieulent J, Jemal A. Global cancer statistics, 2012. CA Cancer J Clin. 2015;65(2):87–108. doi:10.3322/caac.21262
4. Petrick JL, Kelly SP, Altekruse SF, McGlynn KA, Rosenberg PS. Future of hepatocellular carcinoma incidence in the United States forecast through 2030. J Clin Oncol. 2016;34(15):1787–1794. doi:10.1200/JCO.2015.64.7412
5. Pinero F, Dirchwolf M, Pessoa MG. Biomarkers in hepatocellular carcinoma: diagnosis, prognosis and treatment response assessment. Cells-Basel. 2020;9(6):1370.
6. Clark T, Maximin S, Meier J, Pokharel S, Bhargava P. Hepatocellular carcinoma: review of epidemiology, screening, imaging diagnosis, response assessment, and treatment. Curr Probl Diagn Radiol. 2015;44(6):479–486. doi:10.1067/j.cpradiol.2015.04.004
7. Befeler AS, Di Bisceglie AM. Hepatocellular carcinoma: diagnosis and treatment. Gastroenterology. 2002;122(6):1609–1619. doi:10.1053/gast.2002.33411
8. Bellefroid EJ, Poncelet DA, Lecocq PJ, Revelant O, Martial JA. The evolutionarily conserved Kruppel-associated box domain defines a subfamily of eukaryotic multifingered proteins. Proc Natl Acad Sci USA. 1991;88(9):3608–3612. doi:10.1073/pnas.88.9.3608
9. Edelstein LC, Collins T. The SCAN domain family of zinc finger transcription factors. Gene. 2005;359:1–17. doi:10.1016/j.gene.2005.06.022
10. Llorens C, Bernet GP, Ramasamy S, Feschotte C, Moya A. On the transposon origins of mammalian SCAND3 and KRBA2, two zinc-finger genes carrying an integrase/transposase domain. Mob Genet Elements. 2012;2(5):205–210. doi:10.4161/mge.22914
11. Alexander J, Kalev O, Mehrabian S, et al. Familial early-onset dementia with complex neuropathologic phenotype and genomic background. Neurobiol Aging. 2016;42:199–204. doi:10.1016/j.neurobiolaging.2016.03.012
12. Zhu Y, Qiu P, Ji Y. TCGA-assembler: open-source software for retrieving and processing TCGA data. Nat Methods. 2014;11(6):599–600. doi:10.1038/nmeth.2956
13. Tang Z, Li C, Kang B, Gao G, Li C, Zhang Z. GEPIA: a web server for cancer and normal gene expression profiling and interactive analyses. Nucleic Acids Res. 2017;45(W1):W98–W102. doi:10.1093/nar/gkx247
14. Xie P, Wang H, Xie J, et al. USP7 promotes proliferation of papillary thyroid carcinoma cells through TBX3-mediated p57(KIP2) repression. Mol Cell Endocrinol. 2020;518:111037. doi:10.1016/j.mce.2020.111037
15. Chandrashekar DS, Bashel B, Balasubramanya S, et al. UALCAN: a portal for facilitating tumor subgroup gene expression and survival analyses. Neoplasia. 2017;19(8):649–658. doi:10.1016/j.neo.2017.05.002
16. Modhukur V, Iljasenko T, Metsalu T, Lokk K, Laisk-Podar T, Vilo J. MethSurv: a web tool to perform multivariable survival analysis using DNA methylation data. Epigenomics-UK. 2018;10(3):277–288. doi:10.2217/epi-2017-0118
17. Vasaikar SV, Straub P, Wang J, Zhang B. LinkedOmics: analyzing multi-omics data within and across 32 cancer types. Nucleic Acids Res. 2018;46(D1):D956–D963. doi:10.1093/nar/gkx1090
18. Warde-Farley D, Donaldson SL, Comes O, et al. The GeneMANIA prediction server: biological network integration for gene prioritization and predicting gene function. Nucleic Acids Res. 2010;38(Web Server issue):W214–W220. doi:10.1093/nar/gkq537
19. Subramanian A, Tamayo P, Mootha VK, et al. Gene set enrichment analysis: a knowledge-based approach for interpreting genome-wide expression profiles. Proc Natl Acad Sci USA. 2005;102(43):15545–15550. doi:10.1073/pnas.0506580102
20. Li T, Fan J, Wang B, et al. TIMER: a web server for comprehensive analysis of tumor-infiltrating immune cells. Cancer Res. 2017;77(21):e108–e110. doi:10.1158/0008-5472.CAN-17-0307
21. Zheng G, Ma Y, Zou Y, Yin A, Li W, Dong D. HCMDB: the human cancer metastasis database. Nucleic Acids Res. 2018;46(D1):D950–D955. doi:10.1093/nar/gkx1008
22. Ru B, Wong CN, Tong Y, et al. TISIDB: an integrated repository portal for tumor-immune system interactions. Bioinformatics. 2019;35(20):4200–4202. doi:10.1093/bioinformatics/btz210
23. Liu CJ, Hu FF, Xia MX, Han L, Zhang Q, Guo AY. GSCALite: a web server for gene set cancer analysis. Bioinformatics. 2018;34(21):3771–3772. doi:10.1093/bioinformatics/bty411
24. Ritchie ME, Phipson B, Wu D, et al. limma powers differential expression analyses for RNA-sequencing and microarray studies. Nucleic Acids Res. 2015;43(7):e47. doi:10.1093/nar/gkv007
25. Keshet I, Schlesinger Y, Farkash S, et al. Evidence for an instructive mechanism of de novo methylation in cancer cells. Nat Genet. 2006;38(2):149–153. doi:10.1038/ng1719
26. Feinberg AP, Tycko B. The history of cancer epigenetics. Nat Rev Cancer. 2004;4(2):143–153. doi:10.1038/nrc1279
27. Llovet JM, Zucman-Rossi J, Pikarsky E, et al. Hepatocellular carcinoma. Nat Rev Dis Primers. 2016;2:16018. doi:10.1038/nrdp.2016.18
28. Kulik LM, Chokechanachaisakul A. Evaluation and management of hepatocellular carcinoma. Clin Liver Dis. 2015;19(1):23–43. doi:10.1016/j.cld.2014.09.002
29. Pan Y, Chen H, Yu J. Biomarkers in hepatocellular carcinoma: current status and future perspectives. Biomedicines. 2020;8(12):576. doi:10.3390/biomedicines8120576
30. Fernandez-Barrena MG, Arechederra M, Colyn L, Berasain C, Avila MA. Epigenetics in hepatocellular carcinoma development and therapy: the tip of the iceberg. JHEP Rep. 2020;2(6):100167. doi:10.1016/j.jhepr.2020.100167
31. Lee HS, Kim BH, Cho NY, et al. Prognostic implications of and relationship between CpG island hypermethylation and repetitive DNA hypomethylation in hepatocellular carcinoma. Clin Cancer Res. 2009;15(3):812–820. doi:10.1158/1078-0432.CCR-08-0266
32. Lee S, Lee HJ, Kim JH, Lee HS, Jang JJ, Kang GH. Aberrant CpG island hypermethylation along multistep hepatocarcinogenesis. Am J Pathol. 2003;163(4):1371–1378. doi:10.1016/S0002-9440(10)63495-5
33. Calvisi DF, Ladu S, Gorden A, et al. Mechanistic and prognostic significance of aberrant methylation in the molecular pathogenesis of human hepatocellular carcinoma. J Clin Invest. 2007;117(9):2713–2722. doi:10.1172/JCI31457
34. Jin B, Wang W, Du G, et al. Identifying hub genes and dysregulated pathways in hepatocellular carcinoma. Eur Rev Med Pharmacol Sci. 2015;19(4):592–601.
35. Tuo L, Xiang J, Pan X, et al. PCK1 negatively regulates cell cycle progression and hepatoma cell proliferation via the AMPK/p27(Kip1) axis. J Exp Clin Cancer Res. 2019;38(1):50. doi:10.1186/s13046-019-1029-y
36. Li B, Li A, You Z, Xu J, Zhu S. Epigenetic silencing of CDKN1A and CDKN2B by SNHG1 promotes the cell cycle, migration and epithelial-mesenchymal transition progression of hepatocellular carcinoma. Cell Death Dis. 2020;11(10):823. doi:10.1038/s41419-020-03031-6
37. Liang XH, Feng ZP, Liu FQ, et al. MAPRE1 promotes cell cycle progression of hepatocellular carcinoma cells by interacting with CDK2. Cell Biol Int. 2020;44(11):2326–2333. doi:10.1002/cbin.11442
38. Ding J, Li HY, Zhang L, Zhou Y, Wu J. Hedgehog signaling, a critical pathway governing the development and progression of hepatocellular carcinoma. Cells-Basel. 2021;10(1):123.
39. Oura K, Morishita A, Tani J, Masaki T. Tumor immune microenvironment and immunosuppressive therapy in hepatocellular carcinoma: a review. Int J Mol Sci. 2021;22(11):5801. doi:10.3390/ijms22115801
40. Shlomai A, de Jong YP, Rice CM. Virus associated malignancies: the role of viral hepatitis in hepatocellular carcinoma. Semin Cancer Biol. 2014;26:78–88. doi:10.1016/j.semcancer.2014.01.004
41. Hato T, Goyal L, Greten TF, Duda DG, Zhu AX. Immune checkpoint blockade in hepatocellular carcinoma: current progress and future directions. Hepatology. 2014;60(5):1776–1782. doi:10.1002/hep.27246
42. Fu Y, Liu S, Zeng S, Shen H. From bench to bed: the tumor immune microenvironment and current immunotherapeutic strategies for hepatocellular carcinoma. J Exp Clin Cancer Res. 2019;38(1):396. doi:10.1186/s13046-019-1396-4
43. Xu F, Jin T, Zhu Y, Dai C. Immune checkpoint therapy in liver cancer. J Exp Clin Cancer Res. 2018;37(1):110. doi:10.1186/s13046-018-0777-4
44. Philips GK, Atkins M. Therapeutic uses of anti-PD-1 and anti-PD-L1 antibodies. Int Immunol. 2015;27(1):39–46. doi:10.1093/intimm/dxu095
45. Huang H, Weng H, Chen J. m(6)A modification in coding and non-coding RNAs: roles and therapeutic implications in cancer. Cancer Cell. 2020;37(3):270–288. doi:10.1016/j.ccell.2020.02.004
46. He L, Li H, Wu A, Peng Y, Shu G, Yin G. Functions of N6-methyladenosine and its role in cancer. Mol Cancer. 2019;18(1):176. doi:10.1186/s12943-019-1109-9
47. Chen M, Wong CM. The emerging roles of N6-methyladenosine (m6A) deregulation in liver carcinogenesis. Mol Cancer. 2020;19(1):44. doi:10.1186/s12943-020-01172-y
48. Wang P, Wang X, Zheng L, Zhuang C. Gene signatures and prognostic values of m6A regulators in hepatocellular carcinoma. Front Genet. 2020;11:540186. doi:10.3389/fgene.2020.540186
49. Shen S, Yan J, Zhang Y, Dong Z, Xing J, He Y. N6-methyladenosine (m6A)-mediated messenger RNA signatures and the tumor immune microenvironment can predict the prognosis of hepatocellular carcinoma. Ann Transl Med. 2021;9(1):59. doi:10.21037/atm-20-7396
50. Li Y, Qi D, Zhu B, Ye X. Analysis of m6A RNA methylation-related genes in liver hepatocellular carcinoma and their correlation with survival. Int J Mol Sci. 2021;22(3):1474.
51. Qin S, Mao Y, Chen X, Xiao J, Qin Y, Zhao L. The functional roles, cross-talk and clinical implications of m6A modification and circRNA in hepatocellular carcinoma. Int J Biol Sci. 2021;17(12):3059–3079. doi:10.7150/ijbs.62767
52. Wei Q. Bioinformatical identification of key genes regulated by IGF2BP2-mediated RNA N6-methyladenosine and prediction of prognosis in hepatocellular carcinoma. J Gastrointest Oncol. 2021;12(4):1773–1785. doi:10.21037/jgo-21-306
53. Chen M, Wei L, Law CT, et al. RNA N6-methyladenosine methyltransferase-like 3 promotes liver cancer progression through YTHDF2-dependent posttranscriptional silencing of SOCS2. Hepatology. 2018;67(6):2254–2270. doi:10.1002/hep.29683
54. Bian S, Ni W, Zhu M, et al. Identification and validation of the N6-Methyladenosine RNA methylation regulator YTHDF1 as a novel prognostic marker and potential target for hepatocellular carcinoma. Front Mol Biosci. 2020;7:604766. doi:10.3389/fmolb.2020.604766
55. Zhang Y, Zeng F, Zeng M, et al. Identification and characterization of alcohol-related hepatocellular carcinoma prognostic subtypes based on an integrative N6-methyladenosine methylation model. Int J Biol Sci. 2021;17(13):3554–3572. doi:10.7150/ijbs.62168
56. Liu J, Sun G, Pan S, et al. The Cancer Genome Atlas (TCGA) based m(6)A methylation-related genes predict prognosis in hepatocellular carcinoma. Bioengineered. 2020;11(1):759–768. doi:10.1080/21655979.2020.1787764
57. Ikeda M, Morizane C, Ueno M, Okusaka T, Ishii H, Furuse J. Chemotherapy for hepatocellular carcinoma: current status and future perspectives. Jpn J Clin Oncol. 2018;48(2):103–114. doi:10.1093/jjco/hyx180
 © 2022 The Author(s). This work is published and licensed by Dove Medical Press Limited. The full terms of this license are available at https://www.dovepress.com/terms.php and incorporate the Creative Commons Attribution - Non Commercial (unported, v3.0) License.
By accessing the work you hereby accept the Terms. Non-commercial uses of the work are permitted without any further permission from Dove Medical Press Limited, provided the work is properly attributed. For permission for commercial use of this work, please see paragraphs 4.2 and 5 of our Terms.
© 2022 The Author(s). This work is published and licensed by Dove Medical Press Limited. The full terms of this license are available at https://www.dovepress.com/terms.php and incorporate the Creative Commons Attribution - Non Commercial (unported, v3.0) License.
By accessing the work you hereby accept the Terms. Non-commercial uses of the work are permitted without any further permission from Dove Medical Press Limited, provided the work is properly attributed. For permission for commercial use of this work, please see paragraphs 4.2 and 5 of our Terms.