")
Back to Journals » OncoTargets and Therapy » Volume 12
Identification of key genes and pathways in Ewing’s sarcoma patients associated with metastasis and poor prognosis
Authors Li G, Zhang P, Zhang W, Lei Z, He J, Meng J, Di T, Yan W
Received 23 November 2018
Accepted for publication 27 February 2019
Published 27 May 2019 Volume 2019:12 Pages 4153—4165
DOI https://doi.org/10.2147/OTT.S195675
Checked for plagiarism Yes
Review by Single anonymous peer review
Peer reviewer comments 3
Editor who approved publication: Dr Jianmin Xu
Guoqi Li,* Piao Zhang,* Wenkan Zhang, Zhong Lei, Jiaming He, Jiahong Meng, Tuoyu Di, Weiqi Yan
Department of Orthopedic Surgery, The Second Affiliated Hospital, School of Medicine, Zhejiang University, Hangzhou, Zhejiang 310009, People’s Republic of China
*These authors contributed equally to this work
Background: Ewing sarcoma (ES) is the second commonest primary malignant bone neoplasm. Metastatic status at diagnosis strongly predicted poor prognosis of Ewing sarcoma patients. Yet little was known about the underlying mechanism of ES metastasis.
Purpose:This study intended to identify the relationship between key genes/pathways and metastasis/poor prognosis in Ewing’s sarcoma patients by using bioinformatic method.
Methods: In this study, multi-center sequencing data were obtained from the GEO database, including gene and miRNA expression profile and prognosis information of ES patients. Differentially expressed genes (DEGs) were identified between primary and metastasis ES samples by the GEO2R online tool. Gene ontology (Go) and Kyoto encyclopedia of genes and genomes (KEGG) pathway enrichment analyses of DEGs were performed. And PPI network analyses were conducted. The ES patient’s prognostic information was employed for survival analysis, and the potential relationship between miRNAs and key genes was analyzed.
Results: The results showed that a total of 298 and 428 DEGs were screened out in metastasis samples based on GSE17618 and GSE12102 dataset compared to primary samples respectively. The most significantly enriched KEGG pathway was the mismatch repair (MMR) pathway. MSH2, MSH6, RPA2, and RFC2 that belong to the MMR pathway were identified as key genes. Moreover, the expression of key genes was increased in metastasis samples compared with primary ones and was associated with poor event-free and overall survival of ES patients. The negative correlation of the expression level of the key genes with patients prognosis also supported by TCGA sarcoma database. Furthermore, knockdown of EWSR/FLI1 fusion in ES cell line A673 down-regulates the expression of the 4 key genes was revealed by GDS4962.
Conclusion: In conclusion, the present study indicated that the key genes promote our understanding of the molecular mechanisms underlying the development of ES metastasis, and might be used as molecular targets and diagnostic biomarkers for the treatment of ES.
Keywords: genes, miRNAs, Ewing’s sarcoma, metastasis, bioinformatic analysis
Introduction
Ewing sarcoma (ES) is the second commonest primary malignant bone neoplasm accounting for approximately 25–34% of malignant bone tumors. It is a devastating, poorly differentiated, and high-grade osteolytic disease threatening human health severely.1,2 Statistically, ES is a rare, aggressive bone neoplasm, and around 2.9 people per million encountered with ES annually worldwide, and predominantly appeared in childhood and adolescence.3,4 ES mainly occurs in bone and surrounding soft tissue characterized by a highly aggressive small round blue cell malignant neoplasm.5,6 Accumulating evidence strongly documented that chromosomal translocation comprising the Ewing sarcoma breakpoint region (EWSR) gene on chromosome 22 and a member of the ETS family of transcription factors implicated in the ES pathogenetic process, which could encode tumor-specific fusion protein EWSR/FLI and was a distinct and well-defined phenotype for ES genetical characterization.7–9 Moreover, previous researches revealed that ~13% of patients with ES harbor rare inactivating variants or mutations in DNA damage repair genes consisting of the same genes that are enriched in hereditary breast cancer (such as BRCA1).10 Currently, surgical excision, multidrug chemotherapy, and local radiotherapy are the principal strategies for the treatment of ES.11 Unfortunately, although enormous progress has been achieved along with science and technological advancements, the diagnose and treatment are far from being satisfactory. Generally, ES patients accompanied with metastatic, or relapsed features have a dismal outcome,12,13 and the 5-year survival rate for those patients was <30%.14
To date, emerging progress concerning ES was acquired involving in nuclear architecture and chromosomal positioning, and the actively transcribed genes were located in euchromatin, which tended to cluster to the center of the nucleus.7,15 Occasional spontaneous DNA breakage may induce the fusion of non-homologous chromosomes and ultimately result in chromosomal translocation.16 Nevertheless, the pathological mechanisms of ES could not be fully elucidated due to it is intricate and elusive. Therefore, to deeply illuminate the underlying mechanism and related pathways would conduce to thoroughly overcome this disease. In recent years, microarray technology was a great boost for uncovering the pathological mechanisms of ES and substantially accelerating the research phase. Additionally, bioinformatics analysis including patient diagnostic, therapeutic, and pathological information was employed to advance oncology research and lay the foundation for improving disease prevention, early detection, and treatment. The rapid development of bioinformatics enables us to comprehensively screen out the key genes by using high-throughput microarrays. Metastatic status closely correlated with the prognosis of ES patients involving in multiple genes and signal pathways. Effectively and reasonably finding out the hub genes/pathways utilizing microarray database would be in favor of exploiting new strategies for ES treatment. Interestingly, lots of compelling consequences referring to metastatic drivers in ES had been spotted. For example, highly expressed ERBB4 would facilitate tumor metastasis, invasion and suppress apoptosis by activating the phosphoinositide 3-kinase/AKT and focal adhesion kinase pathways in metastatic ES cells.17 Similarly, differential transcriptomic analyses between primary and metastases revealed that inactive tyrosine-protein kinase transmembrane receptor ROR1 and the putative Wnt family member 5 A ligand jointly participated in the cell migration in ES.18
In the study, ES metastasis-related abnormally expressed genes were screened out based on public gene expression omnibus (GEO) datasets. Meanwhile, the pivotal biological pathways regarding ES metastasis were clearly defined. Thereafter, biomarkers associated with ES metastasis including mRNA and miRNA were elucidated by conducting a series of bioinformatics and survival analyses. Accordingly, these results may shed a new light on the underlying mechanisms of ES metastasis derived from the bioinformatics.
Materials and methods
Acquirement of microarray data
Microarray data were obtained from the dataset of GSE17618 and GSE12102 gene expression array separately, including primary samples, metastasis samples, and recurrent samples, based on the GPL570 platform ([HGU133 Plus 2] Affymetrix Human Genome U133 Plus 2.0 Array). GSE63157 dataset comprising Ewing’s sarcoma patient’s prognostic information was acquired. GDS4962 dataset containing gene expression profile of ES cell line with inducible EWSR/FLI knockdown were employed to analyze the impact of ESWR/FLI1 knock down over key genes. Moreover, the miRNA expression profile in primary ES and normal human mesenchymal stromal cells (MSCs) was extracted from GEO dataset GSE80201, for upstream miRNA regulator prediction. All datasets are available in the GEO database (
Identification of differentially expressed genes (DEGs)
GEO2R (
Gene ontology (GO) and Kyoto encyclopedia of genes and genomes (KEGG) pathway enrichment analyses of DEGs
GO is used as a major bioinformatics tool by providing a systematic language to annotate genes, gene products and sequences.20 KEGG is an integrated database resource related to genomes, biological pathways, diseases and chemicals.21 The online tool, Database for Annotation Visualization and Integrated Discovery (DAVID,
Expression and survival analysis of key genes
To investigate the role of key genes in ES’s progression, the expression level including MSH2, MSH6, RPA2, and RFC2 was detected using GSE63157 datasets, respectively. Furthermore, to determine whether these key genes affect clinical outcomes, the series matrix of GSE63157 that contained ES patient’s prognostic information was employed for survival analysis. Briefly, the patients were divided into two groups (high/low group) according to the expression of key genes, with cutoff of average gene expression level. The prognosis of each group was tested by Kaplan–Meier survival estimators, P-value was corrected by Bonferroni method. The relationship between key genes and prognosis value was further analyzed via pan-cancer TCGA database OncoLnc (
Prediction of upstream regulators
GEO dataset GDS4962 containing 16 samples of A673 ES cell line with or without inducible EWSR/FLI1 knockdown in time course was employed to explore whether EWSR/FLI1 could regulate the expression level of these key genes. Correlation analyses were conducted using R with corrplot package. Additionally, GEO dataset GSE80201 was downloaded for miRNA analyze, DEMs (differentially expressed miRNAs) were acquired by using the parallel method of DEGs mentioned above. Cytoscape app CyTargetLinker consisting of miRTarBase 7.0, TargetScan release 7.2, miRbase version 21, was utilized to investigate the potential correlation between DEMs and DEGs.24
Results
Identification of DEGs
According to differential expression analysis, a total of 298 (
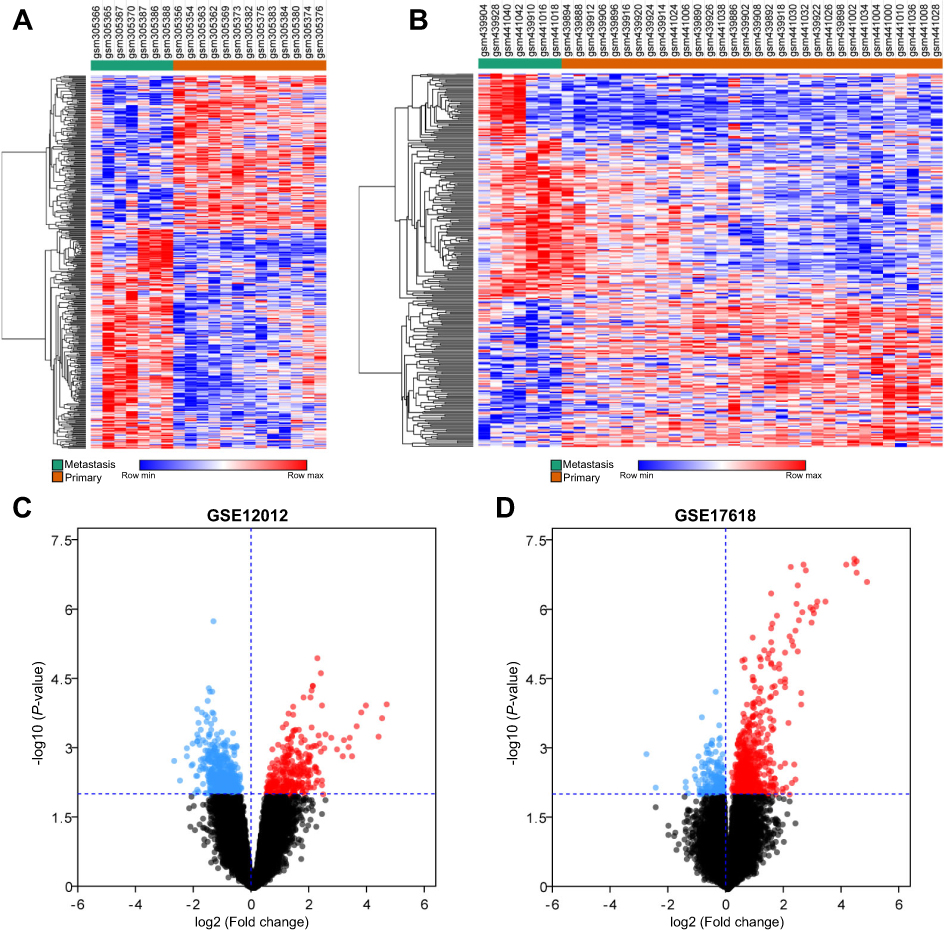 | Figure 1 Hierarchical cluster analysis and volcano plot of differentially expressed genes (DEGs) in metastasis samples and primary samples. (A and B) represent the DEGs obtained from GSE12102 and GSE17618 dataset, respectively. Each column represents a sample, and each row represents a single gene. Green color represented metastasis samples, and orange color represented primary samples. The color scale shows the relative genes expression level in certain slide: blue indicates low relative expression levels; red indicates high relative expression levels, white indicates zero (no change). (C and D) Volcano plot of DEGs in metastasis samples compared to primary samples. Red indicates the gene expression was upregulated in metastasis samples compared to primary samples (P<0.01); blue indicates the gene expression was downregulated in metastasis samples compared with primary samples (P<0.01); Black indicates the P-value was >0.01. |
GO enrichment analysis
The GO database as a dynamic controlled vocabulary is used to describe the role of gene and protein with three categories information consisting of biological process (BP), cellular component (CC), and molecular function (MF). To in-depth investigate the function of the identified DEGs, GO analyses were performed in two datasets (GSE17618 and GSE12102) using DAVID online tool, respectively. In the BP category, the DEGs were mainly involved in neuromuscular junction development, positive regulation of helicase activity, epidermal cell differentiation. CC was significantly enriched in the basolateral plasma membrane, nucleoplasm, SMN-Sm protein complex. Moreover, the GO MFs analysis particularly enriched in deacetylase activity, poly(A) RNA binding, ATP binding. Enriched Go terms with cutoff value of P<0.05 were showed in
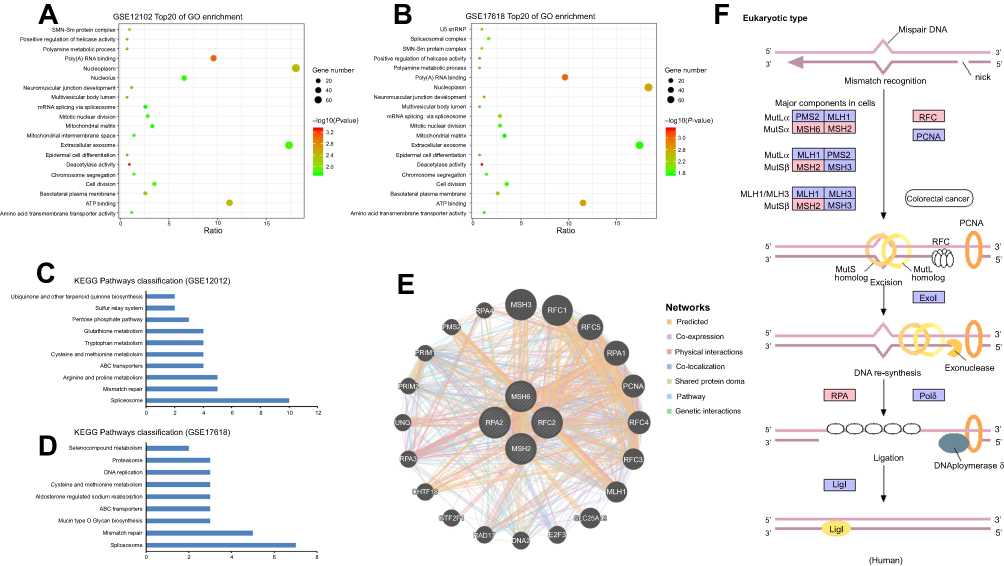 | Figure 2 Bioinformatic analysis of DEGs including GO, KEGG and PPI network. (A and B) Bubble plot for GO enrichment of DEGs in GSE12102 and GSE17618 dataset based on GO analysis. X-axis represents the gene ratio and y-axis descript the enrichment components. The area of the circle is proportional to the number of genes assigned to the term and the color accords with the P-value. (C and D) separately showed the KEGG pathways in GSE12102 and GSE17618 dataset. (E) showed the potential intermolecular interactions of the key genes. The different color lines reflect interaction relationship, respectively. (F) Overview of MMR pathway. Pink represents the differently expressed genes (P<0.01); blue represents undifferentiated expressed genes (P>0.01).Abbreviations: DEGs, differentially expressed genes; GO, gene ontology; KEGG, Kyoto encyclopedia of genes and genomes; PPI, protein–protein interaction; MMR, mismatch repair. |
EGG pathway functional enrichment analyses and PPI network analysis of the DEGs
KEGG analysis result revealed that 10 and 9 terms were involved in ES metastasis as shown in Figure 2C and D. Intriguingly, mismatch repair (MMR), spliceosome, ABC transporters, cysteine and methionine metabolism were simultaneously enriched in both datasets (Figure 2C and D). The most significantly enriched KEGG pathway was MMR pathway (Tables 1, 2). The key genes including MSH2, MSH6, RPA2, and RFC2 that belong to the MMR pathway, were enriched in GSE12102 and GSE17618 dataset. To investigate the PPI relationship, PPI analyses were conducted by using GeneMANIA. The results suggested that PCNA, RFC family of transcription factors, and PRP family proteins have direct or indirect correlation with the 4 key genes (Figure 2E). Moreover, 4 DEGs including MSH2, MSH6, RFC2, RPA2 were annotated in the MMR pathway as shown in Figure 2F.
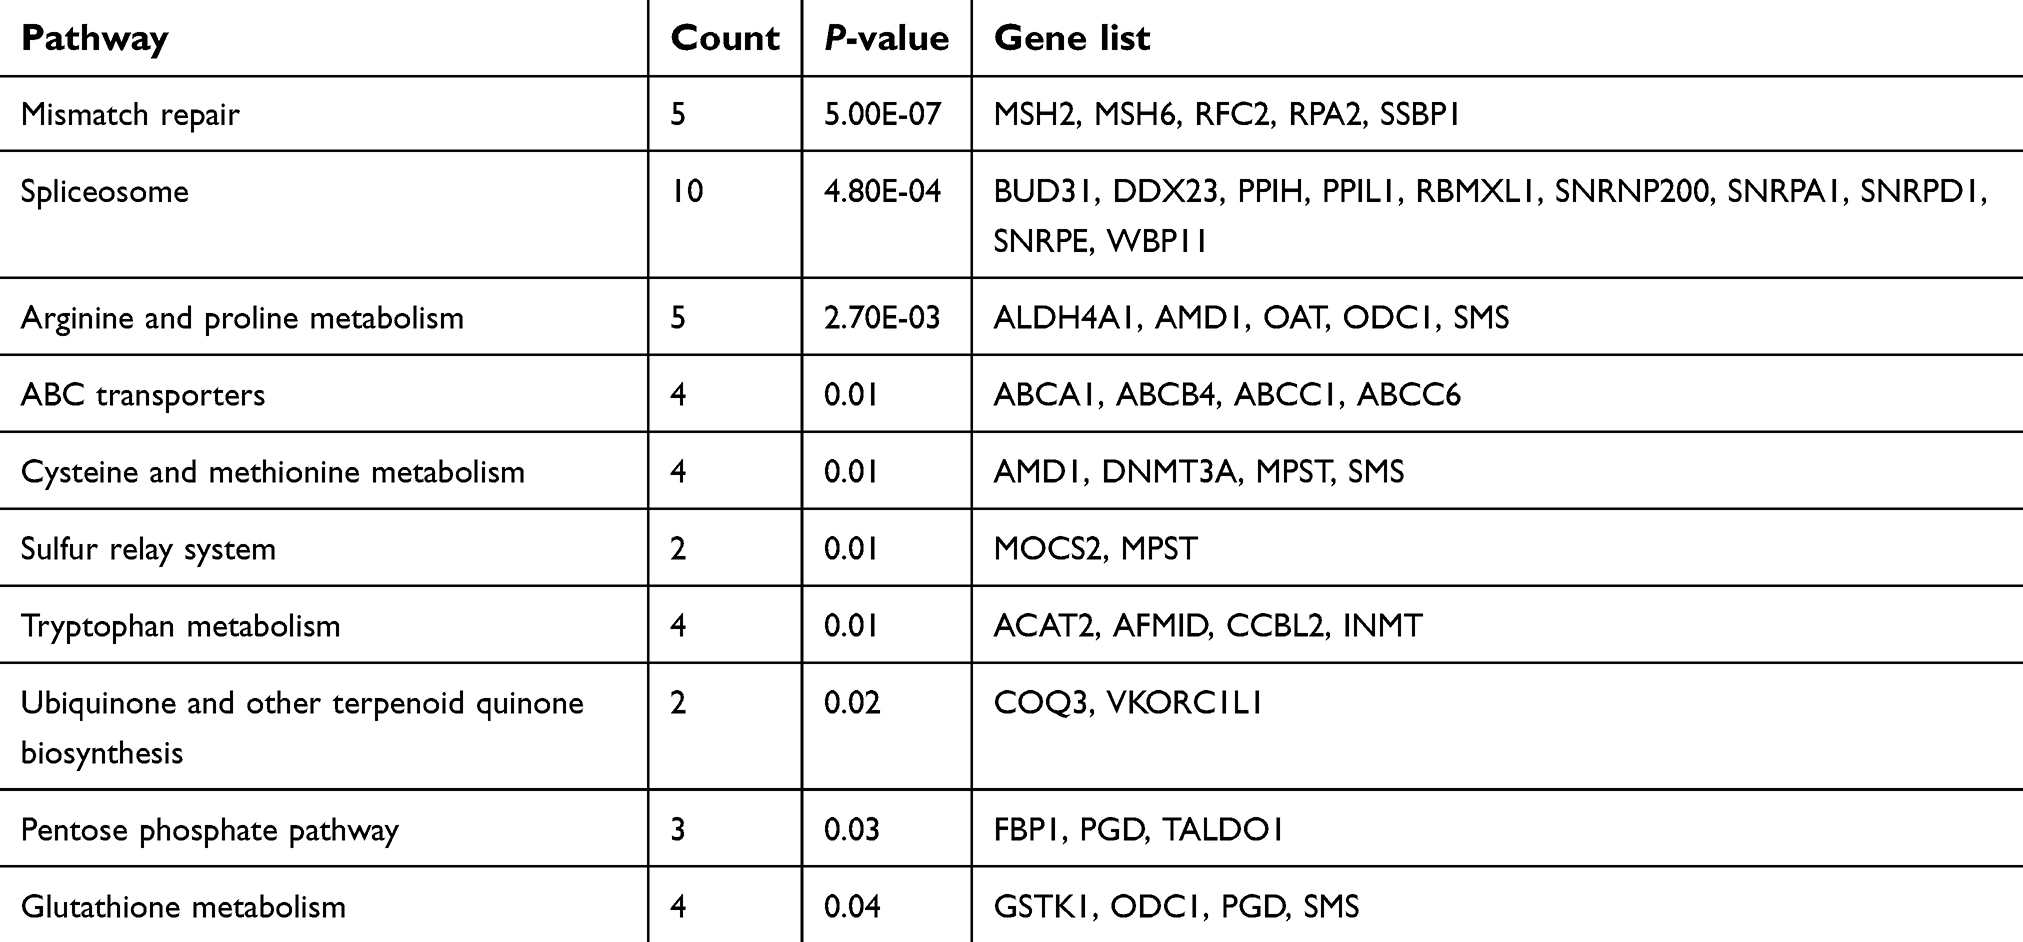 | Table 1 Significant enriched KEGG pathways of DEGs in ES dataset GSE12102 |
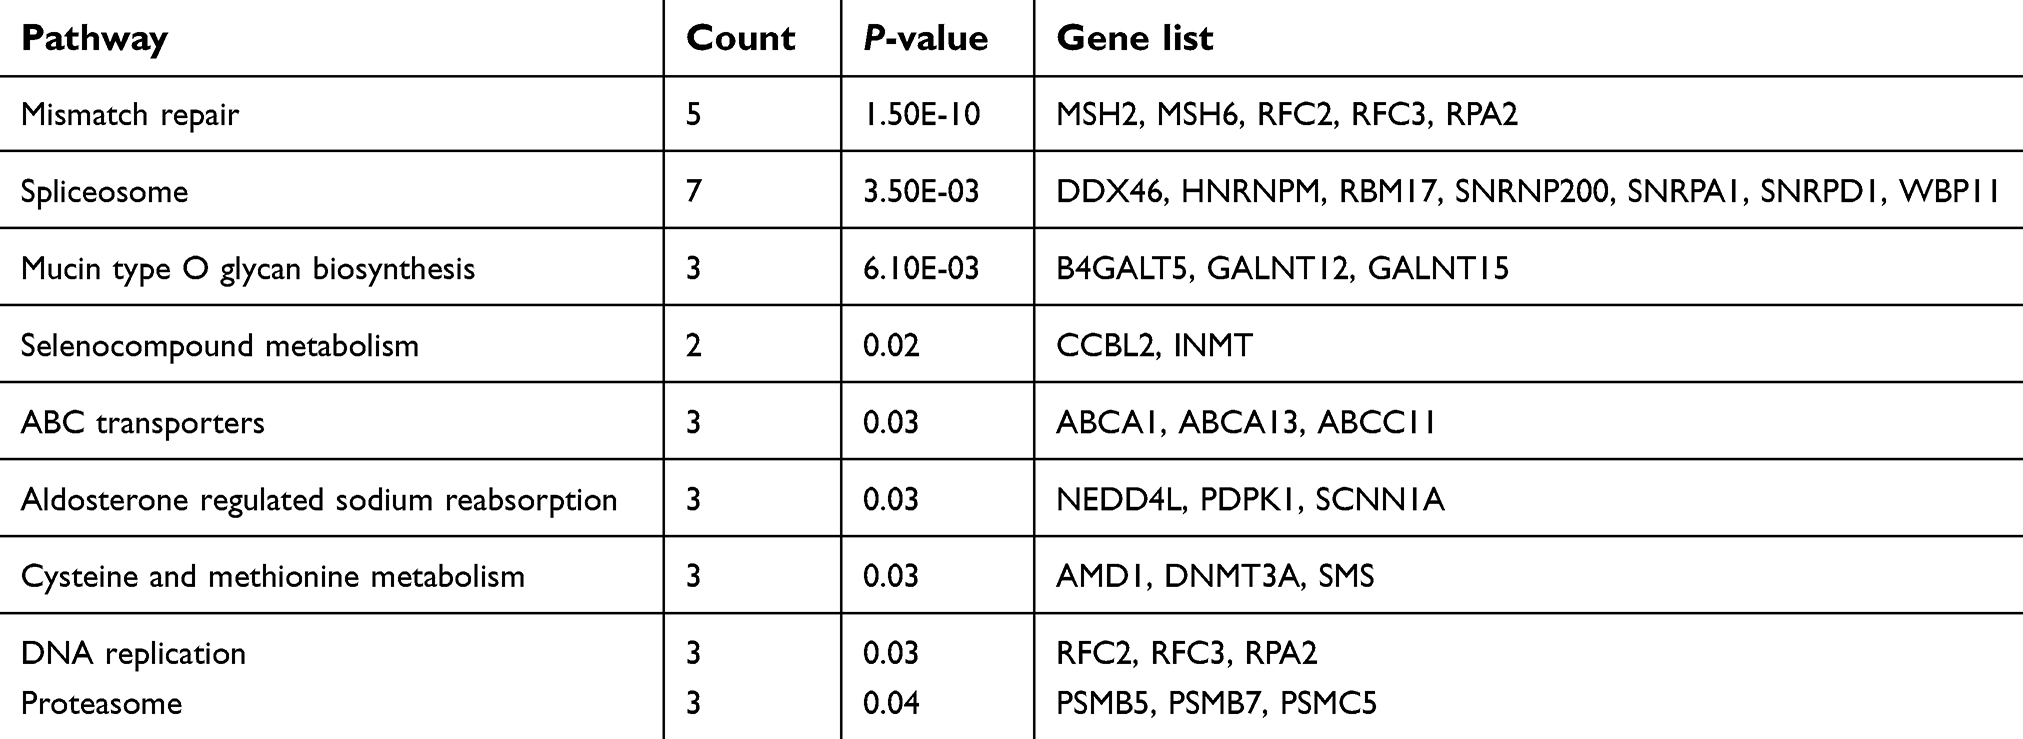 | Table 2 Significant enriched KEGG pathways of DEGs in ES dataset GSE17618 |
The expression and survival analysis of key genes
The expression level and the prognosis value of the key genes on ES patients with/without metastasis were evaluated using GEO datasets and TCGA database. The results showed that the mRNA expression level of MSH2, MSH6, RPA2, and RFC2 was increased in metastasis samples when compared with that of in primary ones (P<0.05, Figure 3A–H). And, the MSH2 expression level was slightly downregulated in recurrence samples compared to metastasis samples (P<0.05, Figure 3A). Meanwhile, GSE63157, and TCGA databases were employed to investigate the prognostic significance of these genes. The result suggested that high expression of MSH2, MSH6, RPA2, and RFC2 was associated with poor overall and event-free survival of ES patients (Figure 4A–H). To investigate the prognosis value of the key genes in pan-cancer TCGA study, Oncolnc.org was applied and COX regression was conducted. The result showed that the expression of the key genes was negatively correlated with the prognosis of SARC, LIHC, LGG, and KIRP patients, and positively correlated with CESC patients (Figure 5A). The full table was presented as
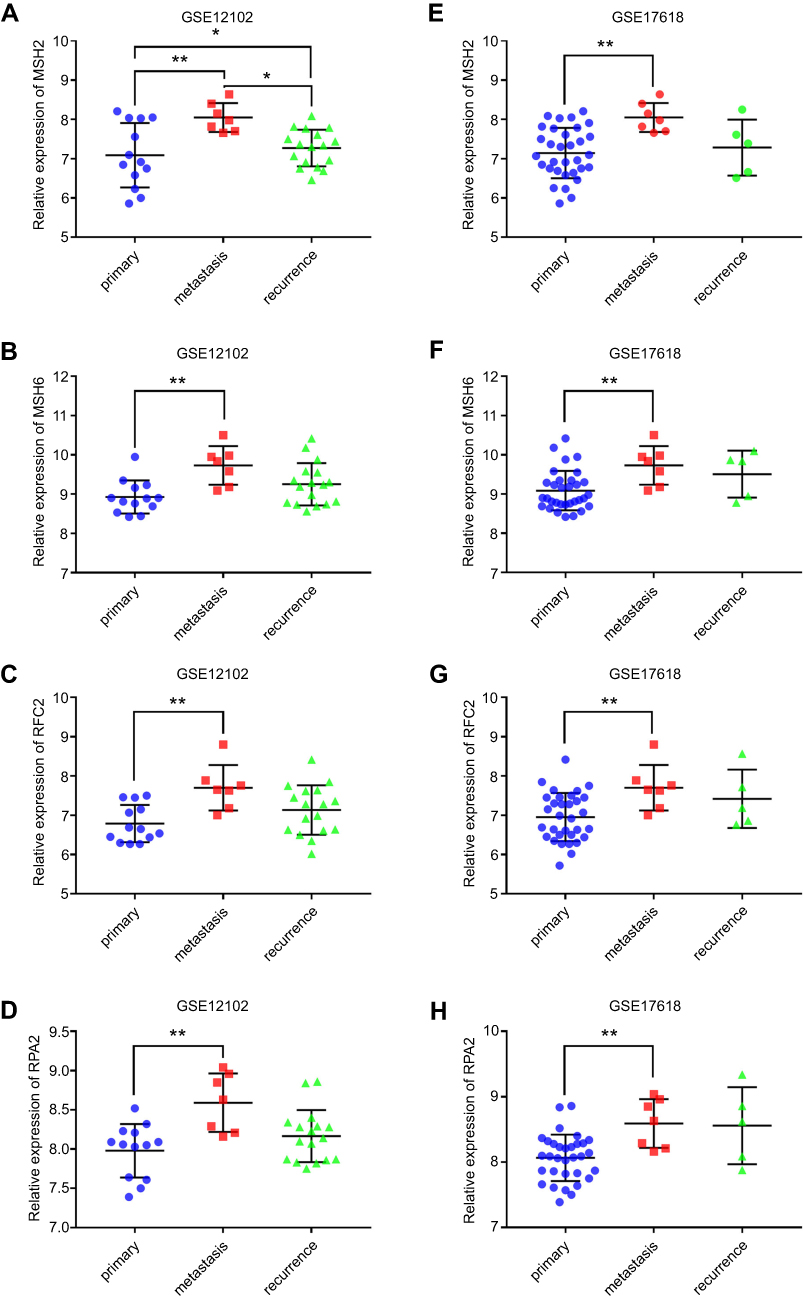 | Figure 3 The key genes expression in dataset GSE12102 and GSE 17618. (A–D) showed the expression of key genes including MSH2, MSH6, RPA2, and RFC2 obtained from GSE12102 dataset. (E–H) showed the expression of key genes obtained from GSE17618 dataset. Primary represents primary samples; metastasis represents metastasis samples; recurrence represents recurrence samples. The blue dot represents the gene expression of primary samples; the red square represents the gene expression of metastasis samples; green triangle represents the gene expression of recurrence samples, respectively. *P<0.05; ** P<0.01. |
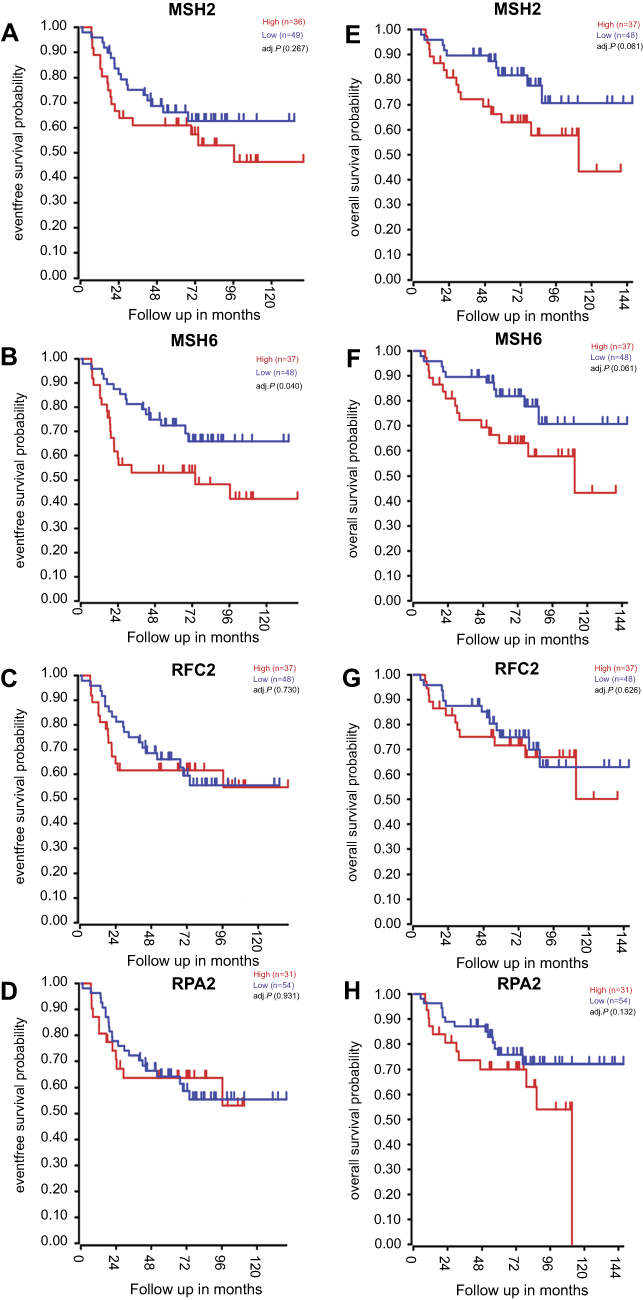 | Figure 4 Kaplan–Meier analysis of the key genes in patients with Ewing sarcoma (ES). (A–D) Relationship between MSH2, MSH6, RPA2, and RFC2 expression and the survival of ES patients analyzed using the GSE63157 dataset. (E–H) Relationship between MSH2, MSH6, RPA2, and RFC2 expression and the survival of ES patients analyzed with the GSE17618 dataset. Red curve represents the high expression of the key genes, and the blue curve represents the low expression of the key genes. |
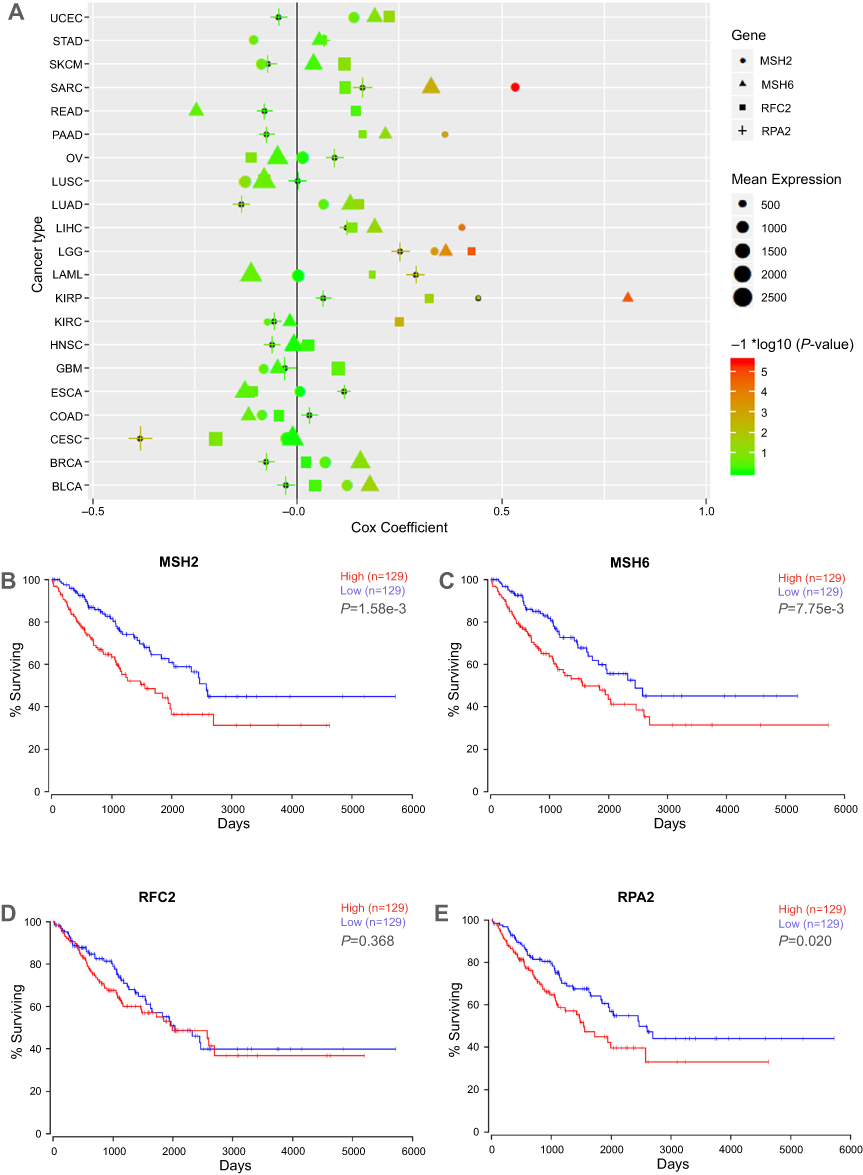 | Figure 5 Cox-regression and survival analyses of key genes in TCGA database. (A) Cox-regression result of the key genes in TCGA pan-cancer datasets. X axis represents cox coefficient value, positive value indicates high gene expression predicts poor prognoses of patients, negative value represents high gene expression predicts good prognoses; y axis represents cancer types in TCGA database. Different shapes represent different genes, shape size represents the mean expression level of target genes in specific cancer. The color accords with the –log10 (P-value). (B–E) Relationship between MSH2, MSH6, RPA2, and RFC2 expression and the survival of sarcoma patients analyzed using the TCGA SARC dataset. The high expression of the key genes showed in red curve, and the low expression of the key genes showed in blue curve. Abbreviations: TCGA The Cancer Genome Atlas; UCEC, uterine corpus endometrial carcinoma; STAD, stomach adenocarcinoma ; SKCM, cutaneous melanoma; SARC, sarcoma; PRAD, prostate adenocarcinoma; PAAD, pancreatic ductal adenocarcinoma; OV, ovarian serous cystadenocarcinoma; LUSC, lung squamous cell carcinoma; LUAD, lung adenocarcinoma; LIHC, liver hepatocellular carcinoma; LGG, lower Grade Glioma; KIRP, papillary kidney carcinoma ; KIRC, clear cell kidney carcinoma; HNSC, head and neck squamous cell carcinoma; GBM, glioblastoma multiforme; ESCA, esophageal cancer; COAD, colon and rectal adenocarcinoma; CECA, cervical cancer; BRCA, breast cancer; BLCA, urothelial bladder cancer; AML, acute myeloid leukemia. |
Evaluation of key genes expression in EWSR/FLI1 knockdown cell and prediction of upstream miRNAs
EWSR/FLI1 expression is closely associated with ES cell viability, and EWSR/FLI1 knockdown promotes the ES cell survival. To further assess the role of key genes including MSH2, MSH6, RPA2, and RFC2 in the prognosis of ES, EWSR/FLI1 knockdown cell was utilized. The result revealed the expression of EWSR and FLI1 was obviously downregulated with time (Figure 6A and B); moreover, the level of MSH2, MSH6, RPA2, and RFC2 decreased first and then slightly increased, and all expression level was significantly lower in EWSR/FLI1 knockdown cell group compared to control group (Figure 6C–F). The correlation was analyzed among different genes, and the results suggested that the expression of EWSR and FLI1 both had a strong association with the four key genes (Figure 6G). Moreover, the ES related miRNA regulation network was predicted using GEO dataset. The results showed that 128 miRNAs were identified as DEMs (
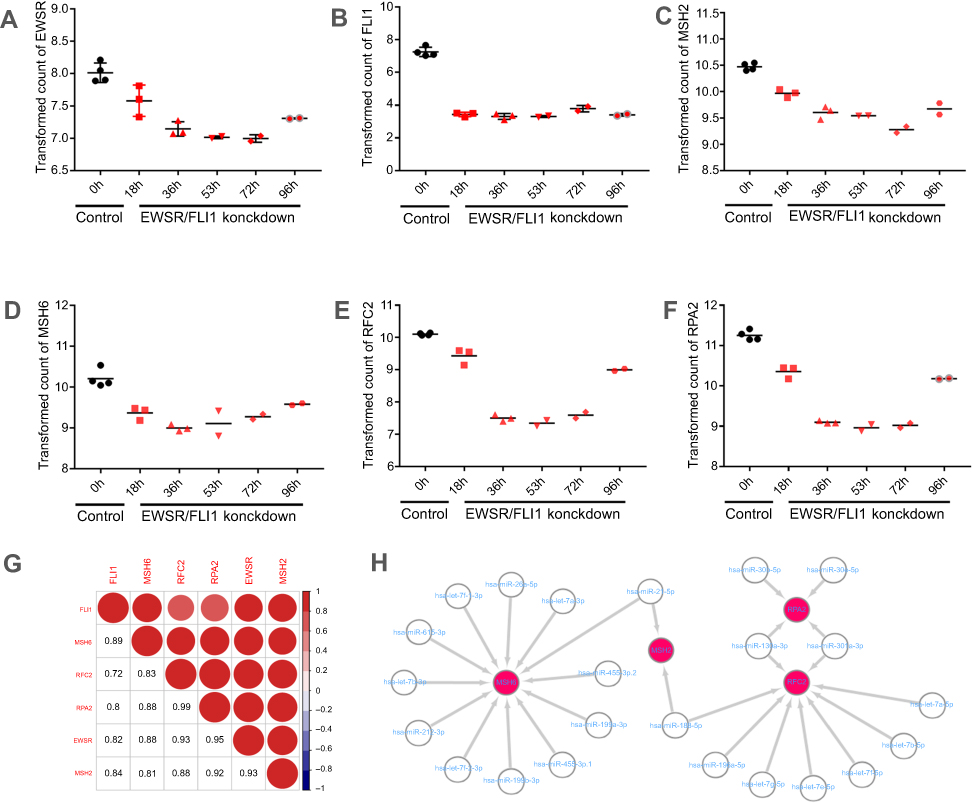 | Figure 6 Key genes expression in EWSR/FLI1 knockdown cell and prediction of miRNA Targets. (A–F) Expression of EWSR, FLI1, MSH2, MSH6, RPA2, and RFC2 in EWSR/FLI1 knockdown cell and control group. Black spots represent the control group, and the red spots represent the EWSR/FLI1 knockdown group, respectively. Moreover, the expression level of gene is expressed as different shapes at different time-points in EWSR/FLI1 knockdown group; (G) showed the correlation among different genes. Shades and area of red circle represent the relevancy degree. Arabic numerals represent the person coefficient. The color scales show the correlation. Red represents positive correlation; blue represents negative correlation; (H) showed the miRNA regulation network concerning the key genes predicted by GEO dataset. |
Discussion
It has been considered that ES is well characterized in genome level,10 it is also documented that ES has a very low mutational burden (0.15 mutations/Mb).25 Tumorigenesis is a complex process, multiple levels of gene expression regulation are involved in the process. Transcription level regulation plays a pivotal role in gene expression. However, the potential correlation between transcription level regulation and ES’s metastasis are not clear. Hence, we aimed to further clarify the underlying mechanism regarding gene expression and ES by a bioinformatics approach. In the present study, data obtained from GSE17618 and GSE12102 datasets were analyzed, then GO and KEGG pathway analysis was conducted. The result revealed that the MMR pathway was involved in ES metastasis in both datasets. And, the key genes including MSH2, MSH6, RFC2, and RFC4 were upregulated in metastasis sample compared to the primary sample in both datasets. The key genes are also closely related with the poorer prognosis of ES patients in dataset GSE63157. Meanwhile, TCGA SARC analyses suggested that the key genes upregulation reduced the overall survival in SARC patients. All those results indicated that the key genes play an important role in ES, which may act as prognostic markers for ES.
MMR pathway is highly activated during G1/S-phase,26,27 in which DNA is duplicated and new histones synthesized. Altered MMR expression indicates a change in proportion of cell in G1/S-phase. Meanwhile, it was reported that overexpression of Msh2 and Msh6 altered the cell cycle distribution in yeast, and result in large percentage of cells in G1, implicating overexpression of MMR genes may promote cancer progression.28 On the other hand, microsatellite instability (MSI) is closely related to DNA MMR deficiency (dMMR). To date, MSI has been identified to affect cancer response to chemotherapies and could regulate PD-1 blockade response in the solid tumor.29,30 Gryfe et al reported that dMMR tumors had significantly more favorable prognosis,31 and this result was supported by other researchers.32 Moreover, Alldinger et al found that dMMR was not prevalent in ES, and concluded that the poor prognosis of ES patients was not associated with the loss of MSH2, MSH6 or MLH1 expression.33 Similarly, our results further pointed out that the upregulation of MSH2, MSH6 would reduce overall survival in ES patients. Furthermore, the gene rank of MSH2 is 25, whereas MSH6 ranks 704 in SARC TCGA database, which reflect the high impact of MSH2, MSH6 expression on survival of sarcoma patients.
RPA2 is a subunit of replication protein A (RPA) complex, and its dysregulation was observed in various cancers. Studies have revealed the overexpression of RPA2 is associated with poorer survival outcomes and a higher probability of tumor metastasis.34–36 Also, the RPA2 inhibitor can synergize with DNA-damaging agents to affect chemotherapy response in lung and ovarian cancer cell lines.37,38 In the present research, RPA2 was upregulated in ES metastasis samples and had a negative correlation with overall survival of ES patients, which indicated that RPA2 may act as a prognosis factor in ES.
Lots of genes participated in this progress of ES metastasis. PPI analyses revealed that multiple key genes directly or indirectly interacted with PCNA. PCNA, as a cofactor of DNA polymerases, encircles DNA and serves as a core element for the recruitment of numerous replication proteins of replication fork.39 PCNA is crucial for Okazaki fragment initiation, and it is loaded onto primer-template junctions by replication factor C (RFC) during DNA replication, after completion of each Okazaki fragment, PCNA is unloaded from DNA, and recycled to promote fidelity of synthesis of subsequent Okazaki fragments.40 RFC2 is the only RFC subunit that can independently unload PCNA from DNA. And the expression of RFC2 was significantly elevated in nasopharyngeal cancer,41 choriocarcinoma,42 glioblastoma as well as osteosarcoma.43,44 RFC2 expression level negatively correlated with ES patient’s survival, which was significantly upregulated in metastasis sample compared to the primary sample. These results suggested that RFC2 may play a key role in the progress of ES metastasis.
EWSR/FLI1 protein regulates multiple target gene expression, which acts as a critical in ES. Heisey et al found that EWSR/FLI1 fusion would increase BCL-2 expression, and thereby induce drug resistant to PARP inhibitors, and BCL-2 and BCL-XL inhibition could significantly reverse the drug resistance in ES.30 FOXO1 is a cancer suppressor in multiple cancer types,45–47 which significantly inhibited cell proliferation and clone formation ability in ES cell.48 However, EWSR/FLI1 fusion could repress FOXO1 expression by binding to the promoter sequence of FOXO1.49 Furthermore, knockdown of ESW/FLI1 impairs tumorigenesis of ES in vivo.50 In the present study, we identified that four key genes significantly correlated with ES metastasis and overall survival in ES patients. EWSR/FLI knockdown in A673 cell line results in the downregulation of the four key genes, and the expression pattern of EWSR and FLI1 are closely related with the four key genes, which indicated that the upregulation of the four genes may be partially regulated by EWSR/FLI1 fusion. Generally, miRNAs participate in the vast majority of biological regulation. Parafioriti et al reported that miRNAs take part in ES oncogenesis.51 Our research demonstrated that 23 miRNAs collectively regulated the expression of the four key genes. A pan-cancer Cox regression of the key genes was performed as indicated in Figure 5A, which indicated that the key genes were negatively correlated with the patient’s prognosis. Therefore, the results further documented that the key genes including MSH2, MSH6, RFC2, and RFC4 played a significant role in the progress of ES prognosis.
Our results showed that MMR pathway was significantly correlated with ES metastasis and overall survival. We speculated that the MMR pathway may regulate the proliferation, invasion, and metastasis in ES cells. Whereas lack of biological and clinical experiments to further confirm these results. In the future, relevant experiments comprising clone formation assay, CCK8 assay, wound healing assay, and clinical prospective study will be applied to verify these results.
Conclusion
Our results indicated MMR pathway significantly enricher in ES metastasis samples and may contribute to ES proliferation, invasion and migration. Four key genes of MMR pathway including MSH2 MSH4, RFC2, and RPA2, closely correlated with poor prognosis of ES patients. Further analyses indicated that EWSR/FLI fusion could regulate the key gene expression. Collectively, this research provided a novel insight into the mechanism of ES metastasis and lay a theoretical foundation for prognosis evaluation and chemotherapeutic drug’s selection of ES patients.
Acknowledgments
This study has been funded by the National Natural Science Foundation of China (No. G3FW155310).
Disclosure
The authors report no conflicts of interest in this work.
References
1. Bellan DG, Filho RJ, Garcia JG, et al. Ewing’s sarcoma: epidemiology and prognosis for patients treated at the pediatric oncology institute, iop-graacc-unifesp. Rev Bras Ortop. 2012;47(4):446–450. doi:10.1016/S2255-4971(15)30126-9
2. Garcia-Dominguez DJ, Hontecillas-Prieto L, Rodriguez-Nunez P, et al. The combination of epigenetic drugs SAHA and HCI-2509 synergistically inhibits EWS-FLI1 and tumor growth in Ewing sarcoma. Oncotarget. 2018;9(59):31397–31410. doi:10.18632/oncotarget.25829
3. Chakraborty D, Rangamani S, Kulothungan V, et al. Trends in incidence of Ewing sarcoma of bone in India - Evidence from the national cancer registry programme (1982–2011). J bone oncol. 2018;12:49–53. doi:10.1016/j.jbo.2018.04.002
4. Chaber R, Lach K, Arthur CJ, et al. Prediction of Ewing sarcoma treatment outcome using attenuated tissue reflection FTIR tissue spectroscopy. Sci Rep. 2018;8(1):12299. doi:10.1038/s41598-018-29795-8
5. McArdle DJT, Nott L, Harle R, McArdle JP. Extraosseous Ewing sarcoma arising in a chronically lymphedematous limb. J Vasc Surg Cases Innov Tech. 2018;4(3):210–215. doi:10.1016/j.jvscit.2018.04.005
6. Hense HW, Ahrens S, Paulussen M, Lehnert M, Jurgens H. [Descriptive epidemiology of Ewing’s tumor–analysis of German patients from (EI)CESS 1980–1997]. Klin Padiatr. 1999;211(4):271–275. doi:10.1055/s-2008-1043799
7. Sankar S, Lessnick SL. Promiscuous partnerships in Ewing’s sarcoma. Cancer Genet. 2011;204(7):351–365. doi:10.1016/j.cancergen.2011.07.008
8. Delattre O, Zucman J, Plougastel B, et al. Gene fusion with an ETS DNA-binding domain caused by chromosome translocation in human tumours. Nature. 1992;359(6391):162–165. doi:10.1038/359162a0
9. Delattre O, Zucman J, Melot T, et al. The Ewing family of tumors – a subgroup of small-round-cell tumors defined by specific chimeric transcripts. N Engl J Med. 1994;331(5):294–299. doi:10.1056/NEJM199408043310503
10. Brohl AS, Patidar R, Turner CE, et al. Frequent inactivating germline mutations in DNA repair genes in patients with Ewing sarcoma. Genet Med. 2017. doi:10.1038/gim.2016.206
11. Ozaki T. Diagnosis and treatment of Ewing sarcoma of the bone: a review article. J Orthop Sci. 2015;20(2):250–263. doi:10.1007/s00776-014-0687-z
12. Ladenstein R, Potschger U, Le Deley MC, et al. Primary disseminated multifocal Ewing sarcoma: results of the Euro-EWING 99 trial. J Clin Oncol. 2010;28(20):3284–3291. doi:10.1200/JCO.2009.22.9864
13. Raciborska A, Bilska K, Drabko K, et al. Vincristine, irinotecan, and temozolomide in patients with relapsed and refractory Ewing sarcoma. Pediatr Blood Cancer. 2013;60(10):1621–1625. doi:10.1002/pbc.24621
14. Gaspar N, Hawkins DS, Dirksen U, et al. Ewing sarcoma: current management and future approaches through collaboration. J Clin Oncol. 2015;33(27):3036–3046. doi:10.1200/JCO.2014.59.5256
15. Cremer T, Cremer C. Chromosome territories, nuclear architecture and gene regulation in mammalian cells. Nature Rev Genet. 2001;2(4):292–301. doi:10.1038/35066075
16. Cremer M, Kupper K, Wagler B, et al. Inheritance of gene density-related higher order chromatin arrangements in normal and tumor cell nuclei. J Cell Biol. 2003;162(5):809–820. doi:10.1083/jcb.200304096
17. Mendoza-Naranjo A, El-Naggar A, Wai DH, et al. ERBB4 confers metastatic capacity in Ewing sarcoma. EMBO Mol Med. 2013;5(7):1019–1034. doi:10.1002/emmm.201202343
18. Potratz J, Tillmanns A, Berning P, et al. Receptor tyrosine kinase gene expression profiles of Ewing sarcomas reveal ROR1 as a potential therapeutic target in metastatic disease. Mol Oncol. 2016;10(5):677–692. doi:10.1016/j.molonc.2015.12.009
19. Barrett T, Wilhite SE, Ledoux P, et al. NCBI GEO: archive for functional genomics data sets–update. Nucleic Acids Res. 2013;41(Databaseissue):D991–D995. doi:10.1093/nar/gks1193
20. Gene Ontology Consortium. The Gene Ontology (GO) project in 2006. Nucleic Acids Res. 2006;34(Databaseissue):D322–D326. doi:10.1093/nar/gkj021
21. Kanehisa M, Furumichi M, Tanabe M, Sato Y, Morishima K. KEGG: new perspectives on genomes, pathways, diseases and drugs. Nucleic Acids Res. 2017;45(D1):D353–d61. doi:10.1093/nar/gkw1092
22. Franz M, Rodriguez H, Lopes C, et al. GeneMANIA update 2018. Nucleic Acids Res. 2018. doi:10.1093/nar/gky311
23. Anaya J. OncoLnc: linking TCGA survival data to mRNAs, miRNAs, and lncRNAs. Peer J Comput Sci. 2016;2(e67). doi:10.7717/peerj-cs.67
24. Kutmon M, Ehrhart F, Willighagen E, Evelo C, Coort S. CyTargetLinker app update: A flexible solution for network extension in Cytoscape [version 1; referees: 1 approved]. F1000Research. 2018;7(743). doi:10.12688/f1000research.14613.1
25. Brohl AS, Solomon DA, Chang W, et al. The genomic landscape of the Ewing Sarcoma family of tumors reveals recurrent STAG2 mutation. PLoS Genet. 2014;10(7):e1004475. doi:10.1371/journal.pgen.1004541
26. Edelbrock MA, Kaliyaperumal S, Williams KJ. DNA mismatch repair efficiency and fidelity are elevated during DNA synthesis in human cells. Mutat Res. 2009;662(1–2):59–66. doi:10.1016/j.mrfmmm.2008.12.006
27. Li F, Mao G, Tong D, et al. The histone mark H3K36me3 regulates human DNA mismatch repair through its interaction with MutSα. Cell. 2013;153(3):590–600. doi:10.1016/j.cell.2013.03.025
28. Chakraborty U, Dinh TA, Alani E. Genomic instability promoted by overexpression of mismatch repair factors in yeast: a model for understanding cancer progression. Genetics. 2018. doi:10.1534/genetics.118.300923
29. Kang BW, Kim JG, Lee SJ, et al. Clinical significance of microsatellite instability for stage II or III colorectal cancer following adjuvant therapy with doxifluridine. Med Oncol. 2011;28 Suppl 1:S214–S218. doi:10.1007/s12032-010-9701-2
30. Heisey DAR, Lochmann TL, Floros KV, et al. The Ewing family of tumors rely on BCL-2 and BCL-XL to escape PARP inhibitor toxicity. Clin Cancer Res. 2019;25(5):1664–1675. doi:10.1158/1078-0432.CCR-18-0277
31. Gryfe R, Kim H, Hsieh ET, et al. Tumor microsatellite instability and clinical outcome in young patients with colorectal cancer. N Engl J Med. 2000;342(2):69–77. doi:10.1056/NEJM200001133420201
32. Mouradov D, Domingo E, Gibbs P, et al. Survival in stage II/III colorectal cancer is independently predicted by chromosomal and microsatellite instability, but not by specific driver mutations. Am J Gastroenterol. 2013;108(11):1785–1793. doi:10.1038/ajg.2013.292
33. Alldinger I, Schaefer KL, Goedde D, et al. Microsatellite instability in Ewing tumor is not associated with loss of mismatch repair protein expression. J Cancer Res Clin Oncol. 2007;133(10):749–759. doi:10.1007/s00432-007-0220-2
34. Dahai Y, Sanyuan S, Hong L, Di Z, Chong Z. A relationship between replication protein A and occurrence and prognosis of esophageal carcinoma. Cell Biochem Biophys. 2013;67(1):175–180. doi:10.1007/s12013-013-9530-y
35. Givalos N, Gakiopoulou H, Skliri M, et al. Replication protein A is an independent prognostic indicator with potential therapeutic implications in colon cancer. Mod Pathol. 2007;20(2):159–166. doi:10.1038/modpathol.3800719
36. Kanakis D, Levidou G, Gakiopoulou H, et al. Replication protein A: a reliable biologic marker of prognostic and therapeutic value in human astrocytic tumors. Hum Pathol. 2011;42(10):1545–1553. doi:10.1016/j.humpath.2010.12.018
37. Neher TM, Bodenmiller D, Fitch RW, Jalal SI, Turchi JJ. Novel irreversible small molecule inhibitors of replication protein A display single-agent activity and synergize with cisplatin. Mol Cancer Ther. 2011;10(10):1796–1806. doi:10.1158/1535-7163.MCT-11-0303
38. Shuck SC, Turchi JJ. Targeted inhibition of replication protein A reveals cytotoxic activity, synergy with chemotherapeutic DNA-damaging agents, and insight into cellular function. Cancer Res. 2010;70(8):3189–3198. doi:10.1158/0008-5472.CAN-09-3422
39. Moldovan GL, Pfander B, Jentsch S. PCNA, the maestro of the replication fork. Cell. 2007;129(4):665–679. doi:10.1016/j.cell.2007.05.003
40. Kelch BA, Makino DL, O’Donnell M, Kuriyan J. How a DNA polymerase clamp loader opens a sliding clamp. Science. 2011;334(6063):1675–1680. doi:10.1126/science.1211884
41. Xiong S, Wang Q, Zheng L, Gao F, Li J. Identification of candidate molecular markers of nasopharyngeal carcinoma by tissue microarray and in situ hybridization. Med Oncol. 2011;28(Suppl 1):S341–S348. doi:10.1007/s12032-010-9727-5
42. Cui JQ, Shi YF, Zhou HJ. [Expression of RFC2 and PCNA in different gestational trophoblastic diseases]. Ai Zheng. 2004;23(2):196–200.
43. Kun S, Duan Q, Liu G, Lu JM. Prognostic value of DNA repair genes based on stratification of glioblastomas. Oncotarget. 2017;8(35):58222–58230. doi:10.18632/oncotarget.17452
44. Peng C, Yang Q, Wei B, et al. Investigation of crucial genes and microRNAs in conventional osteosarcoma using gene expression profiling analysis. Mol Med Rep. 2017. doi:10.3892/mmr.2017.7506
45. Yang Y, Blee AM, Wang D, et al. Loss of FOXO1 cooperates with TMPRSS2-ERG overexpression to promote prostate tumorigenesis and cell invasion. Cancer Res. 2017. doi:10.1158/0008-5472.CAN-17-0686
46. Pan CW, Jin X, Zhao Y, et al. AKT-phosphorylated FOXO1 suppresses ERK activation and chemoresistance by disrupting IQGAP1-MAPK interaction. EMBO J. 2017. doi:10.15252/embj.201695534
47. Coomans de Brachène A, Jb D. FOXO transcription factors in cancer development and therapy. Cell Mol Life Sci. 2016;73(6):1159–1172. doi:10.1007/s00018-015-2112-y
48. Niedan S, Kauer M, Aryee DN, et al. Suppression of FOXO1 is responsible for a growth regulatory repressive transcriptional sub-signature of EWS-FLI1 in Ewing sarcoma. Oncogene. 2014;33(30):3927–3938. doi:10.1038/onc.2013.361
49. Yang L, Hu HM, Zielinska-Kwiatkowska A, Chansky HA. FOXO1 is a direct target of EWS-Fli1 oncogenic fusion protein in Ewing’s sarcoma cells. Biochem Biophys Res Commun. 2010;402(1):129–134. doi:10.1016/j.bbrc.2010.09.129
50. Kaeding KE, Zaret KS. Microsatellite enhancers can be targeted to impair tumorigenesis. Genes Dev. 2018;32(15–16):991–992. doi:10.1101/gad.318105.118
51. Parafioriti A, Bason C, Armiraglio E, et al. Ewing’s Sarcoma: an analysis of miRNA expression profiles and target genes in paraffin-embedded primary tumor tissue. Int J Mol Sci. 2016;17(5). doi:10.3390/ijms17050656
 © 2019 The Author(s). This work is published and licensed by Dove Medical Press Limited. The full terms of this license are available at https://www.dovepress.com/terms.php and incorporate the Creative Commons Attribution - Non Commercial (unported, v3.0) License.
By accessing the work you hereby accept the Terms. Non-commercial uses of the work are permitted without any further permission from Dove Medical Press Limited, provided the work is properly attributed. For permission for commercial use of this work, please see paragraphs 4.2 and 5 of our Terms.
© 2019 The Author(s). This work is published and licensed by Dove Medical Press Limited. The full terms of this license are available at https://www.dovepress.com/terms.php and incorporate the Creative Commons Attribution - Non Commercial (unported, v3.0) License.
By accessing the work you hereby accept the Terms. Non-commercial uses of the work are permitted without any further permission from Dove Medical Press Limited, provided the work is properly attributed. For permission for commercial use of this work, please see paragraphs 4.2 and 5 of our Terms.