")
Back to Journals » OncoTargets and Therapy » Volume 10
Identification of key genes and molecular mechanisms associated with dedifferentiated liposarcoma based on bioinformatic methods
Authors Yu H, Pei D, Chen L, Zhou X, Zhu H
Received 13 January 2017
Accepted for publication 20 April 2017
Published 16 June 2017 Volume 2017:10 Pages 3017—3027
DOI https://doi.org/10.2147/OTT.S132071
Checked for plagiarism Yes
Review by Single anonymous peer review
Peer reviewer comments 4
Editor who approved publication: Dr Chiung-Kuei Huang
Hongliang Yu,1 Dong Pei,2 Longyun Chen,2 Xiaoxiang Zhou,2 Haiwen Zhu2
1Department of Radiation Oncology, Jiangsu Cancer Hospital and Jiangsu Institute of Cancer Research, The Affiliated Cancer Hospital of Nanjing Medical University, Nanjing, 2Department of Radiation Oncology, Yancheng Third People’s Hospital, Yancheng, Jiangsu, People’s Republic of China
Background: Dedifferentiated liposarcoma (DDLPS) is one of the most deadly types of soft tissue sarcoma. To date, there have been few studies dedicated to elucidating the molecular mechanisms behind the disease; therefore, the molecular mechanisms behind this malignancy remain largely unknown.
Materials and methods: Microarray profiles of 46 DDLPS samples and nine normal fat controls were extracted from Gene Expression Omnibus (GEO). Quality control for these microarray profiles was performed before analysis. Hierarchical clustering and principal component analysis were used to distinguish the general differences in gene expression between DDLPS samples and the normal fat controls. Differentially expressed genes (DEGs) were identified using the Limma package in R. Next, the enriched Gene Ontology (GO) terms and Kyoto Encyclopedia of Genes and Genomes (KEGG) pathways were obtained using the online tool DAVID (http://david.abcc.ncifcrf.gov/). A protein–protein interaction (PPI) network was constructed using the STRING database and Cytoscape software. Furthermore, the hub genes within the PPI network were identified.
Results: All 55 microarray profiles were confirmed to be of high quality. The gene expression pattern of DDLPS samples was significantly different from that of normal fat controls. In total, 700 DEGs were identified, and 83 enriched GO terms and three KEGG pathways were obtained. Specifically, within the DEGs of DDLPS samples, several pathways were identified as being significantly enriched, including the PPAR signaling pathway, cell cycle pathway, and pyruvate metabolism pathway. Furthermore, the dysregulated PPI network of DDLPS was constructed, and 14 hub genes were identified. Characteristic of DDLPS, the genes CDK4 and MDM2 were universally found to be up-regulated and amplified in gene copy number.
Conclusion: This study used bioinformatics to comprehensively mine DDLPS microarray data in order to obtain a deeper understanding of the molecular mechanism of DDLPS.
Keywords: dedifferentiated liposarcoma, molecular mechanisms, microarray, bioinformatic methods
Introduction
Dedifferentiated liposarcoma (DDLPS) is one of the most common subtypes of soft tissue sarcoma. The biological behavior of DDLPS is highly aggressive, marked by a propensity for local tissue invasion and distant metastasis.1 Even in cases where extensive “curative” surgery is performed, local recurrence rates of 40%–80% are reported.2 It is also reported that ~14% of DDLPS patients have already developed distant metastasis when they first present.3 Despite huge innovations in chemotherapy in the past few decades, chemotherapy still has a minimal effect on this disease. In fact, currently, other than surgery for early stages of the disease, there are limited options for the treatment of patients with late-stage or recurrent disease. As a consequence, the clinical outcome of DDLPS is very dismal. DDLPS is one of the most deadly malignancies threatening human health.
The dismal clinical outcome of DDLPS is largely attributable to a deficit in knowledge about the disease. Although several studies are available,1–4 the molecular mechanisms behind DDLPS have still not been fully grasped. Further research aimed at generating a comprehensive understanding of this disease is urgently needed. Fortunately, advancements in microarray technology have allowed for further elucidation of the molecular mechanisms of DDLPS and for identification of novel diagnostic biomarkers and treatment targets. In this study, we downloaded microarray profiles of 46 DDLPS samples and nine non-cancerous fat control samples from the Gene Expression Omnibus (GEO) database and analyzed these data using bioinformatic methods. We identified a set of genes that were significantly differentially expressed in DDLPS and, furthermore, constructed a protein–protein interaction (PPI) network. The enriched, aberrant pathways and hub genes in DDLPS were also identified. These data may help to improve the understanding of DDLPS and substantially impact the diagnosis and treatment of this deadly disease.
Materials and methods
Microarray data
Microarray gene expression profiles from the GSE21124 data set4 were downloaded from the GEO database (http://www.ncbi.nlm.nih.gov/geo/). The platform information on these microarray data is as follows: GPL96, Affymetrix Human Genome U133A Array (Affymetrix Inc., Santa Clara, CA, USA). In this data set, the messenger RNA (mRNA) expression of 46 DDLPS specimens and nine normal fat tissue controls was included. This study was approved by the ethics committee of Yancheng Third People’s Hospital.
Data preprocessing and identification of differentially expressed genes (DEGs)
First, we performed quality control analysis on the raw data by using the 3′/5′ ratio test and by plotting the RNA degradation curve.5 Then, we filtered out unwanted noise from the microarray data by normalizing the raw data and correcting the background using the gcRMA6 package in R.7 After normalizing, we used hierarchical clustering and principal component analysis (PCA) to assess the differences in gene expression between DDLPS and normal fat controls.8 Then, the chip data were analyzed using the Linear Models for Microarray data (limma) package9 in R. In the processing, if multiple probes corresponded to one gene, the average expression values of those probes were calculated and used as the expression value for that gene.10 After preprocessing, up-regulated and down-regulated genes were identified between the DDLPS specimens and the normal fat tissues. The independent samples t-tests were conducted on the gene expression values between the two groups; those genes with an adjusted P-value <0.001 and a |log2(fold change)| >1 were selected as DEGs.9
Functional enrichment analysis of DEGs
After obtaining the DEGs, Gene Ontology (GO) enrichment and Kyoto Encyclopedia of Genes and Genomes (KEGG)11 pathway analyses were conducted for gene annotation and functional enrichment analysis using the online tool Database for Annotation, Visualization and Integrated Discovery (DAVID; http://david.abcc.ncifcrf.gov/). The resulting GO terms and the KEGG pathways with both P<0.05 and false discovery rate <0.05 were considered significantly enriched in the obtained DEGs.
Constructing the PPI network of DEGs and selecting the hub genes
Genes involved in the same PPI network often work together to perform one biological function.12 To further investigate the underlying molecular mechanisms of DDLPS, PPI networks for the DEGs were constructed using the STRING database (http://www.string-db.org/).13 We selected the interactions whose integrated scores were >0.4 (the default threshold in the STRING database) to construct the PPI network. Finally, the obtained PPI networks were visualized using Cytoscape software.14 To select hub genes from the PPI network, we analyzed the topological structure of the network and calculated the degree for each gene (the number of genes directly interacting with it).12 Here, we defined hub genes in the network as those genes with degree ≥10.
Results
Quality control of microarray data sets
Good quality control is fundamental for successful microarray data analysis. The RNA degradation plot is shown in Figure 1; all RNA samples were of good quality and showed minimal degradation. Additionally, the results of the 3′/5′ ratio tests presented in Figure S1 confirm that the actin and GAPDH 3′/5′ ratios for the included microarray profiles were <3, the threshold for good quality data.5 No bioB alert was found.5 Therefore, all the microarray experiments were confirmed to be of good quality before further data processing.
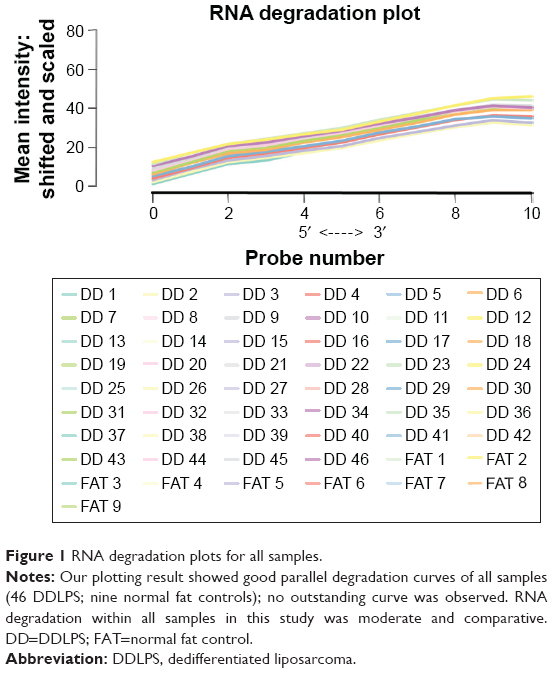 | Figure 1 RNA degradation plots for all samples. |
Gene expression profiles and DEGs
After data preprocessing, a set of 12,442 genes were mapped to probes for each CEL file. Gene expression differences between the DDLPS samples and the normal fat controls were assessed. As shown in Figure 2, both the results of PCA (Figure 2A) and hierarchical clustering (Figure 2B) show that the gene expression pattern of DDLPS is highly different from that of the normal fat control. We further investigated the origin of the difference between the DDLPS samples and the normal fat control by identifying the DEGs. With a threshold of having an adjusted P-value <0.001 and a |log2(fold change)| >1, 700 genes were identified as DEGs in DDLPS. Of these DEGs, 267 genes (38.14%) were up-regulated and the remaining 433 genes (61.86%) were down-regulated. A heat map of these DEGs is presented in Figure 2C.
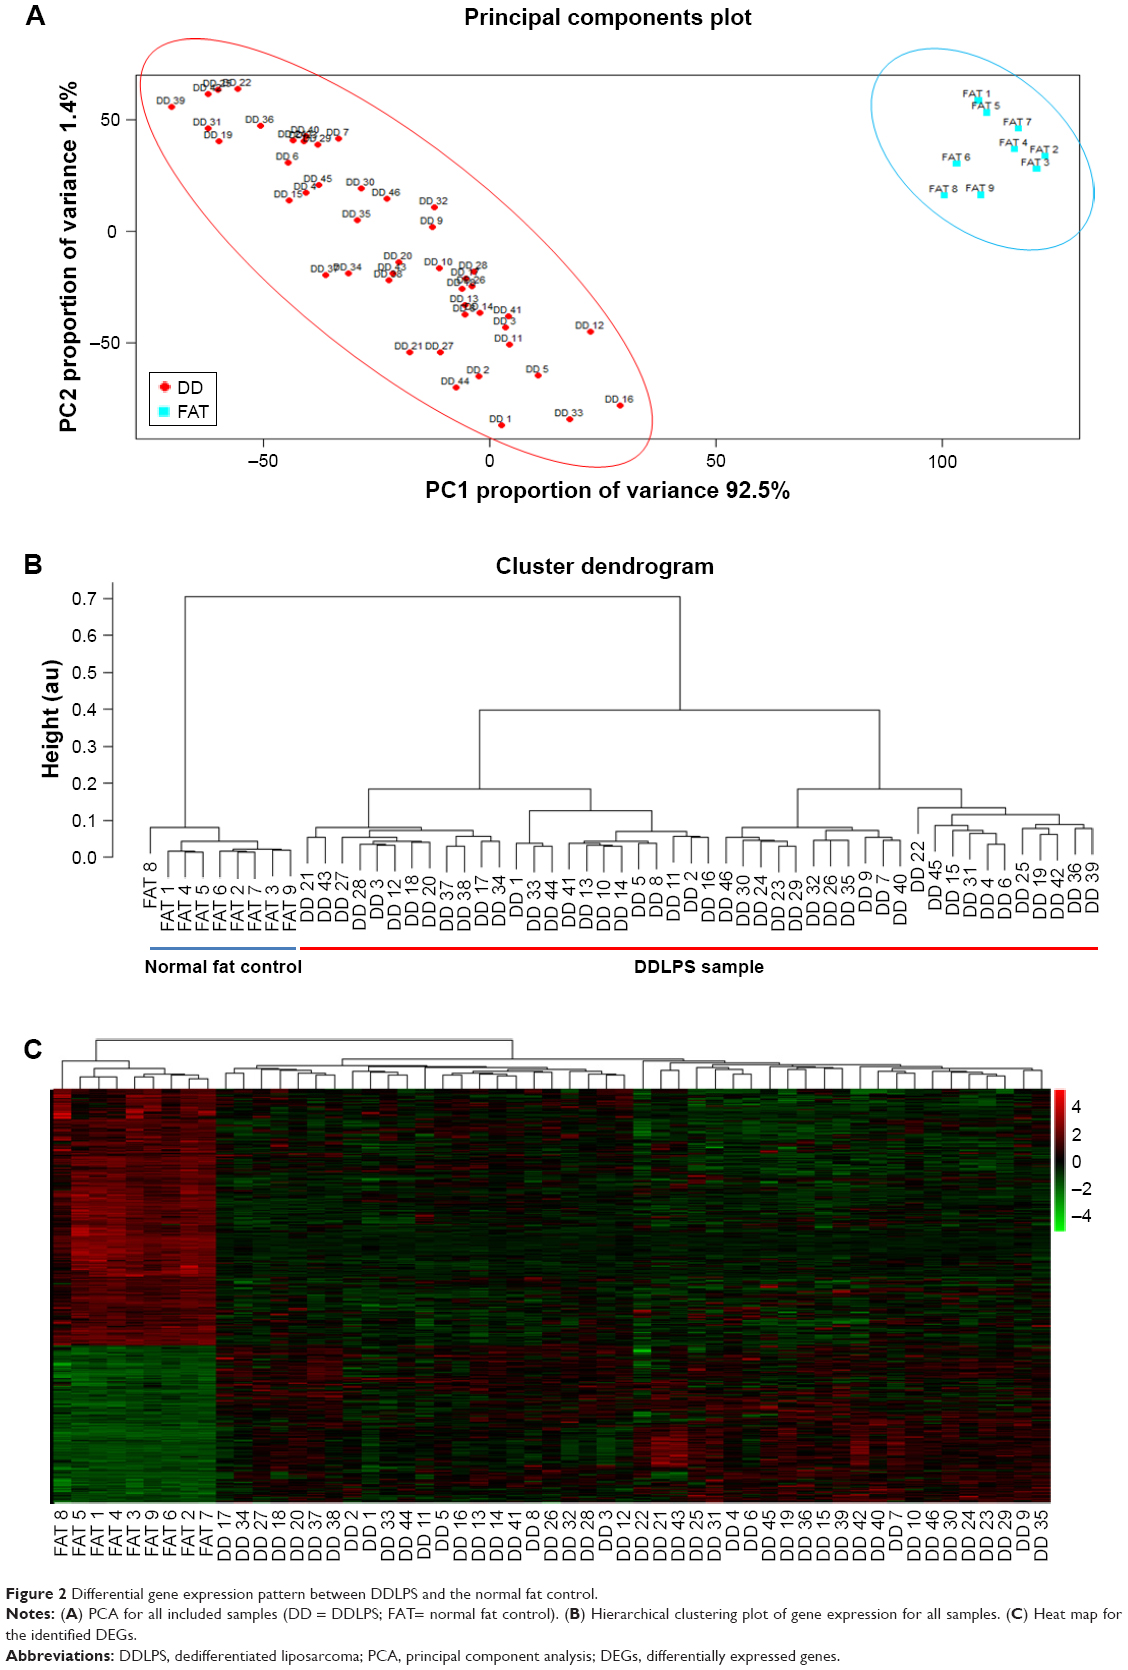 | Figure 2 Differential gene expression pattern between DDLPS and the normal fat control. |
Functional annotation of DEGs
To classify these 700 DEGs functionally, a total of 83 enriched GO terms and three KEGG pathways were obtained. The ten most enriched GO terms according to the P-value are shown in Table 1. These GO terms were categorized based on the biological process to which the terms were related, such as response to organic substances, response to a hormone stimulus, response to an endogenous stimulus, oxidation–reduction, glucose metabolic processes, response to a steroid hormone stimulus, hexose metabolic processes, regulation of cell proliferation, and monosaccharide metabolic processes. Additionally, there was one enriched GO term related to molecular function, carboxylic acid binding. The three KEGG pathways that were enriched are presented in Table 1, namely, the PPAR signaling pathway, the pyruvate metabolism pathway, and the cell cycle pathway. The three identified KEGG pathway maps are presented in Figure S2.
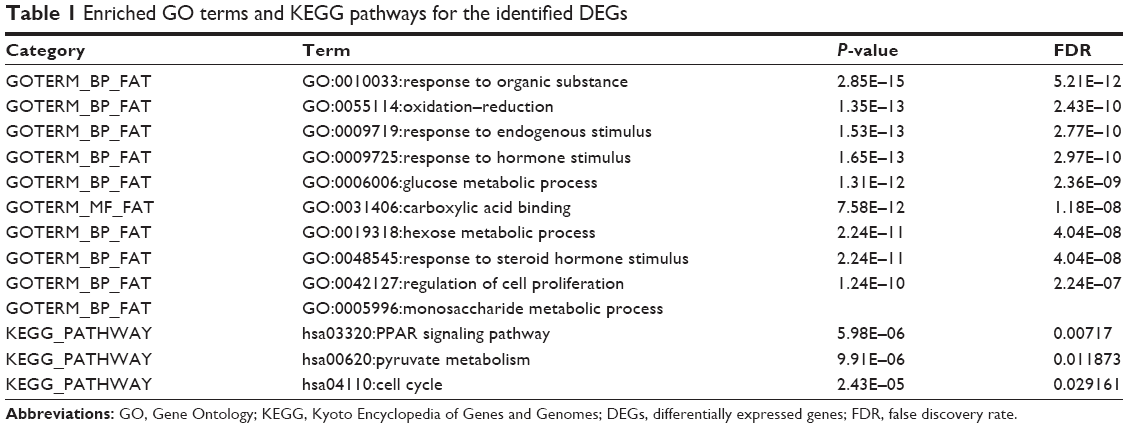 | Table 1 Enriched GO terms and KEGG pathways for the identified DEGs |
PPI network analysis for identification of hub DEGs
The constructed PPI network is shown in Figure 3; it contains 389 nodes and 738 edges. Each node in the figure represents a DEG, and each edge represents a PPI between the two DEGs. Initially, 21 genes were identified as hub genes with an interaction degree ≥10. Then, we filtered the hub gene list to only include those genes that were consistently up- or down-regulated in at least 90% of all 46 DDLPS samples. The final 14 hub genes and corresponding degrees are presented in Table 2. Of these hub genes, APP had the highest degree (96), followed by MDM2 and CDK4, with degrees of 50 and 24, respectively. The hub genes identified in the PPI network analysis may serve as key players in the aberrant signaling pathways of this malignancy and are potential targets for future anti-DDLPS treatment research.
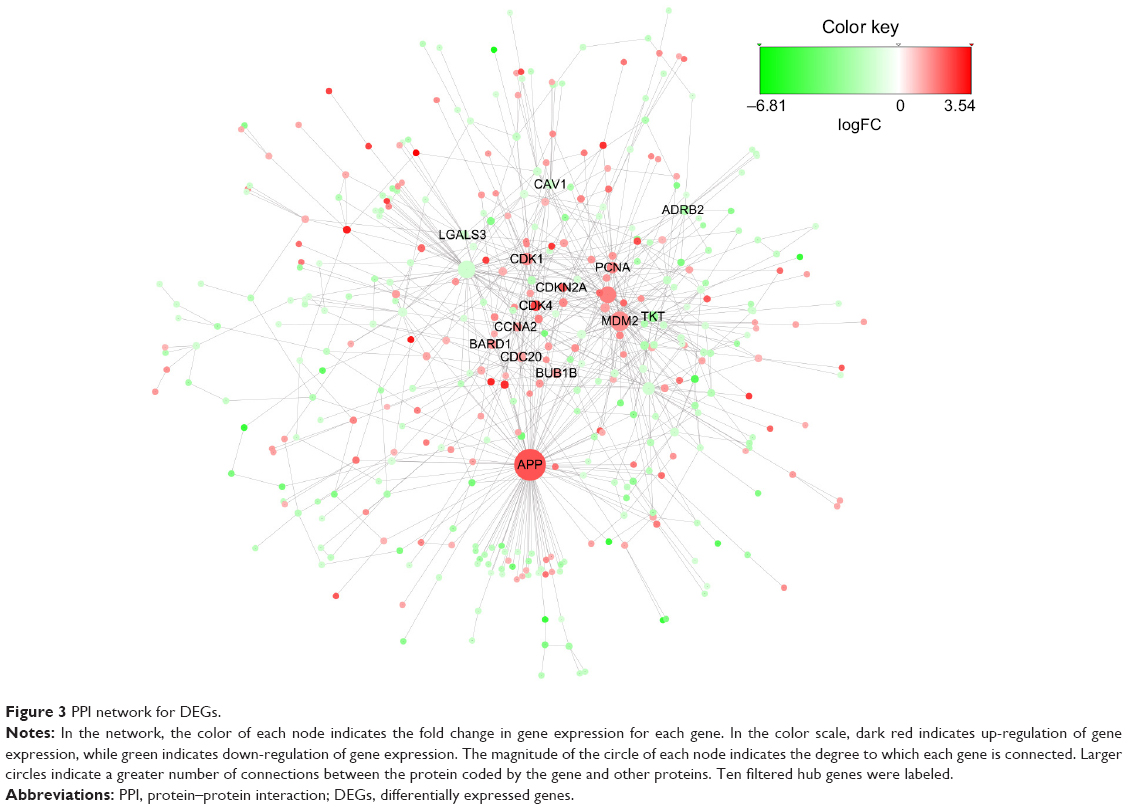 | Figure 3 PPI network for DEGs. |
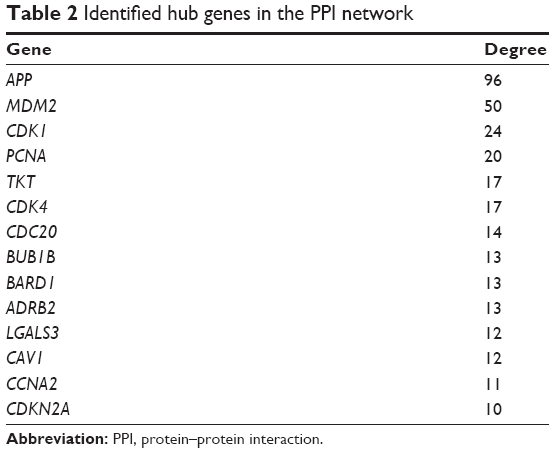 | Table 2 Identified hub genes in the PPI network |
Discussion
DDLPS is one of the most deadly malignancies, with a high incidence of recurrence and metastasis. However, possibly due to its relatively low morbidity, there are few studies focused on this disease and the underlying molecular mechanisms, which are largely unknown. This study was conducted to improve understanding of the disease by using bioinformatic data mining methods. Microarray analysis is a high-throughput technique that can simultaneously detect the expression level of thousands of genes. This technique has made much progress in the last decade. In this study, we conducted a genome-wide expression analysis of microarray data from 46 DDLPS specimens and nine normal fat controls downloaded from the GEO database. Before analysis, our quality control test showed minimal degradation of the RNA samples; the data produced from the chip hybridization procedure were of good quality. This made it valid to use the data for further analysis. Between DDLPS and normal fat tissue, a total of 700 DEGs were identified, including 267 genes that were up-regulated in DDLPS and 433 genes that were down-regulated in DDLPS. GO terms and KEGG pathway annotation of DEGs revealed that the DEGs were enriched for several biological processes including PPAR signaling, pyruvate metabolism, and the cell cycle pathway.
For the enriched PPAR pathway, our results showed that 16 of the identified DEGs matched the PPAR-γ signaling pathway. All the DEGs included in the PPAR-γ pathway were down-regulated, indicating suppression of the PPAR-γ pathway in DDLPS. Previous studies have shown that the PPAR-γ pathway plays a variety of roles in adipose cell differentiation, metabolism modulation, and the inflammatory response.15 Genetic studies have indicated that PPAR-γ functions as a tumor suppressor in a variety of tumors other than DDLPS, including tumors of the breast, prostate, and colon. An agonist of PPAR-γ exerts an anti-proliferative effect on various types of tumor cells in vitro and in vivo.16 Our study reveals that suppression of the PPAR-γ pathway may play a key role in aberrant signal transduction in DDLPS.
Looking at the enriched pyruvate metabolism pathway, up-regulation of the PKM gene and down-regulation of a series of genes including PC, PCK1, and PCK2 may reflect an enhancement of glycolytic activity, with more pyruvate and lactate production and inhibition of oxidative phosphorylation through the tricarboxylic acid cycle. Therefore, an acidic micro-environment within DDLPS was predicted. As is well known, up-regulation of glycolysis, inhibition of the tricarboxylic acid cycle, and an acidic micro-environment all contribute to oncogenesis and cancer cell survival.17 Therefore, the aberrant pyruvate metabolism pathway we have identified may contribute to the malignant phenotype of DDLPS.
Aberrations in the cell cycle pathway are an important molecular mechanism of oncogenesis and support the uncontrolled proliferation of cancer cells. Dysregulation of this pathway is also well recognized as a hallmark of malignancy.18 In this study, we identified aberrant up-regulation of CDK4 and MDM2 in >90% of DDLPS samples. CDK4 is a catalytic subunit well known for its important role in accelerating progression through the G1-S phase of the cell cycle. MDM2 is an important negative regulator of the tumor suppressor, p53.19 Changes in the expression of genes involved in cell cycle, especially up-regulation of CDK4 and MDM2, could accelerate cell cycle progression, support cell proliferation, suppress p53-induced apoptosis, and finally facilitate the malignant transformation of adipose cells into DDLPS cells. Additionally, there were 14 hub genes identified in DDLPS in this study. Of these, eight genes, namely, CDK4, MDM2, CDK1, PCNA, CCNA2, CDKN2A, CDC20, and BUB1B, were all grouped into the cell cycle regulation pathway. This emphasizes the importance of aberrant cell cycle regulation in DDLPS. More importantly, copy number segmentation of the 12q13 locus revealed an overwhelmingly constant copy number gain of CDK4 and MDM2 in DDLPS.4 This shows that the up-regulation of both CDK4 and MDM2 may not be downstream consequences of aberrant signaling but may serve as the driving mutation in DDLPS. There has already been one clinical trial testing the effectiveness of a CDK4 inhibitor on DDLPS that has shown favorable results.1
There are several limitations to this study. First, this study is based on microarray data mining. Post-transcriptional modifications may exist, and the pattern of protein expression may differ from that of mRNA expression in DDLPS cells. Therefore, further confirming studies are necessary. Second, the threshold we set for considering a gene differentially expressed may not be stringent enough. On the other hand, in a living cell, every biochemical reaction is meticulously regulated; therefore, some DEGs may not satisfy the threshold we set but nonetheless serve as key regulators in DDLPS. In this way, our DEG derivation may risk missing some important information in delineating the elaborate molecular mechanisms regulating DDLPS. Third, some enriched pathways and hub genes were identified in this study; however, the relationships between and the hierarchical processes within them were not fully elucidated. In an effort to identify the underlying molecular mechanisms of DDLPS and finally conquer this deadly disease, further studies are warranted.
Conclusion
The microarray data used in this study were confirmed as being of high quality. Based on microarray profiles generated from DDLPS and normal fat controls, this study identified a set of core genes and pathways that are altered in DDLPS compared to normal fat tissue. Hub genes that we have identified as significantly enriched include APP, MDM2, CDK1, PCNA, TKT, CDK4, CDC20, BUB1B, BARD1, ADRB2, LGALS3, CAV1, CCNA2, and CDKN2A. The pathways identified as enriched in DDLPS are the pyruvate pathway, cell cycle pathway, and PPAR signaling pathway. These identified genes and pathways shed light on the molecular mechanisms behind DDLPS and may serve as biomarkers for DDLPS or potential targets for DDLPS therapy.
Acknowledgment
This work was supported by the Jiangsu Provincial Natural Science Fund (No BK20141018).
Disclosure
The authors report no conflicts of interest in this work.
References
Dickson MA, Schwartz GK, Keohan ML, et al. Progression-free survival among patients with well-differentiated or dedifferentiated liposarcoma treated with CDK4 inhibitor palbociclib: a phase 2 clinical trial. JAMA Oncol. 2016;2(7):937–940. | ||
Dalal KM, Antonescu CR, Singer S. Diagnosis and management of lipomatous tumors. J Surg Oncol. 2008;97(4):298–313. | ||
Ghadimi MP, Al-Zaid T, Madewell J, et al. Diagnosis, management, and outcome of patients with dedifferentiated liposarcoma systemic metastasis. Ann Surg Oncol. 2011;18(13):3762–3770. | ||
Barretina J, Taylor BS, Banerji S, et al. Subtype-specific genomic alterations define new targets for soft-tissue sarcoma therapy. Nat Genet. 2010;42(8):715–721. | ||
Wilson CL, Miller CJ. Simpleaffy: a bioconductor package for Affymetrix quality control and data analysis. Bioinformatics. 2005;21(18):3683–3685. | ||
Gautier L, Cope L, Bolstad BM, Irizarry RA. affy – analysis of Affymetrix GeneChip data at the probe level. Bioinformatics. 2004;20(3):307–315. | ||
Ihaka R, Gentleman R. R: a language for data analysis and graphics. J Comput Graph Stat. 1996;5(3):299–314. | ||
Altmae S, Martinez-Conejero JA, Salumets A, Simon C, Horcajadas JA, Stavreus-Evers A. Endometrial gene expression analysis at the time of embryo implantation in women with unexplained infertility. Mol Hum Reprod. 2010;16(3):178–187. | ||
Smyth GK. Limma: linear models for microarray data. In: Gentleman R, Carey VJ, Huber W, Irizarry RA, Dudoit S, editors. Bioinformatics and Computational Biology Solutions Using R and Bioconductor. New York, NY: Springer; 2005:397–420. | ||
Liu P, Jiang W, Ren H, Zhang H, Hao J. Exploring the molecular mechanism and biomakers of liver cancer based on gene expression microarray. Pathol Oncol Res. 2015;21(4):1077–1083. | ||
Kanehisa M, Furumichi M, Tanabe M, Sato Y, Morishima K. Nucleic Acids Res. 2017;45(D1):353–361. | ||
Vinayagam A, Zirin J, Roesel C, et al. Integrating protein-protein interaction networks with phenotypes reveals signs of interactions. Nat Methods. 2014;11(1):94–99. | ||
Franceschini A, Szklarczyk D, Frankild S, et al. STRING v9.1: protein-protein interaction networks, with increased coverage and integration. Nucleic Acids Res. 2013;41(Database issue):D808–D815. | ||
Shannon P, Markiel A, Ozier O, et al. Cytoscape: a software environment for integrated models of biomolecular interaction networks. Genome Res. 2003;13(11):2498–2504. | ||
Ahmadian M, Suh JM, Hah N, et al. PPARgamma signaling and metabolism: the good, the bad and the future. Nat Med. 2013;19(5):557–566. | ||
Dicitore A, Caraglia M, Colao A, et al. Combined treatment with PPAR-gamma agonists in pancreatic cancer: a glimmer of hope for cancer therapy? Curr Cancer Drug Targets. 2013;13(4):460–471. | ||
Martinez-Outschoorn UE, Peiris-Pages M, Pestell RG, Sotgia F, Lisanti MP. Cancer metabolism: a therapeutic perspective. Nat Rev Clin Oncol. 2017;14(1):11–31. | ||
Hanahan D, Weinberg RA. Hallmarks of cancer: the next generation. Cell. 2011;144(5):646–674. | ||
Lee B, Sandhu S, McArthur G. Cell cycle control as a promising target in melanoma. Curr Opin Oncol. 2015;27(2):141–150. |
Supplementary materials
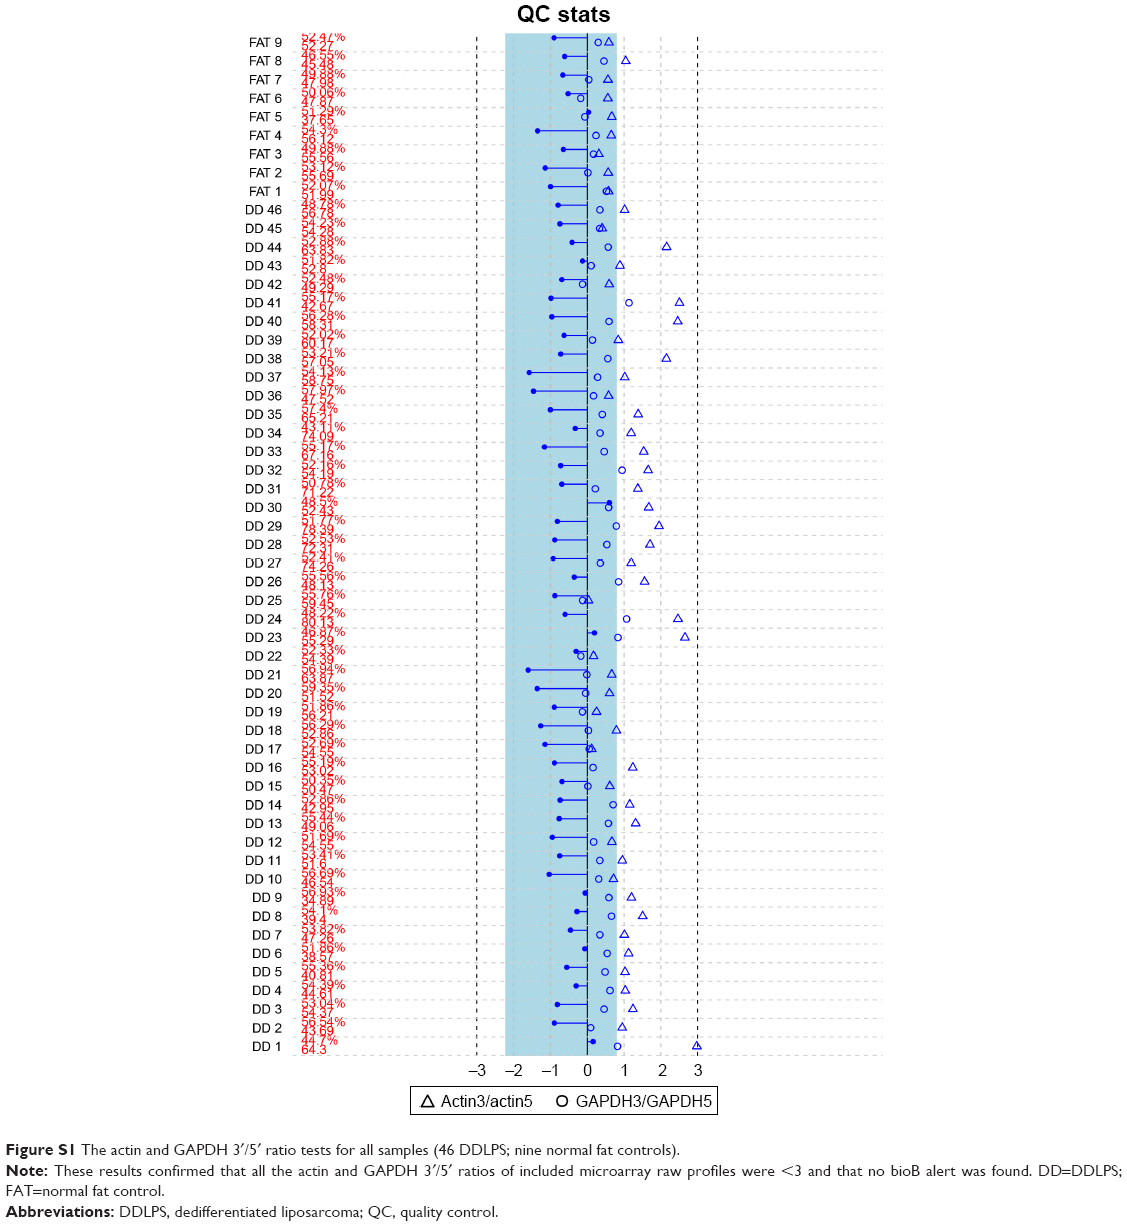 | Figure S1 The actin and GAPDH 3′/5′ ratio tests for all samples (46 DDLPS; nine normal fat controls). |
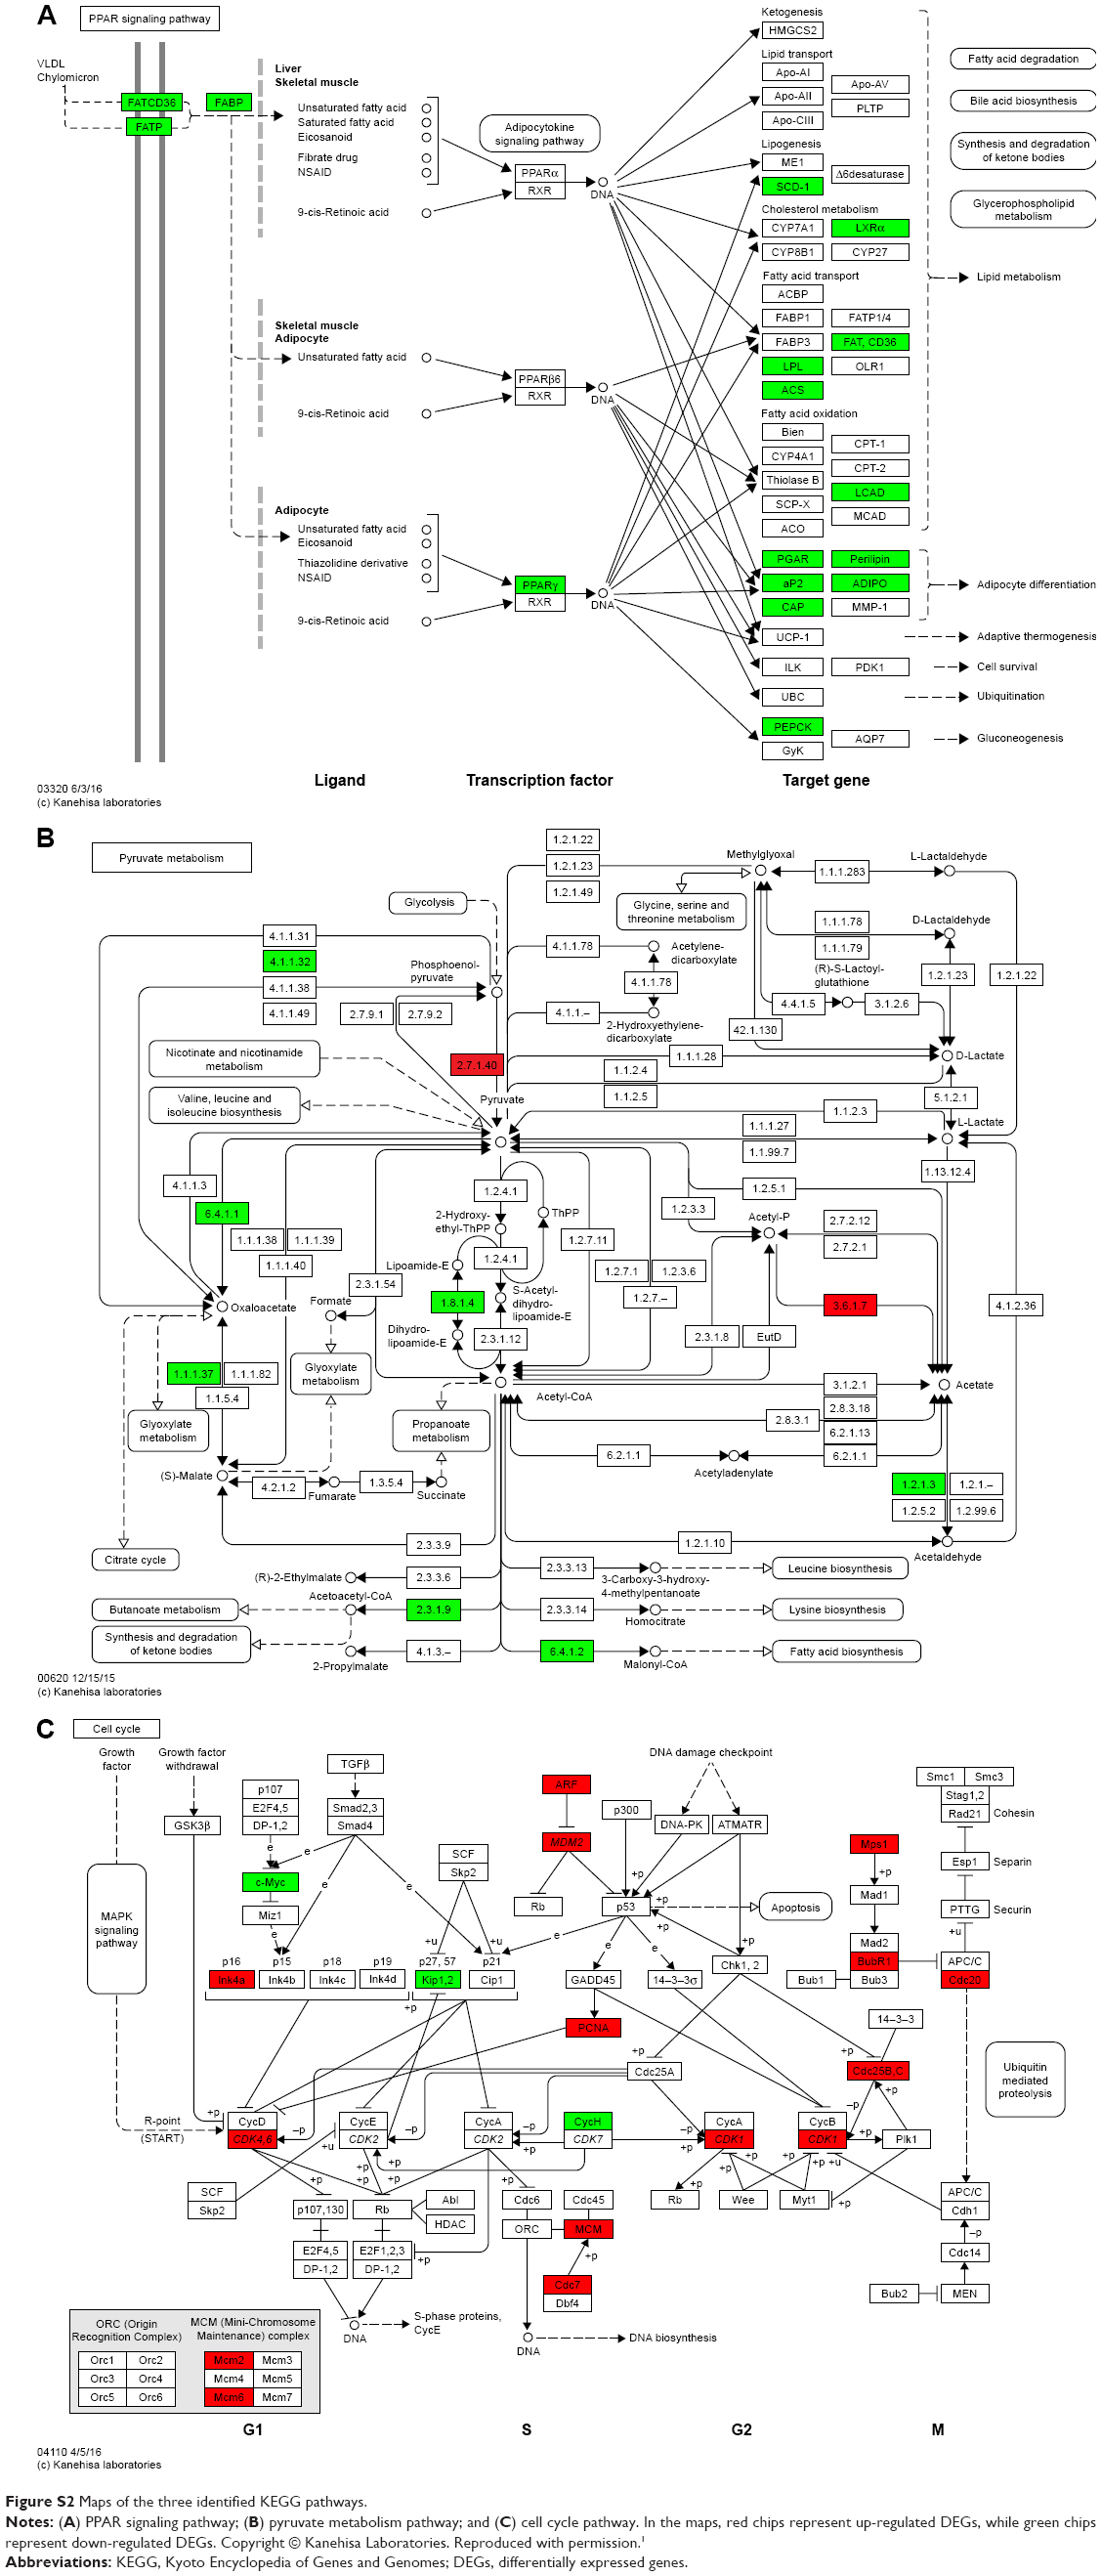 | Figure S2 Maps of the three identified KEGG pathways. |
Reference
Kanehisa M, Furumichi M, Tanabe M, Sato Y, Morishima K. Nucleic Acids Res. 2017;45(D1):353–361. |
 © 2017 The Author(s). This work is published and licensed by Dove Medical Press Limited. The full terms of this license are available at https://www.dovepress.com/terms.php and incorporate the Creative Commons Attribution - Non Commercial (unported, v3.0) License.
By accessing the work you hereby accept the Terms. Non-commercial uses of the work are permitted without any further permission from Dove Medical Press Limited, provided the work is properly attributed. For permission for commercial use of this work, please see paragraphs 4.2 and 5 of our Terms.
© 2017 The Author(s). This work is published and licensed by Dove Medical Press Limited. The full terms of this license are available at https://www.dovepress.com/terms.php and incorporate the Creative Commons Attribution - Non Commercial (unported, v3.0) License.
By accessing the work you hereby accept the Terms. Non-commercial uses of the work are permitted without any further permission from Dove Medical Press Limited, provided the work is properly attributed. For permission for commercial use of this work, please see paragraphs 4.2 and 5 of our Terms.