")
Back to Journals » OncoTargets and Therapy » Volume 13
Identification of Important Modules and Biomarkers in Breast Cancer Based on WGCNA
Authors Tian Z, He W, Tang J, Liao X, Yang Q, Wu Y , Wu G
Received 16 April 2020
Accepted for publication 17 June 2020
Published 12 July 2020 Volume 2020:13 Pages 6805—6817
DOI https://doi.org/10.2147/OTT.S258439
Checked for plagiarism Yes
Review by Single anonymous peer review
Peer reviewer comments 2
Editor who approved publication: Dr William C. Cho
Zelin Tian,1,* Weixiang He,2,* Jianing Tang,1 Xing Liao,1 Qian Yang,1 Yumin Wu,1 Gaosong Wu1
1Department of Thyroid and Breast Surgery, Zhongnan Hospital of Wuhan University, Wuhan, People’s Republic of China; 2Department of Urology, Zhongnan Hospital of Wuhan University, Wuhan, People’s Republic of China
*These authors contributed equally to this work
Correspondence: Gaosong Wu
Department of Thyroid and Breast Surgery, Zhongnan Hospital of Wuhan University, Wuhan, People’s Republic of China
Tel +86 150988909890
Email [email protected]
Introduction: Breast cancer (BRCA) has the highest incidence among female malignancies, and the prognosis for these patients remains poor.
Materials and Methods: In this study, core modules and central genes related to BRCA were identified through a weighted gene co-expression network analysis (WGCNA). Gene expression profiles and clinical data of GSE25066 were obtained from the Gene Expression Omnibus (GEO) database. The result was validated with RNA-seq data from The Cancer Genome Atlas (TCGA) and Oncomine database. The top 30 key module genes with the highest intramodule connectivity were selected as the core genes (R2 = 0.40).
Results: According to TCGA and Oncomine datasets, seven genes were selected as candidate hub genes. Following further experimental verification, four hub genes (FAM171A1, NDFIP1, SKP1, and REEP5) were retained.
Conclusion: We identified four hub genes as candidate biomarkers for BRCA. These hub genes may provide a theoretical basis for targeted therapy against BRCA.
Keywords: breast cancer, WGCNA, GEO, Oncomine, prognosis
Introduction
Breast cancer is the most common cancer and the second leading cause of cancer related death among women worldwide.1 Statistics on the prevalence of BRCA in the past 5 years indicated that approximately 11% of BRCA cases worldwide occur in China; notably the incidence of BRCA has risen rapidly in recent decades.2 Common treatments for BRCA include surgical resection, chemotherapy, radiation, endocrine therapy, and molecular targeted therapy.3 With the development of medical technology, the prognosis for BRCA has improved significantly. However, the treatment advanced BRCA remains suboptimal.4 The management and prognosis of BRCA are closely related to the pathological classification. Patients who are positive for estrogen receptor (ER), progesterone receptor (PR), and human epidermal growth factor receptor 2 (HER2) are linked to a better prognosis, whereas those with triple-negative breast cancer (TNBC) suffered a worse prognosis and are more likely to experience metastasize.5
BRCA is a multi-factorial disease process, and there is no clear conclusion regarding its etiology in the medical field. Heredity, weight, and benign breast disease are common risk factors for BRCA.6,7 BRCA is also closely related to family history. Familial BRCA refers to disease diagnosed in more than two immediate family members. Generally, if one of the parents has BRCA, the risk of BRCA in their offspring is significantly increased.8 It has been discovered that there are >10 BRCA susceptibility genes, the most well studied being BRCA1 and BRCA2.9 The main functions of BRCA1 and BRCA2 are to repair DNA damage, and regulate gene transcription, cell cycle, and apoptosis.10,11 They play a crucial role in maintaining the stability and integrity of the human normal genome. However, following the occurrence of a genetic mutation, BRCA1 and BRCA2 cannot play their original role, thereby often leading to the development of BRCA.12
WGCNA is a method for the analysis of the gene expression patterns of multiple samples. It can cluster genes and form modules by similar gene expression patterns and analyze the relationship between modules and specific features (eg, clinical information of patients).13 In this study, according to the WGCNA algorithm, the gene expression network was assumed to follow a scale-free distribution, and a gene co-expression network was constructed. Subsequently, we built a hierarchical clustering tree by calculating the dissimilarity coefficients of different nodes. Moreover, we classified high similarity genes into the same modules and low similarity genes into different modules, and visualized these modules.
Materials and Methods
Data Processing
Figure 1 illustrates the workflow chart of data preparation, processing, analysis, and validation. Gene expression profiles and clinical traits of GSE25066 were downloaded from GEO database (https://www.ncbi.nlm.nih.gov/geo/query/acc.cgi). GPL96 [HG-U133A] Affymetrix Human Genome U133A Array was used to extract the expression profile information of the GSE25066 dataset. GSE25066 is a SuperSeries and has two SubSeries (GSE25055 and GSE25065). This dataset consists of 508 patients with BRCA, and includes information on patient age, ER, PR, HER2 expression, clinical T stage, lymph node metastasis, Disease-free survival years, grade, clinical American Joint Committee on Cancer stage, etc. After excluding patient samples for which information on age, disease-free survival even time years, N stage, T stage, American Joint Committee on Cancer stage, and grade information was lacking, 483 patient samples were retained. We downloaded the original expression profile, and used the robust multi-array average (RMA) algorithm to perform background correction and quantile normalization. Subsequently, mRNA expression matrices of patients with BRCA were developed. Furthermore, the level of expression was calculated using variance analysis (12,548 genes), and selected genes with a variance greater than all the quartiles of variance (3137 genes) were selected for further co-expression network construction.
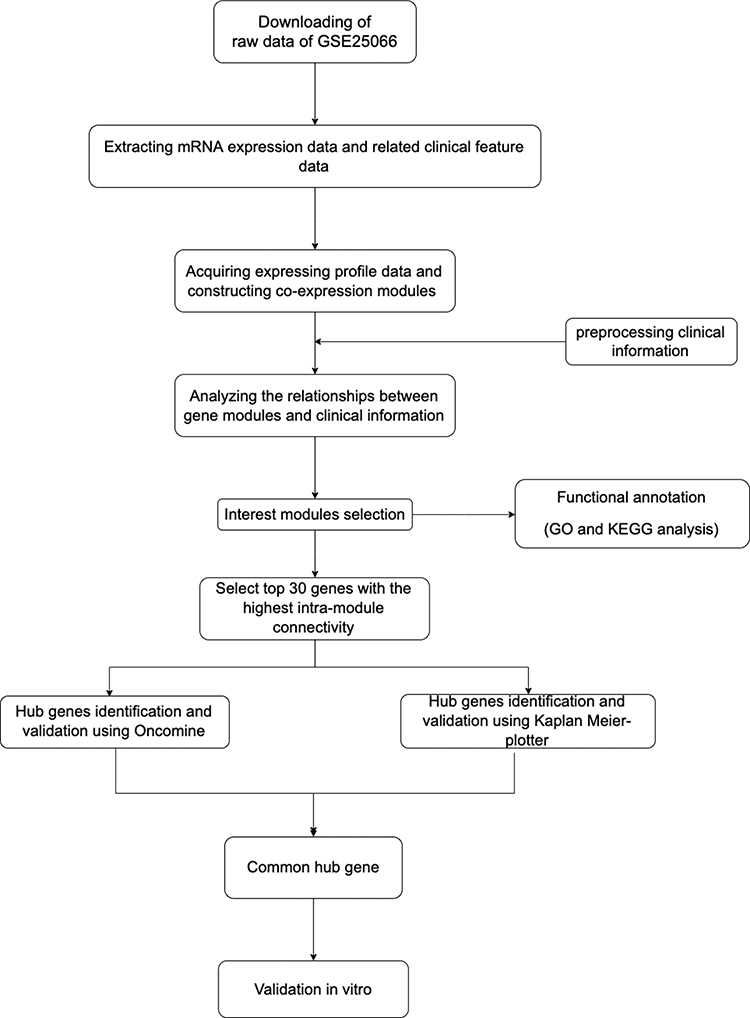 |
Figure 1 Flow diagram of the dates of preparation, processing, analysis, and validation. |
Co-Expression Network Construction
Firstly, we evaluated the 3137 variant genes to test their availability and used the R package termed “WGCNA” to construct a gene co-expression network. Subsequently, we constructed an adjacency matrix to describe the correlation strength between the nodes. The formula of the adjacency matrix was as follows:

In this formula, i and j represent two different genes, and Xi and Xj are their respective expression values. sij represents the Pearson’s correlation coefficient, and aij represents the strength of the correlation between two genes. In this study, we chose the soft-threshold β = 10 (scale free R2 = 0.98). Subsequently, we transformed the adjacency matrix into a topological overlap matrix (TOM). The TOM matrix is a method to quantitatively describe the similarity in nodes by comparing the weighted correlation between two nodes and other nodes. Next, we performed hierarchical clustering to identify modules, each containing at least 30 genes (minModuleSize = 30). Finally, we calculated the eigengene, hierarchically clustered the modules, and merged similar modules (abline = 0.25).
Identification of Clinically Significant Modules
The co-expression module is a collection of genes with high topological overlap similarity. Genes in the same module often have a higher degree of co-expression. In this study, we used two methods to identify the important modules relevant to clinical traits. The module eigengene (ME) represents the first principal component of the module, and is used to describe the expression pattern of the module in each sample. Module membership (MM) refers to the correlation coefficient between genes and module eigengenes, and is used to describe the reliability of a gene belonging to a module. Finally, we calculated the correlation between the modules and the clinical data to identify significant clinical modules.
Gene Ontology (GO) Enrichment Analysis
We used DAVID 6.7 (https://david-d.ncifcrf.gov/) online tools to perform the GO analysis. DAVID is an online bioinformatics database that includes biological data and analysis tools for users to comprehend biological function information of genes and proteins. We used “adjusted P < 0.002” as the threshold value to identify the enriched GO terms.
Identification and Validation of Hub Genes
The intramodule connectivity of a gene is equal to the sum of the degree of correlation between this gene and other genes in that module. The top 30 genes with the highest intramodule connectivity were selected as hub genes. Next, we used the Oncomine database (https://www.oncomine.org/resource/main.html) to verify the expression, and the Kaplan-Meier plotter website (http://kmplot.com/analysis) for verification of the survival analysis to ensure the reliability of the results.
Acquisition of Human BRCA Samples
BRCA tissue and paired adjacent tissue samples were obtained from patients who underwent breast surgery at Zhongnan Hospital of Wuhan University. All specimens were collected after obtaining informed consent by the patients. The samples were immediately stored in liquid nitrogen for further experiments. The Ethics Committee of Zhongnan Hospital of Wuhan University (Wuhan, China) approved the use of these samples for total RNA isolation and quantitative reverse transcription-polymerase chain reaction (qRT-PCR) analysis. This study included 40 pairs of samples and the clinical information of the patients is shown in Supplementary Table 1.
Cell Culture
The experimental BRCA cell line (MCF-7) was obtained from the American Type Culture Collection (ATCC). Dulbecco’s modified Eagle’s medium (Gibco, Australia) supplemented with 10% fetal bovine serum (Gibco, Australia) was used for the culture of MCF-7 cells. All cells were cultured in a humidified environment consisting of 95% air and 5% CO2 at 37°C.
siRNA Sequence and Transfection
The siRNA sequences were: siRNA# FAM171A1:5ʹ- GCUUGAGAUAGAAAGA CUACA-3ʹ; siRNA# NDFIP1: 5ʹ- GGAUACAAAUGAAGCUUAAUU-3ʹ; siRNA# SKP1: 5ʹ- GGAAAGACUAC UCAAGUUAAG-3ʹ; siRNA#REEP5: 5ʹ- GCAGUU AGUUAGUUAGUUACU-3ʹ. According to the instructions provided by the manufacturer, siRNA using the Lipofectamine RNAiMAX reagent (13,778,100, Invitrogen) was transfected into MCF-7 cells for further experiments. Supplementary Figure 2 illustrates the efficiency of the siRNA knockdown. The knockdown efficiency of the four siRNAs is around 90%.
Total RNA Extraction and qPCR Analysis
RNeasy plus mini kits (74,134, Qiagen) and 2 × SYBR Master Mix (TOYOBO, Japan) were used to extract total RNA according to the protocol provided by the manufacturer. qRT-PCR was conducted in triplicate. GAPDH was used as internal control, and the 2−ΔΔCt values were normalized to its levels. The primer sequences for qPCR used in this study are shown in Supplementary Table 2.
Proliferation Analysis
MCF7 cells were transfected into 6-well plates with siRNA-FAM171A1/siRNA-NDFIP1/siRNA-SKP1/siRNA-REEP5 or siControl. After 24h following transfection, cells were washed with PBS and counted. Firstly, 3000 cells were seeded in each well of 96-well plates. The Cell Counting Kit-8 (CCK8) was used to measure the relative cell viability on the indicated time points. Subsequently, we plated cells at a low density into 6-well plates to form clones. After 2 weeks, we used crystal violet to stain the colonies and the number of clones in each plate was counted.
Gene Set Enrichment Analysis (GSEA)
According to the median gene expression, BRCA samples were divided into high- and low- expression groups. Gene set enrichment analysis (GSEA) was performed via the GSEA software (GSEA version 4.0.3). The c2.cp.kegg.v6.2.symbols.gmt gene set was selected as the reference gene set. The top five most important Kyoto Encyclopedia of Genes and Genomes (KEGG) pathways were screened (FDR <0.05).
Results
Weighted Co-Expression Network Construction and Identification of Key Modules
The gene expression matrix of GSE25066 was obtained (12,548 genes) after data preprocessing. Subsequently, we selected genes with variances greater than all quartiles of variance for further analysis (3137 genes). In addition, after excluding patients with incomplete clinical information, clinical data were extracted (483 samples). We used the Pearson’s correlation coefficient to cluster the samples in GSE25066. After removing outliers, we drew a sample clustering tree (Figure 2). We set the soft threshold to 10 (R 2 = 0.98) to construct a scale-free network. Next, we built the adjacency matrix and constructed the topological overlap matrix (Figure 3). Finally, nine modules were identified based on average hierarchical clustering and dynamic tree clipping (Figure 4A). The blue module was highly related to pathological grades; thus this module was selected as a clinically important module for further analysis (Figure 4B).
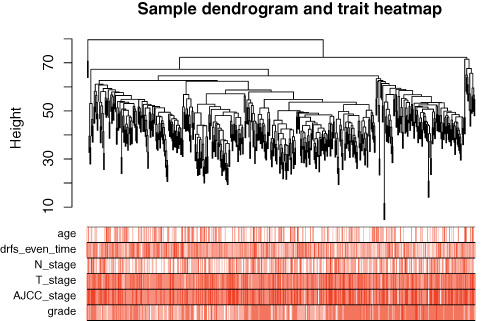 |
Figure 2 Clustering dendrogram of 483 samples. |
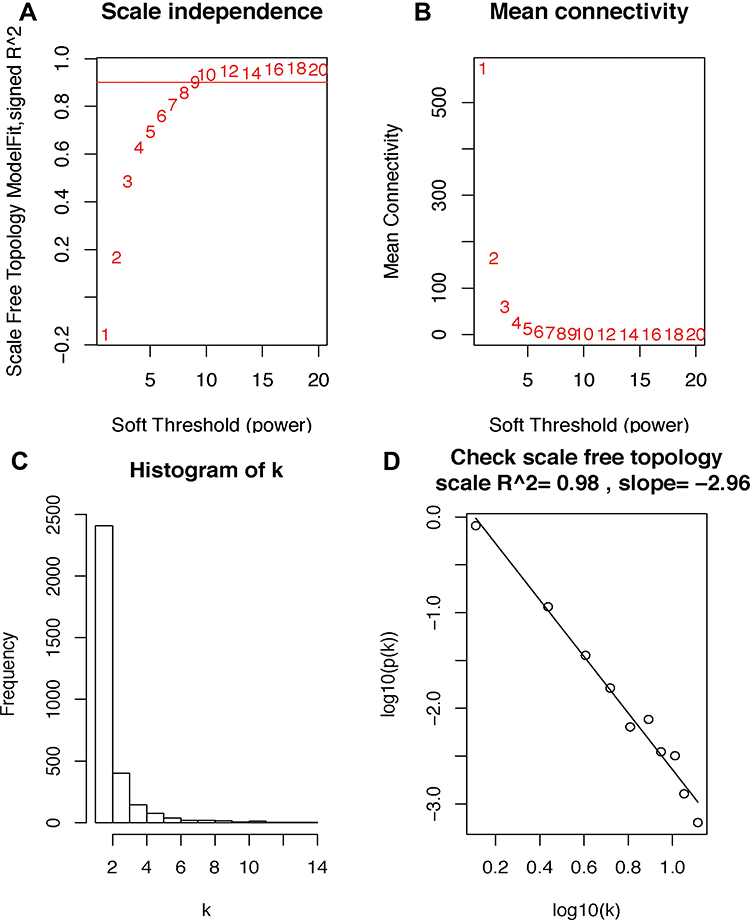 |
Figure 3 Determination of soft-threshold power in the WGCNA. (A) Analysis of the scale-free index for various soft-threshold powers (β). (B) Analysis of the mean connectivity for various soft-threshold powers. (C and D) Checking the scale free topology when β = 10. The x-axis demonstrates the logarithm of whole network connectivity, while the y-axis shows the logarithm of the corresponding frequency distribution. On this plot, the distribution approximately follows an approximately straight line, termed approximately scale-free topology. Abbreviation: WGCNA, weighted gene co-expression network analysis. |
 |
Figure 4 Identification of modules associated with the clinical traits of breast cancer. (A) Dendrogram of all differentially expressed genes clustered based on the measurement of dissimilarity (1-TOM). The color band shows the results obtained from the automatic single-block analysis. (B) Heatmap of the correlation between the module eigengenes and clinical traits of BRCA. We selected the MEblue-grade block for subsequent analysis. Abbreviations: TOM, topological overlap matrix; ME, module eigengene. |
Enrichment Analysis of GO
Through GO analysis (including cell component (CC), biological process (BP) and molecular function (MF)) analysis in the DAVID 6.7 online tools database, we performed an enrichment analysis of the biological significance on the blue module. Specifically, the BP group genes were mainly associated with oxidation reduction, developmental maturation, response to hormone stimulus, reproductive structure development, response to estrogen stimulus, development of primary sexual characteristics, sex differentiation, epithelial cell development, and negative regulation of apoptosis. In addition, CC group genes were mainly enriched in the endoplasmic reticulum, endosomal part, endosome membrane, Golgi apparatus, and organelle membrane. Moreover, MF group genes were significantly related to NAD or NADH binding, inorganic cation transmembrane transporter activity, and hydrogen ion transmembrane transporter activity (Figure 5A and B).
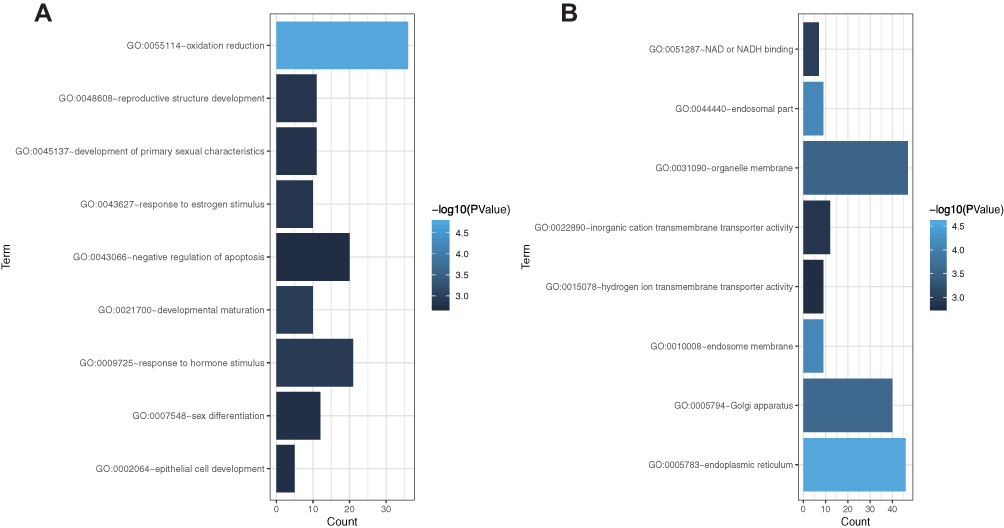 |
Figure 5 Gene ontology enrichment analysis of the blue module genes. (A) Biological process analysis. (B) Cellular component analysis and molecular function analysis. The x-axis shows the number of genes enriched in this term. The term color represents the degree of enrichment. Darker colors represent higher enrichment. |
Identification and Validation of Hub Genes
We screened the top 30 intramodule connectivity genes as candidate prognosis genes. Following verification using the Kaplan-Meier plotter and Oncomine database, we selected seven genes as hub genes (FAM171A1, NDFIP1, SKP1, CIRBP, REEP5, BTF3, TBC1D9). These genes were both positively related to the overall survival (OS) and relapse free survival (RFS) (Figure 6). Similarly, these genes were also down-regulated in tumor samples in the Oncomine database (Figure 7). More convincingly, the qRT-PCR results of clinical samples showed that compared with adjacent tissues four genes (FAM171A1, NDFIP1, SKP1, REEP5) were significantly downregulated in BRCA patients (P<0.0001) (Figure 8A). However, the other three genes (CIRBP, BTF3, TBC1D9) did not show significant trends. We further observed the immunohistochemistry of these four genes in normal and tumor samples through the Human Protein Atlas database (HPA). The analysis revealed that the expression of these genes in normal samples was higher than that recorded in tumor samples (Supplementary Figure 1). Cell viability CCK8 and clone formation analysis also confirmed that knockdown of FAM171A1, NDFIP1, SKP1, and REEP5 can significantly enhanced cell proliferation (Figure 8B and C). In summary, we selected FAM171A1, NDFIP1, SKP1, and REEP5 as our potential biomarkers and clinical treatment targets. Analysis of the TCGA database further demonstrated that NDFIP1, SKP1, and REEP5 were upregulated in the luminal subtypes and downregulated in triple-negative breast cancer (TNBC). However, FAM171A1 exhibited the opposite trend (Supplementary Figure 3). Furthermore, the expression levels of FAM171A1, SKP1, and REEP5 in samples without lymph node metastasis were higher than those measured in metastatic samples. We hypothesized that these three genes may be related to BRCA metastasis (Supplementary Figure 4).
 |
Figure 6 Overall survival (OS) and relapse-free survival (RFS) analysis of the seven hub genes in breast cancer based on the Kaplan-Meier plotter. The patients were stratified into high- and low- expression groups according to the median expression. (A) FAM171A1. (B) NDFIP1. (C) SKP1. (D) CIRBP. (E) REEP5. (F) BTF3. (G) TBC1D9. These genes were positively related to OS and RFS. |
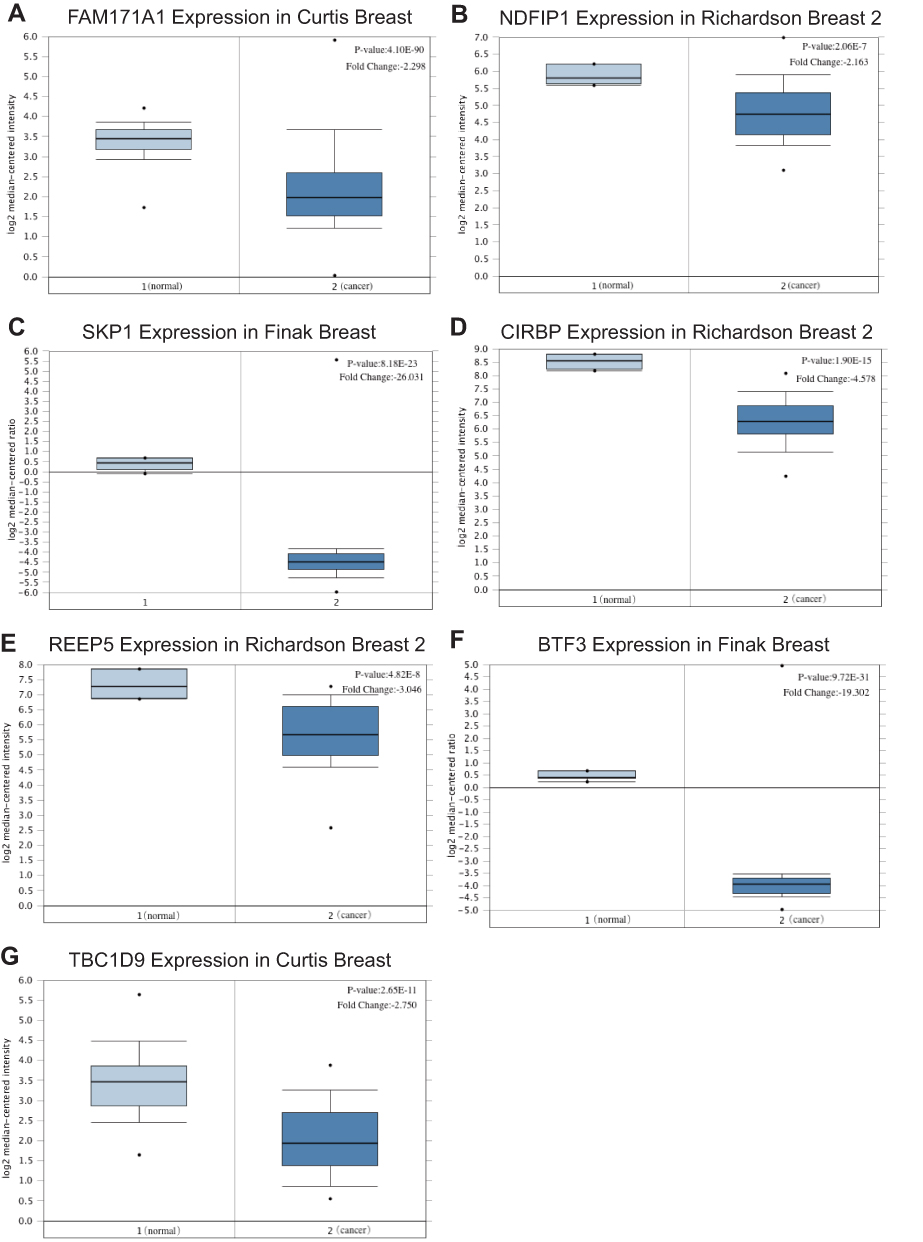 |
Figure 7 Relative mRNA expression of seven hub genes in breast cancer tissues and paracancerous tissues based on Oncomine (left column: normal samples; right column: tumor samples). (A) FAM171A1. (B) NDFIP1. (C) SKP1. (D) CIRBP. (E) REEP5. (F) BTF3. (G) TBC1D9. The expression of these genes was also down-regulated in tumor samples. |
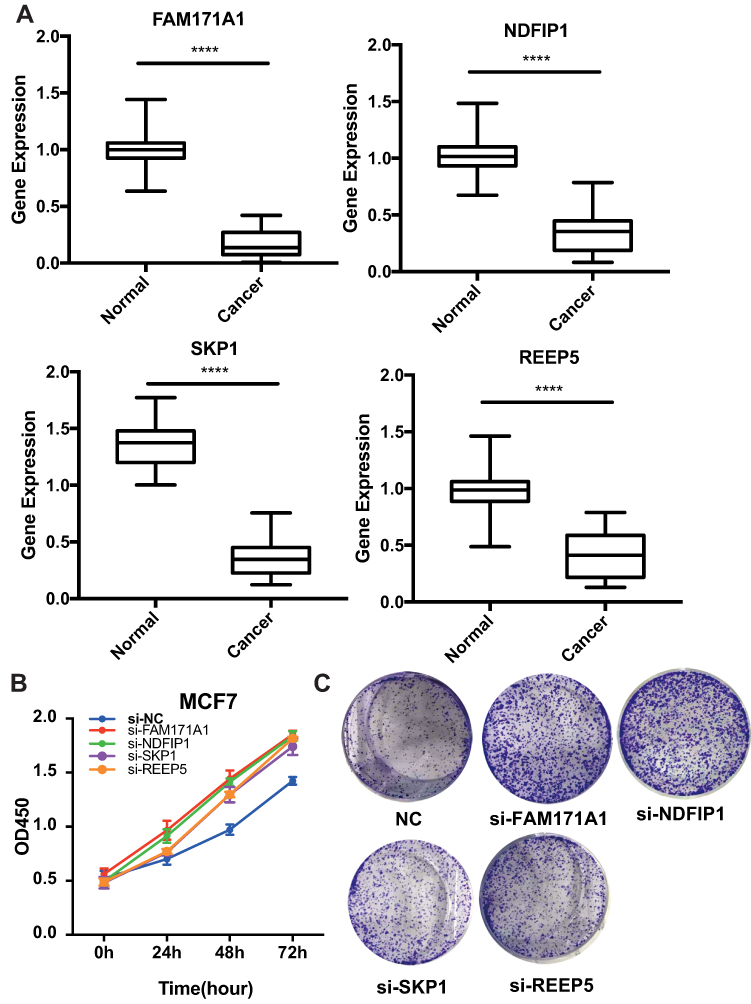 |
Figure 8 Experimental validation of FAM171A1, NADFIP1, SKP1, and REEP5. (A) Relative mRNA expression in breast cancer tissues and paracancerous tissues. The expression of these four hub genes was down-regulated in breast cancer samples. ****P <0.0001, used to compare the expression difference of each gene in cancer and adjacent samples. (B) Cell Counting Kit-8 (CCK8) assay. (C) Clone formation assay. Knockdown of these four hub genes can promote the proliferation of breast cancer. |
Gene Set Enrichment Analysis
Finally, we used GSEA to more accurately determine the function of the hub genes. The top five KEGG pathways are shown according to the cut-off criteria. FAM171A1 was enriched with fructose and mannose metabolism, nucleotide excision repair, oxidative phosphorylation, peroxisome, and protein export. NDFIP1 was enriched with bladder cancer, DNA replication, homologous recombination, proteasome, and RNA polymerase. SKP1 was enriched with chemokine signaling pathway, glycosphingolipid biosynthesis lacto and neolacto series, JAK-STAT signaling pathway, non-small cell lung cancer, and cytokine receptor interaction. REEP5 was enriched with cell cycle, JAK-STST signaling pathway, pathways in cancer, small cell lung cancer, and cytokine receptor interaction (Figure 9).
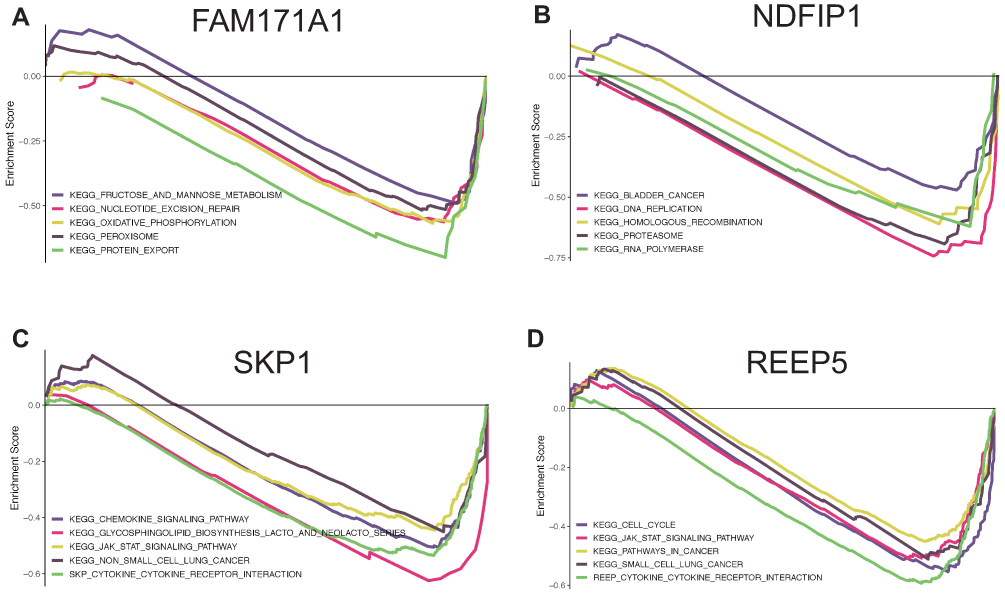 |
Figure 9 Gene set enrichment analysis for FAM171A1, NDFIP1, SKP1 and REEP5. The top five pathways enriched in low-expression group are shown. (A) FAM171A1. (B) NDFIP1. (C) SKP1. (D) REEP5. |
Discussion
BRCA is the most common type of cancer among women worldwide.14 Screening for BRCA can significantly reduce BRCA-related mortality.15 However, the treatment of advanced BRCA treatment remains limited due to the lack of specific molecular targets. In this study, we screened hub genes from the GEO dataset through WGCNA analysis, and verified the results using the Oncomine and Kaplan–Meier plotter databases. Finally, after further verification in vitro, FAM171A1, NDFIP1, SKP1, and REEP5 were identified as molecular targets for the prognosis of BRCA.
FAM171A1 (the family with sequence similarity 171, member A1 protein) is a 890-amino acid glycoprotein linked to the development of chemical resistance by cancer cells.16 Studies showed that FAM171A1 can regulate the cell morphology and invasive growth potential of tumor cells by regulating the dynamics of the actin cytoskeleton.17 The study conducted by Sanawar et al demonstrated that miR590-5p is a target of ERα in ER receptor-positive BRCA. ERα can stimulate the expression of miR590-5p, and subsequently down-regulated that of FAM171A1 in ERα-positive BRCA cells.18,19
NDFIP1 (Nedd4 family-interacting protein 1) is a transmembrane protein which binds to the Nedd4 family E3 ubiquitin ligase.20 It is necessary for maintaining the stability and function of T cells. Knockdown of NDFIP1 in T cells promotes glycolysis and mammalian target of rapamycin complex 1 (mTORC1) signal transduction, and causes auto-inflammatory diseases.21 Howitt et al showed that NDFIP1 knockdown results in the loss of phosphatase and tensin homolog nuclear compartmentalization, promotes cell proliferation, and alters the cell cycle.22,23 Peng er al proved that NDFIP1 is a direct target of miR-155, which promotes the proliferation and migration of uveal melanoma cells by inhibiting the expression of NDFIP1.24
SKP1 (The S phase kinase-associated protein 1) encodes 163 amino acids,25 and is distributed both in the nucleus and cytoplasm.26 It plays an important role in regulating the cell cycle,27 cytokinesis,28 and tumorigenesis.29 Piva et al used Cul1 deletion mutant transgenic mice (Cul1-N252), characterized by loss of SKP1 function. The Cul1-N252 showed various physiological defects, such as hypoplasia of lymphoid organs, formation of multinucleated cells, and impaired chromosome segregation.30 Taken together, this evidence indicates that SKP1 plays a crucial role in maintaining genetic stability.
REEP5 (Receptor accessory protein 5) is a key molecule that maintains the normal function of the cardiac sarcoplasmic reticulum function.31,32 Chiamvimonvat et al demonstrated that REEP5, as the only REEP family protein enriched in the heart, is a new regulator of cardiac excitation-contraction coupling.33 Studies have also shown that the expression of REEP5 is down-regulated in lung and gastric cancer.34,35 REEP5 knockdown affected CXCR1 and down-regulated the IL-8-mediated cellular response, which significantly reduced the growth and invasion of lung cancer cells.34
In this study, we constructed a co-expression network via WGCNA, and identified modules with significant clinical features. We selected the top 30 intramodule connectivity genes as candidate prognostic genes. Following verification using Kaplan-Meier plotter and Oncomine database, we selected seven genes as hub genes (FAM171A1, NDFIP1, SKP1, CIRBP, REEP5, BTF3, and TBC1D9). The qRT-PCR results of clinical samples showed that the expression of 4 genes (FAM171A1, NDFIP1, SKP1, REEP5) was significantly down-regulated in BRCA tissues compared with normal adjacent tissues (P<0.0001). Furthermore, immunohistochemistry showed that the expression of these genes in normal samples was higher than that observed in tumor samples from HPA datasets. Cell viability CCK8 and clone formation analysis also confirmed that knockdown of FAM171A1, NDFIP1, SKP1, and REEP5 can significantly enhanced cell proliferation. The above results indicate that these four hub genes may act as tumor suppressor genes in BRCA. The WGCNA clustering criterion has biological significance. The unique soft threshold algorithm of WGCNA makes the gene expression network tend to be distributed with free-scale network, and the result has higher reliability. However, when tissues are contaminated, the WGCNA results may be biased or invalid. Therefore, we performed experiments in vitro on hub genes to further ensure their accuracy.
Conclusion
In summary, we identified and verified four hub genes (FAM171A1, NDFIP1, SKP1, and REEP5) as prognostic BRCA markers and potentially effective indicators for the clinical and targeted therapy of BRCA.
Abbreviations
BRCA, breast cancer; WGCNA, weighted gene co-expression network analysis; TCGA, The Cancer Genome Atlas; GEO, Gene Expression Omnibus; GO, Gene set enrichment analysis; GSEA, Gene set enrichment analysis.
Ethics Approval
This article has been reviewed and approved by the ethics board of Zhongnan Hospital of Wuhan University.
Acknowledgments
The principal authors are very grateful for the data support provided by the TCGA and GEO databases.
Author Contributions
ZT and WH contributed equally to this work. All authors contributed towards data analysis, drafting and critically revising the paper, gave final approval of the version to be published, and agreed to be accountable for all aspects of the work.
Disclosure
The authors declare no conflicts of interest.
References
1. Torre LA, Bray F, Siegel RL, Ferlay J, Lortet-Tieulent J, Jemal A. Global cancer statistics, 2012. CA Cancer J Clin. 2015;65:87–108.
2. Li T, Mello-Thoms C, Brennan PC. Descriptive epidemiology of breast cancer in China: incidence, mortality, survival and prevalence. Breast Cancer Res Treat. 2016;159:395–406. doi:10.1007/s10549-016-3947-0
3. McDonald ES, Clark AS, Tchou J, Zhang P, Freedman GM. Clinical diagnosis and management of breast cancer. J Nucl Med. 2016;57 Suppl 1:9s–16s. doi:10.2967/jnumed.115.157834
4. Bianchini G, Balko JM, Mayer IA, Sanders ME, Gianni L. Triple-negative breast cancer: challenges and opportunities of a heterogeneous disease. Nat Rev Clin Oncol. 2016;13:674–690. doi:10.1038/nrclinonc.2016.66
5. Prat A, Pineda E, Adamo B, et al. Clinical implications of the intrinsic molecular subtypes of breast cancer. Breast. 2015;24 Suppl 2:S26–S35. doi:10.1016/j.breast.2015.07.008
6. Ghoncheh M, Pournamdar Z, Salehiniya H. Incidence and mortality and epidemiology of breast cancer in the world. Asian Pac J Cancer Prev. 2016;17:43–46. doi:10.7314/APJCP.2016.17.S3.43
7. Winters S, Martin C, Murphy D, Shokar NK. Breast cancer epidemiology, prevention, and screening. Prog Mol Biol Transl Sci. 2017;151:1–32.
8. Brewer HR, Jones ME, Schoemaker MJ, Ashworth A, Swerdlow AJ. Family history and risk of breast cancer: an analysis accounting for family structure. Breast Cancer Res Treat. 2017;165:193–200. doi:10.1007/s10549-017-4325-2
9. Streff H, Profato J, Ye Y, et al. Cancer incidence in first- and second-degree relatives of BRCA1 and BRCA2 mutation carriers. Oncologist. 2016;21:869–874. doi:10.1634/theoncologist.2015-0354
10. Stanwell P, Gluch L. Lipid and metabolite deregulation in BRCA1 and BRCA2 genetic mutations. Radiology. 2015;277:614–615. doi:10.1148/radiol.2015151153
11. Yoshida K, Miki Y. Role of BRCA1 and BRCA2 as regulators of DNA repair, transcription, and cell cycle in response to DNA damage. Cancer Sci. 2004;95:866–871. doi:10.1111/j.1349-7006.2004.tb02195.x
12. Ossa CA, Torres D. Founder and recurrent mutations in BRCA1 and BRCA2 Genes in Latin American Countries: state of the art and literature review. Oncologist. 2016;21:832–839. doi:10.1634/theoncologist.2015-0416
13. Langfelder P, Horvath S. WGCNA: an R package for weighted correlation network analysis. BMC Bioinformatics. 2008;9:559. doi:10.1186/1471-2105-9-559
14. Youlden DR, Cramb SM, Dunn NA, Muller JM, Pyke CM, Baade PD. The descriptive epidemiology of female breast cancer: an international comparison of screening, incidence, survival and mortality. Cancer Epidemiol. 2012;36:237–248. doi:10.1016/j.canep.2012.02.007
15. Smith RA. The value of modern mammography screening in the control of breast cancer: understanding the underpinnings of the current debates. Cancer Epidemiol Biomarkers Prev. 2014;23:1139–1146. doi:10.1158/1055-9965.EPI-13-0946
16. Calcagno AM, Salcido CD, Gillet JP, et al. Prolonged drug selection of breast cancer cells and enrichment of cancer stem cell characteristics. J Natl Cancer Inst. 2010;102:1637–1652. doi:10.1093/jnci/djq361
17. Rasila T, Saavalainen O, Attalla H, et al. Astroprincin (FAM171A1, C10orf38): a regulator of human cell shape and invasive growth. Am J Pathol. 2019;189:177–189. doi:10.1016/j.ajpath.2018.09.006
18. Sanawar R, Mohan Dan V, Santhoshkumar TR, Kumar R, Pillai MR. Estrogen receptor-alpha regulation of microRNA-590 targets FAM171A1-a modifier of breast cancer invasiveness. Oncogenesis. 2019;8:5. doi:10.1038/s41389-018-0113-z
19. Bao C, Lu Y, Chen J, et al. Exploring specific prognostic biomarkers in triple-negative breast cancer. Cell Death Dis. 2019;10:807. doi:10.1038/s41419-019-2043-x
20. Harvey KF, Shearwin-Whyatt LM, Fotia A, Parton RG, Kumar S. N4WBP5, a potential target for ubiquitination by the Nedd4 family of proteins, is a novel Golgi-associated protein. J Biol Chem. 2002;277:9307–9317. doi:10.1074/jbc.M110443200
21. Layman AAK, Deng G, O’Leary CE, et al. Ndfip1 restricts mTORC1 signalling and glycolysis in regulatory T cells to prevent autoinflammatory disease. Nat Commun. 2017;8:15677. doi:10.1038/ncomms15677
22. Howitt J, Lackovic J, Low LH, et al. Ndfip1 regulates nuclear Pten import in vivo to promote neuronal survival following cerebral ischemia. J Cell Biol. 2012;196:29–36. doi:10.1083/jcb.201105009
23. Howitt J, Low LH, Putz U, et al. Ndfip1 represses cell proliferation by controlling Pten localization and signaling specificity. J Mol Cell Biol. 2015;7:119–131. doi:10.1093/jmcb/mjv020
24. Peng J, Liu H, Liu C. MiR-155 promotes uveal melanoma cell proliferation and invasion by regulating NDFIP1 expression. Technol Cancer Res Treat. 2017;16:1160–1167. doi:10.1177/1533034617737923
25. Zhang H, Kobayashi R, Galaktionov K, Beach D. p19Skp1 and p45Skp2 are essential elements of the cyclin A-CDK2 S phase kinase. Cell. 1995;82:915–925. doi:10.1016/0092-8674(95)90271-6
26. Gstaiger M, Marti A, Krek W. Association of human SCF(SKP2) subunit p19(SKP1) with interphase centrosomes and mitotic spindle poles. Exp Cell Res. 1999;247:554–562. doi:10.1006/excr.1999.4386
27. Bai C, Sen P, Hofmann K, et al. SKP1 connects cell cycle regulators to the ubiquitin proteolysis machinery through a novel motif, the F-box. Cell. 1996;86:263–274. doi:10.1016/S0092-8674(00)80098-7
28. Connelly C, Hieter P. Budding yeast SKP1 encodes an evolutionarily conserved kinetochore protein required for cell cycle progression. Cell. 1996;86:275–285. doi:10.1016/S0092-8674(00)80099-9
29. Liu YQ, Wang XL, Cheng X, et al. Skp1 in lung cancer: clinical significance and therapeutic efficacy of its small molecule inhibitors. Oncotarget. 2015;6:34953–34967. doi:10.18632/oncotarget.5547
30. Piva R, Liu J, Chiarle R, Podda A, Pagano M, Inghirami G. In vivo interference with Skp1 function leads to genetic instability and neoplastic transformation. Mol Cell Biol. 2002;22:8375–8387. doi:10.1128/MCB.22.23.8375-8387.2002
31. Yao L, Xie D, Geng L, et al. REEP5 (Receptor Accessory Protein 5) acts as a sarcoplasmic reticulum membrane sculptor to modulate cardiac function. J Am Heart Assoc. 2018;7. doi:10.1161/JAHA.117.007205
32. Li M, Rao M, Chen K, Zhou J, Song J. Selection of reference genes for gene expression studies in heart failure for left and right ventricles. Gene. 2017;620:30–35. doi:10.1016/j.gene.2017.04.006
33. Chiamvimonvat N, Song LS. LRRC10 (Leucine-Rich Repeat Containing Protein 10) and REEP5 (Receptor Accessory Protein 5) as novel regulators of cardiac excitation-contraction coupling structure and function. J Am Heart Assoc. 2018;7. doi:10.1161/JAHA.117.008260
34. Park CR, You DJ, Park S, et al. The accessory proteins REEP5 and REEP6 refine CXCR1-mediated cellular responses and lung cancer progression. Sci Rep. 2016;6:39041. doi:10.1038/srep39041
35. Tsai PC, Huang SW, Tsai HL, et al. The association between DNA copy number aberrations at chromosome 5q22 and gastric cancer. PLoS One. 2014;9:e106624. doi:10.1371/journal.pone.0106624
 © 2020 The Author(s). This work is published and licensed by Dove Medical Press Limited. The full terms of this license are available at https://www.dovepress.com/terms.php and incorporate the Creative Commons Attribution - Non Commercial (unported, v3.0) License.
By accessing the work you hereby accept the Terms. Non-commercial uses of the work are permitted without any further permission from Dove Medical Press Limited, provided the work is properly attributed. For permission for commercial use of this work, please see paragraphs 4.2 and 5 of our Terms.
© 2020 The Author(s). This work is published and licensed by Dove Medical Press Limited. The full terms of this license are available at https://www.dovepress.com/terms.php and incorporate the Creative Commons Attribution - Non Commercial (unported, v3.0) License.
By accessing the work you hereby accept the Terms. Non-commercial uses of the work are permitted without any further permission from Dove Medical Press Limited, provided the work is properly attributed. For permission for commercial use of this work, please see paragraphs 4.2 and 5 of our Terms.