")
Back to Journals » Journal of Inflammation Research » Volume 15
Identification of Immune-Related Key Genes as Potential Diagnostic Biomarkers of Sepsis in Children
Authors Wang H , Huang J, Yi W, Li J, He N, Kang L, He Z, Chen C
Received 4 February 2022
Accepted for publication 5 April 2022
Published 14 April 2022 Volume 2022:15 Pages 2441—2459
DOI https://doi.org/10.2147/JIR.S359908
Checked for plagiarism Yes
Review by Single anonymous peer review
Peer reviewer comments 3
Editor who approved publication: Professor Ning Quan
Huabin Wang,1,2,* Junbin Huang,1,2,* Wenfang Yi,1,2,* Jiahong Li,3 Nannan He,4 Liangliang Kang,4 Zhijie He,5 Chun Chen1,2
1Division of Hematology/Oncology, Department of Pediatrics, the Seventh Affiliated Hospital of Sun Yat-Sen University, Shenzhen, 518107, People’s Republic of China; 2Department of Pediatric Intensive Care Unit, the Seventh Affiliated Hospital of Sun Yat-Sen University, Shenzhen, 518107, People’s Republic of China; 3Department of Neonatal Intensive Care Unit, the Seventh Affiliated Hospital of Sun Yat-Sen University, Shenzhen, 518107, People’s Republic of China; 4Department of Pediatric Intensive Care Unit, Shenzhen Children’s Hospital, Shenzhen, 518000, People’s Republic of China; 5Department of Intensive Care Unit, Sun Yat-Sen Memorial Hospital of Sun Yat-Sen University, Guangzhou, 510000, People’s Republic of China
*These authors contributed equally to this work
Correspondence: Zhijie He; Chun Chen, Email [email protected]; [email protected]
Objective: The pathogenesis of sepsis is still unclear due to its complexity, especially in children. This study aimed to analyse the immune microenvironment and regulatory networks related to sepsis in children at the molecular level and to identify key immune-related genes to provide a new basis for the early diagnosis of sepsis.
Methods: The GSE145227 and GSE26440 datasets were downloaded from the Gene Expression Omnibus. The analyses included differentially expressed genes (DEGs), functional enrichment, immune cell infiltration, the competing endogenous RNA (ceRNA) interaction network, weighted gene coexpression network analysis (WGCNA), protein–protein interaction (PPI) network, key gene screening, correlation of sepsis molecular subtypes/immune infiltration with key gene expression, the diagnostic capabilities of key genes, and networks describing the interaction of key genes with transcription factors and small-molecule compounds. Finally, real-time quantitative PCR (RT–qPCR) was performed to verify the expression of key genes.
Results: A total of 236 immune-related DEGs, most of which were enriched in immune-related biological functions, were found. Further analysis of immune cell infiltration showed that M0 macrophages and neutrophils infiltrated more in the sepsis group, while fewer activated memory CD4+ T cells, resting memory CD4+ T cells, and CD8+ T cells did. The interaction network of ceRNA was successfully constructed. Six key genes (FYN, FBL, ATM, WDR75, FOXO1 and ITK) were identified by WGCNA and PPI analysis. We found strong associations between key genes and constructed septic molecular subtypes or immune cell infiltration. Receiver operating characteristic analysis showed that the area under the curve values of the key genes for diagnosis were all greater than 0.84. Subsequently, we successfully constructed an interaction network of key genes and transcription factors/small-molecule compounds. Finally, the key genes in the samples were verified by RT–qPCR.
Conclusion: Our results offer new insights into the pathogenesis of sepsis in children and provide new potential diagnostic biomarkers for the disease.
Keywords: sepsis in children, key immune-related genes, transcriptomic analysis, Gene Expression Omnibus, diagnostic biomarkers
Introduction
Sepsis is a common critical condition in paediatric emergency departments and inpatient wards. This condition is caused by an imbalance in the body’s response to infection and can lead to microcirculation disorders, immune dysfunction, and tissue and organ dysfunction, seriously threatening the life and health of children.1 In the treatment of sepsis in children, in addition to early fluid resuscitation, anti-infection efforts, symptomatic treatment, and prevention and treatment of complications,2,3 some new practices have been used to improve the prognosis of the disease, including continuous blood purification4 and extracorporeal membrane oxygenation.5 Nevertheless, the mortality rate is still very high in children with sepsis. Of the 7.6 million children worldwide under 5 years of age who died each year, 64% died of sepsis or septic shock caused by severe infection.6,7 This percentage is mainly due to the lack of effective treatment targets and effective diagnosis and treatment strategies that make it possible to interrupt the occurrence of the disease and prevent deterioration due to the disease in a timely manner. Therefore, early identification and timely treatment of sepsis in children are critical in improving the outcome of this disease.
The immune inflammatory response plays an important role in the development of sepsis. In the early stage of the disease, a variety of immune cells (such as neutrophils and macrophages) and the inflammatory mediators and cytokines that they release can induce excessive inflammatory responses.8 In contrast, in the late stage of the disease, the body is dominated by vigorous and long-lasting immunosuppression. This immune-mediated damage, which is thought to be an important cause of functional damage to organs, is regulated by a complex molecular network throughout the body.9,10 Exploring the immune-response link that plays an important role in the development and progression of sepsis in children, elucidating the relevant functions and mechanisms of the cells and molecules involved, identifying the key nodes and the methods that can be used to intervene in their function, and improving the success rate of sepsis treatment by intervening at these nodes will be of great significance in clinical practice.
As science and technology advance and the methods used to obtain big data mature, relevant analysis based on bioinformatic technology has given us a certain understanding of the mechanism of the occurrence and development of sepsis. The identification of the molecular characteristics and biochemical pathways operating in sepsis patients has stimulated researchers’ interest in new biomarkers.11 To the best of our knowledge, no previous study has reported the immune-related molecular characteristics of sepsis in children. In this study, the Gene Expression Omnibus (GEO) was used to analyse and explore immune-related key genes, their interactions, and their regulatory networks in childhood sepsis. Our findings provide new ideas that support in-depth analyses of the mechanisms through which sepsis occurs and progresses in children and that may aid in the identification of new diagnostic biomarkers.
Materials and Methods
Downloading and Preprocessing of Data
The reliable original microarray results (CEL format) of the transcriptome datasets GSE14522712 and GSE2644013 of children with sepsis and normal control blood samples were downloaded from the GEO database, and the annotation files of GPL23178 (OElncRNAs520855F, Affymetrix Human Custom lncRNA Array) and GPL570 (HG-U133_Plus_2, Affymetrix Human Genome U133 Plus 2.0 Array) were downloaded. The GSE145227 dataset contains the transcriptome data (mRNA + lncRNA) of 10 septic children and 12 normal controls. All the samples in GSE145227 came from the same hospital. The GSE26440 dataset contains the transcriptome data (mRNA) of 98 septic children and 32 normal controls. The GSE26440 samples came from 11 hospitals. The baseline characteristics of the recruited datasets are shown in Table 1. The original data in the CEL format were read using the oligo package,14 and background correction and data normalization were performed to obtain expression matrices for analysis.
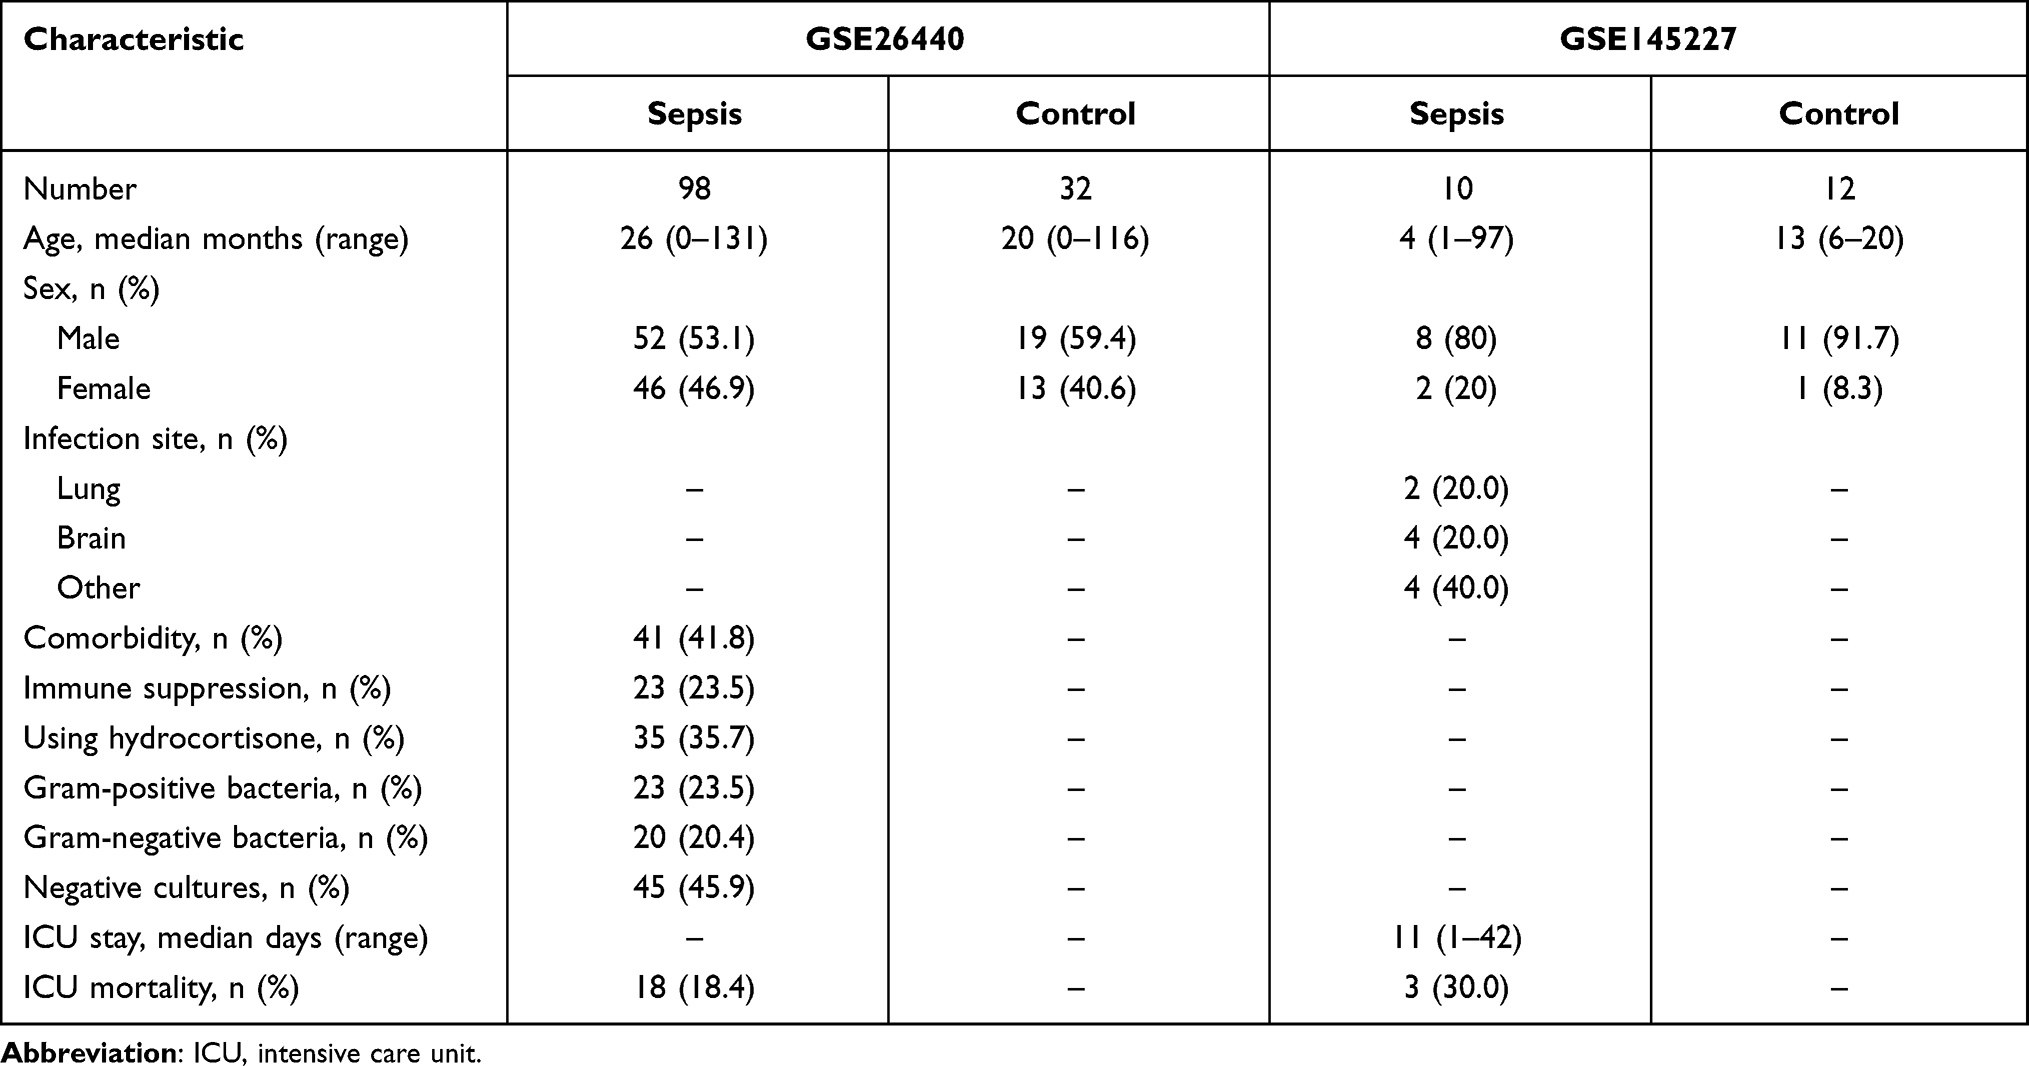 |
Table 1 Baseline Characteristics of the Recruited Datasets |
Differential Analysis and Immune-Related Genes
We used the limma package15 of the R language to identify differentially expressed genes (DEGs) in the sepsis and the control groups using a linear model. The selection criteria of DEGs were an adjusted P value < 0.05 and |log2 fold change (FC)| > 1. The volcano map and heatmap of DEGs were plotted using the ggplot2 package and the pheatmap package.
The immune-related gene list was obtained from the Immunology Database and Analysis Portal (ImmPort) of InnateDB website (https://www.innatedb.com/)16 and contained approximately 4815 immune-related genes. The immune genes among the DEGs of the two datasets were extracted by referencing this list, and the DEGs the two datasets shared in common were displayed in a Venn diagram.
Functional Enrichment Analysis
Gene Ontology (GO) functional annotation is a common method for large-scale gene functional enrichment studies. The three top-level categories are biological process, molecular function, and cellular component. The Kyoto Encyclopedia of Genes and Genomes (KEGG) is a widely used database that stores information about genomes, biological pathways, diseases, and drugs. The clusterProfiler package17 was used to perform GO and KEGG enrichment analysis on DEGs.18,19 An adjusted P < 0.05 was considered statistically significant. Gene set enrichment analysis (GSEA) is an analytical method applied to microarray data from whole-genome expression profiling and compares expressed genes with predefined gene sets. GSEA was performed on the gene expression matrix using the clusterProfiler package, “c2.cp.kegg.v7.4.symbols.gmt” was selected as the reference gene set, and P < 0.05 indicated significant enrichment. Gene set variation analysis (GSVA) is a nonparametric, unsupervised algorithm that can calculate the enrichment score of a specific gene set in each sample. The GSVA package20 was used to detail the DEG matrix, “c2.cp.kegg.v7.4.symbols.gmt” was selected as the reference gene set, and the kcdf parameter was set to a Gaussian distribution. Finally, the limma package was used for differential pathway screening, in which P < 0.05 was set as the screening threshold.
Immune Cell Infiltration Analysis
We calculated the immune cell infiltration of the samples based on the gene expression matrix through the CIBERSORTx (https://cibersortx.stanford.edu/) online analysis tool21 and filtered the samples for P < 0.05. Then, the degree of immune cell infiltration was compared between the septic children and the normal controls. For immune cells with significant differences between groups, we used Pearson correlation analysis to evaluate the correlation between the degrees of infiltration of different immune cells.
Analysis of Differentially Expressed lncRNAs (DElncRNAs) and Construction of the ceRNA Interaction Network
We used the limma package of the R language to identify DElncRNAs characterizing the sepsis and the control groups of the GSE145227 dataset. The DElncRNA screening criteria were an adjusted P < 0.05 and |log2 FC| > 1. The miRNAs that bound to these DElncRNAs according to the miRNA binding profile database (miRcode) (http://www.mircode.org/) were extracted and stored. The screened miRNAs were also compared against the miRNA target gene databases TargetScan, miRDB, and miRTarBase (http://www.targetscan.org/vert_72/; http://mirdb.org/; https://mirtarbase.cuhk.edu.cn/~miRTarBase/miRTarBase_2019/php/index.php) to extract the target genes predicted by all three databases. The target genes of the three databases were saved. Finally, we compared the obtained target genes with the DEGs obtained from the two GEO datasets and obtained the intersection of the lncRNA–miRNA–mRNA interactions, which were imported into the regulatory network visualization software CytoScape to draw a ceRNA network related to sepsis in children.22
Weighted Gene Co-Expression Network Analysis (WGCNA) and Immune-Related Gene Screening
WGCNA was performed on the DEGs selected from the two GEO datasets using the WGCNA package.23 Pearson’s correlation coefficients between genes were calculated, and an appropriately soft threshold β was selected to make the constructed network more in line with the standard of a scale-free network. The gene network was constructed using the one-step method, and the adjacency matrix was converted to a topological overlap matrix. Hierarchical clustering was used to generate a hierarchical clustering tree of genes, and alpha-beta pruning was used to divide the gene modules. Finally, the correlation between the obtained modules and the differentially infiltrated immune cells was analysed, the modules with significant correlation with the immune phenotype were selected, and the gene set in the module was obtained for subsequent analysis.
Protein–Protein Interaction (PPI) Network Analysis and Immune-Related Key Genes Screening
We used the Search Tool for the Retrieval of Interacting Genes (STRING, http://www.string-db.org/, Version: 11.0) online tool24 and Cytoscape software to construct the PPI network of DEGs from the immune-related genes obtained by WGCNA. The cytoHubba plug-in was used to screen the hub genes. In each dataset, the genes that scored in the top 20 by the maximum correlation criteria algorithm were that dataset’s hub genes. The intersection of the two datasets made up the key genes for sepsis.
Construction of Sepsis Molecular Subtypes and Correlation Analysis of Molecular Subtypes/Immune Cell Infiltration and Key Genes
Consensus clustering is an algorithm that can be used to identify cluster members (such as microarray gene expression data) and their numbers in a dataset and is usually used to determine the optimal number of clusters k. Consensus clustering validates the rationality of clustering through resampling-based methods. Its main purpose is to assess the stability of clustering. Consensus clustering and molecular subtype screening of GSE26640 were performed using the ConsensusClusterPlus package.25 In short, hierarchical clustering is used, with 1000 iterations (80% of the samples are used each time). The optimal number of clusters was determined by the clustering score of the cumulative distribution function (CDF) curve, and the relative change in the area under the CDF curve was evaluated. The reliability of the consensus clusters was then verified using principal component analysis (PCA) clustering graphs. Pearson correlation analysis was used to evaluate the correlations between key genes and molecular subtypes/immune cell infiltration.
Analysis of Key Gene Diagnostic Capability
The diagnostic ability of key genes for sepsis was evaluated. We first compared the expression levels of key genes in the disease group and the normal control group and then used receiver operating characteristic (ROC) curves to analyse the ability of key genes to distinguish between the sepsis and normal control groups.
Analysis of Key Gene–Transcription Factor Interaction Network, and Key Gene–Small-Molecule Compound Interaction Network
We further analysed the transcription factor network and small-molecule compound action network with the key genes. Six key genes was uploaded to NetworkAnalyst (https://www.networkanalyst.ca/)26 and was analysed using the transcription factor–gene interactions and protein-chemical interactions modules. The reference databases were the transcription factor database ENCODE (http://cistrome.org/BETA/) and Protein-chemical Interactions (http://ctdbase.org/). The analysed network was visualized in Cytoscape.
Analysis of Key Genes Real-Time Quantitative PCR (RT-qPCR)
Samples were collected from 12 healthy controls and 12 septic patients who were hospitalized in the paediatric department of the Seventh Affiliated Hospital of Sun Yat-Sen University from October 1, 2021 to November 1, 2021. This study was approved by the Ethics Committee of the Seventh Affiliated Hospital of Sun Yat-Sen University. Consent was obtained by the guardians prior to study commencement. Inclusion criteria: 1 month to 14 years of age, meeting the diagnostic criteria for sepsis, and hospitalization longer than 24 hours. Exclusion criteria: malignant tumours, autoimmune diseases, and use of immunosuppressive agents in the past 2 weeks.
Peripheral-blood samples were collected from all patients within 24 hours of admission, and peripheral-blood mononuclear cells (PBMCs) were immediately isolated using human lymphocyte separation medium (Dayou, 7111011). Total RNA was extracted from PBMCs using TRIzol reagent (Invitrogen, 15596026) according to the manufacturer’s instructions. Reverse transcription was performed using Evo M-MLV reverse transcription reagent master mix (Accurate Biology Co., Ltd., AG11706). RT-qPCR was performed using the SYBR Green Pro Taq HS premixed qPCR reagent kit (Accurate Biology Co., Ltd., AG11701). GAPDH was the reference gene. The relative expression levels were calculated using the 2-ΔΔCT method. Supplementary table 1 lists the primer pairs used in the experiment.
Statistical Analysis
All data calculations and statistical analyses were performed using R programming software (https://www.r-project.org/, version 4.1.0). The Benjamini–Hochberg method was used for multiple test correction, and false discovery rate correction for multiple tests was performed to reduce this rate. Continuous variables were compared between groups by Student’s t-test when normally distributed and the Mann–Whitney U-test when skewed. The pROC package was used to draw the ROC curve for the sepsis diagnostic ability of the key genes, and the area under the curve (AUC) was calculated to evaluate the discriminant ability of the model. All P values were two-sided tests, and P < 0.05 was considered statistically significant.
Results
Data Preprocessing and DEGs Screening
The data processing of this study is depicted in Figure 1. We normalized the original gene expression microarray files of the two datasets GSE145227 and GSE26440 to obtain the gene expression matrix for analysis. The average gene expression box plot and PCA plot of the dataset processing results are shown in Supplementary figure 1. After preprocessing and quality control of the data, we used the limma package of the R language to select a total of 2339 DEGs from the GSE145227 mRNA expression matrix and a total of 1146 DEGs from the GSE26440 mRNA expression matrix. All these DEGs were displayed in the form of volcano plot and heatmaps (Figure 2A–D). The total number of DEGs shared in the two datasets was 585, which were used as the gene set for subsequent analysis (Figure 2E). Among the DEGs, there were 236 immune-related genes shared by both datasets (Figure 2F).
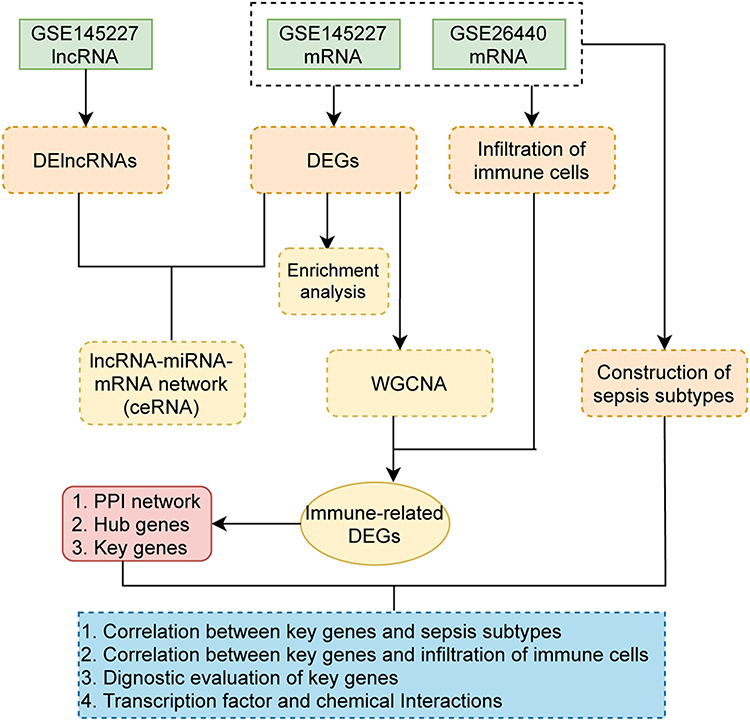 |
Figure 1 Flow chart. Abbreviations: CeRNA, competing endogenous RNA; DEG, differentially expressed genes; DElncRNA, differentially expressed lncRNA; PPI, protein-protein interaction; WGCNA, weighted gene co-expression network analysis. |
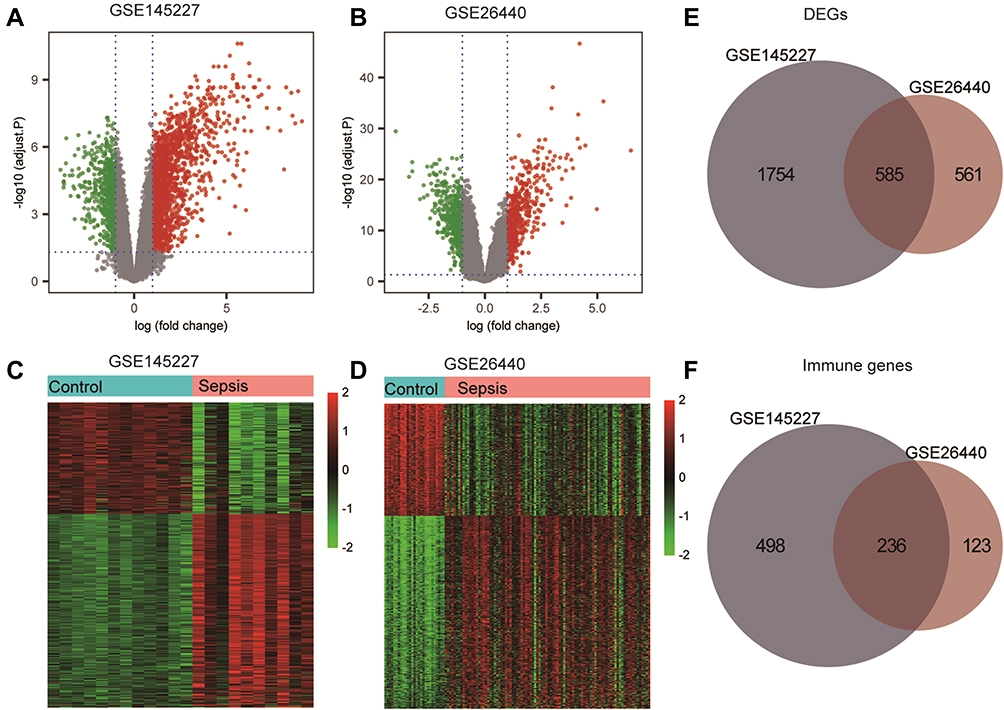 |
Figure 2 Differentially expressed genes (DEGs) analysis and immune-related genes. (A and B) The volcano plot of GSE145227 and GSE26440 expression matrix. (C and D) The heatmap of GSE145227 and GSE26440 expression matrix. (E) Venn diagram of DEGs in GSE145227 and GSE26440. (F) Venn diagram of immune-related genes in DEGs. |
Functional Enrichment Analysis of DEGs
In the enrichment results, we found many immune-related biological functions. KEGG analysis showed that the pathways enriched by DEGs mainly included haematopoietic cell lineage, Th1 and Th2 cell differentiation, PD-L1 expression and the PD-1 checkpoint pathway in cancer, Th17 cell differentiation, and osteoclast differentiation (Figure 3, Supplementary table 2). GO analysis showed that DEGs were mainly associated with neutrophil degranulation, neutrophil activation involved in the immune response, specific granules, tertiary granules, immune receptor activity, and non-membrane spanning protein tyrosine kinase activity (Figure 4, Supplementary table 3). GSEA enriched pathways mainly involve T cell receptor signalling pathways and natural killer cell-mediated cytotoxicity-related pathways (Supplementary figure 2, Supplementary table 4). The results of GSVA analysis are shown in Supplementary figure 3. The DEGs of the two datasets were mainly enriched in pathways involving galactose metabolism, circadian rhythm mammals, one-carbon pool by folate, citrate cycle, and selenoamino acid metabolism.
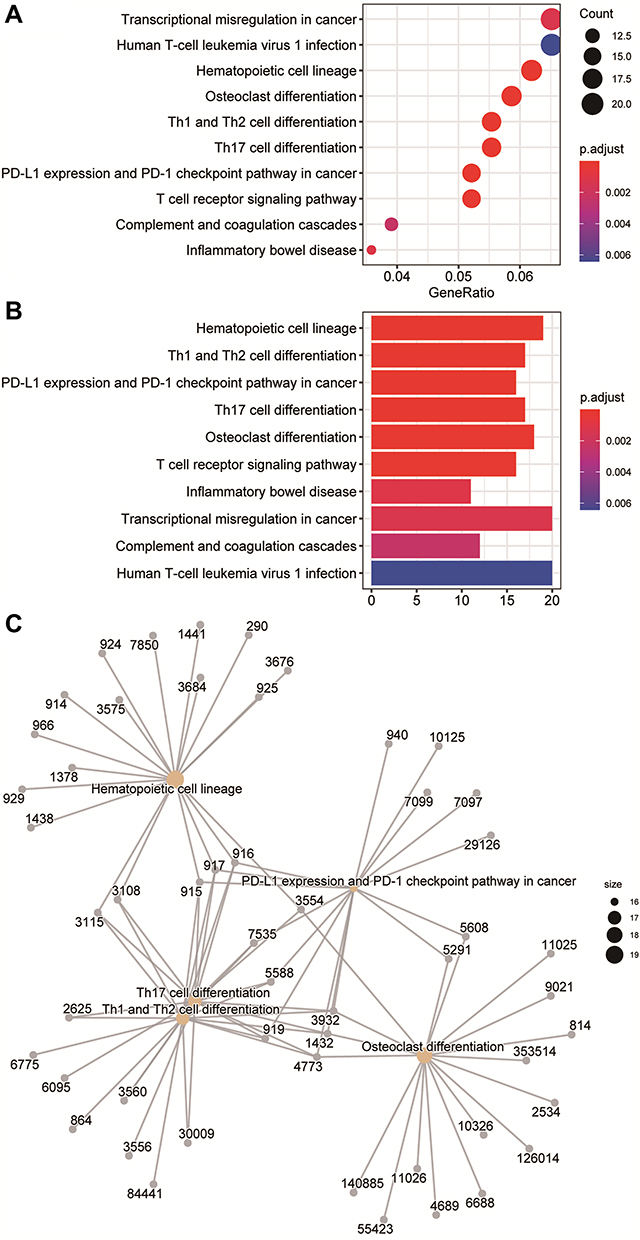 |
Figure 3 Kyoto Encyclopedia of Genes and Genomes (KEGG) pathway enrichment analysis of differentially expressed genes (DEGs). (A) The KEGG analysis of DEGs is displayed in the form of bubble graphs. The closer the colour is to red, the smaller the P is. The larger the bubble is, the more enriched DEGs are in the pathway. (B) The KEGG analysis of DEGs is displayed in the form of bar graphs. The closer the colour is to red, the smaller the P is. The horizontal axis indicates the number of genes enriched in the pathway. (C) Network diagram of the KEGG results. |
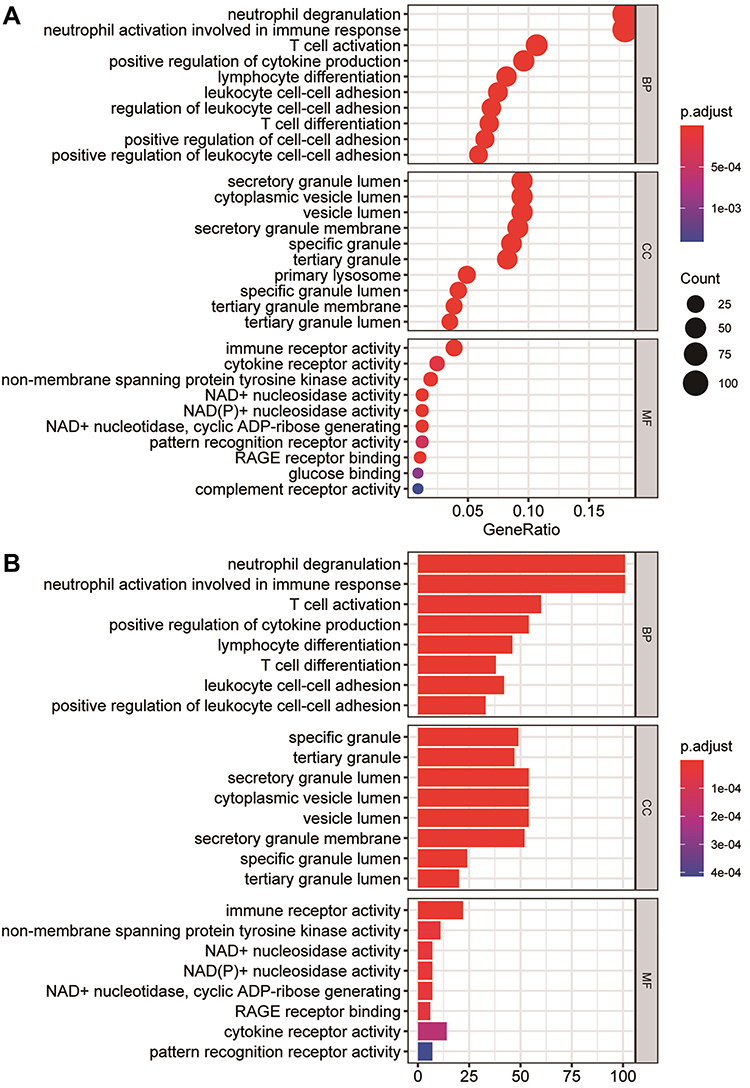 |
Figure 4 Gene Ontology (GO) enrichment analysis of differentially expressed genes (DEGs). (A) The enrichment results of biological process, cellular component, and molecular function in the GO analysis are shown in the form of bubble graphs. The closer the colour is to red, the smaller the P is. The larger the bubble is, the more enriched DEGs are in the pathway. (B) The biological process, cellular component, and molecular function enrichment results of the GO analysis are shown as a bar graph. The closer the colour is to red, the smaller the P is. The horizontal axis represents the number of enriched genes in the pathway. |
Immune Infiltration Analysis
The infiltration of 22 types of immune cells in different groups is shown in Figure 5A–B. A total of five types of immune cells showed significant differences between the two groups. M0 macrophages and neutrophils infiltrated more in the sepsis group, while activated memory CD4+ T cells, resting memory CD4+ T cells, and CD8+ T cells infiltrated less. We calculated the correlations between immune cell types with significant differences in the degree of infiltration between the two groups, and the correlation matrix is shown in Figure 5C–D. The correlation between neutrophils and resting memory CD4+ T cells and the correlation between neutrophils and CD8+ T cells were positive and high. The correlation between neutrophils and M0 macrophages was negative, and the absolute value of the coefficient was large.
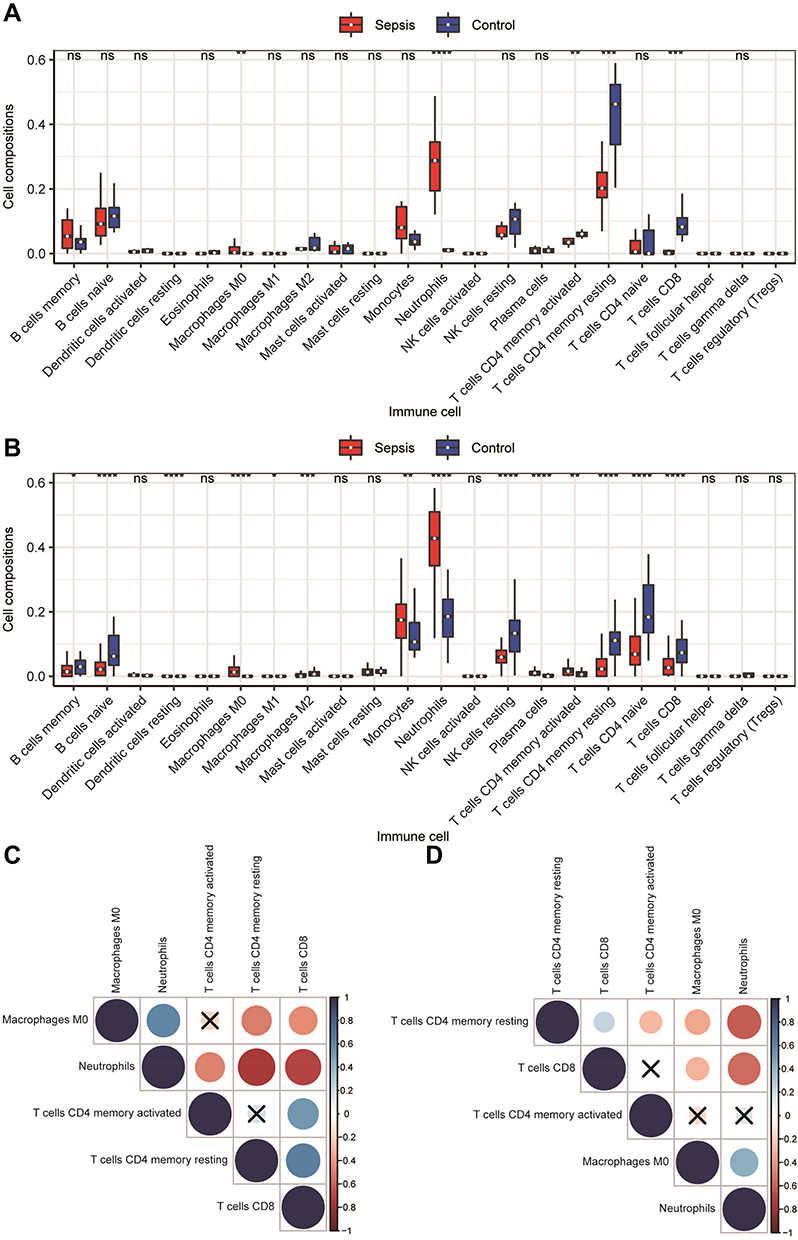 |
Figure 5 Immune cell infiltration analysis. (A and B) Comparison of the degree of immune cell infiltration in the GSE145227 and GSE26440 datasets between the sepsis group and the normal control group. (C and D) The correlation matrix of immune cells with significant differences. Red indicates positive correlation, blue indicates negative correlation, and a darker colour indicates a stronger correlation. The nonsignificant ones are indicated by a black “X”. *P < 0.05, **P < 0.01, ***P < 0.001, ****P < 0.0001. |
CeRNA Interaction Network Analysis
We screened 2219 DElncRNAs from the lncRNA data of the GSE145227 dataset. miRNAs targeting the DElncRNAs were searched through the miRcode database, and then miRNA target mRNAs were searched in the TargetScan, miRDB, and miRTarBase databases. A total of 242 mRNAs shared by the three databases were found. We cross-checked these 242 mRNAs with the 585 selected DEGs and found 10 mRNAs. Finally, we obtained the lncRNA–miRNA–mRNA interaction relationship and imported it into the network visualization software CytoScape to obtain the sepsis-related ceRNA network (Figure 6A and B).
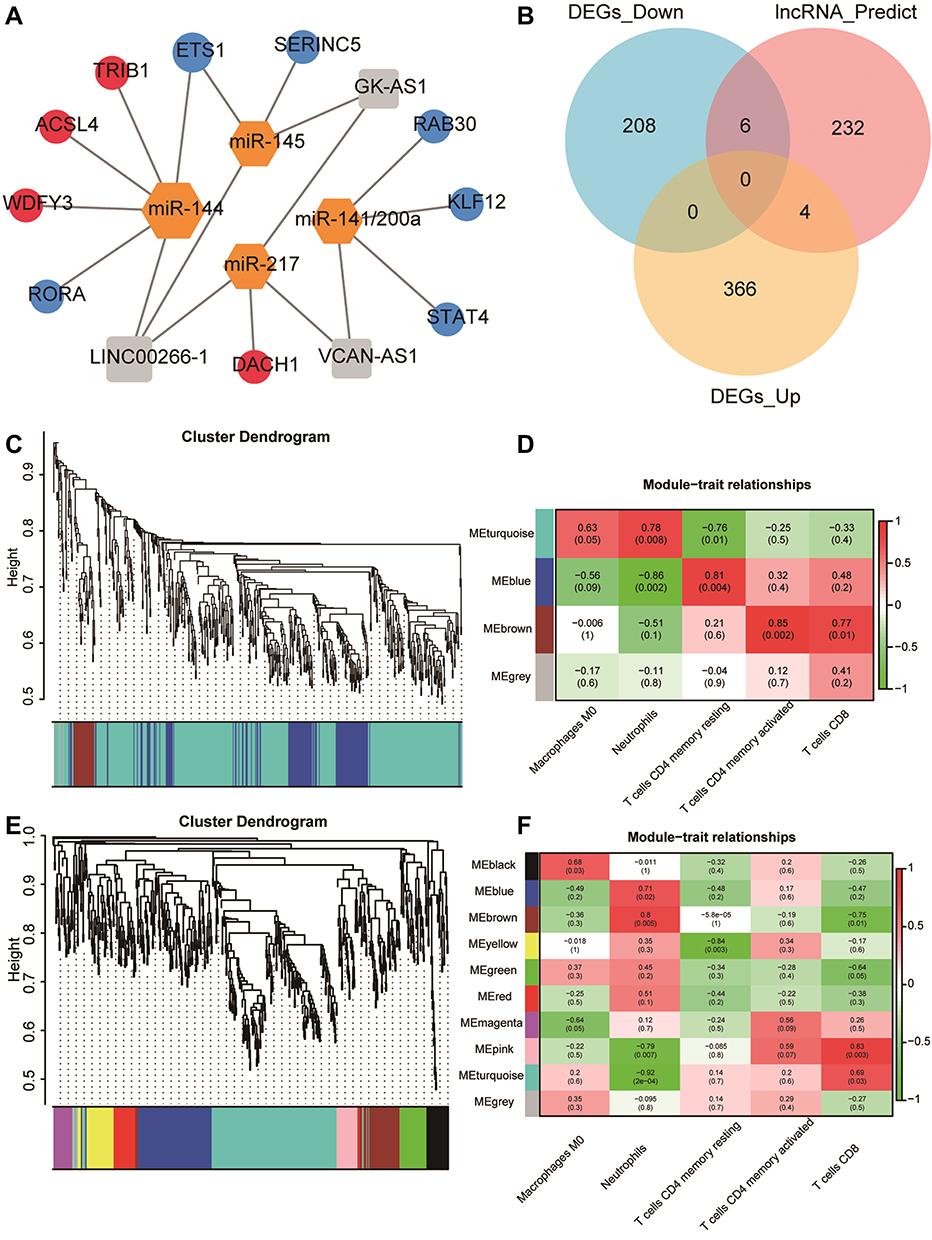 |
Figure 6 Construction of competing endogenous RNA (ceRNA) network and Weighted gene co-expression network analysis (WGCNA). (A) ceRNA network. Orange is the miRNA, grey is the lncRNA, red is the upregulated mRNA, and blue is the downregulated mRNA. (B) Venn diagram of the comparison between the mRNA predicted by the lncRNA and the differentially expressed genes (DEGs). A total of 10 mRNAs that competed with the lncRNA for binding to the miRNA were found. (C and E) WGCNA results of the DEGs of GSE145227 and GSE26440. The cluster analysis of genes is represented by a tree diagram, and the modules of gene classification are represented by different colours. (D and F) Correlation matrix between the module scores obtained by the WGCNA of GSE145227 and GSE26440 and the degree of differential immune cell infiltration. Red indicates a positive correlation, and green indicates a negative correlation. The darker the colour, the higher the degree of correlation. The correlation coefficient and P value are displayed in the grid in the matrix. |
WGCNA
We performed WGCNA on the DEGs selected from the two datasets (Figure 6C–F). Three modules were calculated in GSE145227, and 10 modules were calculated in GSE26440. Among them, two modules of GSE145227 had a strong correlation with immune cell infiltration, and six modules of GSE26440 had a strong correlation with immune cell infiltration. We selected the two immune-related modules with the highest proportions of genes and took these two gene sets as the immune-related DEGs in the subsequent analysis. There were 411 genes in GSE145227 and 197 genes in GSE26440.
PPI Analysis and Screening for Key Genes
We performed PPI analysis of the immune-related genes obtained by WGCNA. The PPI network of GSE145227 has 291 nodes and 593 edges. The PPI network of GSE26440 has 136 nodes and 593 edges (Figure 7). The node sizes of the PPI networks correlate with the numbers of edges that the networks contain. The MAPL14, FYN, HCK, UBC, LCK, and FYN genes had high weights in the PPI networks of both datasets and showed strong correlations with other nodes (genes). Hub gene analysis can identify genes that occupy core regulatory positions in PPI networks. We took the top 20 hub genes in the PPI networks of GSE145227 and GSE26440. The hub genes that appear in both datasets are FYN, FBL, ATM, WDR75, FOXO1, and ITK; these are the key immune-related genes identified in this study.
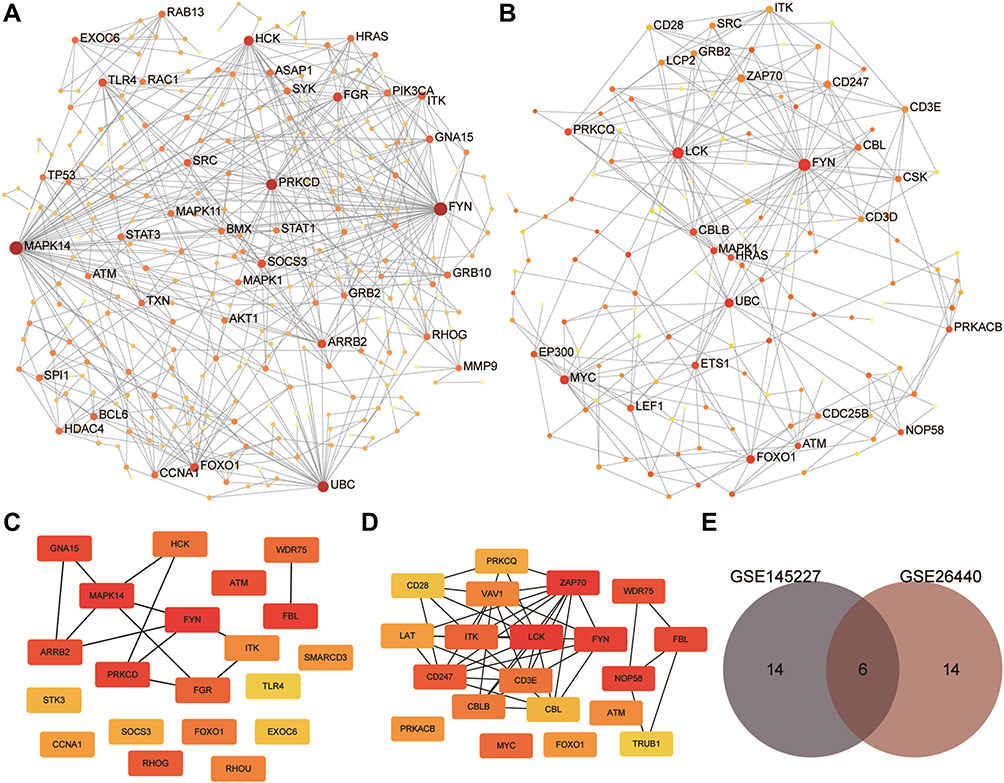 |
Figure 7 Results of protein-protein interaction (PPI) analysis and screening of immune-related key genes. (A and B) The PPI network diagram of GSE145227 and GSE26440. The larger the node, the larger the clustering coefficient, indicating that the gene occupies a more important spot in the network. (C and D) Diagrams of hub genes obtained from GSE145227 and GSE26440. The hub genes were the top 20 differentially expressed genes by the Matthews correlation coefficient score of the maximum correlation algorithm. The darker the colour, the greater the proportion of interactions this gene has in the network. (E) The comparison of the hub genes obtained from the two datasets yielded six key genes. |
Analysis of Sepsis Molecular Subtypes and the Correlation Between Molecular Subtypes and Key Genes
The molecular subtypes of sepsis were determined by unsupervised clustering of 98 sepsis samples in the GSE26440 dataset. The optimal number of clusters was determined by the k value. The ConsensusClusterPlus of R package was used to divide all sepsis samples into k subtypes (k = 2–6). After evaluating the relative change in the area under the CDF curve and the consensus heatmap, we chose a four-cluster solution (k = 5), which did not increase the area under the CDF curve significantly (Supplementary figure 4A–F). The PCA cluster map showed that sepsis samples could be divided into five subtypes (C1, C2, C3, C4, and C5) (Supplementary figure 4G). When we analysed the correlation between different molecular subtypes and key genes, we found that there were strong correlations between certain key genes and different molecular subtypes (Supplementary figure 4H).
Association Between Key Genes and Immune Cell Infiltration
We analysed the correlation between key genes and immune cell infiltration in the two datasets. As shown in Supplementary figure 5, there was a strong correlation between key genes and infiltrating immune cells. Among them, in the GSE145227 dataset, the key genes had the strongest correlation with resting memory CD4+ T cells, and in the GSE26440 dataset, the key genes had the strongest correlation with neutrophils.
Diagnostic Capabilities of Key Genes for Sepsis
We compared the expression levels of key genes in the sepsis and the normal control groups, and the results showed that the expression levels of these six key genes in the sepsis group were lower than those in the control group (P < 0.05). This indicates that the inactivation of these genes is of great significance to the occurrence and progression of sepsis. The AUCs of the diagnostic ROC curves of the key genes in the two datasets were all above 0.84, indicating that the key genes had a good ability to distinguish between children with and without sepsis (Figure 8A–D).
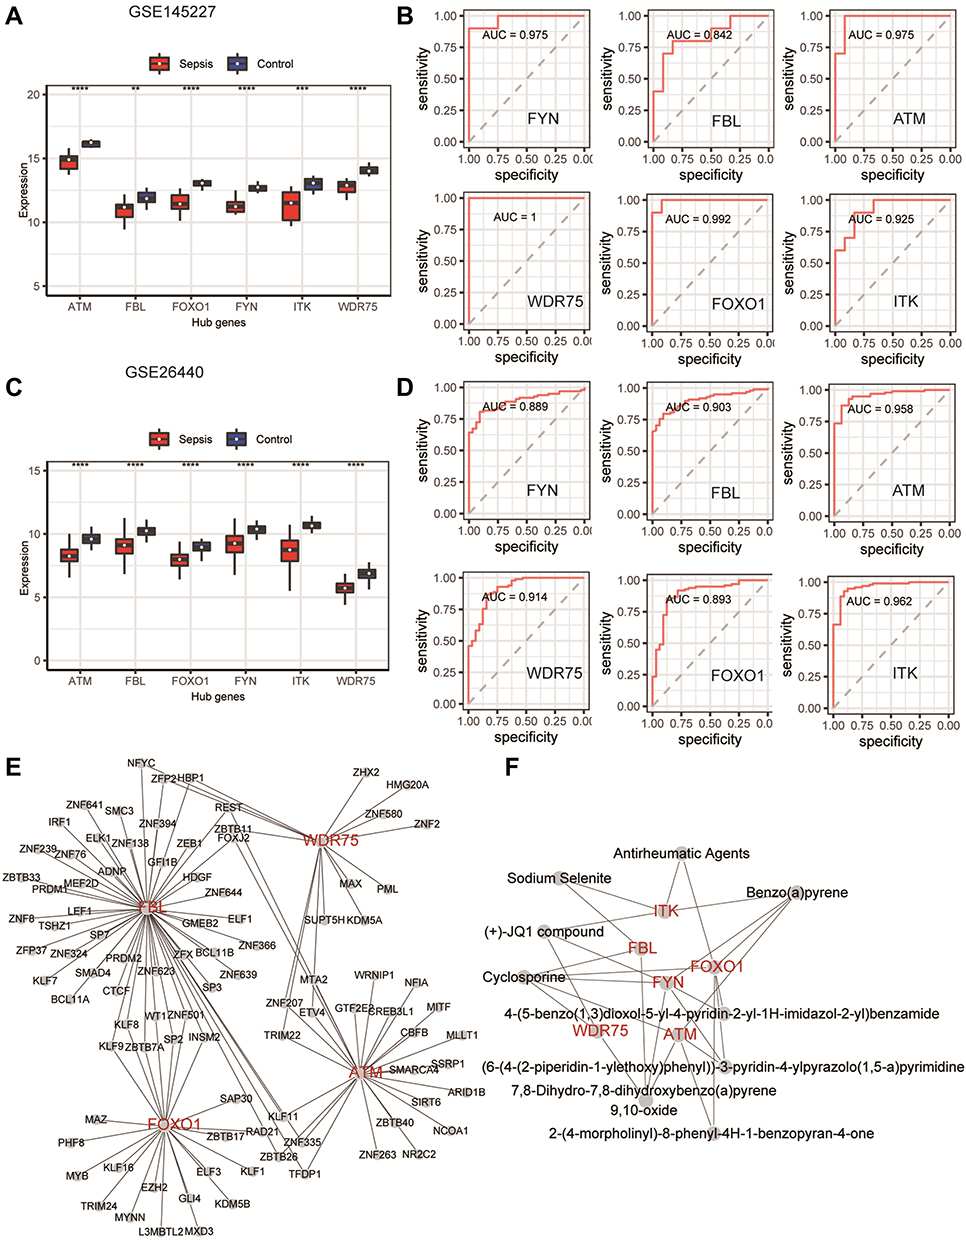 |
Figure 8 The ability of key genes to diagnose sepsis and the interactions between transcription factors and small-molecule compounds. (A and C) Differences in the expression levels of key genes in the GSE145227 and GSE26440 datasets between the sepsis and normal control groups. (B and D) Receiver operating characteristic curves of the ability of the key genes in the GSE145227 and GSE26440 datasets to differentiate between the sepsis and the normal control group. (E) Network diagram of the interaction between key genes and transcription factors. (F) The network diagram of the interaction between key genes and small-molecule compounds. **P < 0.01, ***P < 0.001, ****P < 0.0001. |
Analysis of Transcription Factors and Small-Molecule Compounds
Key gene–transcription factor interaction network analysis showed that ATM, FBL, FOXO1, and WDR75 were associated with 25, 51, 23, and 16 transcription factors, respectively (Figure 8E). Key gene–small-molecule compound interaction network analysis showed that ATM was correlated with cyclosporine and benzo(a)pyrene, FOXO1 was correlated with Antirheumatic agents, benzo(a)pyrene and cyclosporine, FYN was correlated with benzo(a)pyrene, cyclosporine and (+)-JQ1 compound, FBL was correlated with cyclosporine and sodium selenite, WDR75 was correlated with cyclosporine and (+)-JQ1 compound, and ITK was correlated with antirheumatic agents, benzo(a)pyrene, (+)-JQ1 compound, and sodium selenite (Figure 8F).
Verification of Selected Key Genes at the Transcriptional Level
RT-qPCR was used to compare the expression of the six key genes between children with sepsis (n=12) and the control group (n=12). The expression of all six was consistent with the trend observed in the microarray analysis, and the differences between groups were all significant (Figure 9).
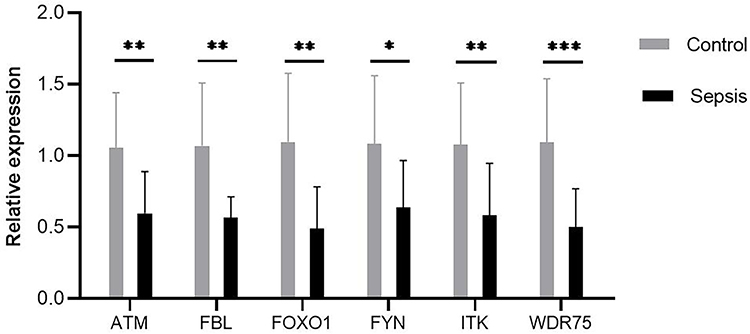 |
Figure 9 Expression of six key genes were compared between controls and septic children by real-time quantitative polymerase chain reaction. Differences between two groups were analyzed using the t-test or Mann–Whitney U-test. *P < 0.05, **P < 0.01, ***P < 0.001. |
Discussion
At present, the pathogenesis of sepsis in children is not clear, and methods for the timely diagnosis of sepsis are lacking. Microarray analysis is an ideal method for use in the comprehensive study of sepsis in children. To explore the molecular mechanism of sepsis in this study, we performed transcriptome analysis of two datasets related to sepsis in children. From the enrichment results, we found many immune-related biological functions. Immune cell infiltration analysis showed that immunosuppression occurred during the course of the disease. Six key genes related to sepsis in children (FYN, FBL, ATM, WDR75, FOXO1, and ITK) were identified through the WGCNA and PPI networks. The networks demonstrate that these genes are associated with immune cell infiltration and with molecular subtypes of sepsis and that they have good specificity for the diagnosis of sepsis in children. These findings will be helpful for the diagnosis of sepsis in children.
Because of the immaturity of the immune system in children, when confronted with pathogen invasion, children’s bodies generate immune responses that are not exactly the same as those in adults. During the acute inflammatory response caused by a severe infection, the human immune system undergoes various changes that trigger a variety of immune responses, resulting in direct effects on the production, function, and survival of immune cells. When the disease progresses to a certain extent, the body develops an immune imbalance that may result in persistent and recurrent infections, which increases the mortality rate of patients with sepsis.27 Alterations in the immune system at the genetic level affect the occurrence and development of sepsis, and they are characterized by rapid response and high sensitivity for the diagnosis of sepsis; these features can reduce the time required for diagnosis. Early diagnosis of sepsis can help physicians provide early treatment, thereby reducing patient mortality.28–30
In our functional enrichment of DEGs, a variety of common immune responses participated in the development and progression of sepsis in children. Interestingly, in the analysis of immune cell infiltration, innate immune cells, such as macrophages and neutrophils, infiltrated more in the sepsis group, while acquired immune cells, such as activated memory CD4+ T cells, resting memory CD4+ T cells, and CD8+ T cells, infiltrated them less. This is consistent with a new viewpoint about sepsis. Immune activation and immunosuppression occur throughout the course of the disease. Dysfunction of the body’s innate immune system and immune suppression of the acquired immune system cause an imbalance and persistence of the inflammatory response and anti-inflammatory response.31 It has been well documented that multiple immune cells undergo numerical and functional abnormalities during sepsis. When infection initially occurs, neutrophils and monocyte-macrophages undergo proliferation and are recruited to the site of infection to exert immune effects upon stimulation by multiple factors. However, the increased number of neutrophils and monocyte-macrophages does not represent an enhanced immune function. With the progress of the disease, the percentage of immature neutrophils increases, and the phagocytic capacity of neutrophils, as well as the production of myeloperoxidase, lactoferrin, and reactive oxygen species, decline significantly.32,33 This illustrates that the functional status of neutrophils can be switched from an initial immune activity enhancement to immunosuppression.
On the other hand, the decrease in the number of T cells confirms the immunosuppressive state of the body in sepsis. If the acquired immune system is severely inhibited, it will lead to recurrent and persistent infections that are difficult to control, leading to multiple-organ failure. Zhao et al found that memory CD4+ T cells played an immune-protective role in mice infected with severe acute respiratory syndrome (SARS) coronavirus or middle East Respiratory Syndrome (MERS) coronavirus and activated the innate immune response and CD8+ T cell immune response by secreting γ-interferon.34 Elimination of memory CD4+ T cells significantly reduced the survival rate of infected mice.
We found six key genes in the development and progression of sepsis in children, namely, FYN, FBL, ATM, WDR75, FOXO1, and ITK. All six key genes were downregulated in children with sepsis by both microarray analysis and our RT-qPCR experiment. All six key genes were also associated with immune cell infiltration and molecular subtypes of sepsis. The six key genes could also be used to distinguish between sepsis and healthy children.
FOXO1 and ITK have been associated with sepsis in previous studies. FOXO1, one of the key downstream targets of the AKT pathway, is an important nuclear transcription factor that regulates various physiological and pathological processes such as cell differentiation, metabolism, and inflammation.35 Crossland et al36 and Castillero et al37 both demonstrated that the FOXO1 signaling pathway was associated with damage to skeletal muscle during sepsis. Wang et al used an enzyme-linked immunosorbent assay to measure the levels of various proteins in the serum of patients with sepsis and found that the expression level of FOXO1 successively increased in the control, sepsis, severe sepsis, and septic shock groups (P < 0.01).38 With the 28-day mortality rate as the study endpoint, FOXO1 expression was also significantly higher in survivors than in nonsurvivors (P < 0.001).
ITK belongs to the Tec tyrosine kinase family and is involved in the regulation of a variety of immune cells, such as the activation of T cells and the differentiation of T helper cells.39 Consistent with the results of our study, ITK has been found in other bioinformatics analyses to act as a key gene in sepsis.40 In a lipopolysaccharide-induced sepsis mouse model, Itk−/− mice exhibited a more severe hypothermic response and more tumour necrosis factor α secretion than control mice. These effects are achieved through regulation of the nuclear factor kappa B, PI3K/Akt, and p38 signaling pathways in mastocytes by Itk.41
In this study, we also found some genes whose functions in sepsis have not been determined, suggesting that they may become biomarkers of sepsis. FYN belongs to the Src family of protein tyrosine kinases and can activate a variety of downstream signaling pathways, such as oxidative stress, endoplasmic reticulum stress, and autophagy dysfunction.42 In immune cells, FYN is involved in the development and activation of T lymphocytes and NK cells.43,44 FYN is also essential for the production and activation of platelets.45 However, the role of FYN in sepsis has not been fully elucidated. In this study, the expression of FYN was decreased in children with sepsis, which may explain the functional inhibition of T cells, NK cells, and platelets in sepsis.
ATM is a major regulator of double-strand DNA break signalling and the stress response. ATM loss can result in mitochondrial dysfunction,46 higher reactive oxygen species levels,47 and DNA oxidative damage.48 ATM expression is also downregulated in osteoarthritis and rheumatoid arthritis.49,50 Figueiredo et al found that the protective effect of anthracyclines on septic mice depended on ATM and found that ATM was a negative regulator of interleukin-1β.51 These data indicate that ATM is an important regulator of the immune response and may provide protection for inflammatory diseases, including sepsis.
Both FBL and WDR75 are nucleolar proteins, and both are involved in the processing of pre-rRNA and the regulation of rRNA transcription.52,53 FBL is highly conserved in its amino acid sequence. It can catalyse the 2′-O-methylation of rRNA and is one of the key components of ribosome formation, thus affecting the translation efficiency of mRNA. In the past, FBL has been widely studied in cancer. Overexpression of FBL can promote tumour progression and is associated with the low survival rate of breast cancer and hepatocellular carcinoma patients.52,54,55 Recently, FBL has been found to be downregulated in some inflammatory diseases. In a meta-analysis of the gene expression profiles of peripheral blood cells in patients with systemic lupus erythematosus, the gene with the greatest downregulation was FBL (ES = −1.8543, P-value = 8.56E-06).56 Tiku et al found that HeLa cells and macrophages showed downregulation of FBL 24 hours after bacterial infection.57 Knockdown of FBL increased the clearance rate of intracellular bacteria, inhibited the secretion of inflammatory cytokines, increased the secretion of anti-inflammatory cytokines, and improved the survival rate of cells. At the same time, the binding of bacteria to intracellular lysosomes increased, which may explain the increase in the intracellular bacterial clearance rate and the increase in the cell survival rate after FBL knockdown.
The understanding of WDR75 is still very limited, and studies on its association with disease are limited to a small number of cancers. Uhlen et al analysed the pathological profile of the human cancer transcriptome and found that abnormally high expression of WDR75 mRNA was an unfavourable prognostic factor for renal carcinoma and hepatic carcinoma.58 In a recent study, researchers knocked down WDR75 in a variety of cultured human cell models. In both tumour cell models and nontumour cell models, this process activated the RPL5/RPL11-dependent stable p53 checkpoint, eventually leading to impaired cell proliferation and senescence.53 In summary, given our bioinformatic analysis, we cannot ignore the association between genes related to the occurrence of ribosomal abnormalities, ie, FBL and WDR75, and the occurrence and progression of sepsis in children.
We constructed a ceRNA interaction network and a key gene-transcription factor interaction network to better understand the complex molecular regulation of sepsis in children. To search for effective treatments of sepsis, we used the protein–chemical interactions module of NetworkAnalyst to screen drugs or small-molecule compounds that may target the key genes of sepsis in children. The role of these drugs or small-molecule compounds in sepsis in children needs to be further explored.
Our study is the first to comprehensively analyse the molecular biological characteristics of septic immunity in children and provides new insights for further understanding the immune mechanism of sepsis. One limitation of our study is that the data were obtained from public databases without validated in our unit, which may have led to a biased interpretation of the results. Second, the validation experiments used a small number of clinical samples. In the future, a regression model can be established using larger numbers of samples and used to further analyse the relationship between key genes and disease diagnosis and prognosis. Third, little is known about the mechanisms of action of the key genes identified in this study, and exploring this will be one of our future research directions. Fourth, due to the lack of clinical information on individual patients in the datasets, it was not possible to fully investigate the clinical characteristics represented by the different subtypes.
Conclusion
We investigated the immune microenvironment and regulatory networks related to sepsis in children at the molecular level using transcriptomic profiling and screened for and validated key immune genes related to sepsis. Our results suggest that FYN, FBL, ATM, WDR75, FOXO1, and ITK act as key immune genes in children with sepsis and that these genes may be directly involved in the pathophysiology of this condition. These findings provide new directions for the investigation of potential diagnostic markers and molecular mechanisms of sepsis in children. Our results, especially the identification of FBL and WDR75 in the context of ribosome biogenesis, may stimulate further studies in this important but still relatively undeveloped field of biomedical research and provide a basis for the use of precision medicine in children with sepsis.
Acknowledgments
This research was supported by the Sanming Project of Medicine in Shenzhen (SZSM202011004), the Natural Science Foundation of Guangdong Province (2020A1515010151), and the Clinical Funding of the Seventh Affiliated Hospital, Sun Yat-sen University (ZSQYLCKYJJ202024).
Disclosure
The authors report no conflicts of interest in this work.
References
1. Singer M, Deutschman CS, Seymour CW, et al. The third international consensus definitions for sepsis and septic shock (Sepsis-3). JAMA. 2016;315(8):801–810. doi:10.1001/jama.2016.0287
2. Nunez Lopez O, Cambiaso-Daniel J, Branski LK, Norbury WB, Herndon DN. Predicting and managing sepsis in burn patients: current perspectives. Ther Clin Risk Manag. 2017;13:1107–1117. doi:10.2147/TCRM.S119938
3. Zimmerman JJ. adjunctive steroid therapy for treatment of pediatric septic shock. Pediatr Clin North Am. 2017;64(5):1133–1146. doi:10.1016/j.pcl.2017.06.010
4. Tian H, Sun T, Hao D, et al. The optimal timing of continuous renal replacement therapy for patients with sepsis-induced acute kidney injury. Int Urol Nephrol. 2014;46(10):2009–2014. doi:10.1007/s11255-014-0747-5
5. Barbaro RP, Peek GJ, MacLaren G. Evaluating when to transport a child for extracorporeal membrane oxygenation. Pediatr Crit Care Med. 2020;21(11):1003–1004. doi:10.1097/PCC.0000000000002542
6. Liu L, Oza S, Hogan D, et al. Global, regional, and national causes of under-5 mortality in 2000-15: an updated systematic analysis with implications for the sustainable development goals. Lancet. 2016;388(10063):3027–3035. doi:10.1016/S0140-6736(16)31593-8
7. Liu L, Johnson HL, Cousens S, et al. Global, regional, and national causes of child mortality: an updated systematic analysis for 2010 with time trends since 2000. Lancet. 2012;379(9832):2151–2161. doi:10.1016/S0140-6736(12)60560-1
8. Angus DC, van der Poll T. van der Poll T. Severe sepsis and septic shock. N Engl J Med. 2013;369(9):840–851. doi:10.1056/NEJMra1208623
9. Kumar V. T cells and their immunometabolism: a novel way to understanding sepsis immunopathogenesis and future therapeutics. Eur J Cell Biol. 2018;97(6):379–392. doi:10.1016/j.ejcb.2018.05.001
10. Boomer JS, Green JM, Hotchkiss RS. The changing immune system in sepsis: is individualized immuno-modulatory therapy the answer? Virulence. 2014;5(1):45–56. doi:10.4161/viru.26516
11. Bandyopadhyay S, Lysak N, Adhikari L, et al. Discovery and validation of urinary molecular signature of early sepsis. Crit Care Explor. 2020;2(10):e0195. doi:10.1097/CCE.0000000000000195
12. Bai Z, Li Y, Li Y, Pan J, Wang J, Fang F. Long noncoding RNA and messenger RNA abnormalities in pediatric sepsis: a preliminary study. BMC Med Genomics. 2020;13(1):36. doi:10.1186/s12920-020-0698-x
13. Wong HR, Cvijanovich N, Lin R, et al. Identification of pediatric septic shock subclasses based on genome-wide expression profiling. BMC Med. 2009;7:34. doi:10.1186/1741-7015-7-34
14. Carvalho BS, Irizarry RA. A framework for oligonucleotide microarray preprocessing. Bioinformatics. 2010;26(19):2363–2367. doi:10.1093/bioinformatics/btq431
15. Ritchie ME, Phipson B, Wu D, et al. limma powers differential expression analyses for RNA-sequencing and microarray studies. Nucleic Acids Res. 2015;43(7):e47. doi:10.1093/nar/gkv007
16. Breuer K, Foroushani AK, Laird MR, et al. InnateDB: systems biology of innate immunity and beyond–recent updates and continuing curation. Nucleic Acids Res. 2013;41:D1228–1233. doi:10.1093/nar/gks1147
17. Yu G, Wang LG, Han Y, He QY. clusterProfiler: an R package for comparing biological themes among gene clusters. OMICS. 2012;16(5):284–287. doi:10.1089/omi.2011.0118
18. Kanehisa M, Goto S. KEGG: Kyoto encyclopedia of genes and genomes. Nucleic Acids Res. 2000;28(1):27–30. doi:10.1093/nar/28.1.27
19. Harris MA, Clark J, Ireland A, et al. The Gene Ontology (GO) database and informatics resource. Nucleic Acids Res. 2004;32:D258–D261. doi:10.1093/nar/gkh036
20. Hanzelmann S, Castelo R, Guinney J. GSVA: gene set variation analysis for microarray and RNA-seq data. BMC Bioinform. 2013;14:7. doi:10.1186/1471-2105-14-7
21. Newman AM, Liu CL, Green MR, et al. Robust enumeration of cell subsets from tissue expression profiles. Nat Methods. 2015;12(5):453–457. doi:10.1038/nmeth.3337
22. Otasek D, Morris JH, Boucas J, Pico AR, Demchak B. Cytoscape automation: empowering workflow-based network analysis. Genome Biol. 2019;20(1):185. doi:10.1186/s13059-019-1758-4
23. Langfelder P, Horvath S. WGCNA: an R package for weighted correlation network analysis. BMC Bioinform. 2008;9:559. doi:10.1186/1471-2105-9-559
24. Szklarczyk D, Gable AL, Lyon D, et al. STRING v11: protein-protein association networks with increased coverage, supporting functional discovery in genome-wide experimental datasets. Nucleic Acids Res. 2019;47(D1):D607–D613. doi:10.1093/nar/gky1131
25. Wilkerson MD, Hayes DN. ConsensusClusterPlus: a class discovery tool with confidence assessments and item tracking. Bioinformatics. 2010;26(12):1572–1573. doi:10.1093/bioinformatics/btq170
26. Xia J, Gill EE, Hancock RE. NetworkAnalyst for statistical, visual and network-based meta-analysis of gene expression data. Nat Protoc. 2015;10(6):823–844. doi:10.1038/nprot.2015.052
27. Bhan C, Dipankar P, Chakraborty P, et al. Role of cellular events in the pathophysiology of sepsis. Inflamm Res. 2016;65(11):853–868. doi:10.1007/s00011-016-0970-x
28. David VL, Ercisli MF, Rogobete AF, et al. Early prediction of sepsis incidence in critically ill patients using specific genetic polymorphisms. Biochem Genet. 2017;55(3):193–203. doi:10.1007/s10528-016-9785-2
29. Grosso S, Pagani L, Tosoni N, et al. A new molecular method for rapid etiological diagnosis of sepsis with improved performance. Future Microbiol. 2021;16:741–751. doi:10.2217/fmb-2020-0154
30. Yokoyama T, Tasaki Y, Inoue N, et al. Rapid molecular diagnosis of parechovirus infection using the reverse transcription loop-mediated isothermal amplification technique. PLoS One. 2021;16(11):e0260348. doi:10.1371/journal.pone.0260348
31. Nedeva C. Inflammation and cell death of the innate and adaptive immune system during sepsis. Biomolecules. 2021;11:7. doi:10.3390/biom11071011
32. Demaret J, Venet F, Friggeri A, et al. Marked alterations of neutrophil functions during sepsis-induced immunosuppression. J Leukoc Biol. 2015;98(6):1081–1090. doi:10.1189/jlb.4A0415-168RR
33. Mare TA, Treacher DF, Shankar-Hari M, et al. The diagnostic and prognostic significance of monitoring blood levels of immature neutrophils in patients with systemic inflammation. Crit Care. 2015;19:57. doi:10.1186/s13054-015-0778-z
34. Zhao J, Zhao J, Mangalam AK, et al. Airway memory CD4(+) T cells mediate protective immunity against emerging respiratory coronaviruses. Immunity. 2016;44(6):1379–1391. doi:10.1016/j.immuni.2016.05.006
35. Wang Y, Zhou Y, Graves DT. FOXO transcription factors: their clinical significance and regulation. Biomed Res Int. 2014;2014:925350. doi:10.1155/2014/925350
36. Crossland H, Constantin-Teodosiu D, Gardiner SM, Constantin D, Greenhaff PL. A potential role for Akt/FOXO signalling in both protein loss and the impairment of muscle carbohydrate oxidation during sepsis in rodent skeletal muscle. J Physiol. 2008;586(22):5589–5600. doi:10.1113/jphysiol.2008.160150
37. Castillero E, Alamdari N, Aversa Z, et al. PPARβ/δ regulates glucocorticoid- and sepsis-induced FOXO1 activation and muscle wasting. PLoS One. 2013;8(3):e59726. doi:10.1371/journal.pone.0059726
38. Wang HJ, Wang BZ, Zhang PJ, et al. Identification of four novel serum protein biomarkers in sepsis patients encoded by target genes of sepsis-related miRNAs. Clin Sci (Lond). 2014;126(12):857–867. doi:10.1042/CS20130301
39. Gomez-Rodriguez J, Kraus ZJ, Schwartzberg PL. Tec family kinases Itk and Rlk / Txk in T lymphocytes: cross-regulation of cytokine production and T-cell fates.. FEBS J. 2011;278(12):1980–1989. doi:10.1111/j.1742-4658.2011.08072.x
40. Kim KS, Jekarl DW, Yoo J, et al. Immune gene expression networks in sepsis: a network biology approach. PLoS One. 2021;16(3):e0247669. doi:10.1371/journal.pone.0247669
41. Huang W, Morales JL, Gozivoda VP, et al. Nonreceptor tyrosine kinases ITK and BTK negatively regulate mast cell proinflammatory responses to lipopolysaccharide. J Allergy Clin Immunol. 2016;137(4):1197–1205. doi:10.1016/j.jaci.2015.08.056
42. Uddin MJ, Dorotea D, Pak ES, Ha H. Fyn kinase: a potential therapeutic target in acute kidney injury. Biomol Ther (Seoul). 2020;28(3):213–221. doi:10.4062/biomolther.2019.214
43. Saito YD, Jensen AR, Salgia R, Posadas EM. Fyn: a novel molecular target in cancer. Cancer. 2010;116(7):1629–1637. doi:10.1002/cncr.24879
44. Gerbec ZJ, Thakar MS, Malarkannan S. The Fyn-ADAP axis: cytotoxicity versus cytokine production in killer cells. Front Immunol. 2015;6:472. doi:10.3389/fimmu.2015.00472
45. Senis YA, Mazharian A, Mori J. Src family kinases: at the forefront of platelet activation. Blood. 2014;124(13):2013–2024. doi:10.1182/blood-2014-01-453134
46. Zhang Y, Lee JH, Paull TT, et al. Mitochondrial redox sensing by the kinase ATM maintains cellular antioxidant capacity. Sci Signal. 2018;11:538. doi:10.1126/scisignal.aaq0702
47. Kamsler A, Daily D, Hochman A, et al. Increased oxidative stress in ataxia telangiectasia evidenced by alterations in redox state of brains from Atm-deficient mice. Cancer Res. 2001;61(5):1849–1854.
48. Lee JH, Paull TT. Cellular functions of the protein kinase ATM and their relevance to human disease. Nat Rev Mol Cell Biol. 2021;22(12):796–814. doi:10.1038/s41580-021-00394-2
49. He Y, Zisan Z, Lu Z, Zheng L, Zhao J. Bergapten alleviates osteoarthritis by regulating the ANP32A/ATM signaling pathway. FEBS Open Bio. 2019;9(6):1144–1152. doi:10.1002/2211-5463.12648
50. Wu H, Zhou X, Wang X, et al. miR-34a in extracellular vesicles from bone marrow mesenchymal stem cells reduces rheumatoid arthritis inflammation via the cyclin I/ATM/ATR/p53 axis. J Cell Mol Med. 2021;25(4):1896–1910. doi:10.1111/jcmm.15857
51. Figueiredo N, Chora A, Raquel H, et al. Anthracyclines induce DNA damage response-mediated protection against severe sepsis. Immunity. 2013;39(5):874–884. doi:10.1016/j.immuni.2013.08.039
52. Shubina MY, Musinova YR, Sheval EV. Proliferation, cancer, and aging-novel functions of the nucleolar methyltransferase fibrillarin? Cell Biol Int. 2018;42(11):1463–1466. doi:10.1002/cbin.11044
53. Moudry P, Chroma K, Bursac S, Volarevic S, Bartek J. RNA-interference screen for p53 regulators unveils a role of WDR75 in ribosome biogenesis. Cell Death Differ. 2021;29:687–696. doi:10.1038/s41418-021-00882-0
54. Marcel V, Ghayad SE, Belin S, et al. p53 acts as a safeguard of translational control by regulating fibrillarin and rRNA methylation in cancer. Cancer Cell. 2013;24(3):318–330. doi:10.1016/j.ccr.2013.08.013
55. Zhang J, Yang G, Li Q, Xie F. Increased fibrillarin expression is associated with tumor progression and an unfavorable prognosis in hepatocellular carcinoma. Oncol Lett. 2021;21(2):92. doi:10.3892/ol.2020.12353
56. Bae SC, Lee YH. Meta-analysis of gene expression profiles of peripheral blood cells in systemic lupus erythematosus. Cell Mol Biol (Noisy-le-Grand). 2018;64(10):40–49. doi:10.14715/cmb/2018.64.10.7
57. Tiku V, Kew C, Mehrotra P, Ganesan R, Robinson N, Antebi A. Nucleolar fibrillarin is an evolutionarily conserved regulator of bacterial pathogen resistance. Nat Commun. 2018;9(1):3607. doi:10.1038/s41467-018-06051-1
58. Uhlen M, Zhang C, Lee S, et al. A pathology atlas of the human cancer transcriptome. Science. 2017;357:6352. doi:10.1126/science.aan2507
 © 2022 The Author(s). This work is published and licensed by Dove Medical Press Limited. The full terms of this license are available at https://www.dovepress.com/terms.php and incorporate the Creative Commons Attribution - Non Commercial (unported, v3.0) License.
By accessing the work you hereby accept the Terms. Non-commercial uses of the work are permitted without any further permission from Dove Medical Press Limited, provided the work is properly attributed. For permission for commercial use of this work, please see paragraphs 4.2 and 5 of our Terms.
© 2022 The Author(s). This work is published and licensed by Dove Medical Press Limited. The full terms of this license are available at https://www.dovepress.com/terms.php and incorporate the Creative Commons Attribution - Non Commercial (unported, v3.0) License.
By accessing the work you hereby accept the Terms. Non-commercial uses of the work are permitted without any further permission from Dove Medical Press Limited, provided the work is properly attributed. For permission for commercial use of this work, please see paragraphs 4.2 and 5 of our Terms.