")
Back to Journals » OncoTargets and Therapy » Volume 10
Identification of hub miRNA biomarkers for bladder cancer by weighted gene coexpression network analysis
Authors Zhao F, Ge YZ , Zhou LH , Xu LW, Xu Z, Ping WW, Wang M, Zhou CC, Wu R, Jia RP
Received 15 July 2017
Accepted for publication 8 October 2017
Published 22 November 2017 Volume 2017:10 Pages 5551—5559
DOI https://doi.org/10.2147/OTT.S146479
Checked for plagiarism Yes
Review by Single anonymous peer review
Peer reviewer comments 2
Editor who approved publication: Dr Carlos E Vigil
Feng Zhao,1,* Yu-Zheng Ge,1,* Liu-Hua Zhou,1 Lu-Wei Xu,1 Zheng Xu,1 Wen-Wen Ping,2 Min Wang,1 Chang-Cheng Zhou,1 Ran Wu,1 Rui-Peng Jia1
1Department of Urology, Nanjing First Hospital, Nanjing Medical University, Nanjing, China; 2Department of Rheumatology, The First Affiliated Hospital of Nanjing Medical University, Nanjing, China
*These authors contributed equally to this work
Abstract: Bladder cancer (BC) is a common urinary system tumor with high aggressiveness, and it results in relatively high mortality due to a lack of precise and suitable biomarkers. In this study, we applied the weighted gene coexpression network analysis method to miRNA expression data from BC patients, and screened for network modules associated with BC progression. Hub miRNAs were selected, followed by functional enrichment analyses of their target genes for the most closely related module. These hub miRNAs were found to be involved in several functional pathways including pathway in cancer, regulation of actin cytoskeleton, PI3K-Akt signaling pathway, mitogen-activated protein kinase (MAPK) signaling pathway, Wnt signaling pathway, proteoglycans in cancer, focal adhesion and p53 signaling pathway via regulating target genes. Finally, their prognostic significance was tested using analyses of overall survival. A few novel prognostic miRNAs were identified based on expression profiles and related survival data. In conclusion, several miRNAs that were critical in BC initiation and progression have been identified in this study. These miRNAs, which may contribute to a comprehensive understanding of the pathogenesis of BC, could serve as potential biomarkers for BC prognosis or as new therapeutic targets.
Keywords: bladder cancer, miRNA expression, functional enrichment analysis, bioinformatics analysis
Introduction
Bladder cancer (BC) is one of the most common malignant cancers of the urinary system and is associated with an annual mortality of over 150,000.1,2 Bladder transitional cell carcinoma accounts for more than 90% of these deaths. Approximately 70%–75% of transitional cell carcinoma cases are non-muscle invasive bladder cancer and the remaining 25%–30% are muscle invasive bladder cancer. Approximately 70% of non-muscle invasive bladder cancer patients ultimately develop relapse within 5 years after undergoing transurethral resection of BC. Meanwhile, muscle invasive bladder cancer is likely to be linked with lethal metastasis at the time of diagnosis.3–5 To date, sensitive and specific markers for the diagnosis and treatment of BC have not been found. Therefore, it is crucial to search for biomarkers to predict the development and prognosis of BC, which can also be used as therapeutic targets.
miRNAs are constituted by a large number of naturally occurring endogenous small non-coding RNAs. miRNAs, with lengths of 22–25 nucleotides, can regulate gene expression through translational inhibition or mRNA cleavage.6 A variety of studies have shown that miRNAs play important regulatory roles in diverse physiologic processes, including cell proliferation, adhesion and migration.7,8 Furthermore, miRNAs can target multiple mRNAs, which render them powerful regulators. For example, loss of miR-218, a tumor suppressor, enhances cancer cell migration and invasion in prostate cancer through direct regulation of LIM and SH3 domain protein 1 (LASP1), which is a member of the nebulin family of actin-binding proteins.9 miR-124/miR-9 plays a role in the neuronal development of primary neurons by regulating glycoprotein M6A (GPM6A), a transmembrane glycoprotein.10 Moreover, a study has shown that miR-1 inhibits cell proliferation, invasion, metastasis and further progression of esophageal squamous cell carcinoma by binding to its target gene, TAGLN2, which also belongs to the family of actin-binding proteins.11 In addition, abnormal miRNA expression may interfere with many cellular signaling pathways; moreover, it can profoundly affect the pathogenesis and progression of cancer. Abnormal expression of miRNAs has been observed in several kinds of human tumors, including BC.12–14 The role of miRNAs in BC is a promising area of research to better understand the mechanisms of BC initiation, development and metastasis.
The rapid growth of high-throughput microarray technology in recent years has provided new methods to identify BC progression-related genes. Previously, identification of these genes was accomplished through basic gene expression analysis methods. Molecular mechanisms can be partially understood by screening differentially expressed genes or differentially expressed miRNAs (DEMs).15,16 Moreover, recent bioinformatics advancements allow us to apply the weighted gene coexpression network analysis (WGCNA) algorithm to interpret expression profiles, which ensure more comprehensive identification of new biomarkers.17 WGCNA can detect highly coexpressed genes that are closely connected within the network based on similarities in sample expression profiles. These subnetwork regions are called modules and are usually composed of functionally related genes.17,18 Therefore, the WGCNA algorithm for BC microarray miRNA expression data was performed in order to construct a coexpression network based on interactions between DEMs. In the meantime, hub miRNAs potentially associated with the pathogenesis of BC were identified and validated as prognostic biomarkers. These miRNAs may further reveal the biologic mechanisms of BC initiation and progression and may also serve as potential therapeutic targets.
Materials and methods
Acquisition of gene expression data and DEMs
The raw miRNA expression data from 418 BC and 19 normal tissue samples were downloaded from the Cancer Genome Atlas (TCGA).19 DEMs between BC and normal samples were selected using the “edgeR” R package.20 miRNAs with a false discovery rate of <0.05 and | log2 fold change | of >0.585 were identified as DEMs.
WGCNA and the identification of clinically significant modules
As reported above, the WGCNA package provided an approach to constructing miRNA modules within a network based on correlations between DEM expression profiles.21,22 First, a Pearson’s correlation matrix was computed for all pair-wise miRNAs. Subsequently, an adjacency matrix was constructed using a power adjacency function (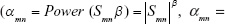 , αmn = adjacency between two miRNAs, Smn = Pearson’s correlations between two miRNAs). β is a soft thresholding parameter allowing for a maximal correlation coefficient. The power of β=3 (model fitting index R2=0.83) was chosen in accordance with the scale-free topology criterion. Next, the topological overlap matrix was calculated from the adjacency matrix to assess the interconnectedness of the miRNAs.23 Finally, the “cutreeStaticColor” function was applied to classify similar expression miRNAs into gene modules (minModuleSize =20 and mergeCutHeight =0.95). To identify the modules that were significantly associated with BC development, gene significance (GS) was calculated according to the formula: GSi = −log(Pi), where Pi was obtained from the value of the student’s t-test (two-tailed) to identify the differential expression between two groups. GS represented the correlation between gene expression and disease progression. The module significance was defined as the mean GS in a module, while a module with a high module significance value was considered to be the key module.21
Detection of candidate hub DEMs
Hub miRNAs were defined based on intramodular connectivity and module membership (MM) in our study. The intramodular connectivity was calculated as follows:  , where i, j belongs to Module q, Ki = intramodular connectivity of gene i and aij = adjacency between genes i and j.24 Intramodular connectivity reflects the correlation between miRNAs in the coexpression network. The MM was computed as originally described, namely,
  , where the module eigengene stands for the first principal component of a given module. The MMi ranged from 0 to 1, which reflected the Pearson’s correlation coefficient between gene expression and the module eigengene in the network.25 In general, miRNAs showing a high degree of connectivity and MM values within a module were defined as “hub miRNAs”, which were assumed to be functionally significant.22,24,26 The top 25% of miRNAs with the highest connectivity and MM values in the blue module were selected based on the module sizes as hub miRNAs for further study.
Bioinformatics analysis of miRNA target genes
Potential target genes of hub DEMs were retrieved from the target prediction database TargetScan (http://www.targetscan.org/). In addition, genes with a cumulative weighted context++ score of ≤−0.4 in the software were selected.27 Functional Gene Ontology (GO) enrichment analysis and Kyoto Encyclopedia of Genes and Genomes (KEGG) pathway analysis were performed using DAVID v6.8 (http://david.abcc.ncifcrf.gov/) bioinformatics online resources in order to uncover the biologic function of target genes. A P-value cutoff of <0.01 was set, and at least five genes were selected as the enriched function of target genes.
Human tissue specimens
Human tumor tissues and adjacent normal tissue specimens were obtained from the Department of Urology at Nanjing First Hospital, Nanjing Medical University. Ethical approval was obtained from the ethics committee of Nanjing First Hospital and written informed consent was obtained from all patients. The specimens were collected during surgery and frozen in liquid nitrogen.
Western blotting
Total protein was extracted from the tumor tissues and adjacent normal tissue specimens using radioimmunoprecipitation assay lysis buffer containing a protease inhibitor cocktail (Roche, Shanghai, China). The protein concentration was quantified using a bicinchoninic acid protein assay kit (Beyotime, Shanghai, China). Equivalent amounts of proteins were separated by sodium dodecyl sulfate-polyacrylamide gel electrophoresis, transferred to polyvinylidene fluoride membranes (EMD Millipore, Billerica, MA, USA) and blocked with 5% non-fat milk in distilled water for 2 h at room temperature. Later, the membranes were incubated with diluted anti-TAGLN2 primary antibodies (Abcam, #ab121146) overnight at 4°C, followed by incubation with horseradish peroxidase-conjugated secondary antibody (YI FEI XUE BIOTECHNOLOGY, Nanjing, China) for 2 h at room temperature. β-Actin was used as an internal control.
Human protein atlas
Expression of the TAGLN2 protein in BC tissues and normal bladder tissues was determined from immunohistochemical data publicly available in the Human Protein Atlas (www.proteinatlas.org).28
Survival analyses
Survival analyses in this study were performed using the TCGA database. The miRNA expression profile and survival data from 406 BC patients were used in our study after eliminating patients without available clinical information. The prognostic values of signature candidate miRNA profiles were assessed using GraphPad Prism 7. BC samples were divided into two groups according to their median proposed miRNA expression. The survival of two patient cohorts with candidate miRNAs was compared using a Kaplan–Meier survival plot. Moreover, log-rank P-values and the hazard ratio (HR) with 95% CIs were also calculated.
Results
Identification of DEMs
Using TCGA miRNA expression data, DEM expression profiles from BC and normal tissue samples were acquired by the “edgeR” package in R, with P<0.05 and log2 (fold change)| >0.585 being selected as the criteria. A total of 480 DEMs were identified after analysis, among which 350 genes were upregulated while 130 were downregulated (Figure 1; Table S1).
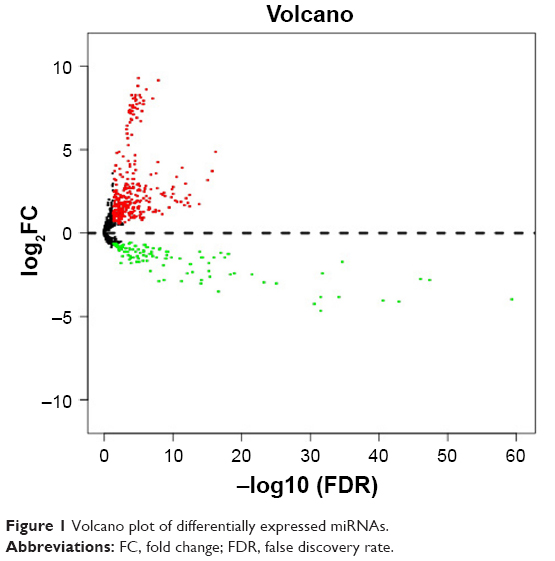 | Figure 1 Volcano plot of differentially expressed miRNAs. |
Coexpression network and clinical significant modules
The miRNA coexpression network in this study was constructed using the WGCNA. In addition, DEMs with similar expression patterns were divided into modules adopting the average hierarchical clustering linkage. Modules containing at least 20 miRNAs were extracted, and 5 modules were eventually identified (Figure 2A). The blue module had the highest mean GS among these modules (Figure 2B), and the correlation coefficient (r) of this module indicated a significant correlation of intramodular connectivity with gene significance (Figure 2C). This suggested that the blue module was closely related to BC progression. The top 25% of the 54 miRNAs (Table 1) showing the highest connectivity and MM values in the blue module were chosen as candidate hub miRNAs.29
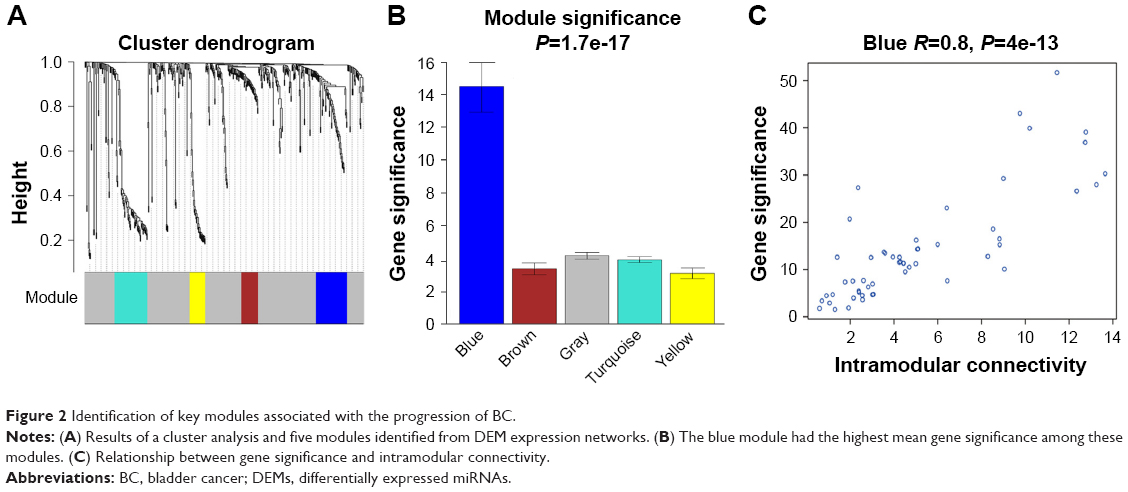 | Figure 2 Identification of key modules associated with the progression of BC. |
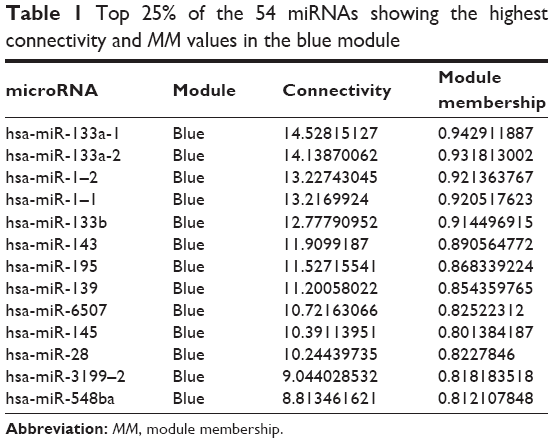 | Table 1 Top 25% of the 54 miRNAs showing the highest connectivity and MM values in the blue module |
Hub miRNA target prediction and functional annotation
Target genes of hub miRNAs were predicted using TargetScan V7.1. Those with cumulative weighted context++ scores of ≤−0.4 in the software were selected (Table S2).27 The miRNA regulatory network was visualized using CytoScape software, and miRNAs with many interactions were graphically highlighted (Figure 3). In total, 1351 predicted target genes were selected for further analysis. Altogether, 27 enriched GO biologic process terms (Figure 4A) and 17 KEGG pathways (Figure 4B) were obtained using a threshold of P<0.01 within the online software DAVID. GO analysis results suggested that the most represented GO terms in biologic processes were related to cell proliferation and regulation of growth. On the other hand, target genes were found to be significantly enriched in cancer-related pathways, such as pathways in cancer, regulation of actin cytoskeleton, PI3K-Akt signaling pathway, mitogen-activated protein kinase (MAPK) signaling pathway, Wnt signaling pathway, proteoglycans in cancer, focal adhesion and p53 signaling pathway.
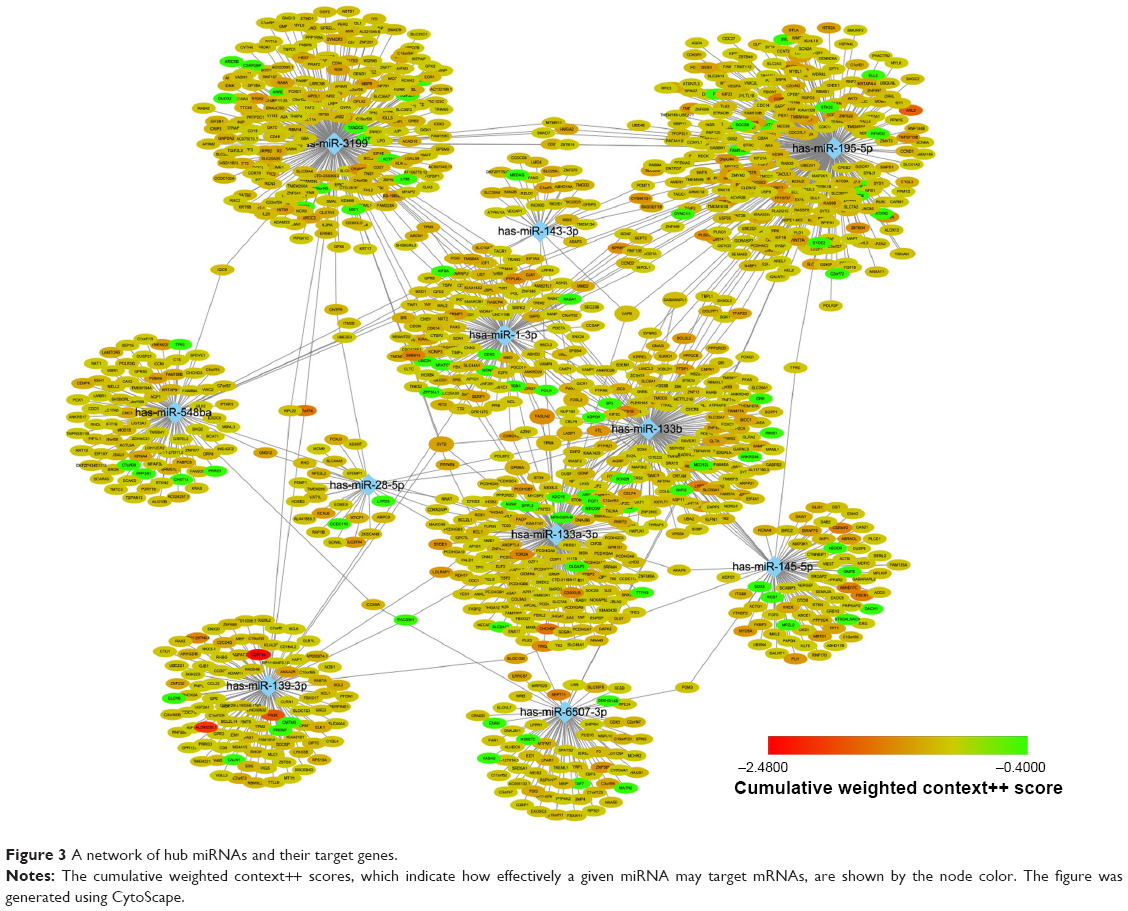 | Figure 3 A network of hub miRNAs and their target genes. |
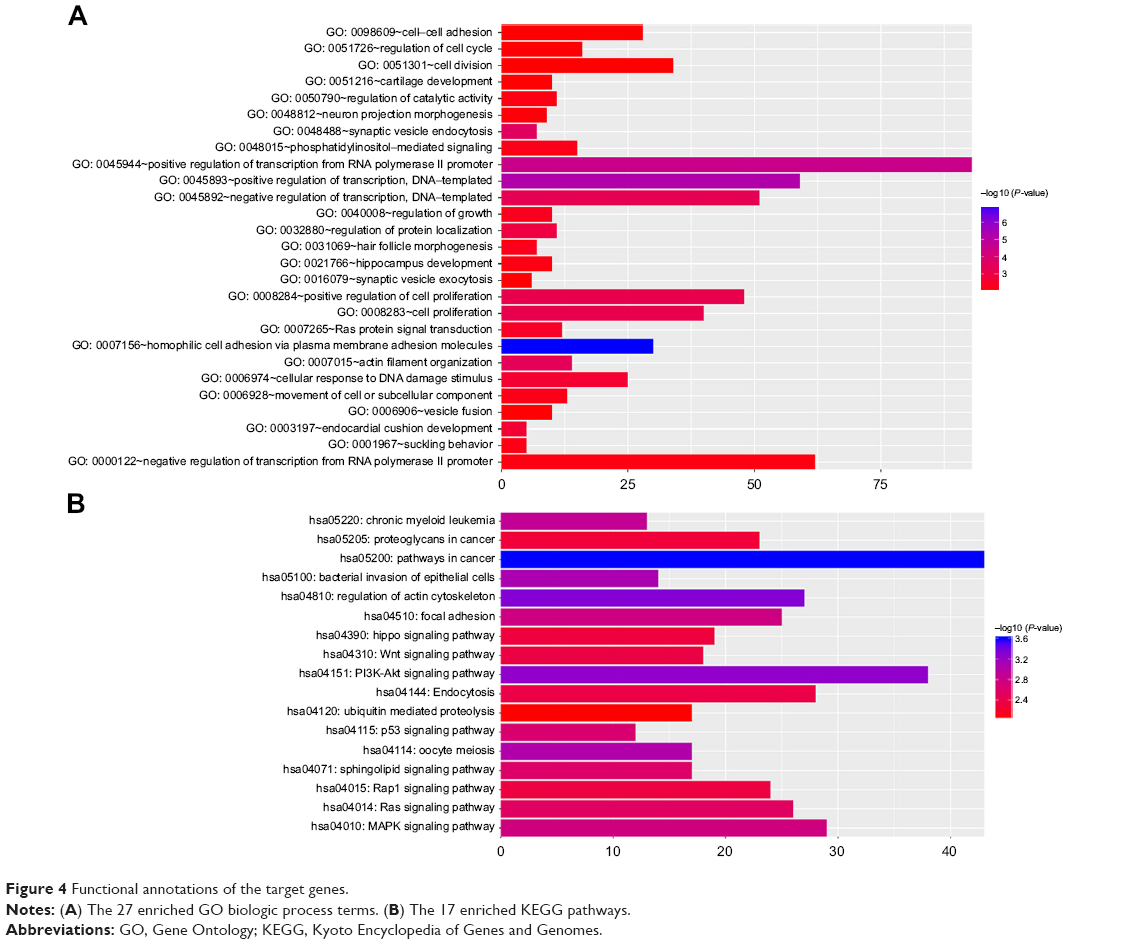 | Figure 4 Functional annotations of the target genes. |
Validation of the identified target genes
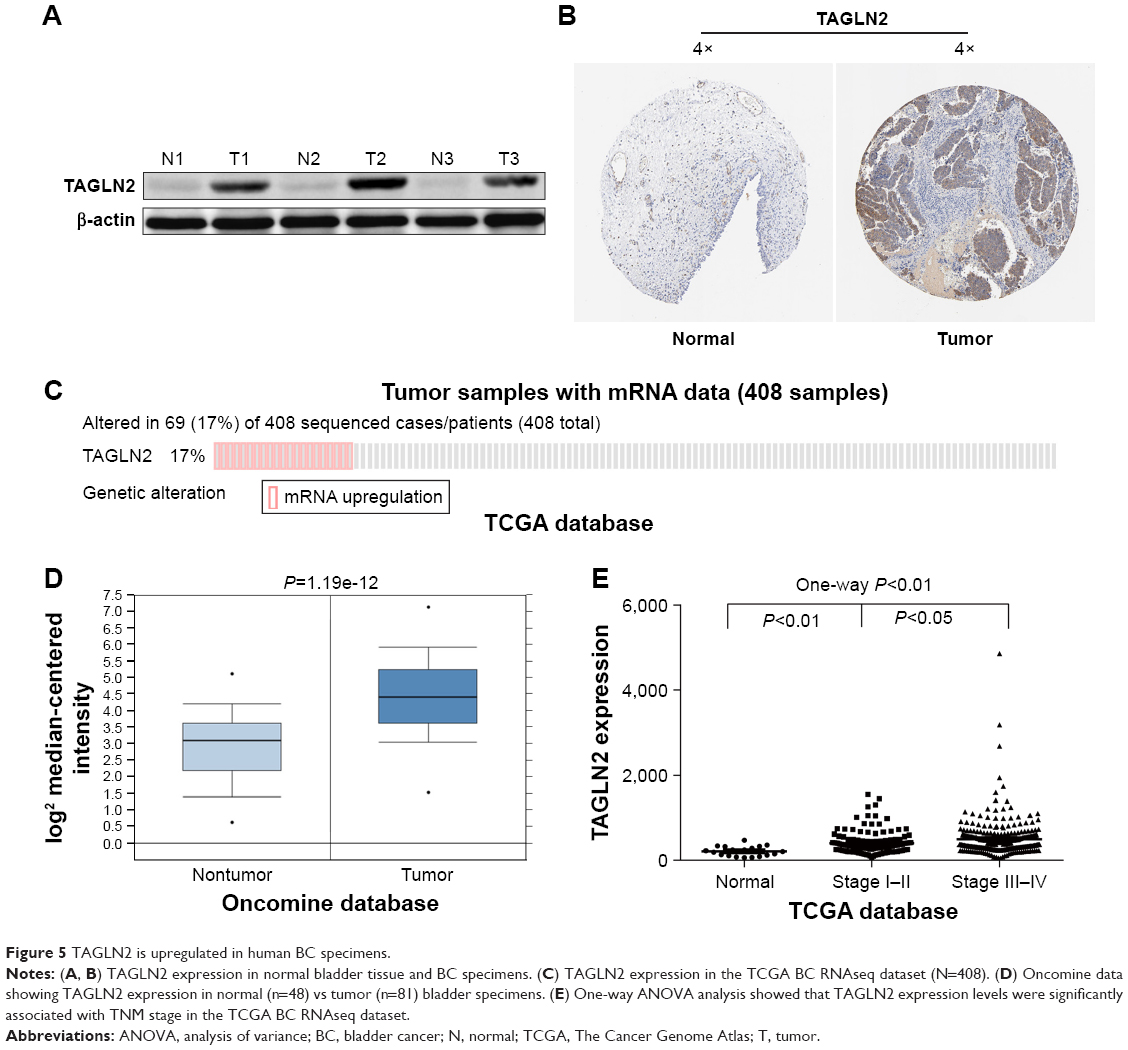
TAGLN2, the target gene with the highest repeatability, was randomly selected for further validation in order to determine the clinical relevance of target gene expression. It was a common target gene for miR-1–1/miR-1–2, miR-133a-1/miR-133a-2 and miR-133b. Western blots showed significantly higher TAGLN2 expression levels in BC tissue than in adjacent normal tissue specimens (Figure 5A), which was consistent with immunohistochemistry from the human protein map (www.proteinatlas.org, Figure 5B). The TAGLN2 mRNA level was consistently higher in BC tissues than in normal bladder tissue (Figure 5C and D), and increased TAGLN2 expression also significantly increased the risk of advanced TNM stages (Figure 5E), as shown in Compendia Biosciences (www.oncomine.org) and TCGA BC RNAseq.
 | Figure 5 TAGLN2 is upregulated in human BC specimens. |
Identification of hub miRNAs with prognostic value
Hub miRNAs in the blue module associated with the overall survival of BC patients were assessed in order to validate hub miRNAs as prognostic biomarkers. miRNA expression and clinical data of BC patients obtained from TCGA were applied toward assessing prognostic significance. As shown in Table 2, the low-expression miRNA candidate group had significantly poorer overall survival, which included hsa-miR-133a-1 (P=0.0327, HR: 1.372, 95% CI: 1.026–1.834), hsa-miR-133b (P=0.0498, HR: 1.530, 95% CI: 1.145–2.045), hsa-miR-143 (P=0.0018, HR: 1.597, 95% CI: 1.195–2.134), hsa-miR-195 (P=0.0127, HR: 1.452, 95% CI: 1.086–1.94) and hsa-miR-145 (P=0.0004, HR: 1.705, 95% CI: 1.276–2.279). These results indicate that the downregulated hsa-miR-133a-1, hsa-miR-133b, hsa-miR-143, hsa-miR-195, hsa-miR-6507, hsa-miR-145 and hsa-miR-548ba miRNAs were negative factors for the survival of BC patients.
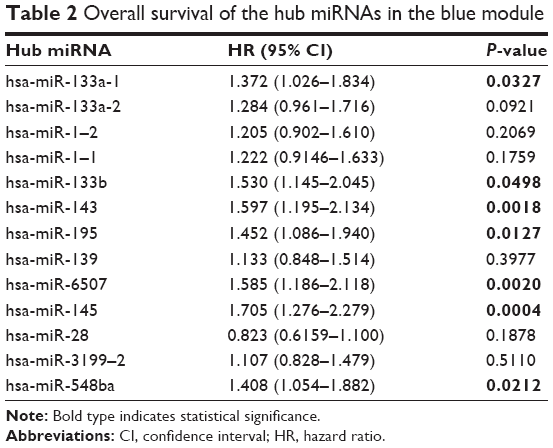 | Table 2 Overall survival of the hub miRNAs in the blue module |
Discussion
BC is a fatal form of cancer, and the identification of new precise and suitable targets is of vital importance. Circulating miRNAs may serve as potential targets due to their involvement in various biologic processes, including cell proliferation, differentiation, apoptosis, metabolism and tumorigenesis. The identification of miRNA biomarkers and targets was accomplished by analyzing the microarray-based miRNA expression data obtained from TCGA database. Initially, 480 DEMs were identified in each group, including 350 upregulated and 130 downregulated miRNAs. A weighted miRNA coexpression network was subsequently constructed and several miRNA modules were identified based on DEM expression profiles. The blue module of coexpressed miRNAs was found to be of more importance than other modules, suggesting that it played a crucial role in the development of BC. Meanwhile, the top 25% miRNAs with the highest connectivity and MM values were selected as hub miRNAs for further research.
Among the blue module hub miRNAs, miR-1 and miR-133a are located in the same chromosomal region, or “cluster”. Furthermore, there are two different chromosomal loci harboring miR-1 and miR-133a clusters (miR-1–1 and miR-133a-2 on 20q13.33, as well as miR-1–2 and miR-133a-1 on 18q11.2). Yamasaki et al30 reported that silencing the miR-1/miR-133a cluster could regulate the carcinogenicity of prothymosin-α and purine nucleoside phosphorylase and promote the proliferation and invasion of BC cells. In another study by Kawakami et al,31 the expression levels of miR-1 and miR-133a were remarkably inhibited in renal cell carcinoma cell lines and specimens, while miR-1 and miR-133a restoration could induce apoptosis in renal cell carcinoma cell lines. miR-133b, which is located in chromosomal region 6p12.2, has been shown to be downregulated in various tumors. Furthermore, it is distinctly associated with invasive clinicopathologic features, tumor subtypes and lower survival rate.32,33 Some evidence has shown that downregulating miR-195 may inhibit apoptosis and promote the proliferation and invasion of non-small-cell lung cancer cells by upregulating the oncogene CHEK1 (checkpoint kinase 1).34 Moreover, it has been found that miR-143, miR-145 and miR-28 are frequently markedly downregulated in colon cancer. These miRNAs are involved in regulation of several cellular processes, including proliferation, migration and chemoresistance.35,36
Furthermore, the enriched GO terms and KEGG pathways of hub miRNA target genes were also characterized by functional enrichment analysis. These target genes were found to be enriched in pathways in cancer, regulation of actin cytoskeleton, PI3K-Akt signaling pathway, MAPK signaling pathway, Wnt signaling pathway, proteoglycans in cancer, focal adhesion, p53 signaling pathway, cell proliferation and regulation of growth. In particular, many of these enriched functions regulated by hub miRNAs participate in the formation and progression of multiple tumors. For instance, the MAPK cascade is a critical pathway for human cancer cell survival, dissemination and resistance to drug therapy. Numerous stimuli, including DNA damage pathways and internal metabolic stress, as well as signaling from external growth factors, cell–matrix interactions and communication from other cells, can cause increased protein amplification. Moreover, these stimuli can alter the tumor microenvironment, thus over-activating the pathway and leading to tumor progression, as other studies have shown.37,38 Studies have demonstrated that miR-1/miR-133a regulates the MAPK pathway by inhibiting the phosphorylation of extracellular regulated protein kinases, which are involved in the metastasis of colorectal carcinoma.39,40 The regulation of actin cytoskeleton signaling pathways is identified as a cancer-related factor in multiple cancer datasets. Many key proteins are involved in this pathway, including WASP family proteins, Arp2/3 complexes, LIM-kinases, cofilin and cortactin. These proteins are regulated by miR-143 and overexpressed in multiple cancers, and can promote the migration, invasion and metastasis of cancer cells.41–44 The p53 gene plays an important role in various functional activities, such as avoiding the accumulation of damaged DNA, maintaining genomic stability, regulating cell differentiation by inducing cell cycle arrest, promoting apoptosis and DNA repair senescence. Cell division and proliferation will be uncontrolled if the p53 gene is damaged by cancer-induced factors.45,46 Increasing evidence has highlighted the important roles of miRNAs in mediating tumor suppression functions of p53. Sachdeva et al have reported that miR-145 is involved in the regulation of the dynamic balance between p53, a tumor suppressor, and c-Myc, a proto-oncogene, so as to maintain normal cell growth and proliferation. The downregulation of miR-145 expression will subsequently trigger cell malignancy.47
Notably, it is found that many genes are targeted by multiple hub miRNAs. For example, GPM6A, LASP1 and TAGLN2 are targeted by at least four hub miRNAs (Table S3). GPM6A has been shown in previous studies to promote the aggressiveness of lymphoid leukemia by inducing cell migration.48 Zhao et al demonstrated that LASP1 might promote liver, gut and mesentery metastases by using an orthotopic xenograft mouse model of pancreatic ductal adenocarcinoma, the upregulation of which was closely related to poor prognosis for pancreatic ductal adenocarcinoma patients.9 In this study, TAGLN2 was randomly selected for further verification. The results suggested that TAGLN2 expression was significantly higher in tumor tissue than in adjacent normal bladder tissue, and increased TAGLN2 expression also significantly increased the risk of advanced TNM stages, indicating that these genes may be closely associated with the development of BC. Thus, further studies regarding BC initiation and progression should be conducted on these genes independently from the proposed miRNAs.
Finally, the potential prognostic value of hub miRNAs was validated based on miRNA expression profiles in BC patients, as well as their survival information in the TCGA database. Seven out of the 11 hub miRNAs (including hsa-miR-133a-1, has-miR-133b, has-miR-143, has-miR-195 and hsa-miR-145) were found to be closely associated with the overall survival for BC patients.
Conclusion
To summarize, a key module significantly associated with BC progression has been confirmed in this study. Hub miRNAs within this module may play vital roles in the initiation and progression of BC, and may therefore be candidates for functional studies. Moreover, they were found to regulate a variety of cancer-related pathways at the functional level, such as pathways in cancer, regulation of actin cytoskeleton, MAPK, Wnt, proteoglycans in cancer, focal adhesion and p53-associated cellular signaling pathways, as well as cell proliferation and various cancer-related genes. In addition, some miRNAs were also found to be associated with overall survival for BC patients. Our study not only provides new insights into the initiation and progression of BC, but also identifies new potential biomarkers and therapeutic targets. Nonetheless, further studies are still needed.
Acknowledgments
This study was supported by grants from the National Natural Science Foundation of China (81370853 and 81570613) to RPJ, and Research and Innovation Program for Graduates of Jiangsu Province (CXZZ13_0583), Jiangsu Provincial Medical Youth Talent (QNRC2016073), Key Program of Science and Technology Foundation from Nanjing Medical University (2016NJMUZD042), and Natural Science Foundation of Jiangsu Province (BK20170135) to YZG.
Disclosure
The authors report no conflicts of interests in this work.
References
Jemal A, Bray F, Center MM, Ferlay J, Ward E, Forman D. Global cancer statistics. CA Cancer J Clin. 2011;61(2):69–90. | ||
Knowles MA, Hurst CD. Molecular biology of bladder cancer: new insights into pathogenesis and clinical diversity. Nature Reviews Cancer. 2015;15(1):25–41. | ||
Yafi FA, Aprikian AG, Chin JL, et al. Contemporary outcomes of 2287 patients with bladder cancer who were treated with radical cystectomy: a Canadian multicentre experience. BJU Int. 2011;108(4):539–545. | ||
Nargund VH, Tanabalan CK, Kabir MN. Management of non-muscle-invasive (superficial) bladder cancer. Semin Oncol. 2012;39(5):559–572. | ||
Shelley MD, Mason MD, Kynaston H. Intravesical therapy for superficial bladder cancer: A systematic review of randomised trials and meta-analyses. Cancer Treat Rev. 2010;36(3):195–205. | ||
Wilson RC, Doudna JA. Molecular mechanisms of RNA interference. Annu Rev Biophys. 2013;42:217–239. | ||
Kent OA, Mendell JT. A small piece in the cancer puzzle: microRNAs as tumor suppressors and oncogenes. Oncogene. 2006;25(46):6188. | ||
Rask L, Balslev E, Søkilde R, et al. Differential expression of miR-139, miR-486 and miR-21 in breast cancer patients sub-classified according to lymph node status. Cell Oncol (Dordr). 2014;37(3):215–227. | ||
Zhao T, Ren H, Li J, et al. LASP1 is a HIF1α target gene critical for metastasis of pancreatic cancer. Cancer Res. 2015;75(1):111–119. | ||
Gu X, Fu C, Lin L, et al. miR-124 and miR-9 mediated downregulation of HDAC5 promotes neurite development through activating MEF2C-GPM6A pathway. J Cell Physiol. 2017;233(1):673–687. | ||
Du YY, Zhao LM, Chen L, et al. The tumor-suppressive function of miR-1 by targeting LASP1 and TAGLN2 in esophageal squamous cell carcinoma. J Gastroenterol Hepatol. 2016;31(2):384–393. | ||
Drayton RM, Dudziec E, Peter S, et al. Reduced expression of miRNA-27a modulates cisplatin resistance in bladder cancer by targeting the cystine/glutamate exchanger SLC7A11. Clin Cancer Res. 2014;20(7):1990–2000. | ||
Eissa S, Habib H, Ali E, Kotb Y. Evaluation of urinary miRNA-96 as a potential biomarker for bladder cancer diagnosis. Med Oncol. 2015;32(1):1–7. | ||
Hirata H, Ueno K, Shahryari V, et al. Oncogenic miRNA-182–5p Targets Smad4 and RECK in Human Bladder Cancer. PLoS One. 2012;7(11):e51056. | ||
Yu H, Pei D, Chen L, Zhou X, Zhu H. Identification of key genes and molecular mechanisms associated with dedifferentiated liposarcoma based on bioinformatic methods. OncoTargets Ther. 2017;10:3017–3027. | ||
Kang L, Tao X, He BS, et al. MicroRNA expression profiles predict progression and clinical outcome in lung adenocarcinoma. Onco Targets Ther. 2016;9:5679–5692. | ||
Giulietti M, Occhipinti G, Principato G, Piva F. Identification of candidate miRNA biomarkers for pancreatic ductal adenocarcinoma by weighted gene co-expression network analysis. Cell Oncol (Dordr). 2017;40(2):181–192. | ||
Voineagu I, Wang X, Johnston P, et al. Transcriptomic analysis of autistic brain reveals convergent molecular pathology. Nature. 2011;474(7351):380–384. | ||
National Institutes of Health. The Cancer Genome Atlas. Available from: https://cancergenome.nih.gov/. Accessed March 23, 2017. | ||
Robinson MD, Mccarthy DJ, Smyth GK. edgeR: a Bioconductor package for differential expression analysis of digital gene expression data. Bioinformatics. 2010;26(1):139–140. | ||
Langfelder P, Horvath S. WGCNA: an R package for weighted correlation network analysis. BMC Bioinformatics. 2008;9:559. | ||
Dupuis J. Geometric interpretation of gene coexpression network analysis. PLoS Comput Biol. 2008;4(8):e1000117. | ||
Yip AM, Horvath S. Gene network interconnectedness and the generalized topological overlap measure. BMC Bioinformatics. 2007;8:22. | ||
Langfelder P, Luo R, Oldham MC, Horvath S. Is my network module preserved and reproducible? PLoS Comput Biol. 2011;7(1):e1001057. | ||
Langfelder P, Horvath S. Eigengene networks for studying the relationships between co-expression modules. BMC Syst Biol. 2007;1(1):54. | ||
Dewey FE, Perez MV, Wheeler MT, et al. Gene coexpression network topology of cardiac development, hypertrophy, and failure. Circ Cardiovascu Genet. 2011;4(1):26–35. | ||
Agarwal V, Bell GW, Nam JW, Bartel DP. Predicting effective microRNA target sites in mammalian mRNAs. eLife. 2015;4:e05005. | ||
Uhlen M, Oksvold P, Fagerberg L, et al. Towards a knowledge-based Human Protein Atlas. Nat Biotechnol. 2010;28(12):1248–1250. | ||
Shannon P, Markiel A, Ozier O, et al. Cytoscape: a software environment for integrated models of biomolecular interaction networks. Genome Res. 2003;13(11):2498–2504. | ||
Yamasaki T, Yoshino H, Enokida H, et al. Molecular targets regulated by tumor suppressive microRNA-1 and microRNA-133a in bladder cancer. Int J Oncol. 2012;40(6):1821–1830. | ||
Kawakami K, Enokida H, Chiyomaru T, et al. The functional significance of miR-1 and miR-133a in renal cell carcinoma. Eur J Cancer. 2012;48(6):827–836. | ||
Patron JP, Fendler A, Bild M, et al. MiR-133b targets antiapoptotic genes and enhances death receptor-induced apoptosis. PLoS One. 2012;7(4):e35345. | ||
Kara M, Yumrutas O, Ozcan O, et al. Differential expressions of cancer-associated genes and their regulatory miRNAs in colorectal carcinoma. Gene. 2015;567(1):81–86. | ||
Liu B, Qu J, Xu F, et al. MiR-195 suppresses non-small cell lung cancer by targeting CHEK1. Oncotarget. 2015;6(11):9445–9456. | ||
Almeida MI, Nicoloso MS, Zeng L, et al. Strand-specific miR-28–5p and miR-28–3p have distinct effects in colorectal cancer cells. Gastroenterology. 2012;142(4):886–896. | ||
Gomes SE, Simões AES, Pereira DM, Castro RE, Rodrigues CMP, Borralho PM. miR-143 or miR-145 overexpression increases cetuximab-mediated antibody-dependent cellular cytotoxicity in human colon cancer cells. Oncotarget. 2016;7(8):9368–9387. | ||
Burotto M, Chiou VL, Lee JM, Kohn EC. The MAPK pathway across different malignancies: a new perspective. Cancer. 2014;120(22):3446–3456. | ||
Kim EK, Choi EJ. Compromised MAPK signaling in human diseases: an update. Arch Toxicol. 2015;89(6):867–882. | ||
Xu L, Zhang Y, Wang H, Zhang G, Ding Y, Zhao L. Tumor suppressor miR-1 restrains epithelial-mesenchymal transition and metastasis of colorectal carcinoma via the MAPK and PI3K/AKT pathway. J Transl Med. 2014;12(1):1–12. | ||
Wang H, An H, Wang B, et al. miR-133a represses tumour growth and metastasis in colorectal cancer by targeting LIM and SH3 protein 1 and inhibiting the MAPK pathway. Eur J Cancer. 2013;49(18):3924–3935. | ||
Liu W, Li C, Xu Y, et al. Topologically inferring risk-active pathways toward precise cancer classification by directed random walk. Bioinformatics. 2013;29(17):2169–2177. | ||
Yamaguchi H, Condeelis J. Regulation of the actin cytoskeleton in cancer cell migration and invasion. Biochim Biophys Acta. 2007;1773(5):642–652. | ||
Li D, Hu J, Song H, et al. miR-143–3p targeting LIM domain kinase 1 suppresses the progression of triple-negative breast cancer cells. Am J Transl Res. 2017;9(5):2276–2285. | ||
Liu R, Yang M, Meng Y, et al. Tumor-suppressive function of miR-139–5p in esophageal squamous cell carcinoma. PLoS One. 2013;8(10):e77068. | ||
Eldeiry WS, Tokino T, Velculescu VE, et al. WAF1, a potential mediator of p53 tumor suppression. Cell. 1993;75(4):817–825. | ||
Levine AJ, Momand J, Finlay CA. The p53 tumour suppressor gene. Nature. 1998;351(6326):453–456. | ||
Sachdeva M, Zhu S, Wu F, et al. p53 represses c-Myc through induction of the tumor suppressor miR-145. Proc Natl Acad Sci U S A. 2009;106(9):3207–3212. | ||
Charfi C, Edouard E, Rassart E. Identification of GPM6A and GPM6B as potential new human lymphoid leukemia-associated oncogenes. Cell Oncol (Dordr). 2014;37(3):179–191. |
 © 2017 The Author(s). This work is published and licensed by Dove Medical Press Limited. The full terms of this license are available at https://www.dovepress.com/terms.php and incorporate the Creative Commons Attribution - Non Commercial (unported, v3.0) License.
By accessing the work you hereby accept the Terms. Non-commercial uses of the work are permitted without any further permission from Dove Medical Press Limited, provided the work is properly attributed. For permission for commercial use of this work, please see paragraphs 4.2 and 5 of our Terms.
© 2017 The Author(s). This work is published and licensed by Dove Medical Press Limited. The full terms of this license are available at https://www.dovepress.com/terms.php and incorporate the Creative Commons Attribution - Non Commercial (unported, v3.0) License.
By accessing the work you hereby accept the Terms. Non-commercial uses of the work are permitted without any further permission from Dove Medical Press Limited, provided the work is properly attributed. For permission for commercial use of this work, please see paragraphs 4.2 and 5 of our Terms.