")
Back to Journals » Diabetes, Metabolic Syndrome and Obesity » Volume 13
Identification of Hub Genes in Type 2 Diabetes Mellitus Using Bioinformatics Analysis
Authors Lin Y, Li J, Wu D, Wang F, Fang Z, Shen G
Received 9 January 2020
Accepted for publication 23 April 2020
Published 22 May 2020 Volume 2020:13 Pages 1793—1801
DOI https://doi.org/10.2147/DMSO.S245165
Checked for plagiarism Yes
Review by Single anonymous peer review
Peer reviewer comments 2
Editor who approved publication: Prof. Dr. Antonio Brunetti
YiXuan Lin,1 Jinju Li,1 Di Wu,1 FanJing Wang,1 ZhaoHui Fang,2,3 GuoMing Shen1
1Graduate School of Anhui University of Chinese Medicine, Hefei, Anhui, People’s Republic of China; 2Department of Endocrinology, The First Affiliated Hospital of Anhui University of Traditional Chinese Medicine, Hefei, Anhui, People’s Republic of China; 3Anhui Academic of Traditional Chinese Medicine Diabetes Research Institute, Hefei, Anhui, People’s Republic of China
Correspondence: ZhaoHui Fang; GuoMing Shen Tel +86-13085513100
Email [email protected]; [email protected]
Background: Type 2 diabetes mellitus (T2DM) is one of the most common chronic diseases in the world with complicated pathogenesis. This study aimed to identify differentially expressed genes (DEGs) and molecular pathways in T2DM using bioinformatics analysis.
Materials and Methods: To explore potential therapeutic targets for T2DM, we analyzed three microarray datasets (GSE50397, GSE38642, and GSE44035) acquired from the Gene Expression Omnibus (GEO) database. DEGs between T2DM islet and normal islet were picked out by the GEO2R tool and Venn diagram software. Gene Ontology (GO) function and Kyoto Encyclopedia of Genes and Genomes (KEGG) pathway enrichment analysis were performed using the Database for Annotation, Visualization, and Integrated Discovery (DAVID) to identify the pathways and functional annotation of DEGs. Then, protein–protein interaction (PPI) of these DEGs was visualized by Cytoscape with Search Tool for the Retrieval of Interacting Genes/Proteins (STRING).
Results: In total, we identified 36 DEGs in the three datasets, including 32 up-regulated genes and four down-regulated genes. The improved functions and pathways of the DEGs enriched in cytokine–cytokine receptor interaction, pathways in cancer, PI3K-Akt signaling pathway, and Rheumatoid arthritis. Among them, ten hub genes with a high degree of connectivity were selected. Furthermore, via the re-analysis of DAVID, four genes (IL6, MMP3, MMP1, and IL11) were significantly enriched in the Rheumatoid arthritis pathway.
Conclusion: Our study, based on the GEO database, identified four significant up-regulated DEGs and provided novel targets for diagnosis and treatment of T2DM.
Keywords: bioinformatics analysis, microarray, differentially expressed genes, type 2 diabetes mellitus
Introduction
Diabetes mellitus (DM) is a metabolic disease characterized by hyperglycemia.1 According to the data from the International Diabetes Federation (IDF), there were 463 million diabetic patients worldwide in 2019 and this number was expected to reach 700 million in 2045. Besides, 352 million individuals with impaired glucose tolerance were at increased risk of developing diabetes.2 In clinical practice, diabetes can be divided into different types like type 1, type 2 and pregnancy type among which over 90% of DM cases are type 2 DM (T2DM).3,4 T2DM can cause not only hyperglycemia but also serious complications such as nephropathy, neuropathy, retinopathy, stroke, and coronary heart diseases, making significant contributions to mortality.5 The leading causes of T2DM are insulin resistance and defective insulin secretion, but the pathogenesis of T2DM has not been fully elucidated.6 Increasing pieces of evidence have shown that genetic factors and environmental effects may greatly induce the onset of T2DM.7,8 For better understand the mechanism of T2DM and reduce the complications of T2DM, it is especially important to clarify the pathophysiological mechanism at the gene transcript level. Currently, high-throughput microarray technology and bioinformatics analysis have been widely used to screen changes of gene expression at the transcriptome level, which could help us identify differentially expressed genes (DEGs) and functional pathways involved in T2DM patients. Although some studies have explored the mRNA expression profiles in pancreatic islets of T2DM in Gene Expression Omnibus (GEO), few studies were performed to integrate all islet data in GEO for bioinformatics analysis.9–11
In this study, we chose three microarray datasets GSE50397,9 GSE38642,10 and GSE4403511 from GEO. The GEO2R online tool (https://www.ncbi.nlm.nih.gov/geo/geo2r) and Venn diagram software were utilized to obtain the DEGs in the three datasets. Gene Ontology (GO) functional annotation analysis and Kyoto Encyclopedia of Genes and Genomes (KEGG) pathway enrichment analysis were performed for the screened DEGs. Moreover, we established a protein–protein interaction (PPI) network of the DEGs, and hub genes were selected. The present study may be useful to explore the molecular mechanism of the pathogenesis in the diabetic islet.
Materials and Methods
Microarray Data Information
GEO (https://www.ncbi.nlm.nih.gov/geo) is a public functional genomics data repository of high throughput gene expression data, chips, and microarrays.12 Three gene expression datasets GSE50397, GSE38642, and GSE44035 were downloaded from GEO (Affymetrix GPL6244 platform, Affymetrix Human Gene 1.0 ST Array). The GSE50397 dataset contained 66 non-diabetic pancreatic islets samples and 11 diabetic pancreatic islets samples. GSE38642 included 54 non-diabetic pancreatic islets samples and nine diabetic pancreatic islets samples. GSE44035 contained 9 non-diabetic pancreatic islet samples and one diabetic pancreatic islet samples.
Data Processing of DEGs
The DEGs between DM and non-diabetic samples were screened using GEO2R (http://www.ncbi.nlm.nih.gov/geo/geo2r). GEO2R is an online GEO analysis tool, which can perform gene differential expression analysis on GEO sample data. For a gene symbol corresponding to multiple probe IDs, the average value of these probes was calculated as the representative expression level of this gene. Genes that met the criteria |log2 fold change (FC)| >1 and adj. P-value <0.05 was considered statistically significant. Then, the raw data in TXT format were checked in Venn software online to detect the commonly DEGs among the three datasets.
Gene Ontology (GO) Enrichment and Kyoto Encyclopedia of Genes and Genomes (KEGG) Pathway Enrichment Analysis
GO analysis is a commonly used approach for grouping genes and their RNA or protein products into GO categories to identify unique biological properties of high-throughput transcriptome or genome data.13 KEGG is a collection of databases dealing with genomes, diseases, biological pathways, drugs, and chemical materials.14 The two analyses were available in the Database for Annotation, Visualization, and Integrated Discovery (DAVID; http://david.ncifcrf.gov) (version 6.8),15 which is an online biological information database composed of an integrated biology knowledge data and analysis tools to extract vital information. In the present study, we performed a GO term analysis and KEGG pathway analysis using the DAVID online tool. Normal P value<0.05 was considered as the threshold for a significant enrichment result.
PPI Network and CytoHubba Analysis
The Search Tool for the Retrieval of Interacting Genes/Proteins (STRING) 10.0 (https://string-db.org/) is an online software of interactions of genes and proteins, including direct (physical) as well as indirect (functional) associations.16 In the present study, the PPI network of DEGs was constructed using the STRING database, and interaction with a combined score >0.4 as the cut-off criterion. Besides, we have drawn the PPI networks using Cytoscape,17 and the hub genes in the PPI networks were identified using cytoHubba.18 This Cytoscape plugin CytoHubba can find hub genes more accurately by using 11 algorithms. In our study, we selected the top ten genes as hub genes.
Results
Identification of DEGs in DM
After standardizing the microarray results, we identified 467 DEGs in GSE50397. Among these DEGs, 255 genes were up-regulated, and 212 genes were down-regulated. In GSE38642, we obtained 358 DEGs, among which 174 were up-regulated, and 184 were down-regulated. 645 DEGs were identified from GSE44035, among them, 383 up-regulated genes and 262 down-regulated genes. Subsequently, we used the Venn diagram to analyze the DEGs in the three datasets. (Figure 1) Finally, 36 DEGs were detected, consisting of 32 up-regulated genes and four down-regulated genes (Table 1).
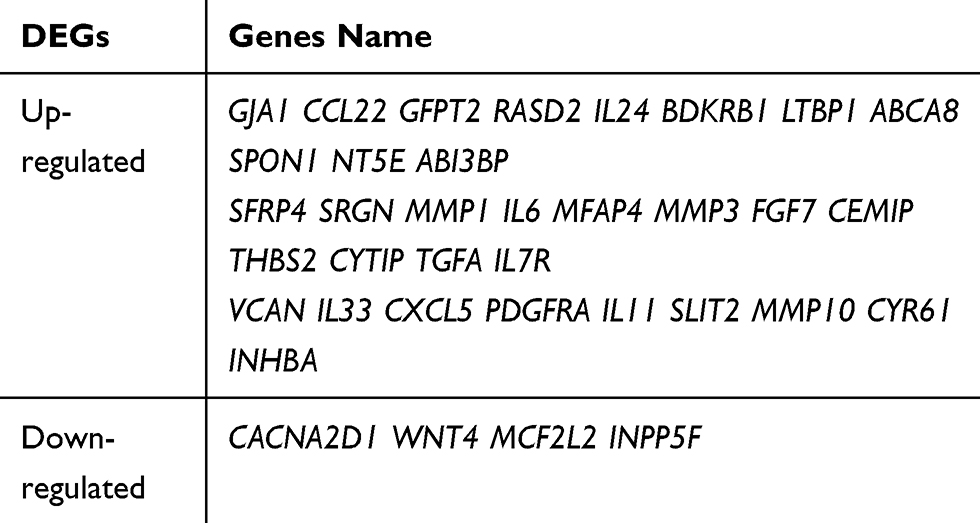 |
Table 1 36 Differentially Expressed Genes (DEGs) Were Detected from Three Datasets, Including 32 Up-Regulated Genes and 4 Down-Regulated Genes |
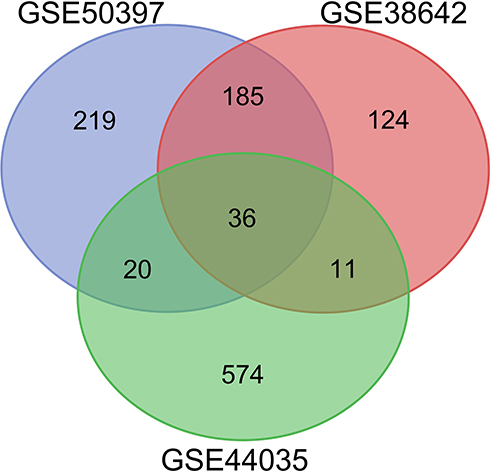 |
Figure 1 Venn diagram of DEGs common to all three GEO datasets (GSE50397, GSE38642 and GSE44035). |
GO and KEGG Enrichment Analyses
All 36 DEGs were analyzed using DAVID. The enriched GO terms were divided into the biological process (BP), molecular function (MF) and cellular component (CC). For BP, DEGs were enriched in cell-cell signaling, positive regulation of osteoblast differentiation, positive regulation of cell proliferation, wound healing, negative regulation of cell growth, and positive regulation of gene expression. MF analysis showed that the DEGs were significantly enriched in heparin-binding, growth factor activity, cytokine activity, calcium ion binding, metalloendopeptidase activity, and hyaluronic acid-binding. CC analysis showed that the DEGs were significantly enriched in the extracellular region, extracellular space, proteinaceous extracellular matrix, extracellular matrix, cell surface, and microfibril. KEGG pathway analysis showed that the DEGs were mainly enriched in cytokine–cytokine receptor interaction, Rheumatoid arthritis, pathways in cancer, Jak-STAT signaling pathway, PI3K-Akt signaling pathway, and Hematopoietic cell lineage (Tables 2 and 3).
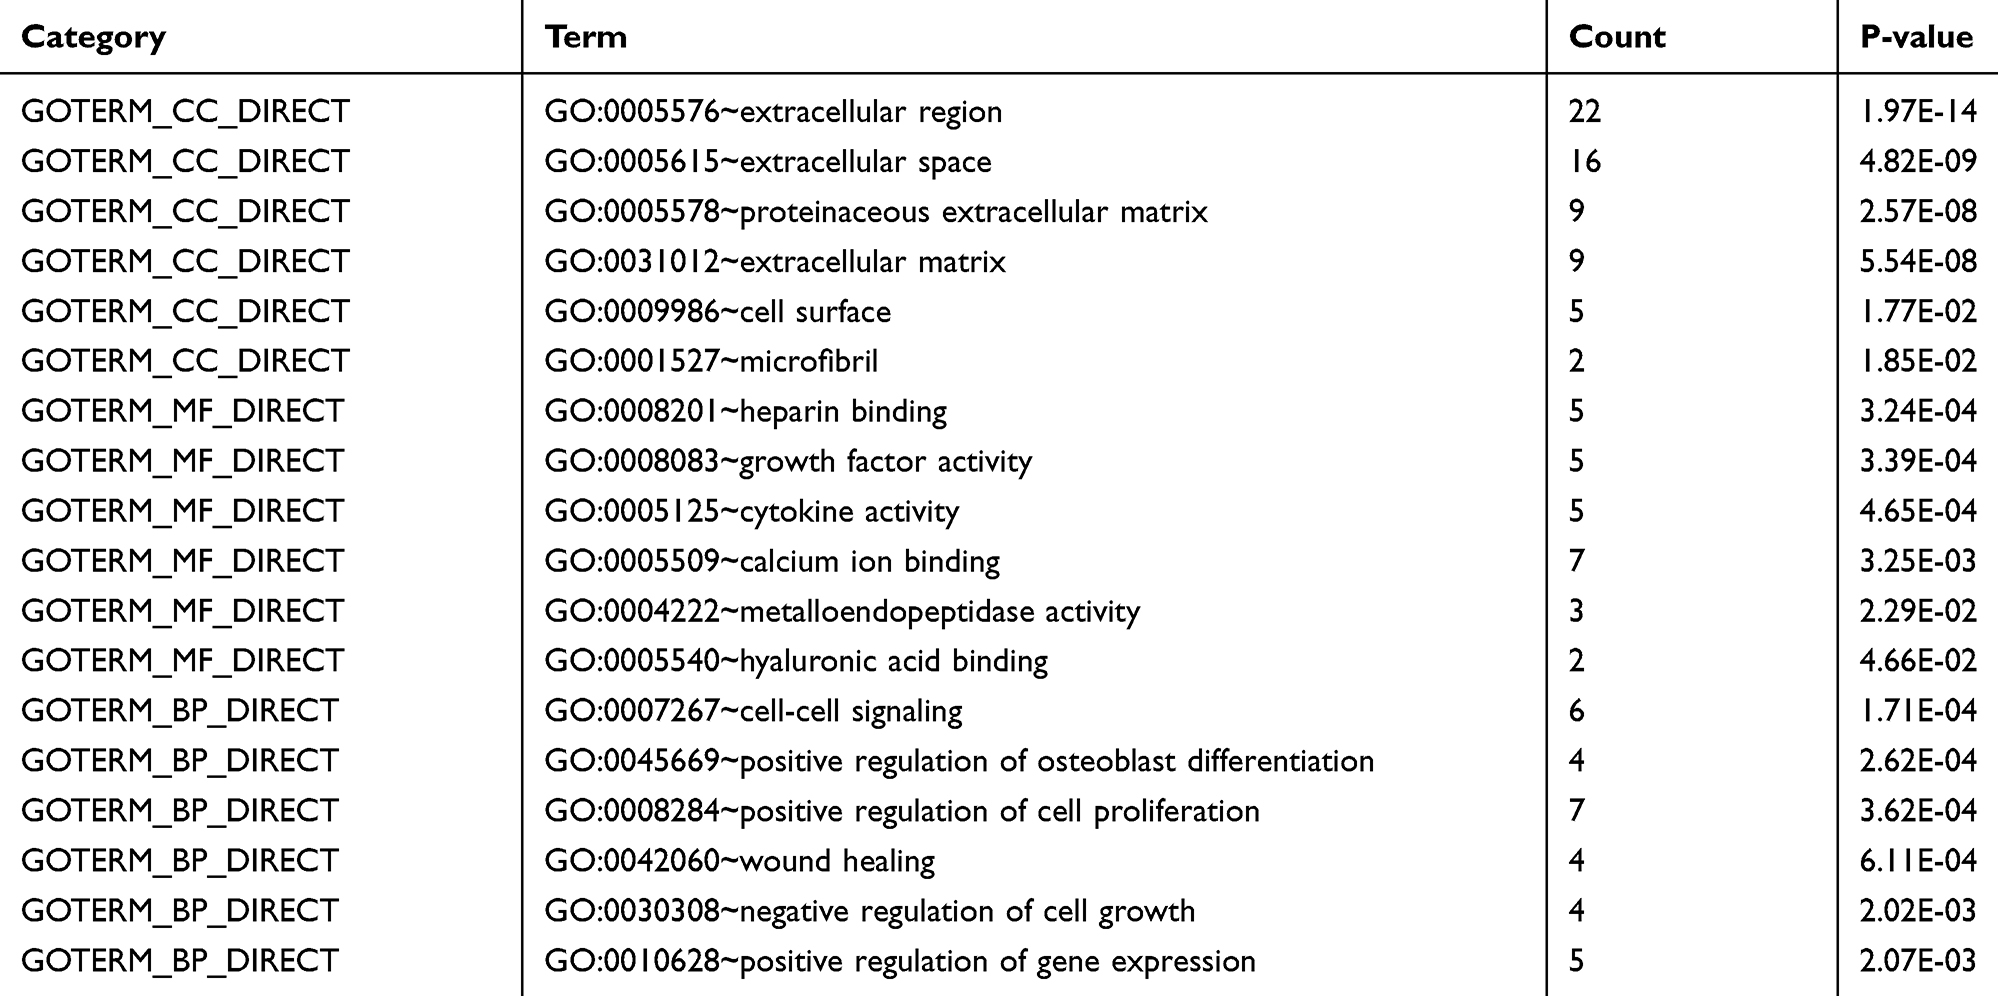 |
Table 2 Gene Ontology Analysis of Differentially Expressed Genes in T2DM |
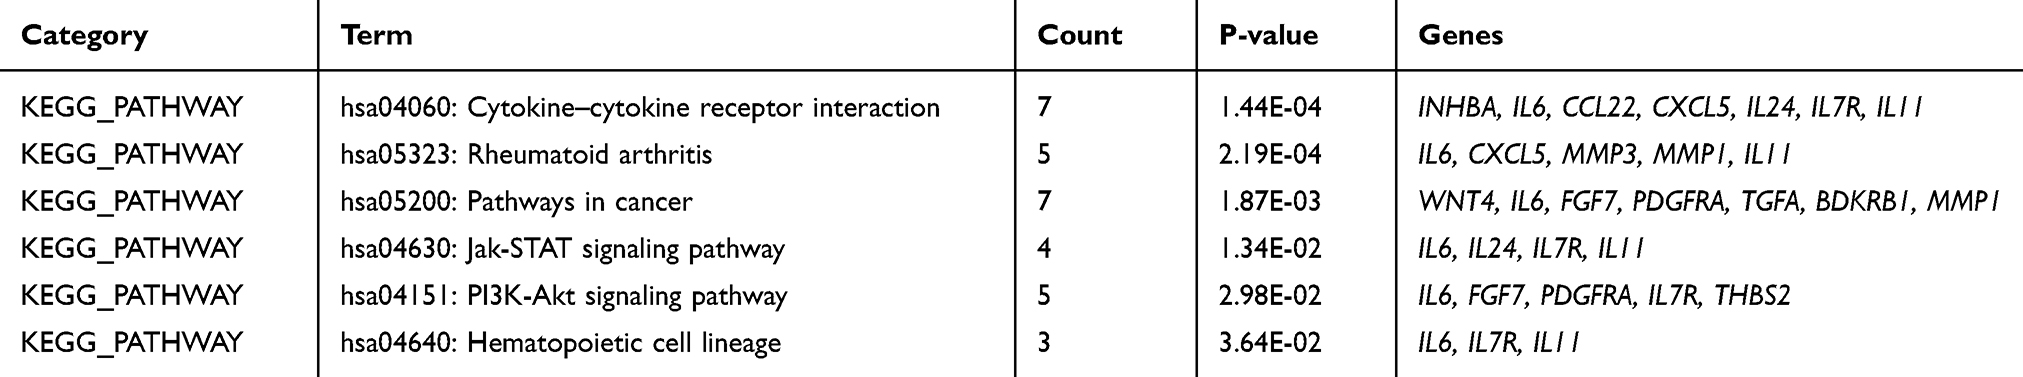 |
Table 3 The Kyoto Encyclopedia of Genes and Genomes (KEGG) Pathway Analysis in T2DM |
PPI Network and CytoHubba Analysis
A total of 35 nodes and 204 edges were imported in the PPI network, including 32 up-regulated genes and three down-regulated genes (Figure 2). INPP5F has no interaction with any other DEGs, so it is not included in the PPI network. Then we applied CytoHubba to calculate the degree of each protein node. The results demonstrated that the top 10 genes ranked by the node degree were IL6, MMP3, INHBA, MMP1, VCAN, FGF7, PDGFRA, THBS2, IL11, and CYR61, respectively (Figure 3) (Table 4).
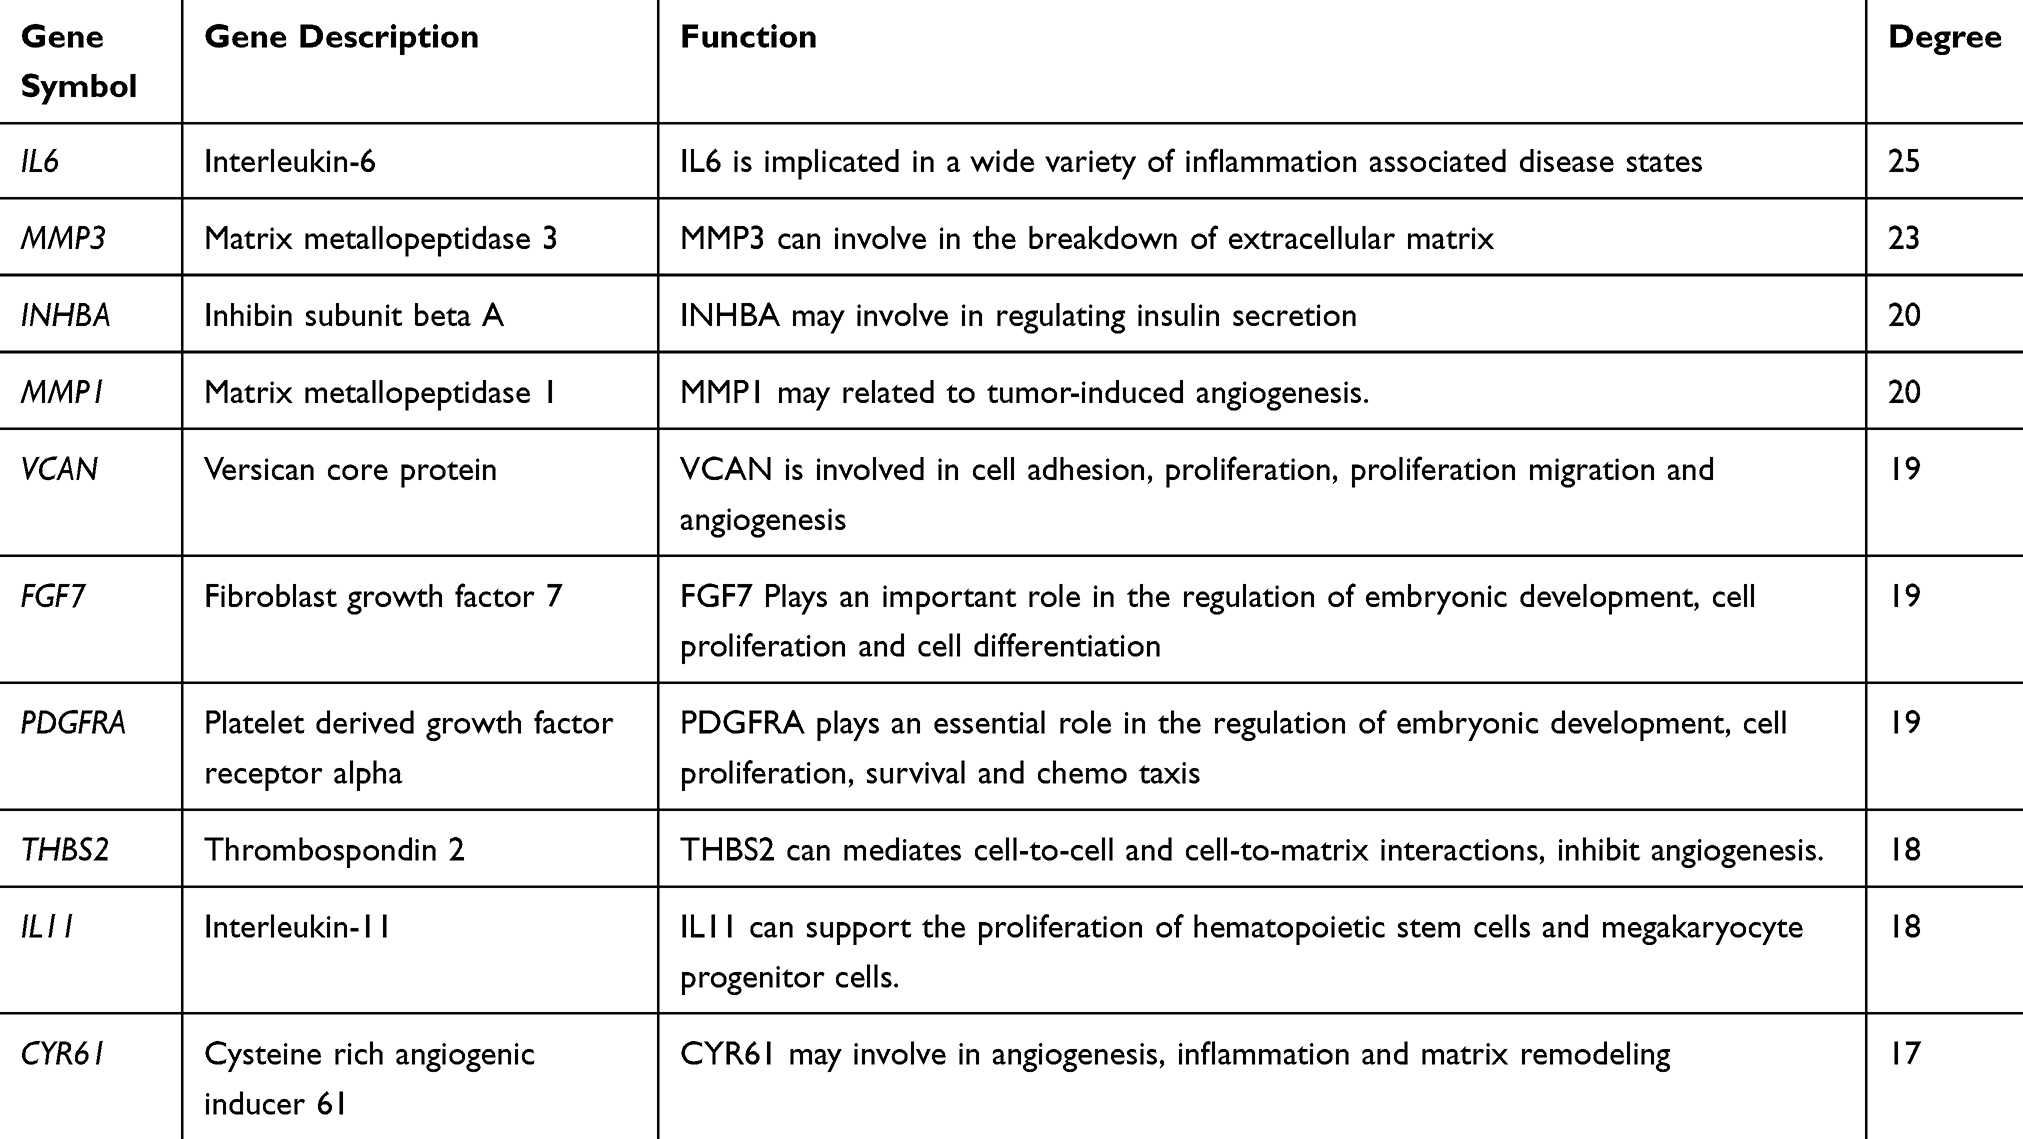 |
Table 4 Function and Connectivity of the Ten Hub Genes |
 |
Figure 2 Protein–protein interaction network of the differentially expressed genes (red circles meant up-regulated DEGs and green circles meant down-regulated DEGs). |
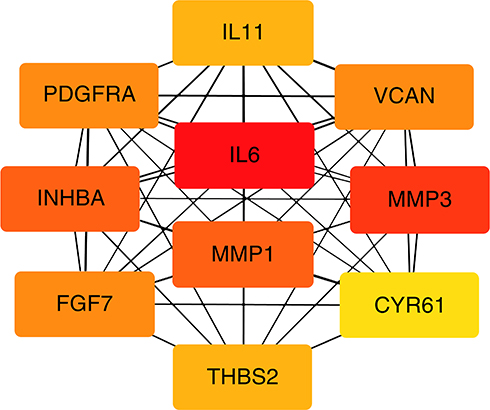 |
Figure 3 Top ten hub genes with higher degree of connectivity from PPI network. |
Re-Analysis of 10 Hub Genes via KEGG Pathway Enrichment
To investigate the possible pathways of these ten potential hub genes, we re-performed KEGG pathway enrichment using the DAVID (Table 5). The results showed that four genes (IL6, MMP3, MMP1, and IL11) were significantly enriched in the Rheumatoid arthritis pathway (Figure 4).
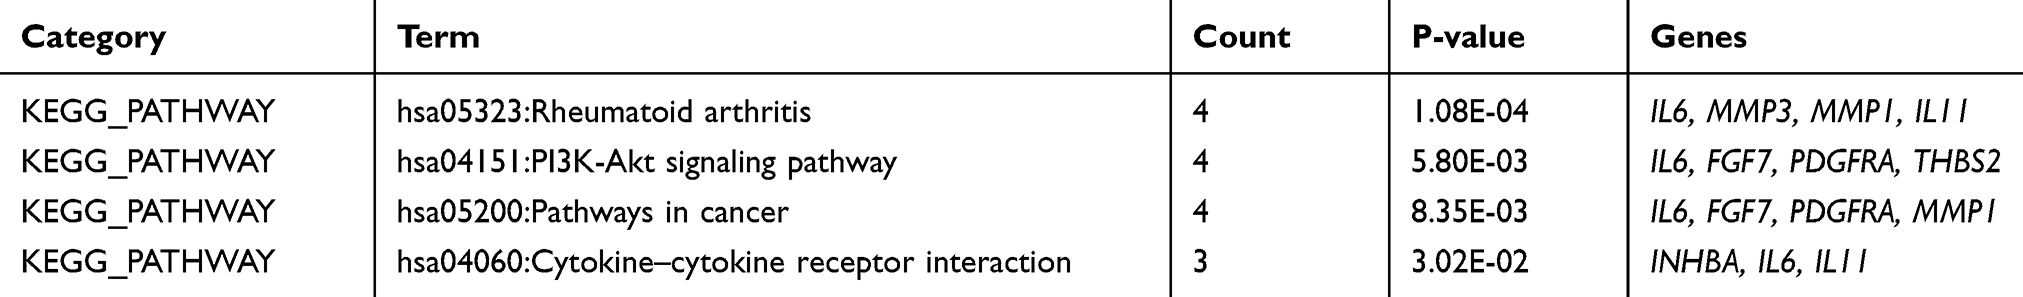 |
Table 5 The Kyoto Encyclopedia of Genes and Genomes (KEGG) Pathway Analysis of 10 Hub Genes |
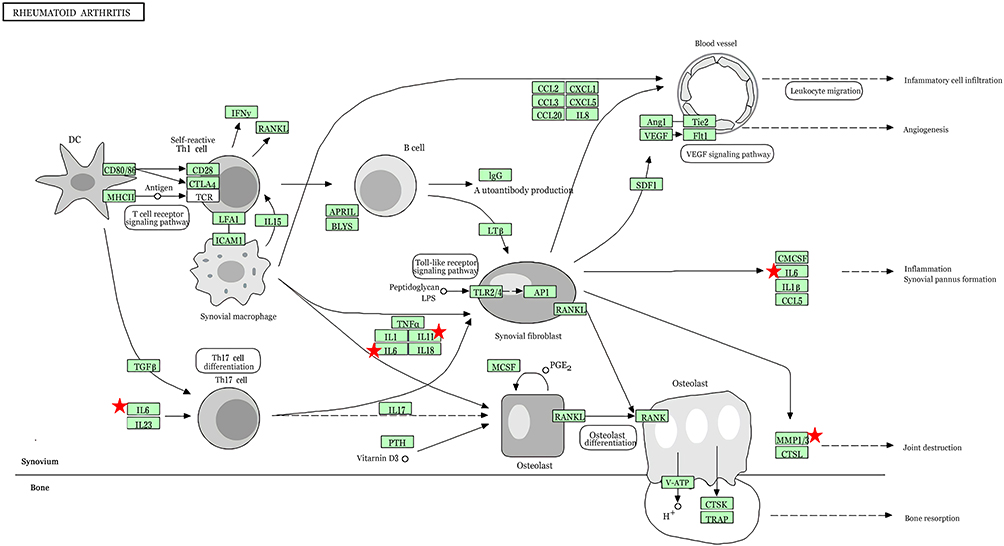 |
Figure 4 The result of re-analysis of 10 hub genes using the KEGG pathway enrichment. The red indicator represents four genes (IL6, MMP3, MMP1, and IL11) were significantly enriched in the rheumatoid arthritis pathway. |
Discussion
T2DM has become a significant public health concern.19 DM not only brings about physical and mental injury to patients who suffer from it but also imposes heavy financial burdens on individuals and countries. In the current medical situation, DM is still a permanent disease.20,21 Thus, it urgently demanded potential, highly effective diagnostic, and therapeutic markers. Microarray technology enables us to explore the genetic alterations in T2DM and has proven to be a useful approach to identify new biomarkers in other diseases. Zhou et al identified the potential predictive biomarkers of diabetic peripheral neuropathy (DPN) from two GEO datasets by functional enrichment analysis, PPI network, and Receiver-Operator Characteristic (ROC) curve analysis.22 Li et al analyzed three mRNA microarray datasets using bioinformatics analysis methods, and sixteen hub genes were identified as potential diagnostic biomarkers for hepatocellular carcinoma (HCC).23 Xiong et al used the gene expression profiles from GEO datasets to identify the molecular mechanisms and the key hub genes that may contribute to synovial inflammation in patients with rheumatoid arthritis.24
To identify more useful prognostic biomarkers in T2DM, we used bioinformatical methods based on three gene expression profile datasets (GSE50397, GSE38642, and GSE44035). Via GEO2R and Venn software, we revealed a total of 36 commonly changed DEGs (|log2FC| > 1 and adj. P-value < 0.05), most [ie, 32 (88.89%)] of which were up-regulated. Then, GO and pathway enrichment analysis using DAVID methods showed that 1) for BP, DEGs were mainly enriched in cell-cell signaling, positive regulation of osteoblast differentiation, positive regulation of cell proliferation, wound healing, negative regulation of cell growth, and positive regulation of gene expression; 2) for MF, DEGs were enriched in heparin-binding, growth factor activity, cytokine activity, calcium ion binding, metalloendopeptidase activity, and hyaluronic acid-binding; 3) for CC, up-regulated DEGs were significantly enriched in extracellular region, extracellular space, proteinaceous extracellular matrix, extracellular matrix, cell surface, and microfibril. For the KEGG pathway enrichment analysis, up-regulated DEGs were significantly enriched in cytokine–cytokine receptor interaction, Rheumatoid arthritis, pathways in cancer, Jak-STAT signaling pathway, PI3K-Akt signaling pathway, and Hematopoietic cell lineage while down-regulated DEGs in no noteworthy signaling pathways (P< 0.05). Next, the Cytoscape tool visually constructed a PPI network with 35 nodes and 204 edges, which was predicted using STRING (a combined score of > 0.4). Furthermore, the top 10 hub genes were screened from the PPI network complex by CytoHubba analysis. Finally, we re-analyzed the ten genes via DAVID for KEGG pathway enrichment. Four genes (IL6, MMP3, MMP1, and IL11) were found enriched in Rheumatoid arthritis, which reaches statistical significance (P<0.05), which could be regarded as diagnostic biomarkers for T2DM.
Interleukin-6 (IL6) is a cytokine that functions in inflammation and the maturation of B cells.25 Also, it plays an essential role in the final differentiation of B-cells into immunoglobulin-secreting cells which involved in lymphocyte and monocyte differentiation.26 It is discharged into the bloodstream after muscle contraction and acts to increase the breakdown of fats and improve insulin resistance. The functioning of this gene is implicated in a wide variety of inflammation-associated disease states, including susceptibility to DM27,28 and systemic juvenile rheumatoid arthritis.29 It has been reported that IL6 exerts severe effects not only in inflammation and infection but also within the nervous and endocrine systems.30 Fosgerau et al indicated that matching levels of autoantibody (aAb)-IL6 cause obesity and hyperglycemia. A small subset of T2DM may, in part, evolve from an autoimmune attack against IL6.31 Besides, analysis of specific components of the metabolic syndrome revealed a higher prevalence of insulin resistance and dyslipidemia among IL6 −174 G-allele carriers.32 IL6 is a critical inflammatory player altered in monocytes from T2DM patients. Both hyperinsulinemia and hyperglycemia contribute to changing the expression of these genes.33
Matrix metallopeptidase 3 (MMP3) gene is a part of a cluster of MMP genes that are localized to chromosome 11q22.2. MMP3 can degrade fibronectin, laminin, gelatins of type I, III, IV, and V, activates procollagenase. A study tested the hypothesis that the rs3025058 of the MMP3 gene may be a genetic marker of subclinical carotid and coronary atherosclerosis in patients with T2DM.34 Van der Leeuw et al evaluated the ability of 23 novel biomarkers representing several pathophysiological pathways to improve the prediction of cardiovascular event (CVE) risk in patients with T2DM. Results presented that MMP3 improved CVE risk prediction in 2 separate cohorts of patients with T2DM beyond traditional risk factors.35
MMP1 gene is part of a cluster of MMP genes on chromosome 11. It is often up-regulated in several cancers, and this enzyme is involved in tumor-induced angiogenesis.36 Tumor-derived MMP1 can activate endothelial PAR1 to induce the destruction of the vascular endothelial barrier and increases vascular permeability.37,38 MMP1 has been demonstrated to be involved in developing insulin resistance and T2DM. Compared with the non-diabetic controls, MMP1 expression in vitreous specimens collected from patients with diabetic retinopathy was up-regulated. Hence, the interaction between MMP1, thrombin, PAR1, and VEGF may promote angiogenesis in these patients.39 Furthermore, compared with the healthy control group, the expression of MMP1 in the blood of T2DM patients was significantly enhanced.40
The protein encoded by interleukin-11 (IL11) gene is a member of the gp130 family of cytokines. It can promote the proliferation of hematopoietic stem cells and megakaryocyte progenitor cells, accelerate the maturation of megakaryocytes and thus increase the production of platelets.41 It also promotes the spread of hepatocytes in response to liver damage. Binding to its receptor formed by IL6ST and either IL11RA1 or IL11RA2 activates a signaling cascade that promotes cell proliferation.42 IL11 has been recognized for its role in tumorigenesis and is produced by cancer-associated fibroblasts, which are up-regulated in cancer cells.43 Reported that hyperglycemia can promote the secretion of TGFβ1 and IL11 and promote diabetic myocardial fibrosis.44
The re-analysis results showed that the Rheumatoid arthritis pathway displayed the most significant difference among all signaling pathways. Rheumatoid arthritis (RA) is a chronic autoimmune joint disease where persistent inflammation affects bone remodeling and leads to progressive bone destruction. Multiple studies have indicated that the inflammation mediators involved in RA are associated with T2DM.45 Previous studies predicted that TGM2, NF-кB, p38MAPK, TNF and CEBPA were the central regulators in the shared molecular pathways of RA and T2DM.46 Almost all DEGs were up-regulated both in RA and T2DM, indicating the interaction of inflammatory cytokines in the two diseases. This may be a new discovery of the T2DM pathological mechanism.
Conclusion
In conclusion, we identified DEGs by bioinformatics network analysis to find essential genes involved in the progression of T2DM. Our study predicted four useful DEGs (IL6, MMP3, MMP1, and IL11) and these predictions should be confirmed by a series of biological experiments in the future. These findings may provide some valuable approaches and direction for the precision medicine and molecular mechanisms of T2DM.
Acknowledgments
This study was supported by the National Natural Science Foundation of China (No. 81603574, No.81774286), Major Natural Science Research Projects of Colleges and Universities in Anhui Province (No. KJ2018ZD029), and the second batch of scientific research projects for the construction of the National Traditional Chinese Medicine Clinical Research Base Business (JDZX2015123).
Disclosure
The authors report no conflicts of interest in this work.
References
1. Dogruel H, Balci MK. Development of therapeutic options on type 2 diabetes in years: glucagon-like peptide-1 receptor agonist’s role in treatment; from the past to future. World J Diabetes. 2019;10(8):446–453. doi:10.4239/wjd.v10.i8.446
2. Zhong M, Wu Y, Ou W, Huang L, Yang L. Identification of key genes involved in type 2 diabetic islet dysfunction: a bioinformatics study. Biosci Rep. 2019;39(5). doi:10.1042/BSR20182172
3. Brunetti A, Chiefari E, Foti D. Recent advances in the molecular genetics of type 2 diabetes mellitus. World J Diabetes. 2014;5(2):128–140. doi:10.4239/wjd.v5.i2.128
4. Wang N, Zhu F, Chen L, Chen K. Proteomics, metabolomics and metagenomics for type 2 diabetes and its complications. Life Sci. 2018;212:194–202. doi:10.1016/j.lfs.2018.09.035
5. Harding JL, Pavkov ME, Magliano DJ, Shaw JE, Gregg EW. Global trends in diabetes complications: a review of current evidence. Diabetologia. 2019;62(1):3–16. doi:10.1007/s00125-018-4711-2
6. Ashcroft FM, Rorsman P. Diabetes mellitus and the beta cell: the last ten years. Cell. 2012;148(6):1160–1171. doi:10.1016/j.cell.2012.02.010
7. Jia K, Wu Y, Ju J, et al. The identification of gene signature and critical pathway associated with childhood-onset type 2 diabetes. PeerJ. 2019;7:e6343. doi:10.7717/peerj.6343
8. Ding LC, Fan L, Xu XD, Fu JF, Xue YD. Identification of core genes and pathways in type 2 diabetes mellitus by bioinformatics analysis. Mol Med Rep. 2019;20(3):2597–2608. doi:10.3892/mmr.2019.10522
9. Taneera J, Fadista J, Ahlqvist E, et al. Identification of novel genes for glucose metabolism based upon expression pattern in human islets and effect on insulin secretion and glycemia. Hum Mol Genet. 2015;24(7):1945–1955. doi:10.1093/hmg/ddu610
10. Taneera J, Lang S, Sharma A, et al. A systems genetics approach identifies genes and pathways for type 2 diabetes in human islets. Cell Metab. 2012;16(1):122–134. doi:10.1016/j.cmet.2012.06.006
11. Taneera J, Fadista J, Ahlqvist E, et al. Expression profiling of cell cycle genes in human pancreatic islets with and without type 2 diabetes. Mol Cell Endocrinol. 2013;375(1–2):35–42. doi:10.1016/j.mce.2013.05.003
12. Edgar R, Domrachev M, Lash AE. Gene expression omnibus: NCBI gene expression and hybridization array data repository. Nucleic Acids Res. 2002;30(1):207–210. doi:10.1093/nar/30.1.207
13. Ashburner M, Ball CA, Blake JA, et al. Gene Ontology: tool for the unification of biology. Nat Genet. 2000;25(1):25–29. doi:10.1038/75556
14. Kanehisa M, Goto S. KEGG: kyoto encyclopedia of genes and genomes. Nucleic Acids Res. 2000;28(1):27–30. doi:10.1093/nar/28.1.27
15. Jiao XL, Sherman BT, Huang DW, et al. DAVID-WS: a stateful web service to facilitate gene/protein list analysis. Bioinformatics. 2012;28(13):1805–1806. doi:10.1093/bioinformatics/bts251
16. Szklarczyk D, Franceschini A, Wyder S, et al. STRING v10: protein-protein interaction networks, integrated over the tree of life. Nucleic Acids Res. 2015;43(Database issue):D447–52. doi:10.1093/nar/gku1003
17. Saito R, Smoot ME, Ono K, et al. A travel guide to cytoscape plugins. Nat Methods. 2012;9(11):1069–1076. doi:10.1038/nmeth.2212
18. Chin CH, Chen SH, Wu HH, Ho CW, Ko MT, Lin CY. cytoHubba: identifying hub objects and sub-networks from complex interactome. BMC Syst Biol. 2014;8(Suppl 4):S11. doi:10.1186/1752-0509-8-S4-S11
19. Chen L, Magliano DJ, Zimmet PZ. The worldwide epidemiology of type 2 diabetes mellitus–present and future perspectives. Nat Rev Endocrinol. 2011;8(4):228–236. doi:10.1038/nrendo.2011.183
20. Fonseca VA. Identification and treatment of prediabetes to prevent progression to type 2 diabetes. Clin Cornerstone. 2007;8(2):
21. Zhao QQ, Zhang AH, Zong WJ, et al. Exploring potential biomarkers and determining the metabolic mechanism of type 2 diabetes mellitus using liquid chromatography coupled to high-resolution mass spectrometry. RSC Adv. 2017;7(70):44186–44198. doi:10.1039/C7RA05722A
22. Zhou H, Zhang WC. Gene expression profiling reveals candidate biomarkers and probable molecular mechanism in diabetic peripheral neuropathy. Diabetes Metab Syndr. 2019;12:1213–1223. doi:10.2147/DMSO.S209118
23. Li L, Lei QS, Zhang SJ, Kong LN, Qin B. Screening and identification of key biomarkers in hepatocellular carcinoma: evidence from bioinformatic analysis. Oncol Rep. 2017;38(5):2607–2618. doi:10.3892/or.2017.5946
24. Xiong Y, Mi BB, Liu MF, Xue H, Wu QP, Liu GH. Bioinformatics analysis and identification of genes and molecular pathways involved in synovial inflammation in rheumatoid arthritis. Med Sci Monit. 2019;25:2246–2256. doi:10.12659/MSM.915451
25. Choy E, Rose-John S. Interleukin-6 as a multifunctional regulator: inflammation, immune response, and fibrosis. J Scleroderma Relat Disord. 2017;2(2_suppl):S1–S5.
26. Tanaka T, Narazaki M, Kishimoto T. IL-6 in inflammation, immunity, and disease. Cold Spring Harb Perspect Biol. 2014;6(10):a016295. doi:10.1101/cshperspect.a016295
27. Qu D, Liu J, Lau CW, Huang Y. IL-6 in diabetes and cardiovascular complications. Br J Pharmacol. 2014;171(15):3595–3603. doi:10.1111/bph.12713
28. Giulietti A, van Etten E, Overbergh L, Stoffels K, Bouillon R, Mathieu C. Monocytes from type 2 diabetic patients have a pro-inflammatory profile. 1,25-Dihydroxyvitamin D(3) works as anti-inflammatory. Diabetes Res Clin Pract. 2007;77(1):47–57. doi:10.1016/j.diabres.2006.10.007
29. Woodrick RS, Ruderman EM. Interleukin 6 inhibition - RA and beyond. Bull NYU Hosp Jt Dis. 2011;69(3):225–229.
30. Huth C, Heid IM, Vollmert C, et al. IL6 gene promoter polymorphisms and type 2 diabetes - joint analysis of individual participants’ data from 21 studies. Diabetes. 2006;55(10):2915–2921. doi:10.2337/db06-0600
31. Fosgerau K, Galle P, Hansen T, et al. Interleukin-6 autoantibodies are involved in the pathogenesis of a subset of type 2 diabetes. J Endocrinol. 2010;204(3):265–273. doi:10.1677/JOE-09-0413
32. Hamid YH, Rose CS, Urhammer SA, et al. Variations of the interleukin-6 promoter are associated with features of the metabolic syndrome in Caucasian Danes. Diabetologia. 2005;48(2):251–260. doi:10.1007/s00125-004-1623-0
33. Bernal-Lopez MR, Llorente-Cortes V, Calleja F, et al. Effect of different degrees of impaired glucose metabolism on the expression of inflammatory markers in monocytes of patients with atherosclerosis. Acta Diabetol. 2013;50(4):553–562. doi:10.1007/s00592-011-0337-2
34. Pleskovic A, Letonja MS, Vujkovac AC, et al. Matrix metalloproteinase-3 gene polymorphism (rs3025058) affects markers atherosclerosis in type 2 diabetes mellitus. Vasa. 2017;46(5):363–369. doi:10.1024/0301-1526/a000637
35. van der Leeuw J, Beulens JWJ, van Dieren S, et al. Novel biomarkers to improve the prediction of cardiovascular event risk in type 2 diabetes mellitus. J Am Heart Assoc. 2016;5(6). doi:10.1161/JAHA.115.003048
36. Deryugina EI, Quigley JP. Tumor angiogenesis: MMP-mediated induction of intravasation- and metastasis-sustaining neovasculature. Matrix Biol. 2015;44–46:94–112. doi:10.1016/j.matbio.2015.04.004
37. Pulukuri SMK, Rao JS. Matrix metalloproteinase-1 promotes prostate tumor growth and metastasis. Int J Oncol. 2008;32(4):757–765.
38. Macarie RD, Vadana M, Ciortan L, et al. The expression of MMP-1 and MMP-9 is up-regulated by smooth muscle cells after their cross-talk with macrophages in high glucose conditions. J Cell Mol Med. 2018;22(9):4366–4376. doi:10.1111/jcmm.13728
39. Abu El-Asrar AM, Alam K, Nawaz MI, et al. Upregulation of thrombin/matrix metalloproteinase-1/protease-activated receptor-1 chain in proliferative diabetic retinopathy. Curr Eye Res. 2016;41(12):1590–1600. doi:10.3109/02713683.2016.1141964
40. Stoynev N, Dimova I, Rukova B, et al. Gene expression in peripheral blood of patients with hypertension and patients with type 2 diabetes. J Cardiovasc Med (Hagerstown). 2014;15(9):702–709. doi:10.2459/JCM.0b013e32835dbcc8
41. Paul SR, Bennett F, Calvetti JA, et al. Molecular-cloning of a cDNA-encoding interleukin-11, a stromal cell-derived lymphopoietic and hematopoietic cytokine. Proc Natl Acad Sci USA. 1990;87(19):7512–7516. doi:10.1073/pnas.87.19.7512
42. Harmegnies D, Wang XM, Vandenbussche P, et al. Characterization of a potent human interleukin-11 agonist. Biochem J. 2003;375:23–32. doi:10.1042/bj20030459
43. Liao CW, Hu SQ, Zheng ZH, Tong HZ. Contribution of interaction between genetic variants of interleukin-11 and helicobacter pylori infection to the susceptibility of gastric cancer. Once targets Ther. 2019;12:7459–7466. doi:10.2147/OTT.S214238
44. Schafer S, Viswanathan S, Widjaja AA, et al. IL-11 is a crucial determinant of cardiovascular fibrosis. Nature. 2017;552(7683):
45. Nicolau J, Lequerre T, Bacquet H, Vittecoq O. Rheumatoid arthritis, insulin resistance, and diabetes. Joint Bone Spine. 2017;84(4):411–416. doi:10.1016/j.jbspin.2016.09.001
46. Niu X, Lu C, Xiao C, et al. The crosstalk of pathways involved in immune response maybe the shared molecular basis of rheumatoid arthritis and type 2 diabetes. PLoS One. 2015;10(8):e0134990. doi:10.1371/journal.pone.0134990
 © 2020 The Author(s). This work is published and licensed by Dove Medical Press Limited. The full terms of this license are available at https://www.dovepress.com/terms.php and incorporate the Creative Commons Attribution - Non Commercial (unported, v3.0) License.
By accessing the work you hereby accept the Terms. Non-commercial uses of the work are permitted without any further permission from Dove Medical Press Limited, provided the work is properly attributed. For permission for commercial use of this work, please see paragraphs 4.2 and 5 of our Terms.
© 2020 The Author(s). This work is published and licensed by Dove Medical Press Limited. The full terms of this license are available at https://www.dovepress.com/terms.php and incorporate the Creative Commons Attribution - Non Commercial (unported, v3.0) License.
By accessing the work you hereby accept the Terms. Non-commercial uses of the work are permitted without any further permission from Dove Medical Press Limited, provided the work is properly attributed. For permission for commercial use of this work, please see paragraphs 4.2 and 5 of our Terms.