")
Back to Journals » Cancer Management and Research » Volume 11
Identification of hub genes and outcome in colon cancer based on bioinformatics analysis
Authors Yang W, Ma J, Zhou W , Li Z, Zhou X, Cao B, Zhang Y, Liu J , Yang Z, Zhang H, Zhao Q, Hong L, Fan D
Received 6 May 2018
Accepted for publication 29 October 2018
Published 27 December 2018 Volume 2019:11 Pages 323—338
DOI https://doi.org/10.2147/CMAR.S173240
Checked for plagiarism Yes
Review by Single anonymous peer review
Peer reviewer comments 4
Editor who approved publication: Dr Beicheng Sun
Wanli Yang,1,* Jiaojiao Ma,1,* Wei Zhou,1,* Zichao Li,2 Xin Zhou,2 Bo Cao,2 Yujie Zhang,1 Jinqiang Liu,1 Zhiping Yang,1 Hongwei Zhang,3 Qingchuan Zhao,3 Liu Hong,1 Daiming Fan1
1State Key Laboratory of Cancer Biology, National Clinical Research Center for Digestive Diseases, Xijing Hospital of Digestive Diseases, Air Force Military Medical University, Xi’an, China; 2The First Brigade of Student, Air Force Military Medical University, Xi’an, China; 3Department of Digestive Surgery, Xijing Hospital, Air Force Military Medical University, Xi’an, China
*These authors contributed equally to this work
Background: Colon cancer is one of the leading malignant neoplasms worldwide. Until now, the concrete mechanisms of colonic cancerogenesis are largely unknown; identification of driven genes and pathways is, therefore, of great importance for monitoring and conquering this disease. This study aims to explore the potential biomarkers and therapeutic targets for colon cancer treatment.
Methods: The gene expression profile of GSE44076 from Gene Expression Omnibus database, including 98 primary colon cancers and 98 normal distant colon mucosa, was deeply analyzed. GEO2R tool was used to screen the differentially expressed genes (DEGs) between colon cancer tissues and normal samples. Gene Ontology analysis and Kyoto Encyclopedia of Genes and Genomes pathway analysis were performed for screening DEGs using Database for Annotation, Visualization and Integrated Discovery database and Panther database. Moreover, Search Tool for the Retrieval of Interacting Genes, Cytoscape software, and Molecular Complex Detection plug-in were used to visualize the protein–protein interaction of these DEGs.
Results: A total of 497 DEGs were obtained, including 129 upregulated genes mainly enriched in Hippo signaling pathway, Wnt signaling pathway, and cytokine–cytokine receptor interaction and 368 downregulated genes enriched in retinol metabolism, steroid hormone biosynthesis, drug metabolism, and chemical carcinogenesis. Using Molecular Complex Detection software, three important modules were selected from the protein–protein interaction network. Moreover, 20 hub genes with high degree of connectivity were selected, including COL1A1, CXCL5, GNG4, TIMP1, and so on. The Kaplan–Meier analysis for overall survival and correlation analysis were applied among the hub genes.
Conclusion: Taken together, DEGs, especially the hub genes such as COL1A1, might be the driven genes in colon cancer progression. More importantly, they might be the novel biomarkers for diagnosis and guiding therapeutic strategies of colon cancer.
Keywords: colon cancer, protein–protein interaction, bioinformatics analysis, diagnosis, prognosis
Introduction
Colon cancer is one of the leading tumors of gastrointestinal tract worldwide.1 In 2017, there were an estimated 135,430 new cases with 50,260 deaths from this disease in USA.2 As one of the multifactorial diseases, risk factors such as drinking alcohol, red and processed meat consumption, older age, and family history are closely corrected with the incidence of colon cancer.2 Many therapeutic methods, including surgical resection, chemotherapy, as well as radiotherapy, are widely used for treating colon cancer.3 The prognosis of colon cancer is strongly associated with the stage of the disease at diagnosis. Also, due to the lack of effective methods for early detection, patients are usually diagnosed at an advanced stage, thus leading to a particularly poor prognosis.4,5 Even worse, most of the patients with advanced colon cancer usually suffer tumor recurrence due to drug resistance.6 Also, these patients are not responsive to novel immune checkpoint therapy.7 Therefore, it is of paramount importance to explore specific early diagnostic biomarkers and effective therapeutic targets.
Molecular biomarkers have potential values as diagnostic and prognostic tools in colon cancer. Recently, several markers have been utilized for the screening and diagnosis of colon cancer. For example, the level of carcinoembryonic antigen is closely correlated to the lymph node metastasis and tumor stage in cancers and it can be used as a screening marker for colon cancer patients.8 The expression of epidermal growth factor receptor, vascular endothelial growth factor, and proliferating cell nuclear antigen in colon cancer is significantly associated with the survival rate.9 In terms of miRNA biomarkers, the combination of miR-378, miR-199a, and miR-92a in plasma is considered as an effective method to distinguish colon cancer cases from normal controls.10 However, these indicators are not suitable for clinical practice owing to their low specificity, oversensitivity (can be elevated in many types of tumors), and lack of clinical evidence. Accordingly, it was necessary to investigate the molecular mechanisms in colon cancer and to detect novel and specific biomarkers and targets.
In recent years, high-throughput sequencing and gene profile have been widely used in life sciences.11,12 Gene expression analysis based on bioinformatics analysis can find many differentially expressed genes (DEGs) which play critical roles in tumor initiation and progression. Some of the DEGs are even considered as potential molecular targets and diagnostic biomarkers. However, most of these data were only left to molder or uploaded to public databases after the projects were finished. Reanalyzing the data for new researches, therefore, might be an economical and efficient method since some studies have been carried out on gastric cancer and breast cancer.13,14
In this study, we have downloaded GSE44076 from Gene Expression Omnibus (GEO) database and utilized GEO2R online tool to identify the DEGs between colon cancer and normal tissues. Additionally, other approaches including Gene Ontology (GO) and Kyoto Encyclopedia of Genes and Genomes (KEGG) pathway analysis, protein–protein interaction (PPI) network construction, sub-modules analysis, overall survival (OS) analysis, genes correlation analysis, and construction of non-coding RNA-related regulatory network were used for analyzing these data. The aims of our study were to identify novel biomarkers and potential therapeutic targets for colon cancer.
Materials and methods
Data collection
The gene expression profile (GSE44076) of paired normal adjacent mucosa and colon cancer samples from 98 individuals based on platform of GPL13667 (Affymetrix Human Genome U219 Arrays) was downloaded from the GEO (http://www.ncbi.nlm.nih.gov/geo/)15 database, which was deposited by Sanz-Pamplona et al.16 In this study, colon cancer and paired adjacent (~5–10 cm) pathologically normal mucosa tissue samples were obtained from the patients with histologically confirmed diagnoses of colon adenocarcinoma. The adjacent mucosa tissue samples were taken from the proximal resection margin (~5–10 cm). All cases were from a homogenous series of early-stage (II) patients without receiving chemotherapy before surgery.
Identification of DEGs
GEO2R (https://www.ncbi.nlm.nih.gov/geo/geo2r/)17 is an online tool that allows researchers to compare samples from two or more groups in a GEO series. Moreover, GEO2R can analyze most GEO series with gene symbol. We, therefore, used it to screen out the DEGs between colon cancer samples and normal samples; the cutoff criteria were |logFC| ≥2 and adjusted P-value <0.05. Finally, 497 DEGs were picked out, including 129 upregulated genes and 368 downregulated genes, and the top 20 genes with high degree of connectivity were selected as the hub genes.
GO and KEGG analysis of DEGs
GO is commonly used to annotate genes from high-throughput genome or transcriptome data.18 Additionally, KEGG databases is a knowledge base used to deal with biological pathways and diseases.19 The Database for Annotation, Visualization and Integrated Discovery (DAVID, https://david.ncifcrf.gov/)20 is a functional annotation tool for multiple genes or proteins.20 P<0.05 was considered statistically significant.
PPI network and sub-modules analysis
The Search Tool for the Retrieval of Interacting Genes (STRING) is an online software that contains comprehensive information of multiple proteins and is mainly used to evaluate the PPI information.21 Cytoscape was used to visualize the PPI networks of DEGs. Confidence score ≥0.4 and maximum number of interactors =0 were selected as the cutoff criteria. The Molecular Complex Detection plug-in of Cytoscape was utilized to illuminate the biological significance of gene modules in colon cancer with degree cutoff =2, node score cutoff =0.2, k-core =2, and max. depth =100.22 Functional enrichment analysis of each module was performed by DAVID. Besides, 20 hub genes were selected in STRING following confidence score ≥0.4 and maximum number of interactors ≤5.
Validation of hub genes
The Gene Expression Profiling Interactive Analysis (GEPIA; http://gepia.cancer-pku.cn/index.html)23 is a web server for analyzing the gene expression profiles of 9,736 tumors and 8,587 normal samples from the Cancer Genome Atlas and the Genotype-Tissue Expression projects.23 It also provides functions including prognosis analysis, tumor and normal differential expression analysis, genes correlation analysis, and so on. Thus, we could verify the expression levels of hub genes in colon cancer tissues and normal tissues. The genes’ correlation analysis is also performed using this tool.
Survival analysis of hub genes
PROGgeneV2 (www.compbio.iupui.edu/proggene)24 is a database that contains over 19,000 samples from 134 cohorts in 21 cancer types. PROGgeneV2 mainly provides survival analysis based on the expression of one gene or the ratio between two genes.24 The data of PROGgeneV2 are based on GEO, the Cancer Genome Atlas database, and published papers. The HR with 95% CIs and log-rank P-value are calculated and presented on the plot.
Prediction of related non-coding RNAs of hub genes
Gene-Cloud Biotechnology information (GCBI; http://www.gcbi.com.cn/)25 is a newly developed tool which can be used for predicting the interactive regulations of genes and non-coding RNAs, genes, transcription factors, and so on. We could visualize the regulatory networks of hub genes using GCBI.
Results
Identification of DEGs and hub genes
The gene expression profile of GSE44076 between colon cancer and paired normal samples was evaluated using the GEO2R online analysis tool, following the cutoff criteria |logFC|≥2 and adjusted P-value <0.05. A total of 497 DEGs were screened, including 129 upregulated genes and 368 downregulated genes (Table 1). In addition, 20 hub genes were picked out according to the degree of connectivity (Table 2; Figure 1).
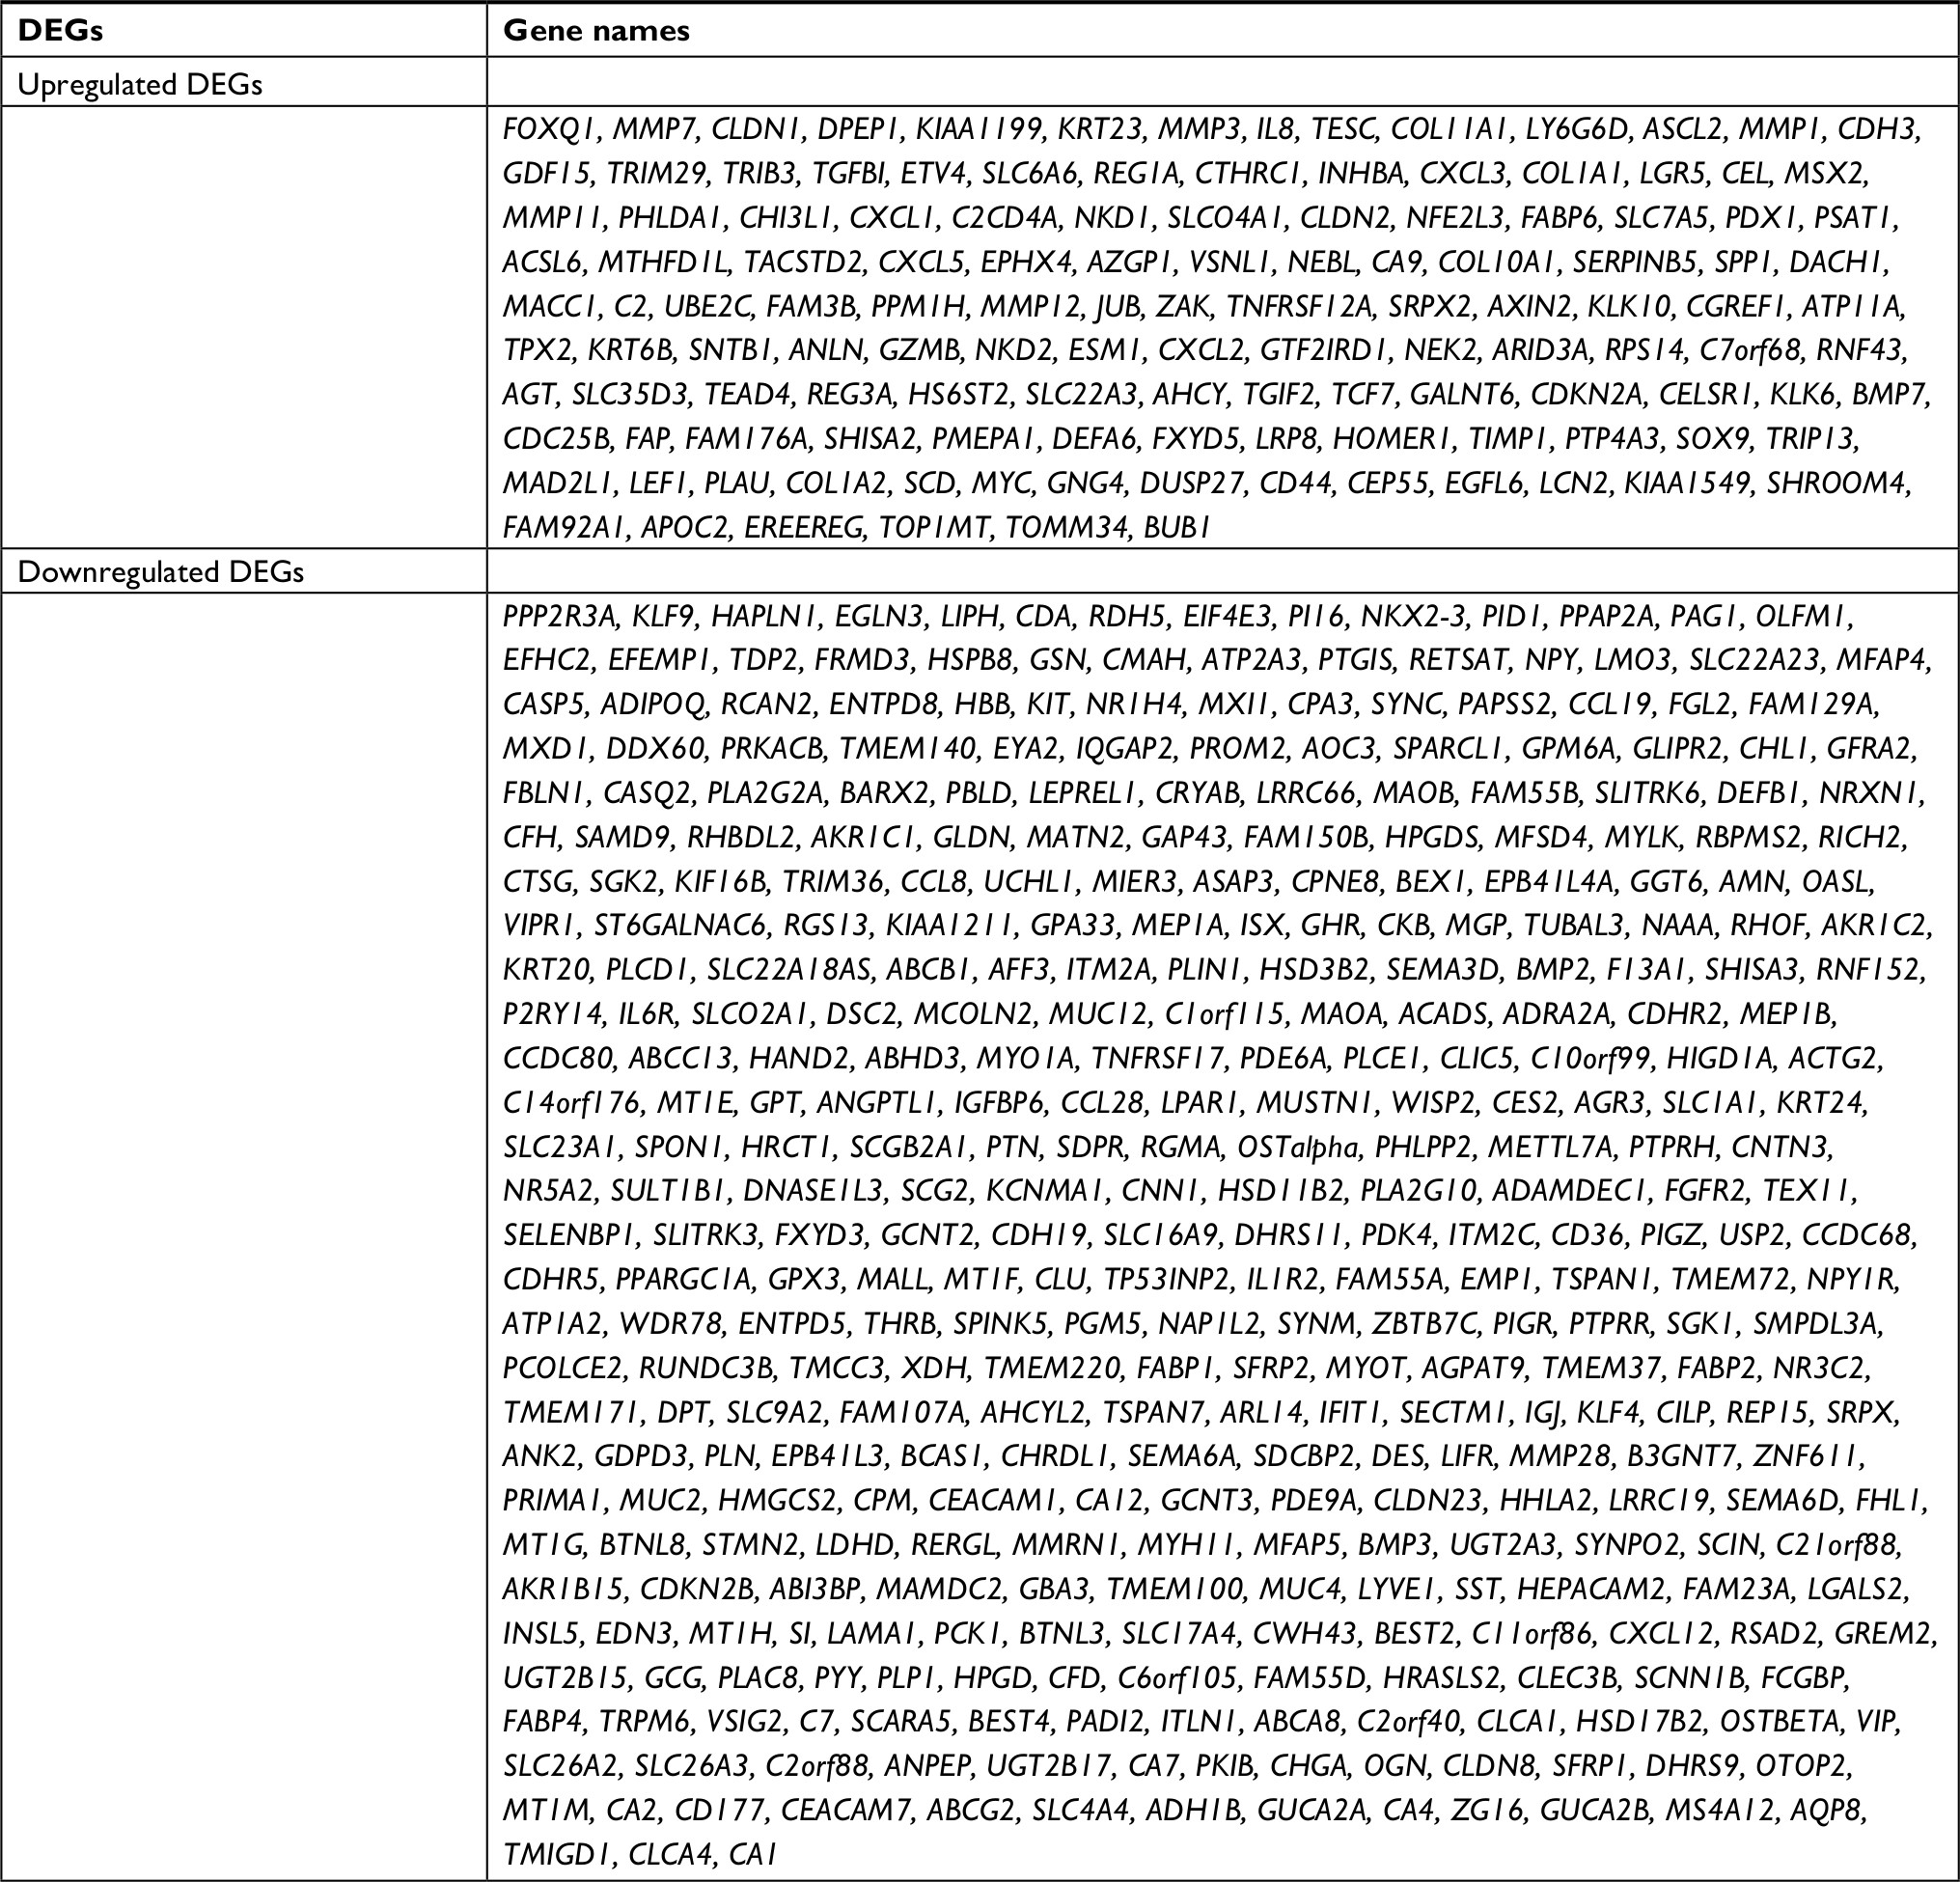 | Table 1 Four hundred ninety-seven DEGs were identified from GSE44076, including 129 upregulated genes and 368 downregulated genes in the colon cancer tissues compared to normal controls Note: The upregulated genes are listed from the largest to the smallest of fold changes, and the downregulated genes are listed from the smallest to the largest of fold changes. Abbreviation: DEGs, differentially expressed genes. |
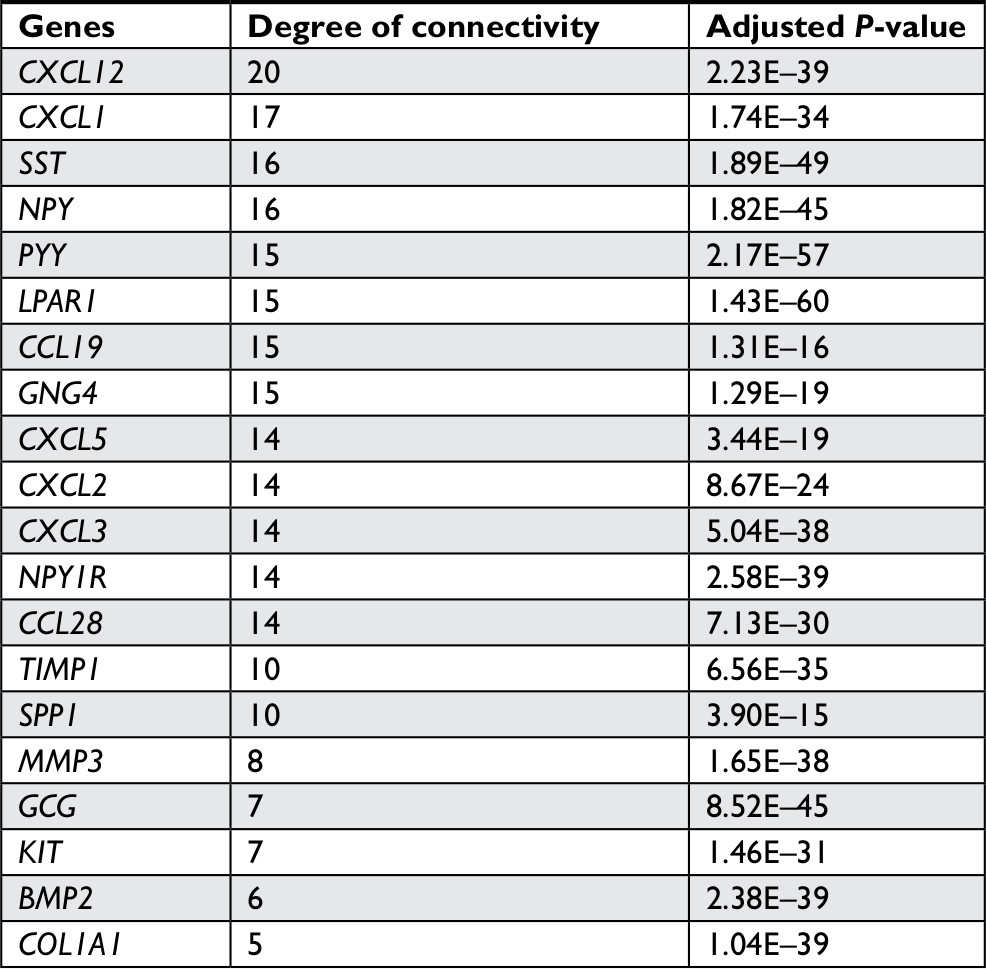 | Table 2 Top 20 hub genes with higher degree of connectivity |
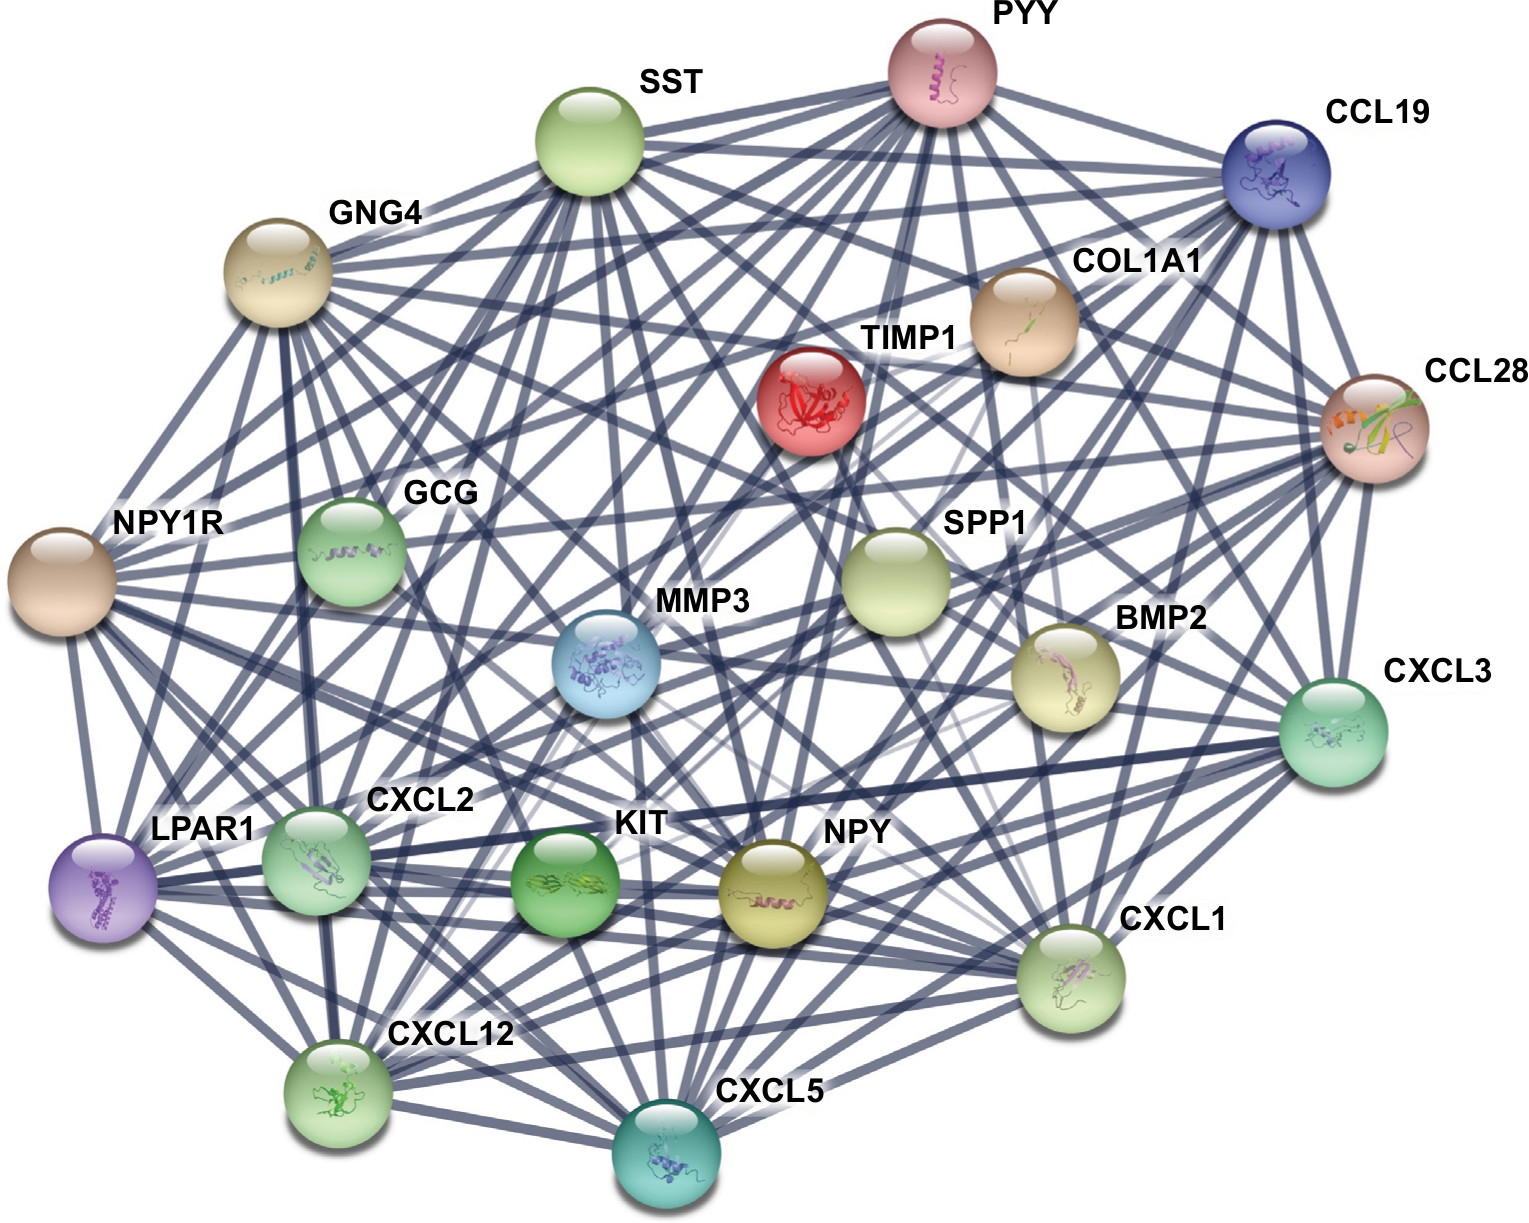 | Figure 1 The protein–protein interaction network of top 20 hub genes. Notes: The proteins encoded by the selected hub genes form the complex network by biochemical events and/or electrostatic forces. They may serve a distinct biological function as a complex in colon cancer progression. |
GO function and KEGG pathway enrichment analysis
To get a better understanding of the candidate DEGs, GO function and KEGG pathway enrichment analysis were performed using several online databases, including DAVID software, KEGG pathway (http://www.genome.jp/kegg),26 and Panther (http://www.pantherdb.org).27
GO analysis performed by DAVID and Panther classified DEGs into three functional groups: biological process group, cellular component group, and molecular function group. As shown in Figure 2, upregulated DEGs were mainly enriched in the regulation of cell proliferation, cell cycle, cell cycle process, and biological adhesion in biological process, whereas downregulated DEGs referred to biological adhesion, cell adhesion, and chemical homeostasis (Figure 2). As for the cellular component analysis, the upregulated DEGs were significantly enriched in the extracellular region, extracellular region part, and extracellular space and the downregulated DEGs were enriched in the extracellular region, extracellular region part, and cell fraction. In addition, the data of molecular function displayed that the upregulated DEGs were significantly enriched in endopeptidase activity, cytokine activity, and growth factor activity (Figure 2), while the downregulated DEGs were enriched in calcium ion binding, carboxylic acid binding, and monocarboxylic acid binding (Figure 2).
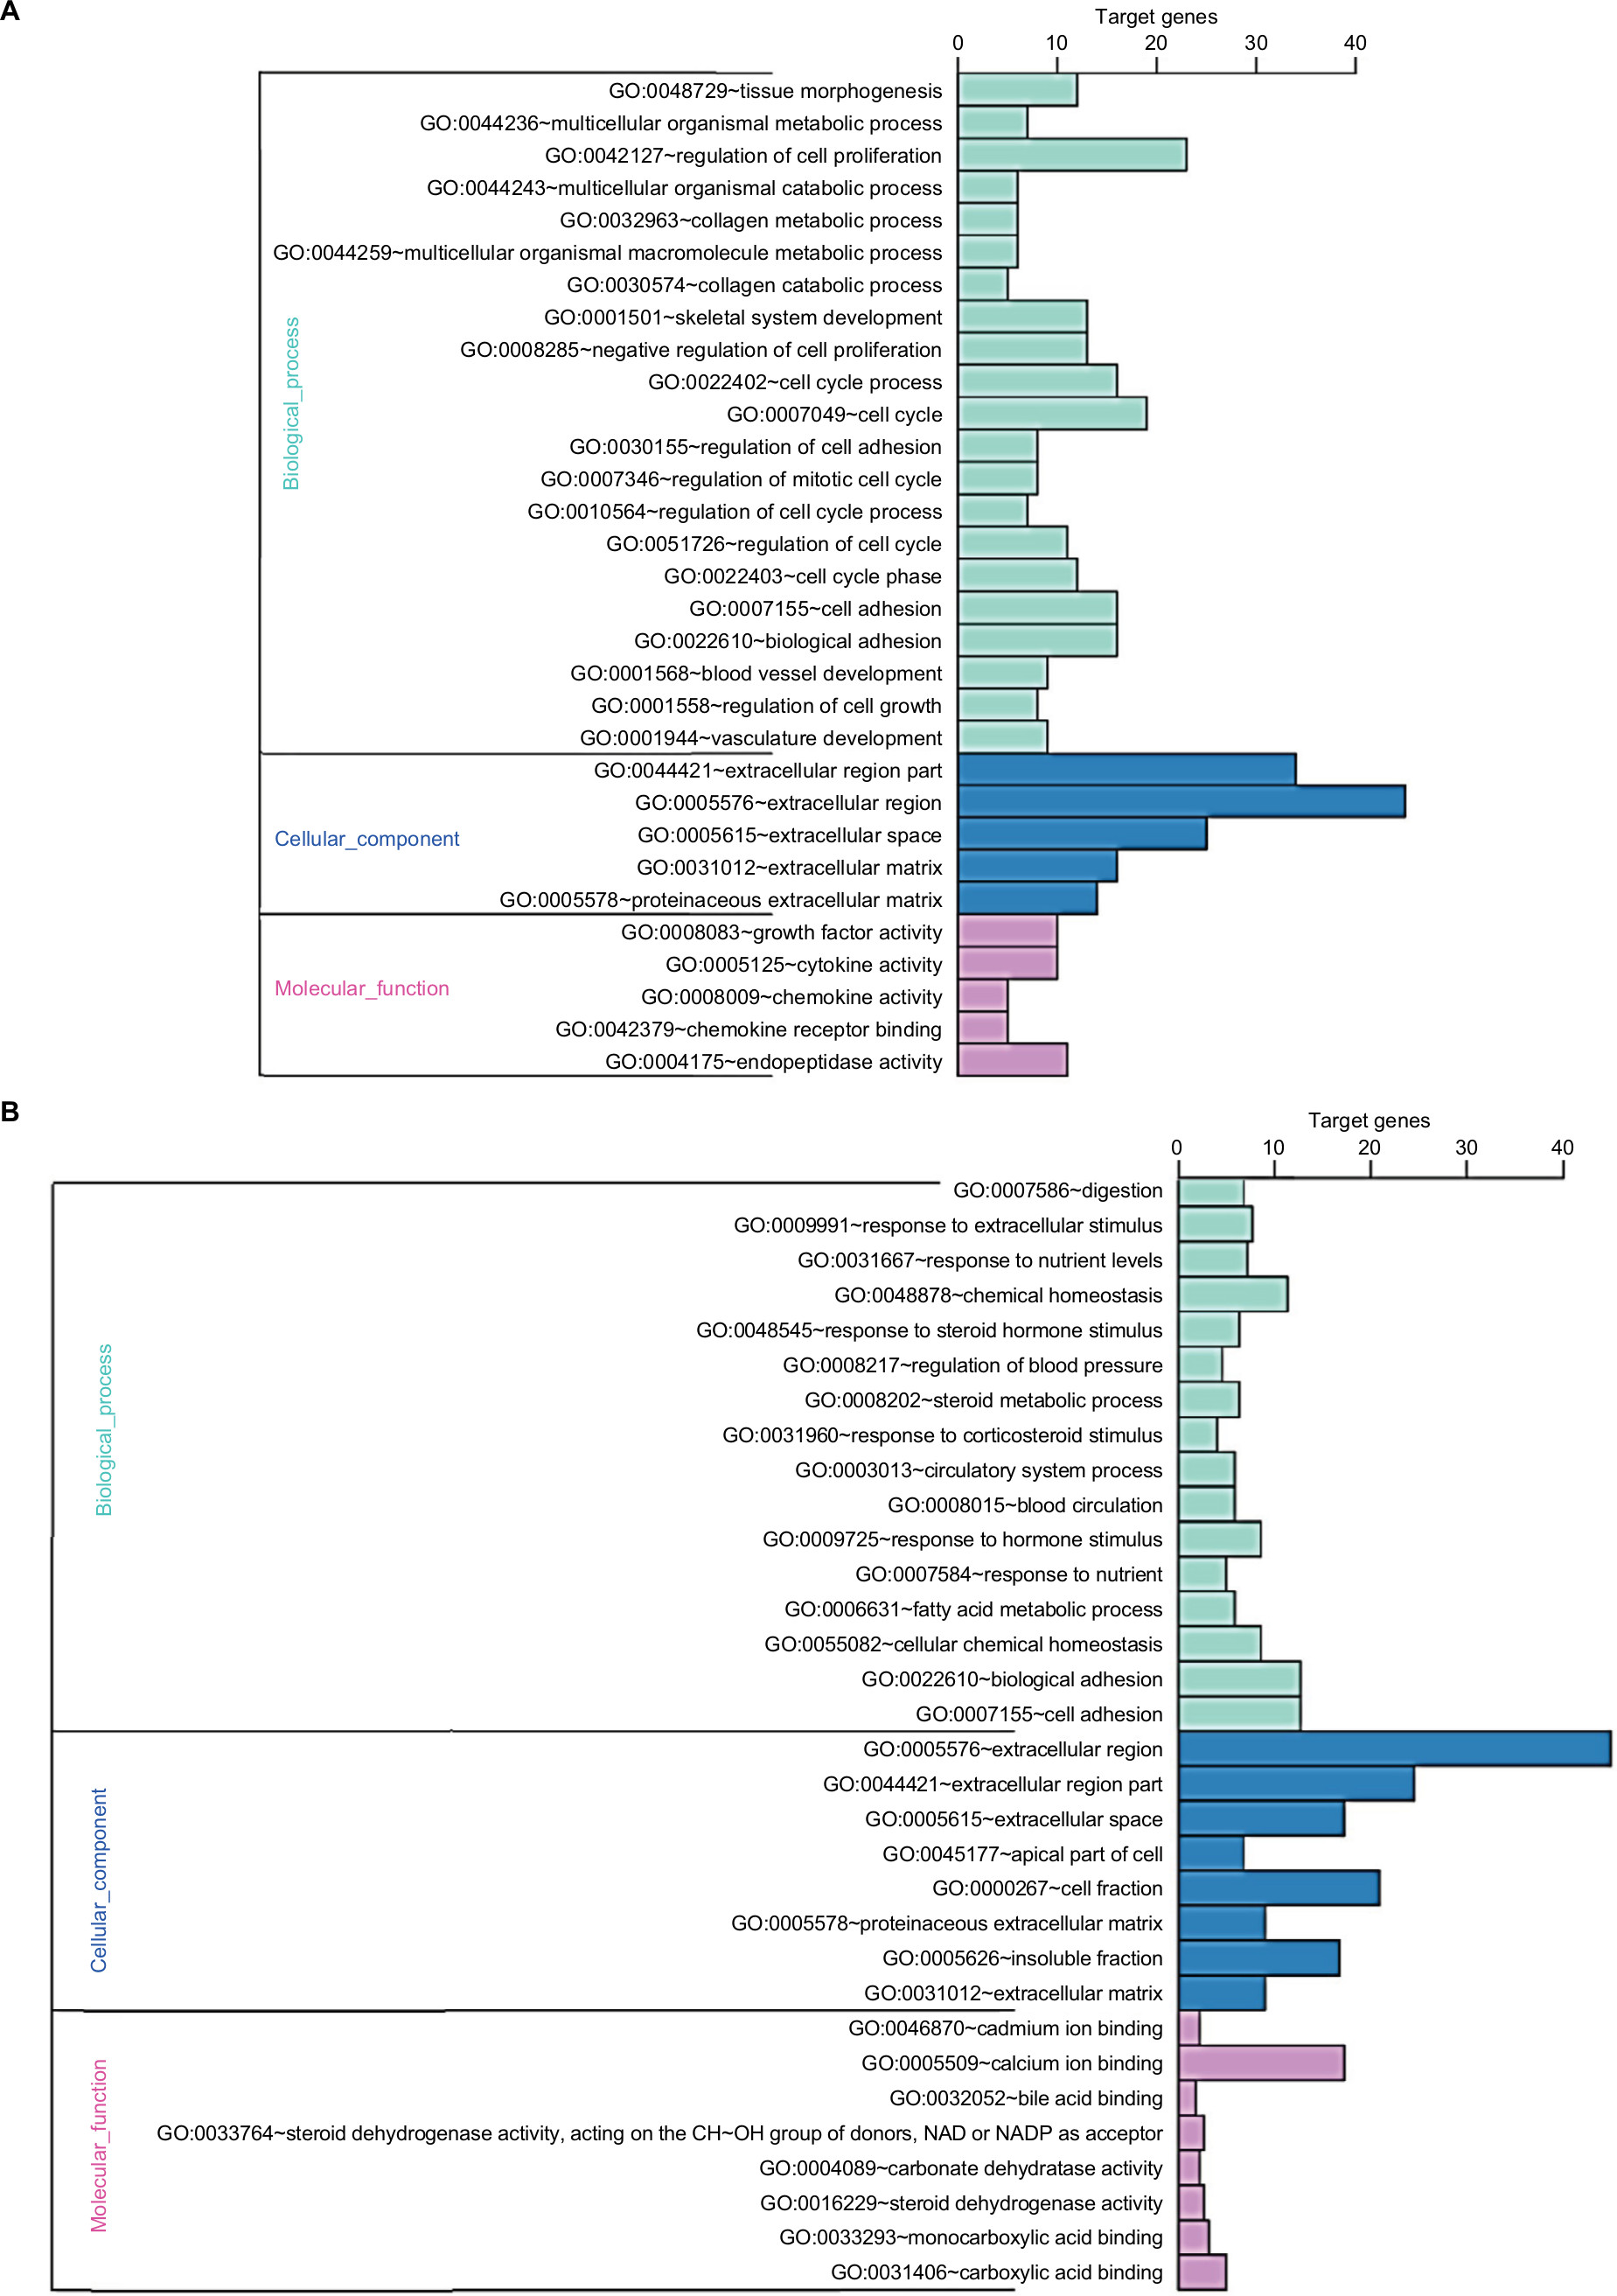 | Figure 2 GO enrichment analysis results of DEGs in colon cancer. Notes: (A) GO enrichment analysis results of upregulated DEGs in colon cancer. (B) GO enrichment analysis results of downregulated DEGs in colon cancer. The significant enriched GO terms of DEGs in colon cancer were based on their functions. Abbreviations: DEGs, differentially expressed genes; GO, Gene Ontology. |
Table 3 and Figure 3 present the significantly enriched KEGG pathway terms of the upregulated and downregulated DEGs. The upregulated DEGs were significantly enriched in Hippo signaling pathway, Wnt signaling pathway, and cytokine–cytokine receptor interaction (Figure 3A), while the downregulated DEGs were enriched in retinol metabolism, steroid hormone biosynthesis, drug metabolism, and chemical carcinogenesis (Figure 3B). These enriched terms and pathways might provide an insight toward further research directions about the role of DEGs in colon cancer progression.
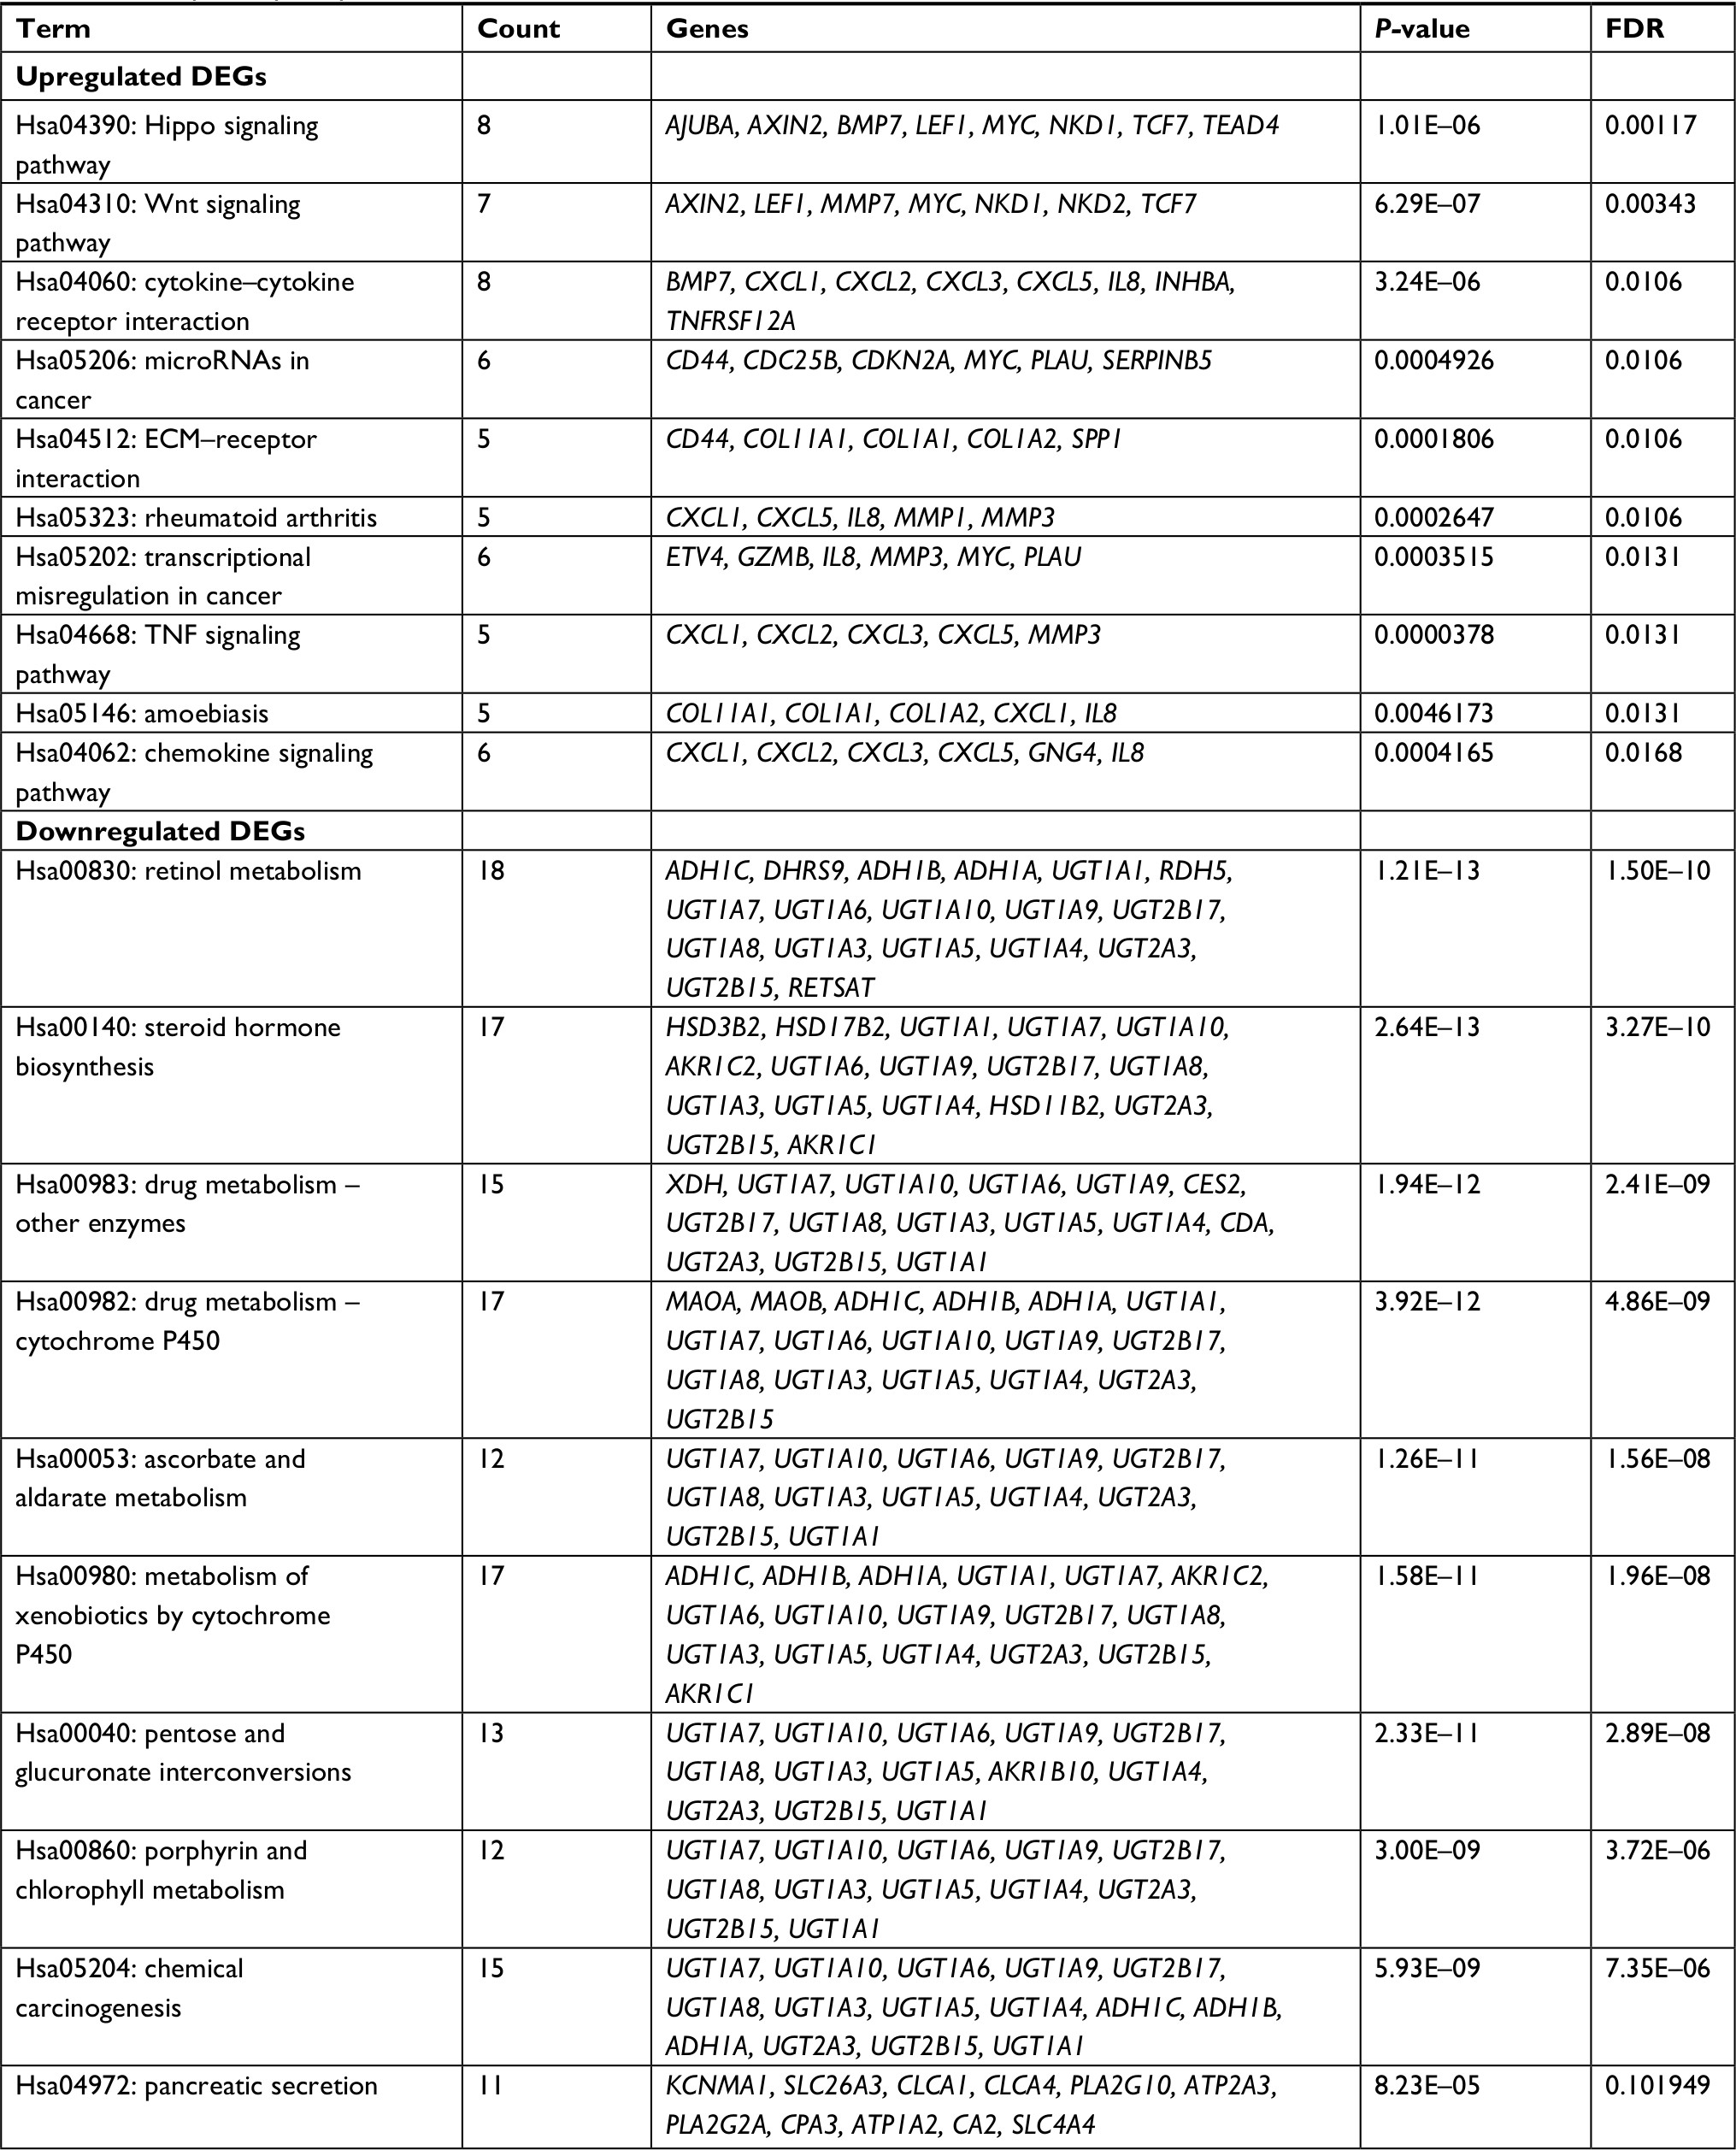 | Table 3 KEGG pathway analysis of DEGs associated with colon cancer Abbreviations: DEGs, differentially expressed genes; ECM, extracellular matrix; FDR, false discovery rate; KEGG, Kyoto Encyclopedia of Genes and Genomes. |
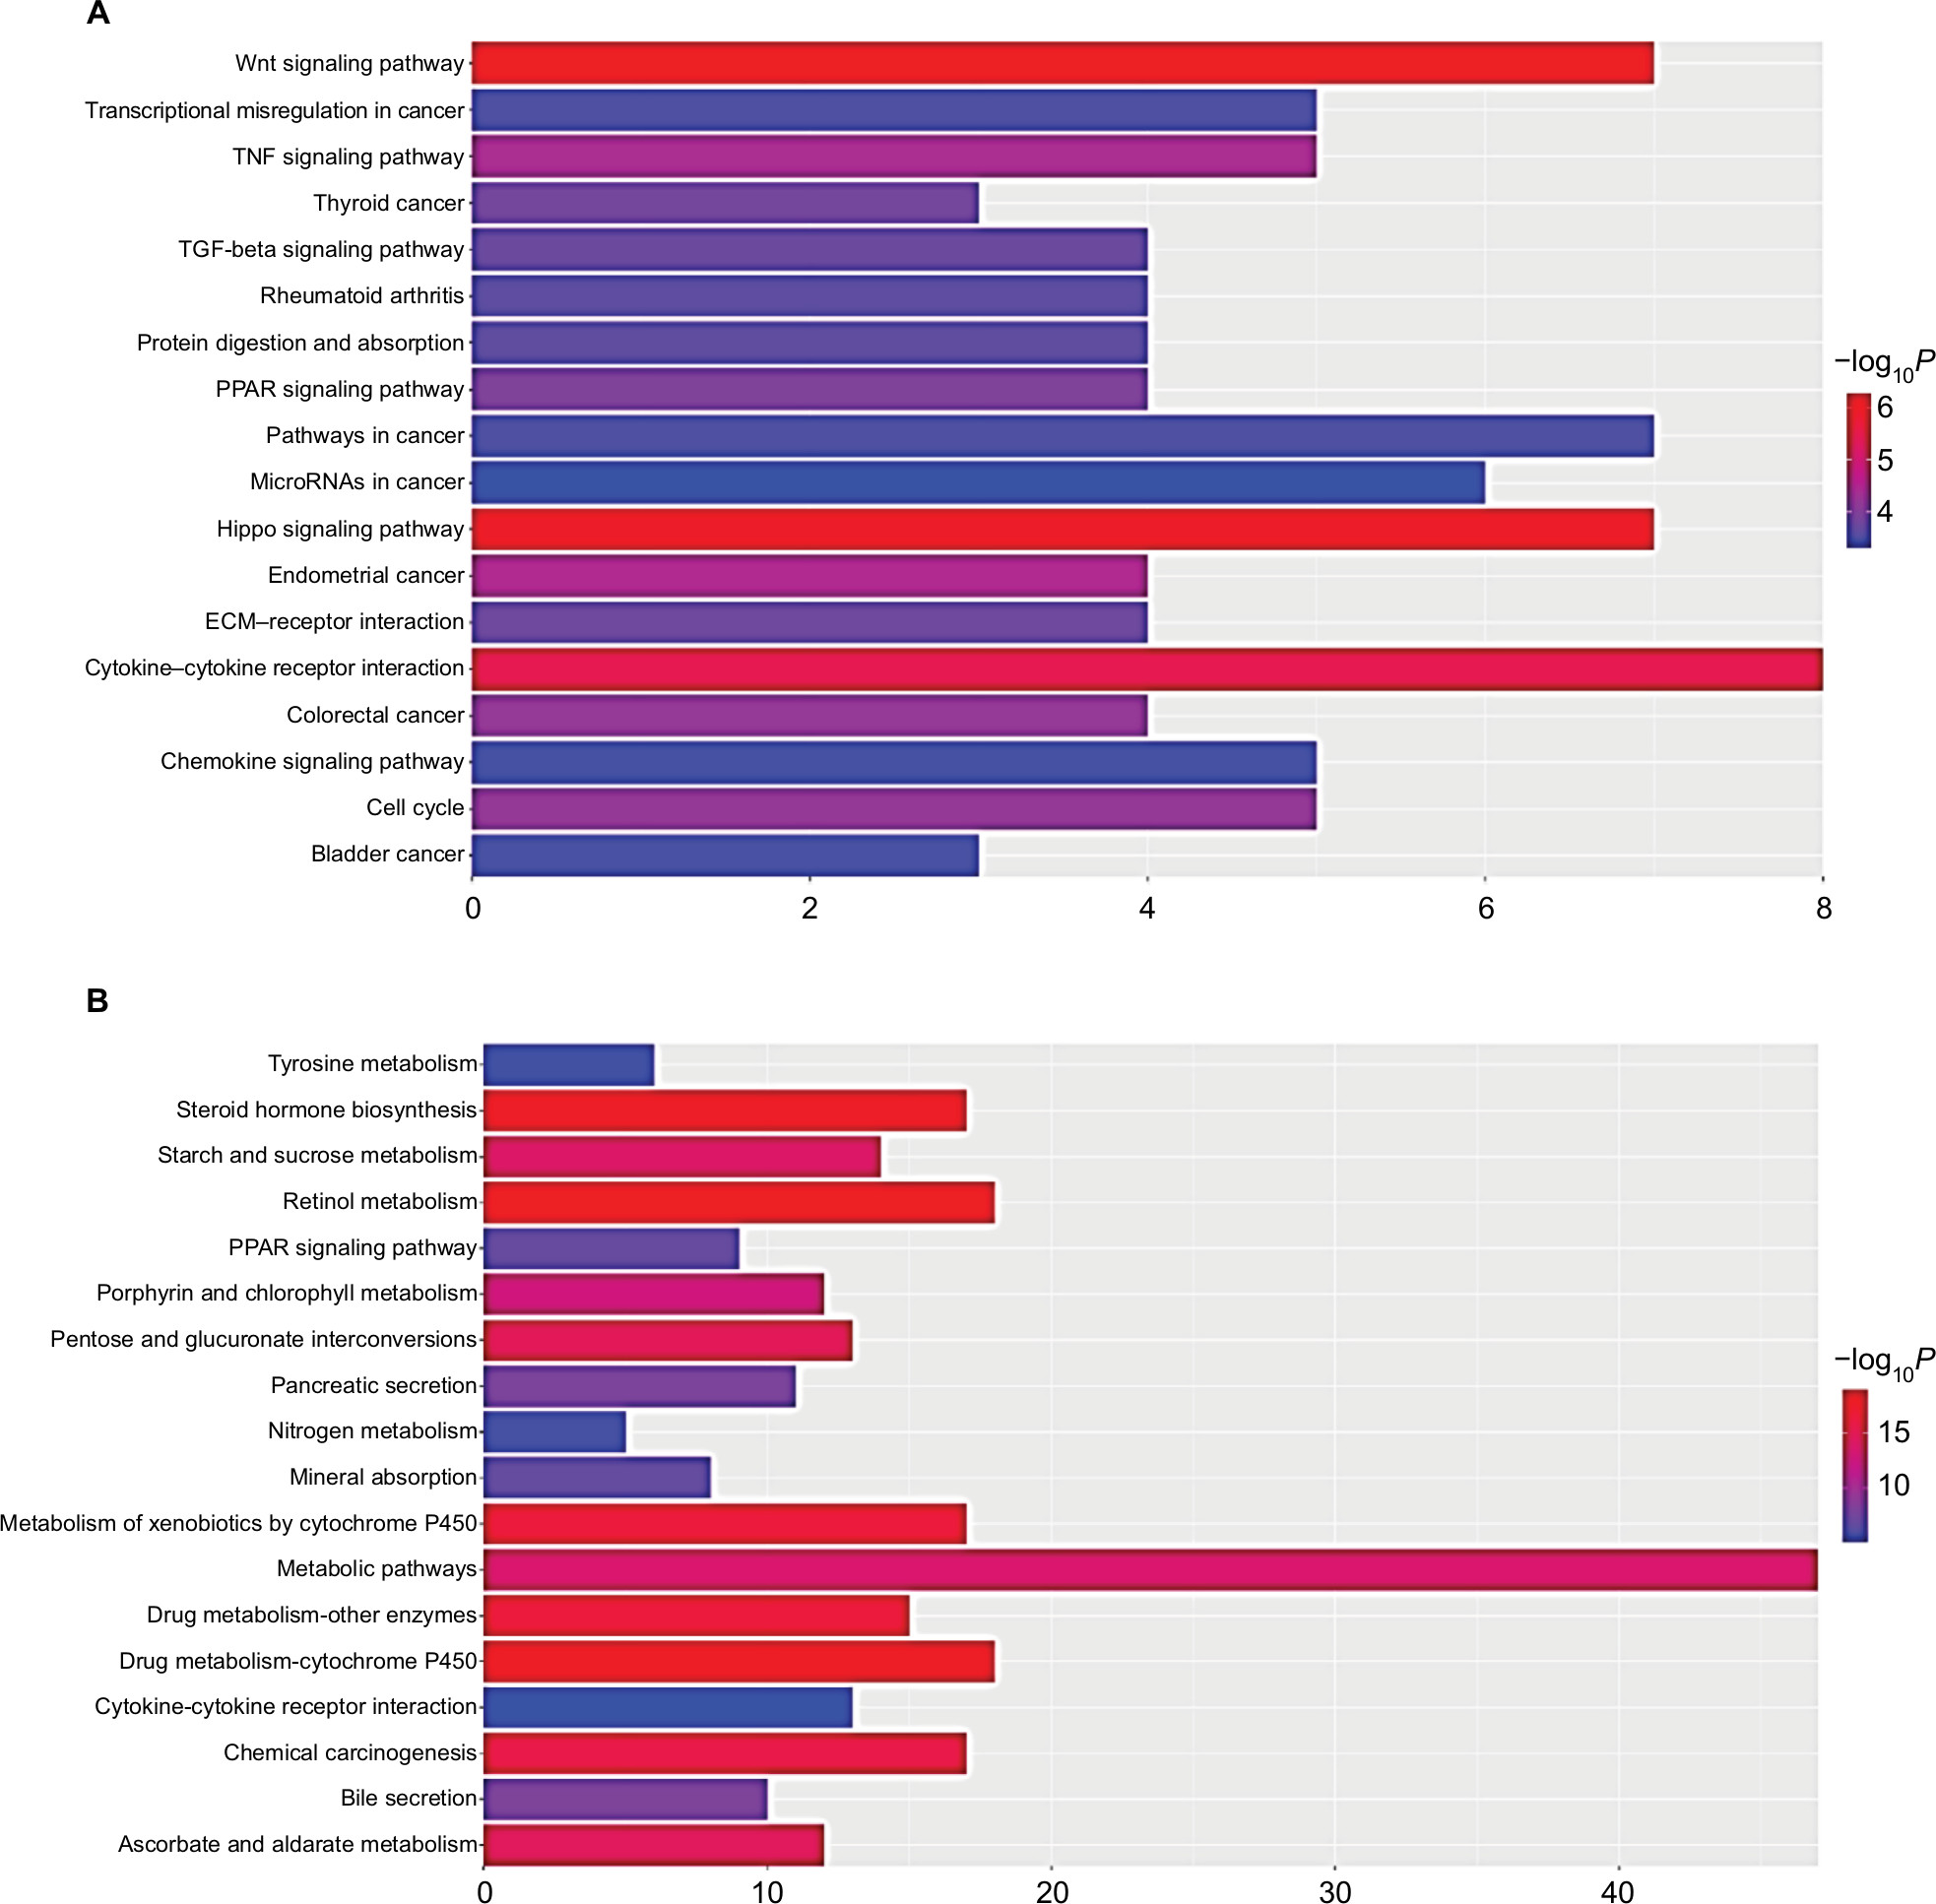 | Figure 3 Significantly enriched pathway terms of upregulated DEGs (A) and downregulated DEGs (B) in colon cancer. Notes: DEGs functional and signaling pathway enrichment was performed using the online tools of KEGG pathway, Gene Ontology analysis, and Panther. P<0.05 was considered to have statistical significance and to achieve significant enrichment. The enrichment significance (-log10P) of different term is shown as different length and color of each bar (pathway). Abbreviations: DEGs, differentially expressed genes; ECM, extracellular matrix; KEGG, Kyoto Encyclopedia of Genes and Genomes. |
PPI network analysis of hub genes and sub-modules
PPI is defined as the physical contacts of high specificity established between two or more protein molecules as a result of biochemical events and/or electrostatic forces.28 According to the results from the STRING databases, we constructed the PPI network of the top 20 hub genes with higher degree of connectivity (Figure 1). These hub genes involved COL1A1, CXCL5, GNG4, TIMP1, SPP1, and LPAR1, and they might play a crucial role in colon cancer progression. Based on the GO function, KEGG pathway analysis, and the survival analysis, we found that CXCL5 and GNG4 were found enriched in chemokine signaling pathway, while SPP1 and COL1A1 were enriched in extracellular matrix (ECM)–receptor interaction.
Moreover, the PPI network of DEGs with a total of 497 nodes and 968 edges was analyzed using Molecular Complex Detection plug-in. The top three significant modules were selected, and the functional annotations of the genes involved in the modules were analyzed (Figure 4). KEGG pathway enrichment analysis showed that these three modules were mainly associated with chemokine signaling pathway, cytokine–cytokine receptor interaction, cell cycle, miRNAs in cancer, mineral absorption, and so on.
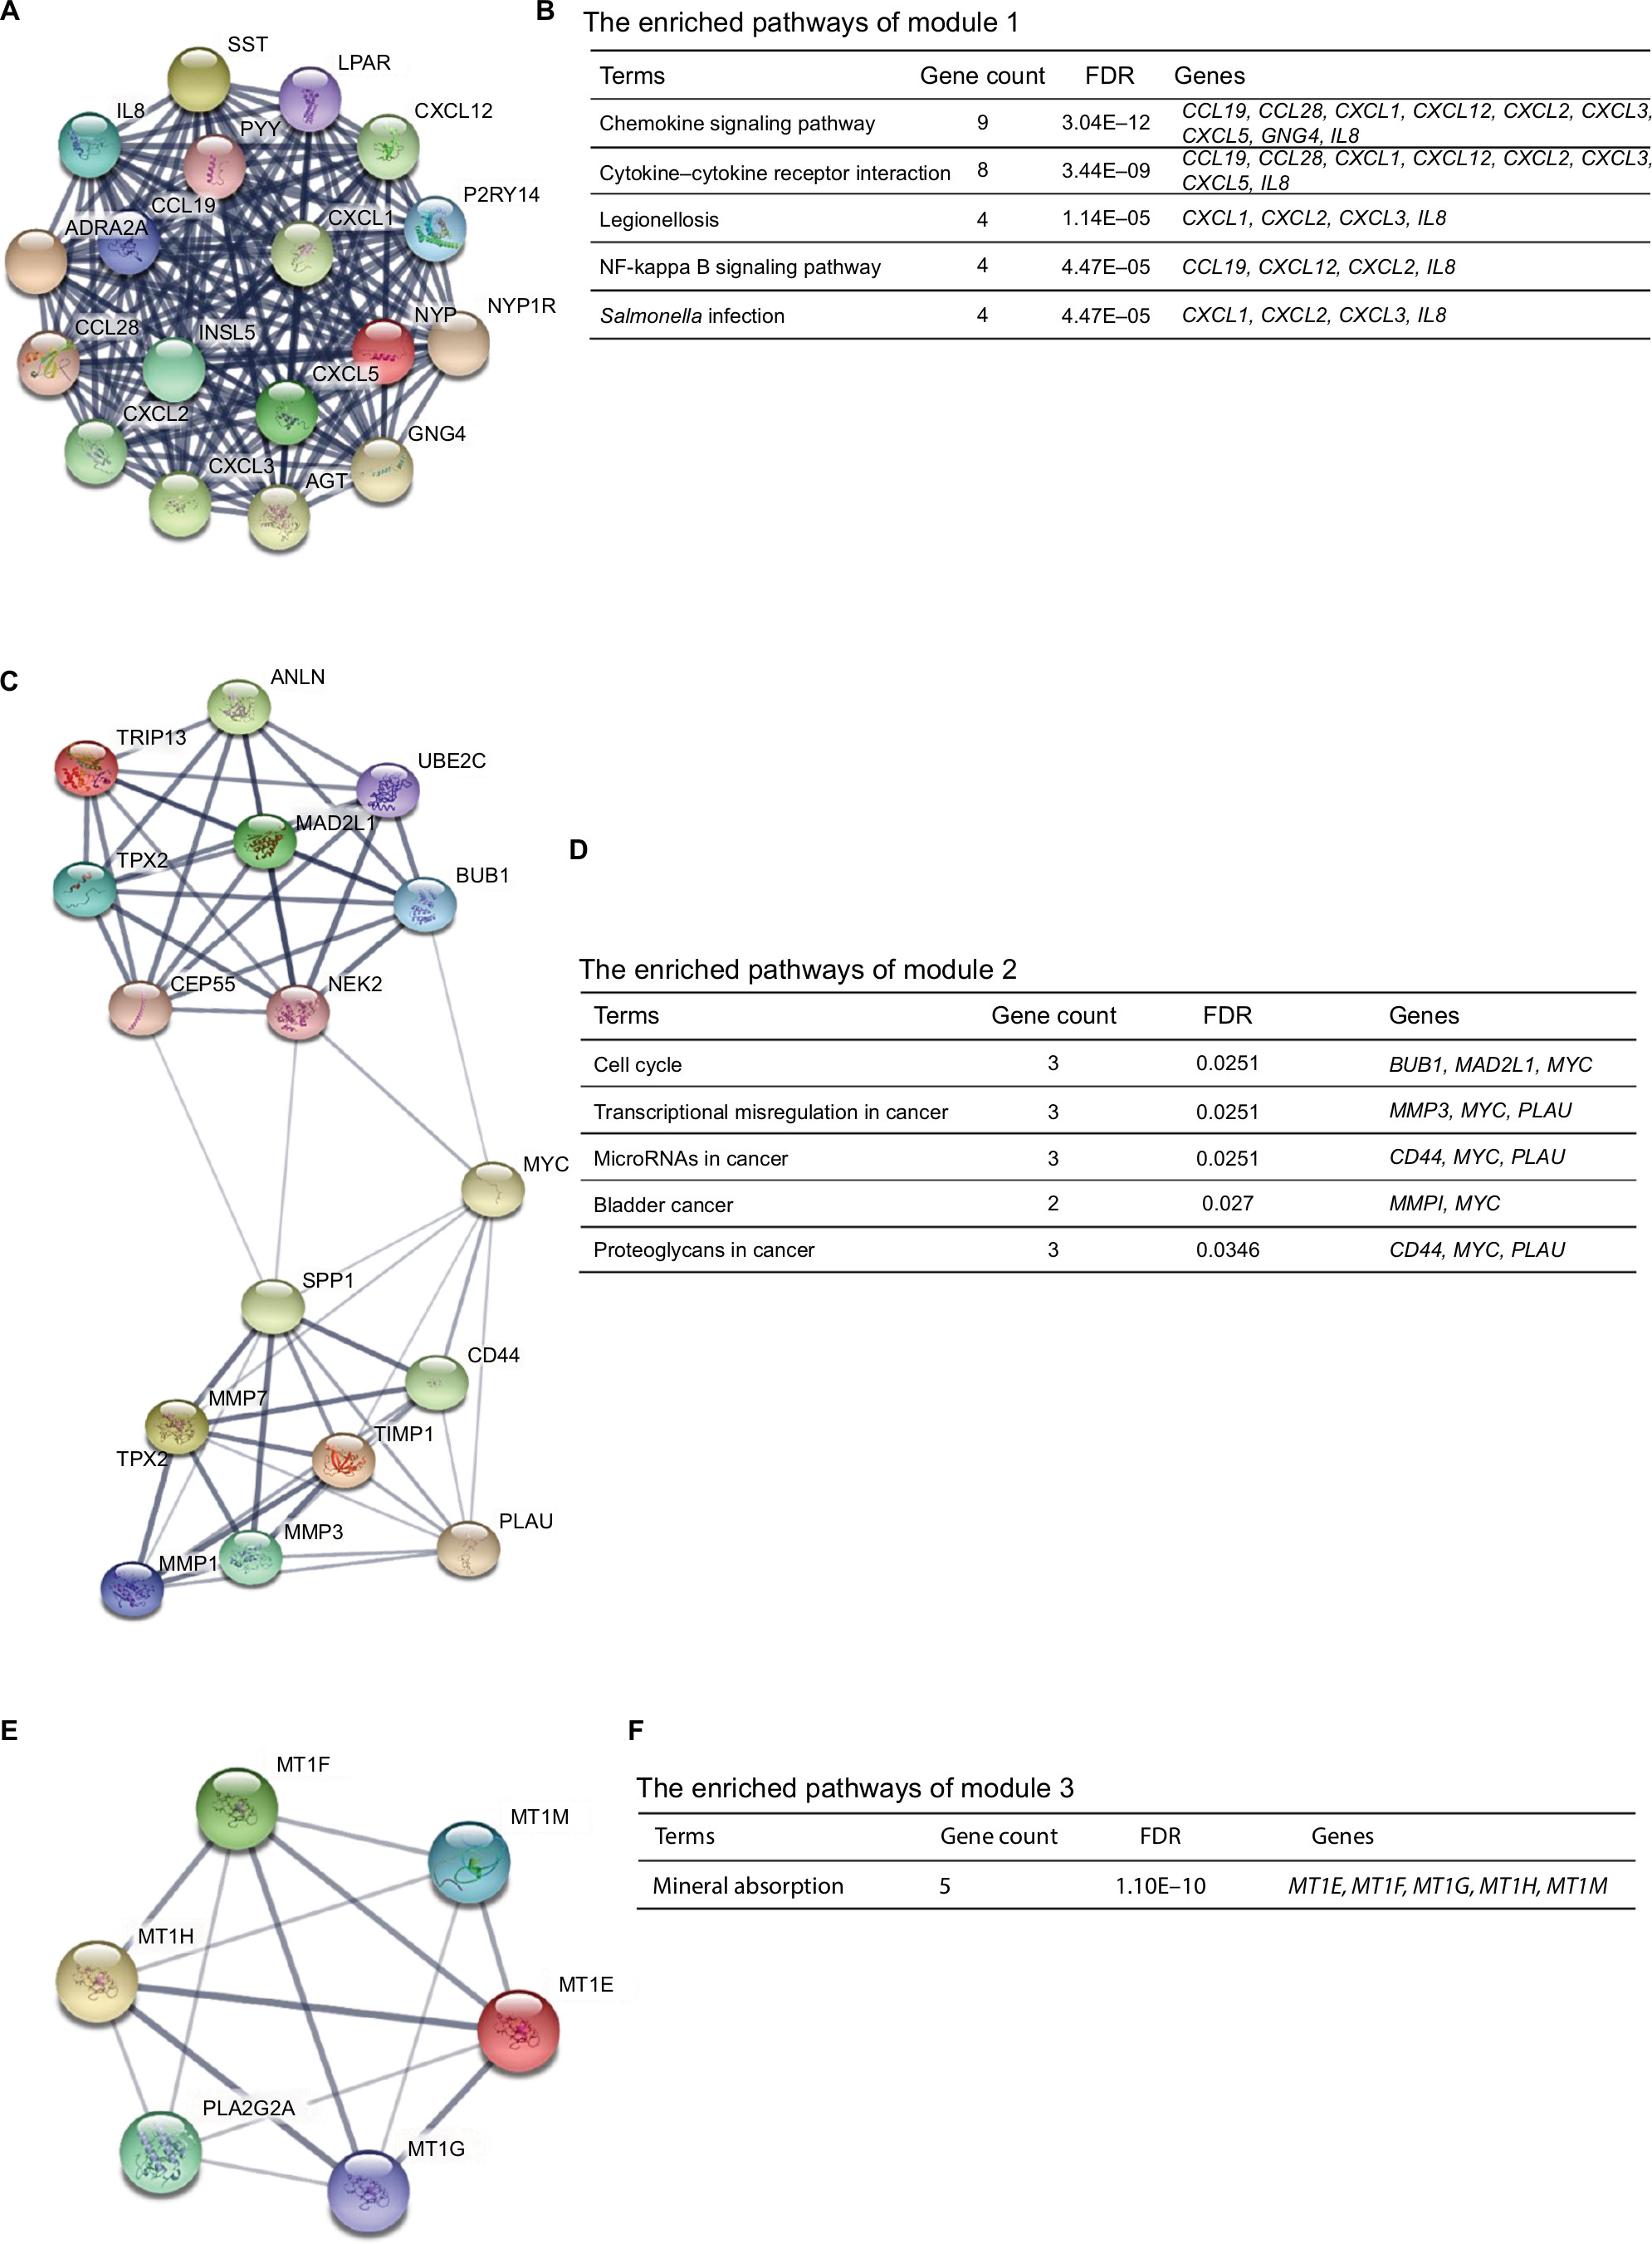 | Figure 4 The top three modules from the protein–protein interaction network. Notes: (A) Module 1; (B) the enriched pathways of module 1; (C) module 2; (D) the enriched pathways of module 2; (E) module 3; (F) the enriched pathways of module 3. Abbreviation: FDR, false discovery rate. |
Survival analysis and the expression levels of hub genes
PROGgeneV2 – Pan Cancer Prognostics Database (www.compbio.iupui.edu/proggene)24 online software is freely available for analyzing the prognostic information of the 20 hub genes. It showed that higher mRNA expressions of COL1A1 (HR: 1.62 [1.22–2.16], P<0.01), CXCL5 (HR: 1.25 [1.08–1.43], P<0.01), GNG4 (HR: 1.25 [1.03–1.51], P=0.02), TIMP1 (HR: 2.1 [1.32–3.36], P<0.01), and SPP1(HR: 1.44 [1.17–1.78], P<0.01) were related to poor OS in colon cancer patients, whereas higher expression of LPAR1 (HR: 0.58 [0.35–0.96], P=0.03) was associated with better OS (Figure 5). Then, the hub genes levels between cancer patients and healthy controls were detected using GEPIA (http://gepia.cancer-pku.cn/index.html). Figure S1 shows that the expression levels of COL1A1, CXCL5, GNG4, TIMP1, and SPP1 were increased in cancer patients compared to normal controls, whereas LPAR1 was downregulated. Also, these data are in keeping with the results from the profile of GSE44076. The correlation analysis among the hub genes was also performed using GEPIA, and Figure S2 shows that the mRNA levels of CXCL5 and COL1A1, SPP1 and COL1A1, SPP1 and TIMP1, and TIMP1 and COL1A1 were obviously positively correlated, respectively.
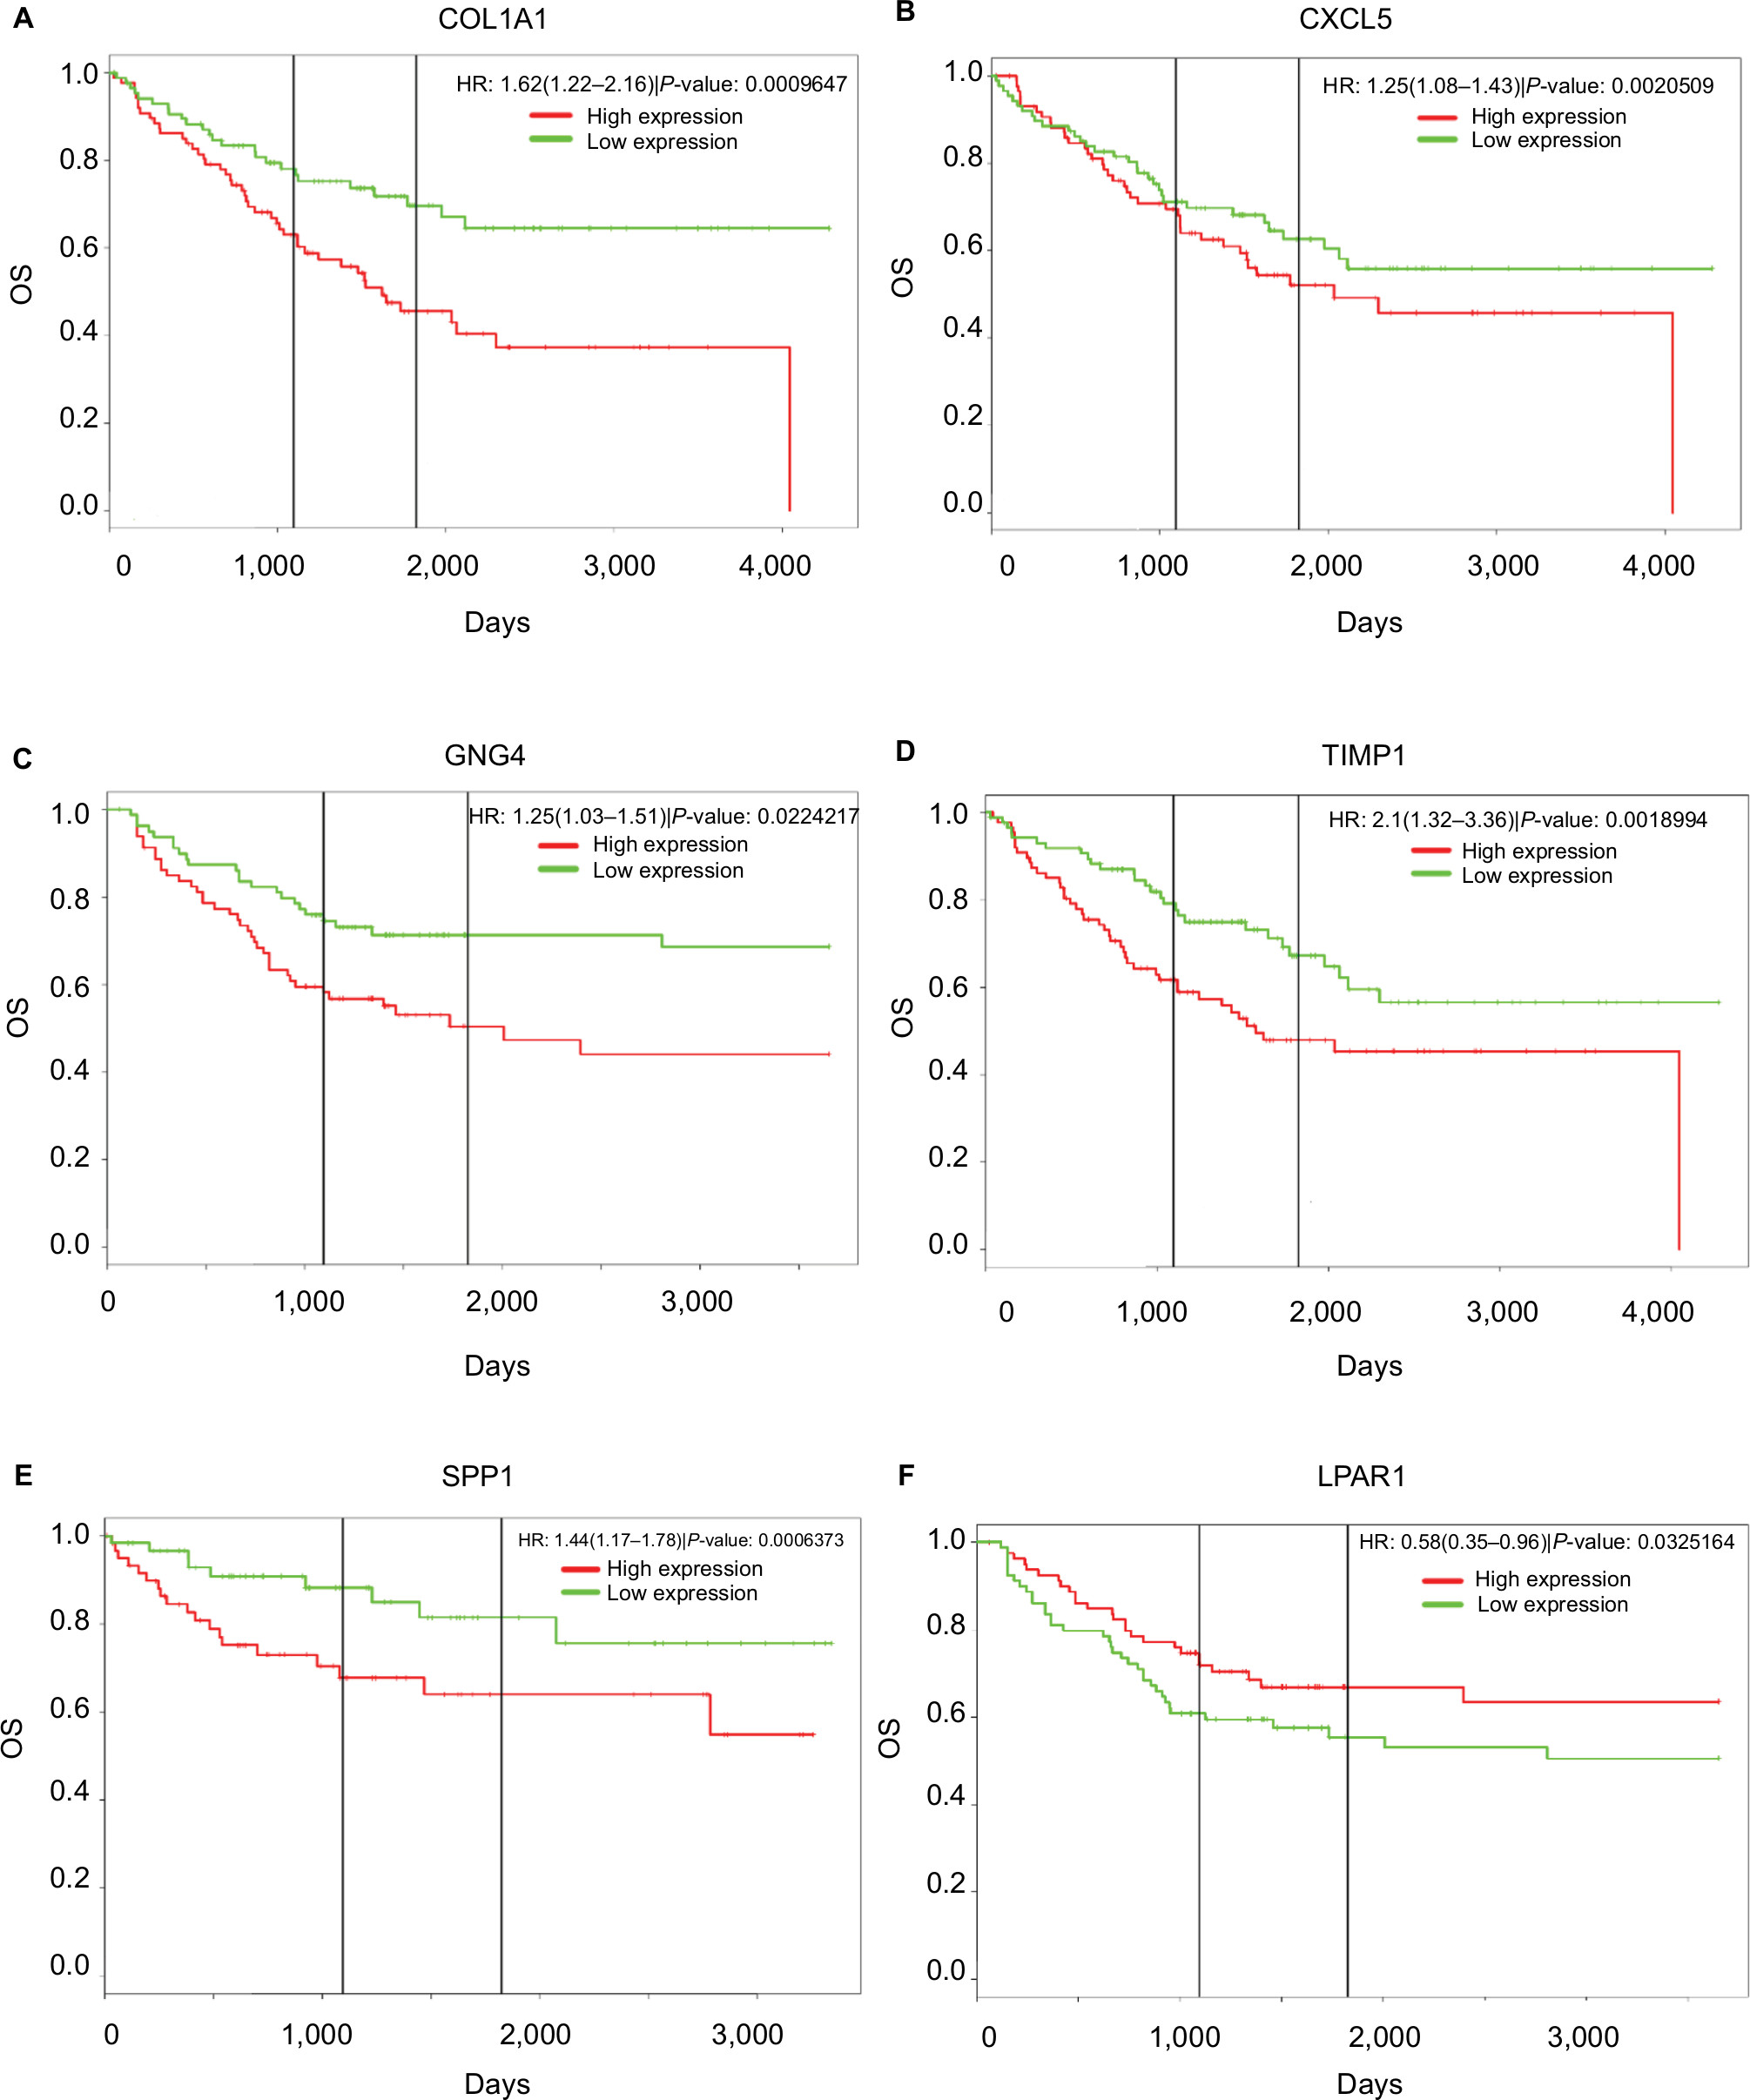 | Figure 5 Prognostic values of six genes in colon cancer patients. Notes: Prognostic values of (A) COL1A1, (B) CXCL5, (C) GNG4, (D) TIMP1, (E) SPP1, and (F) LPAR1 were obtained in the PROGgeneV2 – Pan Cancer Prognostics Database (www.compbio.iupui.edu/proggene) online software. Abbreviation: OS, overall survival. |
Construction of the regulatory networks of hub genes
In the present study, we noticed the above-mentioned six genes were mainly involved in several pathways, including ECM–receptor interaction, chemokine signaling pathway, and cell cycle. Given that non-coding RNAs and genes could comprise regulatory networks to participate in many cellular pathways, we then predicted the targeted miRNAs and related lncRNAs of COL1A1, CXCL5, GNG4, TIMP1, SPP1, and LPAR1 using GCBI (http://www.gcbi.com.cn/). Thus, we constructed the interaction networks so as to achieve a better understanding of the regulatory relationships. Figure 6 displays the regulatory networks of these key genes. For example, Figure 6A shows that COL1A1 might be a direct target of miR-29b-3p. Moreover, lncRNA H19, one of inflammation-related lncRNAs,29 may also regulate the function/level of COL1A1. A previous study has demonstrated that lncRNA H19 could target miR-29b-3p to inhibit its expression.30 Thus, we hypothesized that there might be a ceRNA network (lncRNA H19/miR-29b-3p/COL1A1) in the development of colon cancer. Moreover, lncRNA CCDC26 might simultaneously regulate CXCL5 (Figure 6B), GNG4 (Figure 6C), and SPP1 (Figure 6E) according to the networks. We also found that lncRNA IGF2-AS was presented in the networks of COL1A1 (Figure 6A), TIMP1 (Figure 6D), SPP1 (Figure 6E), and LPAR1 (Figure 6F). Taken together, these regulatory networks/pathways might provide new insights into the mechanisms of colonic carcinogenesis and targeted therapy.
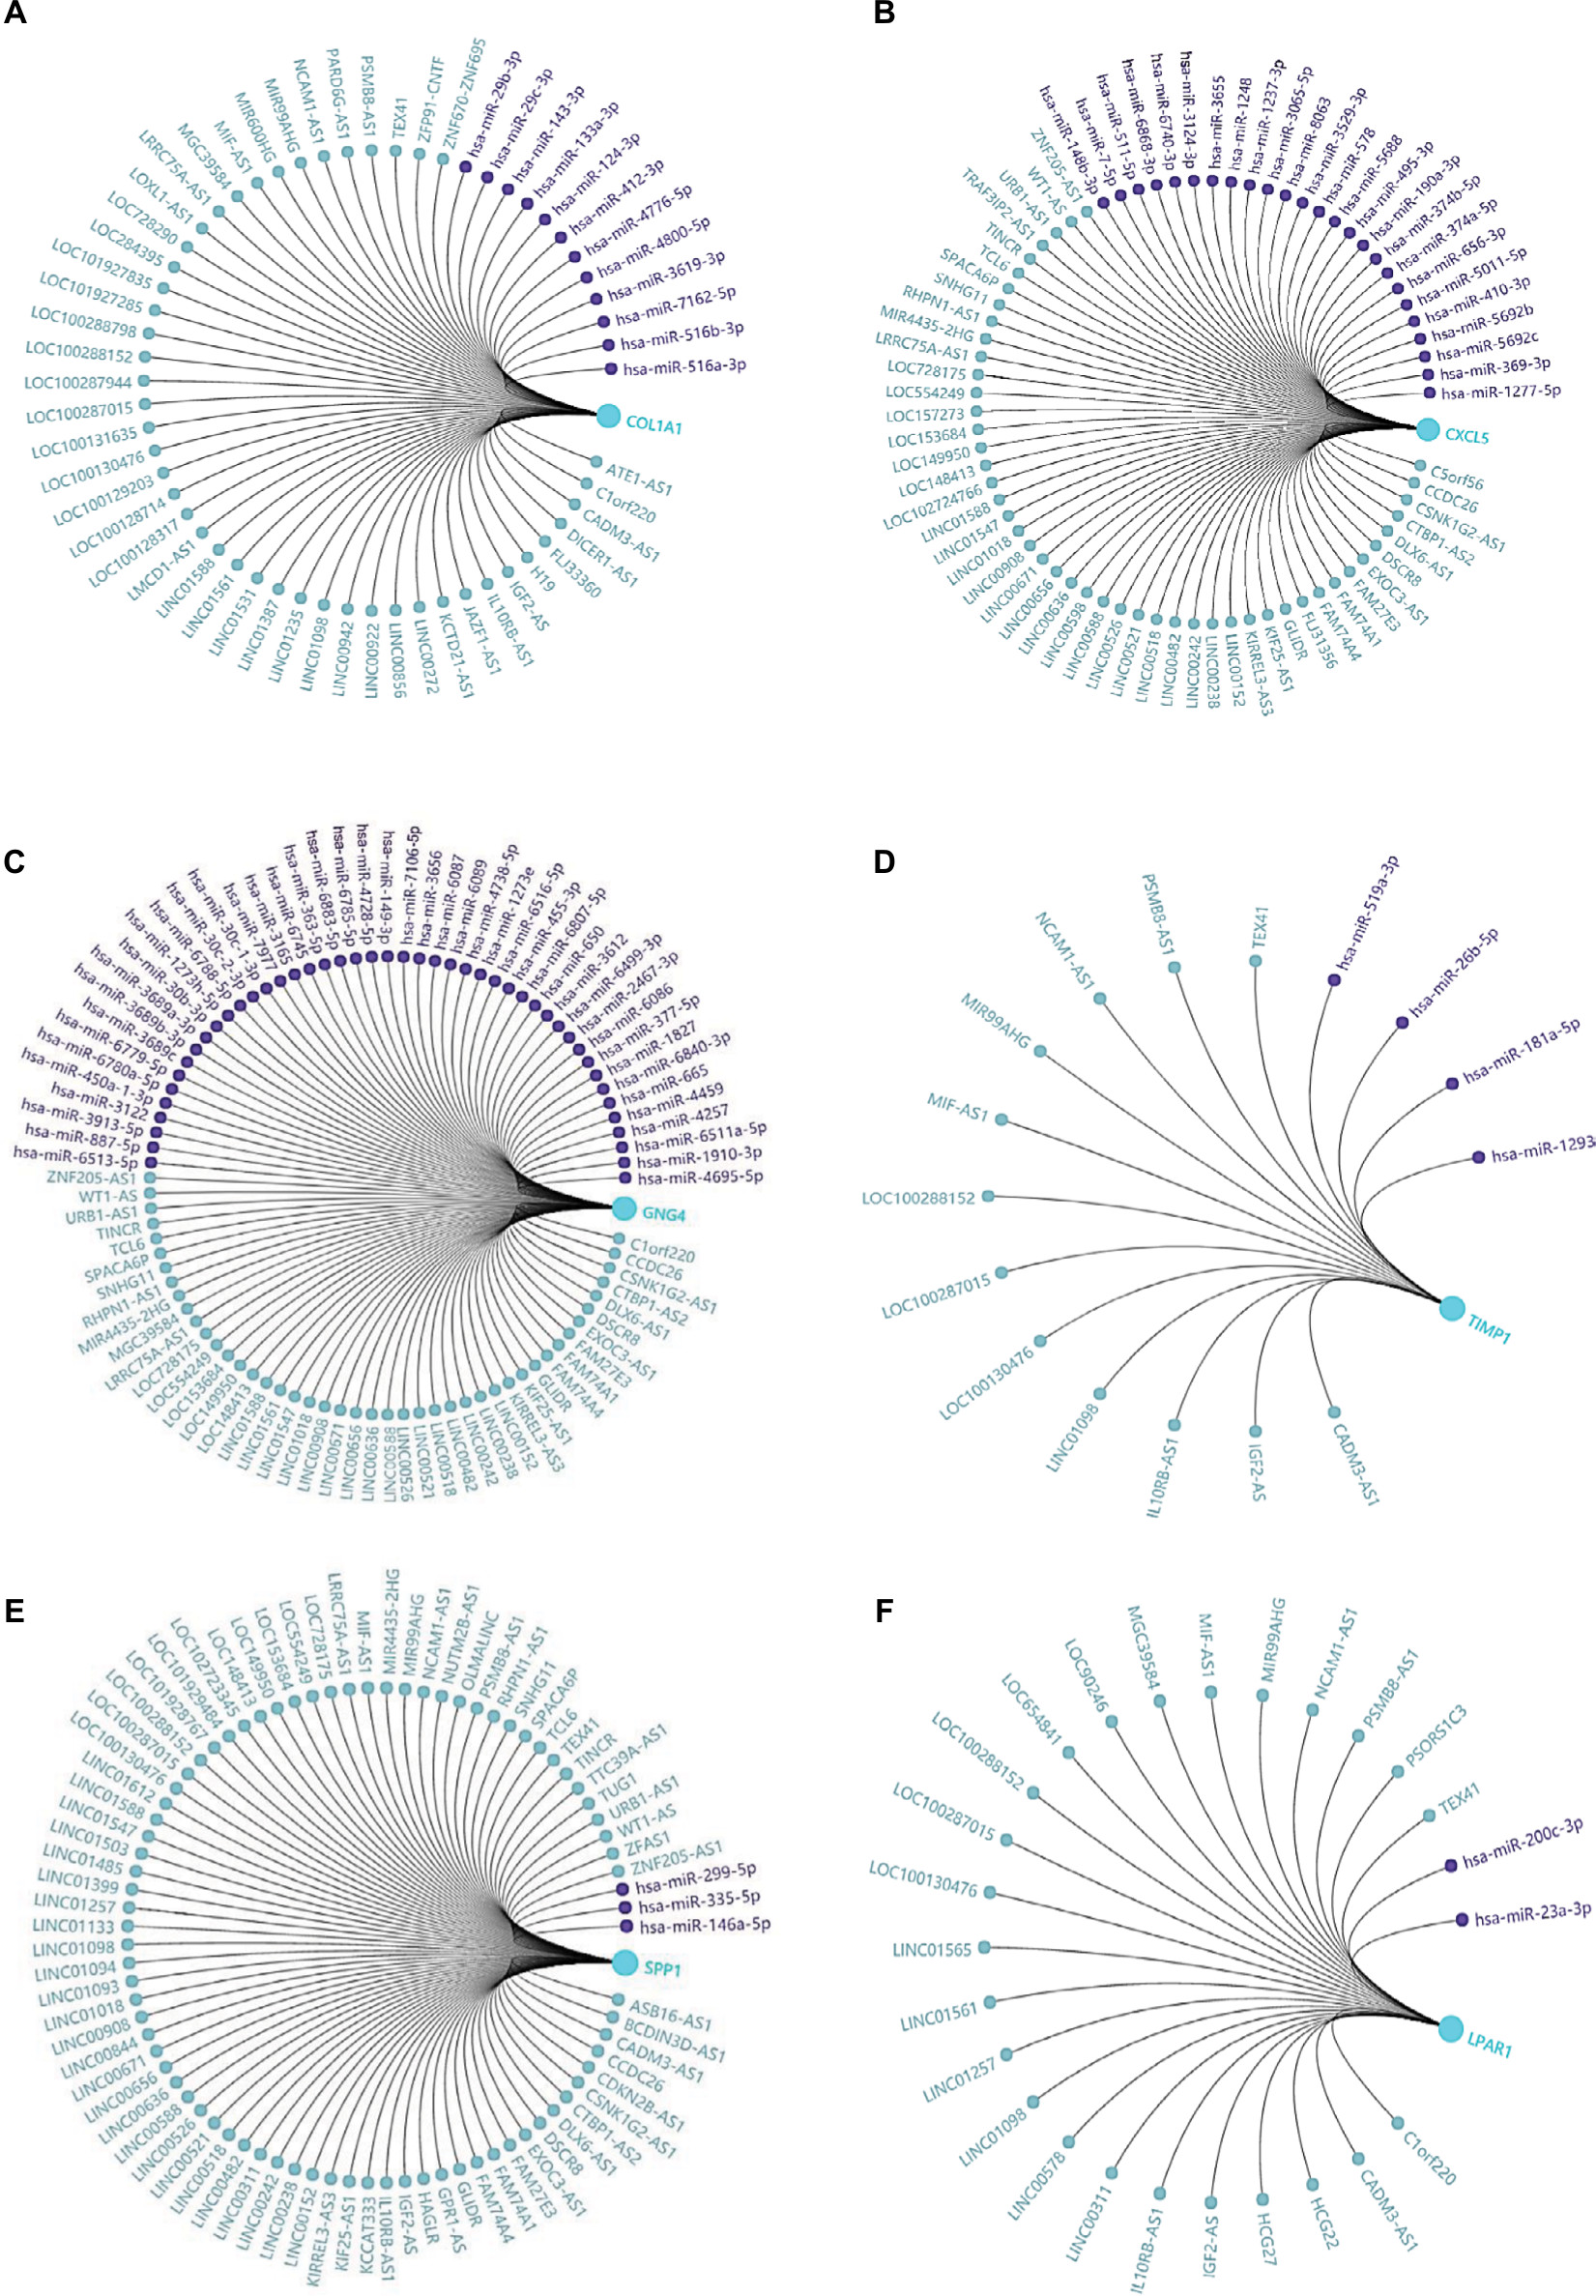 | Figure 6 Regulatory networks of six DEGs under the regulations of non-coding RNAs. Notes: The related lncRNAs and targeted miRNAs of six DEGs were predicted by the GCBI (http://www.gcbi.com.cn/). (A) Regulatory network of COL1A1; (B) regulatory network of CXCL5; (C) regulatory network of GNG4; (D) regulatory network of TIMP1; (E) regulatory network of SPP1; (F) regulatory network of LPAR1. Abbreviations: DEGs, differentially expressed genes; GCBI, Gene-Cloud Biotechnology information. |
Discussion
In recent years, although the morbidity of colon cancer has declined, it is still one of the leading malignant tumors worldwide. Specific biomarkers and effective targets are still needed to be identified.
In this study, a total of 497 DEGs were picked out from the profile of GSE44076, including 129 upregulated genes and 368 downregulated genes. Upregulated DEGs were mainly involved in several functional terms such as cell proliferation, cell cycle, extracellular region, and endopeptidase activity, while downregulated DEGs were enriched in biological adhesion, cell adhesion, extracellular region, and calcium ion binding. The KEGG pathways of upregulated DEGs involved Hippo signaling pathway, Wnt signaling pathway, and cytokine–cytokine receptor interaction, while the downregulated DEGs were enriched in retinol metabolism, steroid hormone biosynthesis, drug metabolism, and chemical carcinogenesis. Among the DEGs, 20 hub genes had higher degree of connectivity in the PPI network. Survival analysis showed that six of the hub genes, including COL1A1, CXCL5, TIMP1, GNG4, SPP1, and LPAR1, were associated with the OS of colon cancer patients. Higher mRNA expression levels of COL1A1, CXCL5, GNG4, TIMP1, and SPP1 were related to poor OS for colon cancer patients, whereas higher expression of LPAR1 might predict better OS.
LPAR1 is one of the G protein-coupled transmembrane lysophosphatidic acid receptors which may negatively regulate the activities of cell motility and colon formation.31,32 Besides, according to the KEGG pathways analysis, CXCL5 and GNG4 were enriched in chemokine signaling pathway, while SPP1 and COL1A1 were enriched in ECM–receptor interaction. Recent studies have shown that chemokine signaling pathway and ECM–receptor interaction might play crucial roles in the metastasis and growth of colon cancer,33–35 suggesting that these five genes might be potential therapeutic targets.
COL1A1 is an important structural component of the ECM which belongs to collagen family.36 COL1A1 participates in the process of focal adhesion and may influence the metastatic ability of cells.37 Studies have reported the abnormal expression of COL1A1 in several cancers.37–39 However, the clinical value of COL1A1 in colon cancer is rarely mentioned. It was reported that COL1A1 was high expressed in inflamed mucosa in inflammatory bowel disease,40 and inflammatory bowel disease was commonly considered as an important risk factor for developing colon cancer. In azoxymethane-induced colon cancer, COL1A1 also presented a higher expression level,41 and it might be the predictor of relapse in high-risk stage II and stage III colon cancer patients.42 Immunohistochemistry result showed that COL1A1 protein expression was increased in colon cancer tissues as compared with the matched normal controls, and that overexpression of the nine genes signature (including COL1A1) might predict poor outcome in colon cancer.43 These findings strongly support the potential of COL1A1 as a biomarker for colon cancer. Figure S2 presents the positive correlation between COL1A1 and other hub genes. Since SPP1 and COL1A1 are enriched in ECM–receptor interaction, and TIMP1 regulates the ECM remodeling during cancer development, these three molecules may be the therapeutic targets for inhibiting the invasion of colon cancer.
CXCL5 is one of the secreted signaling proteins which belongs to the chemokine family.44 As one of the proinflammatory and pro-oncogenic molecules, high level of CXCL5 is associated with rapid tumor formation and predicts a poor prognosis.45 Kawamura et al have found that preoperative serum CXCL5 might be a novel biomarker for prognosis analysis of colorectal cancer patients,46 and the data are consistent with our findings that higher expression of CXCL5 was associated with poor OS. Similarly, high expression level of GNG4 is a prognostic factor for monitoring the treatment response in locally advanced rectal cancer patients.47 To date, the roles and mechanisms of GNG4 and CXCL5 in colonic carcinogenesis are still unclear. Here, CXCL5 and GNG4 were found to be significantly enriched in chemokine signaling pathway, indicating that chemokine signaling pathway might be an effective way to inhibit colon cancer.
In summary, a total of 497 DEGs and 20 hub genes were picked out, and COL1A1, CXCL5, GNG4, TIMP1, SPP1, and LPAR1 might be the novel biomarkers in colon cancer. Besides, the related gene regulatory networks under the regulations of non-coding RNAs are constructed. Our results indicate that data mining and integration is a useful approach to screen the core genes and to understand the mechanisms of carcinogenesis. This study provides powerful clues for colon cancer research, and further experimental studies are required to verify the findings of the present analysis.
Acknowledgments
This study was supported in part by grant from the National Natural Scientific Foundation of China (81171923), grant from the State Key Laboratory of Cancer Biology (CBSKL2014Z13), and grant from the National Clinical Research Center for Digestive Diseases (2015BAI13B07). It was not supported by any private or public company or organization.
Disclosure
The authors report no conflicts of interest in this work.
References
Labianca R, Beretta GD, Kildani B, et al. Colon cancer. Crit Rev Oncol Hematol. 2010;74(2):106–133. | ||
Siegel RL, Miller KD, Fedewa SA, Ahnen DJ, Meester RGS, Barzi A, Jemal A. Colorectal cancer statistics, 2017. CA Cancer J Clin. 2017;67(3):177–193. | ||
Aoyagi T, Terracina KP, Raza A, Takabe K. Current treatment options for colon cancer peritoneal carcinomatosis. World J Gastroenterol. 2014;20(35):12493–12500. | ||
Brenner H, Altenhofen L, Stock C, Hoffmeister M. Prevention, early detection, and overdiagnosis of colorectal cancer within 10 years of screening colonoscopy in Germany. Clin Gastroenterol Hepatol. 2015;13(4):717–723. | ||
Favoriti P, Carbone G, Greco M, Pirozzi F, Pirozzi RE, Corcione F. Worldwide burden of colorectal cancer: a review. Updates Surg. 2016;68(1):7–11. | ||
Dallas NA, Xia L, Fan F, et al. Chemoresistant colorectal cancer cells, the cancer stem cell phenotype, and increased sensitivity to insulin-like growth factor-I receptor inhibition. Cancer Res. 2009;69(5):1951–1957. | ||
Zou W, Wolchok JD, Chen L. PD-L1 (B7-H1) and PD-1 pathway blockade for cancer therapy: mechanisms, response biomarkers, and combinations. Sci Transl Med. 2016;8(328):328rv4. | ||
Herzig DO, Tsikitis VL. Molecular markers for colon diagnosis, prognosis and targeted therapy. J Surg Oncol. 2015;111(1):96–102. | ||
Grady WM, Pritchard CC. Molecular alterations and biomarkers in colorectal cancer. Toxicol Pathol. 2014;42(1):124–139. | ||
Weng W, Feng J, Qin H, Ma Y, Goel A. An update on miRNAs as biological and clinical determinants in colorectal cancer: a bench-to-bedside approach. Future Oncol. 2015;11(12):1791–1808. | ||
Kulasingam V, Diamandis EP. Strategies for discovering novel cancer biomarkers through utilization of emerging technologies. Nat Clin Pract Oncol. 2008;5(10):588–599. | ||
Vogelstein B, Papadopoulos N, Velculescu VE, Zhou S, Diaz LA Jr, Kinzler KW. Cancer genome landscapes. Science. 2013;339(6127):1546–1558. | ||
Sun C, Yuan Q, Wu D, Meng X, Wang B. Identification of core genes and outcome in gastric cancer using bioinformatics analysis. Oncotarget. 2017;8(41):70271–70280. | ||
Fang E, Zhang X. Identification of breast cancer hub genes and analysis of prognostic values using integrated bioinformatics analysis. Cancer Biomark. 2017;21(1):169–177. | ||
Barrett T, Wilhite SE, Ledoux P, et al. NCBI GEO: archive for functional genomics data sets–update. Nucleic Acids Res. 2013; 41: D991–5. | ||
Sanz-Pamplona R, Berenguer A, Cordero D, et al. Aberrant gene expression in mucosa adjacent to tumor reveals a molecular crosstalk in colon cancer. Mol Cancer. 2014;13:46. | ||
Davis S, Meltzer PS. GEOquery: a bridge between the Gene Expression Omnibus (GEO) and BioConductor. Bioinformatics. 2007;23:1846–7. | ||
Ashburner M, Ball CA, Blake JA, et al. Gene ontology: tool for the unification of biology. The Gene Ontology Consortium. Nat Genet. 2000;25(1):25–29. | ||
Altermann E, Klaenhammer TR. PathwayVoyager: pathway mapping using the Kyoto Encyclopedia of Genes and Genomes (KEGG) database. BMC Genomics. 2005;6:60. | ||
Huang W, Sherman BT, Lempicki RA. Systematic and integrative analysis of large gene lists using DAVID bioinformatics resources. Nat Protoc. 2009;4:44–57. | ||
Szklarczyk D, Franceschini A, Wyder S, et al. STRING v10: protein–protein interaction networks, integrated over the tree of life. Nucleic Acids Res. 2015;43(Database issue):D447–D452. | ||
Bader GD, Hogue CW. An automated method for finding molecular complexes in large protein interaction networks. BMC Bioinformatics. 2003;4:2. | ||
Tang Z, Li C, Kang B, Gao G, Li C, Zhang Z. GEPIA: a web server for cancer and normal gene expression profiling and interactive analyses. Nucleic Acids Res. 2017;45:W98–W102. | ||
Goswami CP, Nakshatri H. PROGgeneV2: enhancements on the existing database. BMC Cancer. 2014;14:970. | ||
Feng A, Tu Z, Yin B. The effect of HMGB1 on the clinicopathological and prognostic features of non-small cell lung cancer. Oncotarget. 2016;7:20507–20519. | ||
Kanehisa M, Furumichi M, Tanabe M, Sato Y, Morishima K. KEGG: new perspectives on genomes, pathways, diseases and drugs. Nucleic Acids Res. 2017;45:D353-d61. | ||
Mi H, Poudel S, Muruganujan A, Casagrande JT, Thomas PD. PANTHER version 10: expanded protein families and functions, and analysis tools. Nucleic Acids Res. 2016;44:D336-42. | ||
De Las Rivas J, Fontanillo C. Protein–protein interactions essentials: key concepts to building and analyzing interactome networks. PLoS Comput Biol. 2010;6(6):e1000807. | ||
Geng H, Bu HF, Liu F, et al. In inflamed intestinal tissues and epithelial cells, interleukin 22 signaling increases expression of H19 long noncoding RNA, which promotes mucosal regeneration. Gastroenterology. 2018;155(1):144–155. | ||
Ding D, Li C, Zhao T, Li D, Yang L, Zhang B. lncRNA H19/miR-29b-3p/PGRN axis promoted epithelial–mesenchymal transition of colorectal cancer cells by acting on Wnt signaling. Mol Cells. 2018;41(5):423–435. | ||
Takahashi K, Fukushima K, Onishi Y, et al. Lysophosphatidic acid (LPA) signaling via LPA4 and LPA6 negatively regulates cell motile activities of colon cancer cells. Biochem Biophys Res Commun. 2017;483(1):652–657. | ||
Takahashi K, Fukushima K, Otagaki S, et al. Effects of LPA1 and LPA6 on the regulation of colony formation activity in colon cancer cells treated with anticancer drugs. J Recept Signal Transduct Res. 2018;38(1):71–75. | ||
Desurmont T, Skrypek N, Duhamel A, et al. Overexpression of chemokine receptor CXCR2 and ligand CXCL7 in liver metastases from colon cancer is correlated to shorter disease-free and overall survival. Cancer Sci. 2015;106(3):262–269. | ||
Zhu Z, Zhang X, Guo H, Fu L, Pan G, Sun Y. CXCL13–CXCR5 axis promotes the growth and invasion of colon cancer cells via PI3K/AKT pathway. Mol Cell Biochem. 2015;400(1–2):287–295. | ||
Naba A, Clauser KR, Whittaker CA, Carr SA, Tanabe KK, Hynes RO. Extracellular matrix signatures of human primary metastatic colon cancers and their metastases to liver. BMC Cancer. 2014;14:518. | ||
Exposito JY, Valcourt U, Cluzel C, Lethias C. The fibrillar collagen family. Int J Mol Sci. 2010;11(2):407–426. | ||
Tian ZQ, Li ZH, Wen SW, Zhang YF, Li Y, Cheng JG, Wang GY. Identification of commonly dysregulated genes in non-small-cell lung cancer by integrated analysis of microarray data and qRT-PCR validation. Lung. 2015;193(4):583–592. | ||
Hayashi M, Nomoto S, Hishida M, et al. Identification of the collagen type 1 alpha 1 gene (COL1A1) as a candidate survival-related factor associated with hepatocellular carcinoma. BMC Cancer. 2014;14:108. | ||
Ibanez de Caceres I, Dulaimi E, Hoffman AM, Al-Saleem T, Uzzo RG, Cairns P. Identification of novel target genes by an epigenetic reactivation screen of renal cancer. Cancer Res. 2006;66(10):5021–5028. | ||
You J, Nguyen AV, Albers CG, Lin F, Holcombe RF. Wnt pathway-related gene expression in inflammatory bowel disease. Dig Dis Sci. 2008;53(4):1013–1019. | ||
Rondini EA, Bennink MR. Microarray analyses of genes differentially expressed by diet (black beans and soy flour) during azoxymethane-induced colon carcinogenesis in rats. J Nutr Metab. 2012;2012:351796. | ||
Giampieri R, Scartozzi M, Loretelli C, et al. Cancer stem cell gene profile as predictor of relapse in high risk stage II and stage III, radically resected colon cancer patients. PLoS One. 2013;8(9):e72843. | ||
Yuzhalin AE, Urbonas T, Silva MA, Muschel RJ, Gordon-Weeks AN. A core matrisome gene signature predicts cancer outcome. Br J Cancer. 2018;118(3):435–440. | ||
Gorbachev AV, Fairchild RL. Regulation of chemokine expression in the tumor microenvironment. Crit Rev Immunol. 2014;34(2):103–120. | ||
Speetjens FM, Kuppen PJ, Sandel MH, et al. Disrupted expression of CXCL5 in colorectal cancer is associated with rapid tumor formation in rats and poor prognosis in patients. Clin Cancer Res. 2008;14(8):2276–2284. | ||
Kawamura M, Toiyama Y, Tanaka K, et al. CXCL5, a promoter of cell proliferation, migration and invasion, is a novel serum prognostic marker in patients with colorectal cancer. Eur J Cancer. 2012;48(14):2244–2251. | ||
Palma P, Cano C, Conde-Muiño R, Comino A, Bueno P, Ferrón JA, Cuadros M. Expression profiling of rectal tumors defines response to neoadjuvant treatment related genes. PLoS One. 2014;9(11):e112189. |
Supplementary materials
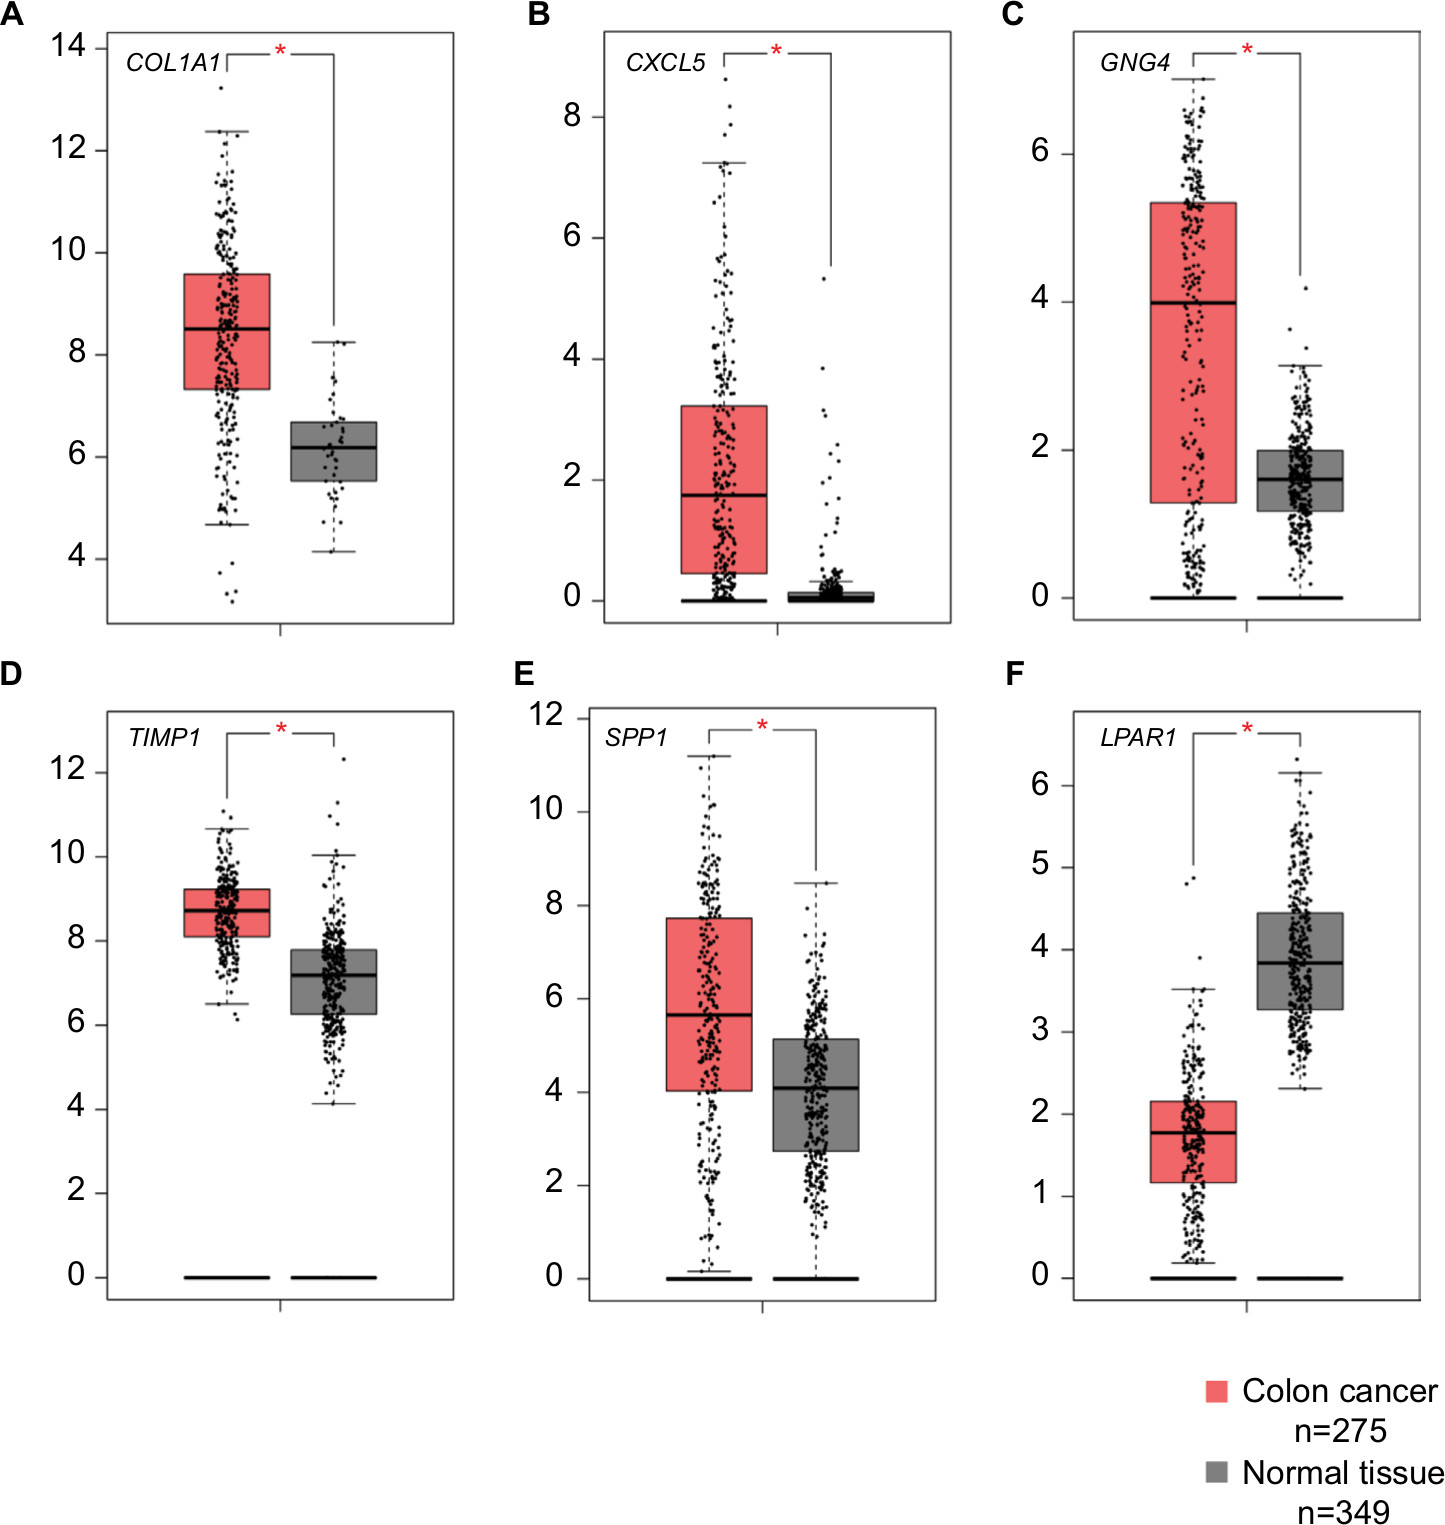 | Figure S1 Expression levels of six DEGs in colon cancer tissues and normal tissues. Notes: GEPIA (http://gepia.cancer-pku.cn/index.html) was used to verify the expression levels of six genes, (A) COL1A1, (B) CXCL5, (C) GNG4, (D) TIMP1, (E) SPP1, (F) LPAR1, in colon cancer tissues and normal tissues. The components are colored as the key at the lower left. *P<0.05. Abbreviations: DEGs, differentially expressed genes; GEPIA, Gene Expression Profiling Interactive Analysis. |
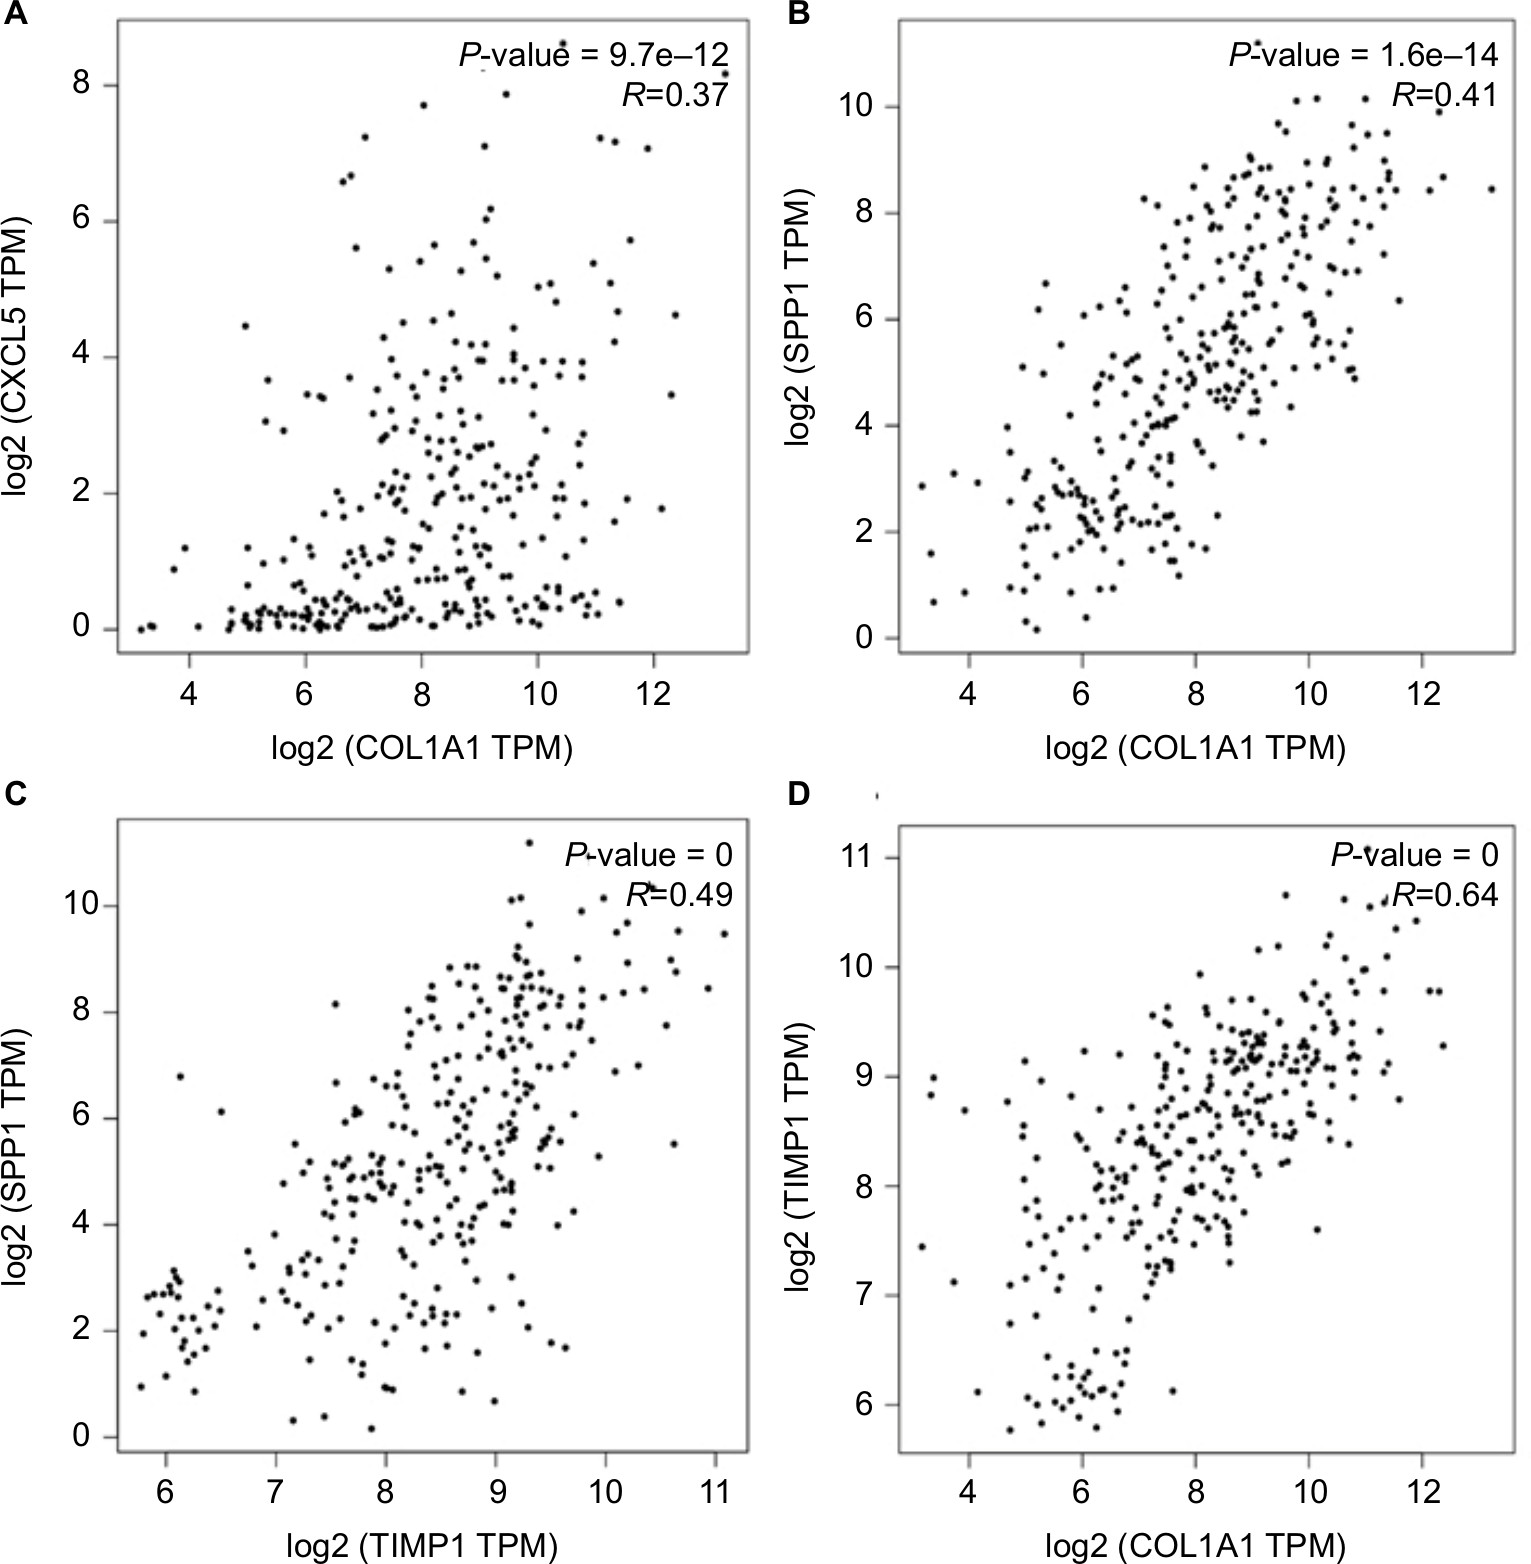 | Figure S2 The correlation analysis among the hub genes. Notes: (A)CXCL5 and COL1A1, (B) SPP1 and COL1A1, (C) SPP1 and TIMP1, and (D) TIMP1 and COL1A1 were obviously positively correlated, respectively. Abbreviation: TPM, transcripts per million. |
 © 2018 The Author(s). This work is published and licensed by Dove Medical Press Limited. The full terms of this license are available at https://www.dovepress.com/terms.php and incorporate the Creative Commons Attribution - Non Commercial (unported, v3.0) License.
By accessing the work you hereby accept the Terms. Non-commercial uses of the work are permitted without any further permission from Dove Medical Press Limited, provided the work is properly attributed. For permission for commercial use of this work, please see paragraphs 4.2 and 5 of our Terms.
© 2018 The Author(s). This work is published and licensed by Dove Medical Press Limited. The full terms of this license are available at https://www.dovepress.com/terms.php and incorporate the Creative Commons Attribution - Non Commercial (unported, v3.0) License.
By accessing the work you hereby accept the Terms. Non-commercial uses of the work are permitted without any further permission from Dove Medical Press Limited, provided the work is properly attributed. For permission for commercial use of this work, please see paragraphs 4.2 and 5 of our Terms.