")
Back to Journals » Diabetes, Metabolic Syndrome and Obesity » Volume 14
Identification of Hepatic Steatosis in Premenopausal and Postmenopausal Women Based on Phenotypes Combining Triglyceride Levels and Anthropometric Indices: A Cross-Sectional Study
Authors Liu PJ , Lou HP, Zhu YN
Received 16 January 2021
Accepted for publication 11 March 2021
Published 23 March 2021 Volume 2021:14 Pages 1339—1347
DOI https://doi.org/10.2147/DMSO.S302297
Checked for plagiarism Yes
Review by Single anonymous peer review
Peer reviewer comments 3
Editor who approved publication: Prof. Dr. Antonio Brunetti
Peng Ju Liu,1 Hui Ping Lou,2 Yan Ning Zhu3
1Department of Clinical Nutrition, Peking Union Medical College Hospital, China Academic Medical Science and Peking Union Medical College, Beijing, People’s Republic of China; 2Medical Examination Center, Peking Union Medical College Hospital, China Academic Medical Science and Peking Union Medical College, Beijing, People’s Republic of China; 3Department of Obstetrics and Gynecology, Peking Union Medical College Hospital, China Academic Medical Science and Peking Union Medical College, Beijing, People’s Republic of China
Correspondence: Peng Ju Liu
Department of Clinical Nutrition, Peking Union Medical College Hospital, China Academic Medical Science and Peking Union Medical College, #1 Shuaifuyuan, Dongcheng District, Beijing, 100730, People’s Republic of China
Tel +86 10-69155550
Fax +86 10-69155551
Email [email protected]
Background: The hypertriglyceridemic waist phenotype (HWP) has exhibited a strong association with metabolic syndrome, a condition closely linked with nonalcoholic fatty liver disease (NAFLD). However, no study has investigated whether the HWP can accurately predict NAFLD among premenopausal and postmenopausal women or whether alternative anthropometric indexes could replace waist circumference (WC) in the HWP. We examined the power of phenotypes combining triglyceride (TG) levels with anthropometric indexes such as body mass index (BMI), WC, waist-to-hip ratio, waist-to-height ratio, and percent body fat, to detect NAFLD among premenopausal and postmenopausal women.
Methods: We conducted a cross-sectional study of 1125 premenopausal women and 654 postmenopausal women who had received an annual health checkup. For all the participating women, we measured both anthropometric and biochemical indexes, such as serum lipid levels. NAFLD diagnoses were made on the basis of abdominal ultrasonography findings. The receiver operating characteristic curve and area under the curve (AUC) were used to evaluate the indicators’ ability to detect NAFLD.
Results: Among the indicators of hepatic steatosis, the combined phenotypes of TG level (≥ 1.50 mmol/L) and BMI (≥ 24.0 kg/m2) exhibited the largest AUC (0.841, 95%confidence interval [CI] 0.812– 0.871, P< 0.001) for premenopausal women, whereas WC alone exhibited the highest predictive potential (0.765, 95% CI 0.729– 0.801, P< 0.001) for postmenopausal women.
Conclusion: Out of all the phenotypes combining a single anthropometric index with TG level or WC and TG level, the combination of TG level and BMI was the best indicator of NAFLD for premenopausal women. For screening NAFLD in postmenopausal women, WC alone was superior to all other indicators.
Keywords: nonalcoholic fatty liver disease, hepatic steatosis, anthropometric index, hypertriglyceridemic waist phenotype, menopause
Introduction
Nonalcoholic fatty liver disease (NAFLD) is one of the most common chronic liver disorders and affects approximately 25% of the general population worldwide.1 NAFLD is divided into the histological categories of nonalcoholic fatty liver disease and nonalcoholic steatohepatitis. Patients with nonalcoholic fatty liver disease include those with simple hepatic steatosis as well as steatosis and mild nonspecific inflammation. The main difference between the two categories is that nonalcoholic steatohepatitis includes the additional presence of characteristics of hepatocellular injury with or without fibrosis.2 The prevalence of NAFLD has increased in tandem with the increasing rates of obesity worldwide. Between 75 and 100 million individuals in the United States are estimated to have NAFLD.3 The overall prevalence of NAFLD in Chinese adults has reached 20.1%, according to a recent meta-analysis.4 Existing evidence suggests that NAFLD might contribute to the development of type 2 diabetes mellitus (T2DM) and metabolic syndrome (MetS) rather than merely being a manifestation of these conditions.5 Furthermore, individuals with NAFLD have a significantly increased risk of cardiovascular disease,6 and patients with evidence of nonalcoholic steatohepatitis (NASH) and advanced fibrosis have a markedly increased risk of both overall and liver-specific mortality.7 However, most individuals with NAFLD are asymptomatic or have nonspecific symptoms. Thus, early detection, intensive surveillance, and appropriate intervention are necessary to reduce morbidity and mortality in individuals with NAFLD. Although liver biopsy has been the gold standard for identifying NAFLD, using this method in a population-based study is impractical because of its invasiveness, poor acceptability, sampling variability, and cost.8 For these reasons, abdominal ultrasonography, which is a noninvasive method, is the most common technique used to assess the presence of NAFLD in clinical settings, with a known sensitivity of 85% and specificity of 94%.9
Because NAFLD is frequently associated with metabolic comorbidities, such as obesity, dyslipidemia, insulin resistance, MetS, and T2DM,1 and may also represent another component of MetS, numerous epidemiological and public health studies have employed anthropometric indices to predict hepatic steatosis because of the simplicity of their measurement.10–12 However, the majority of these studies have analyzed only one or several anthropometric measurements to screen for NAFLD. Several studies have investigated the effects of the hypertriglyceridemic waist phenotype (HWP), which is the combination of triglyceride (TG) levels and waist circumference (WC). The results of these studies have revealed that the HWP is closely related to T2DM,13 cardiovascular disease,14 and MetS15 and have suggested that the use of WC and TG levels together could lead to more accurate predictions of metabolic abnormalities than the use of WC or TG level alone. However, no studies have investigated whether the HWP can accurately predict NAFLD in premenopausal and postmenopausal women. In addition, an anthropometric index’s ability to predict NAFLD may differ according to patients’ menopausal status.12 Therefore, we examined the predictive power of phenotypes combining TG levels with various anthropometric indices, including body mass index (BMI), WC, waist-to-hip ratio (WHR), waist-to-height ratio (WHtR), and percent body fat (PBF), to detect hepatic steatosis in premenopausal and postmenopausal women and assist general physicians in identifying patients at risk of NAFLD and patients requiring further evaluation.
Participants and Methods
Study Population
This was a cross-sectional study. Participants were recruited in a consecutive manner from a group of patients who had voluntarily undergone an annual health checkup at the Department of Medical Examination Center of Peking Union Medical College Hospital (PUMCH, Beijing, China) between July and December 2017. This study was approved by the Ethics Committee of PUMCH, China Academy of Medical Sciences and was conducted in accordance with the standards of the International Committee on Harmonization on Good Clinical Practice and the revised version of the Declaration of Helsinki. All women were of Chinese nationality and between the ages of 20 and 79 years. Participants with malignancy or severe renal or hepatic diseases were excluded. Participants were also excluded from this study if they met any of the following criteria: (1) history of chronic viral liver disease (a positive test for hepatitis B surface antigens or hepatitis C antibodies), autoimmune liver disease, or inflammatory bowel disease; (2) extensive history of alcohol intake (>20 g of ethanol per day); (3) use of a medication that might affect body weight or body composition (such as steroids) within the 6 months prior to the study; and (4) participation in a weight loss program. Postmenopausal women were defined as women who naturally had amenorrhea without any pathological cause for 12 months after their final menstruation. A total of 1125 premenopausal women and 654 postmenopausal women were included in this study.
Procedure
All study participants provided written informed consent form before participation. A standard questionnaire was used by trained physicians to collect information on lifestyle factors (smoking status [nonsmoker, ex-smoker, or current smoker] and drinking status [nondrinker, ex-drinker, or current drinker (alcohol intake of < 20g of ethanol per day)]), the last menstrual cycle, medical history, and medication use (such as antihypertensive, hypolipidemic, or hypoglycemic medications). Two blood pressure readings (to the nearest 2 mm Hg) were obtained from the right arm of participants in a seated position after 30 minutes of rest. The average of these two measurements was used. A routine physical examination was then performed on all participants.
Anthropometric Measurements and Definitions of the HWP, Overweight, and Obesity
The weights and heights of the participants were measured by well-trained examiners. BMI was calculated as weight (kg)/height2 (m2). WC was measured to the nearest 0.1 cm at the end of normal expiration at the midpoint between the lower borders of the rib cage and the iliac crest. Hip circumference was obtained at the widest point between the hips and the buttocks. WHR was calculated as WC (cm) divided by hip circumference (cm). WHtR was calculated as WC (cm) divided by height (cm). PBF was estimated through multifrequency bioelectric impedance analysis (Inbody 720; Biospace Co. Ltd., Seoul, Korea). Four electrodes were placed on the palms and thumbs of both hands, and four electrodes were placed on the anterior and posterior aspects of the soles of both feet. Recent reports have defined HWP as follows: TG level ≥ 1.50 mmol/L and WC ≥ 85cm in women.16 Therefore, women with TG level< 1.50 mmol/L or WC < 85cm were regarded as not having HWP.
Overweight was defined as a BMI of 24.0 kg/m2 or higher or PBF of 30% or higher, whereas central obesity was defined as a WHR of 0.8 or higher or WHtR of 0.5 or higher.17 In the HWP, we replaced the WC criterion (≥85cm) with the criteria for overall and central obesity to obtain a variety of phenotypes combining TG level and anthropometric indices.
Biochemical Measurements
Venous blood samples were collected after a 12-hour overnight fast and were immediately centrifuged at 4°C. Concentrations of plasma glucose, total cholesterol (TC), TG, high-density lipoprotein cholesterol (HDL-c), low-density lipoprotein cholesterol (LDL-c), uric acid, and high-sensitivity C-reactive protein (hs-CRP) were measured using an automatic analyzer (Beckman 5800; Beckman Coulter Inc., Brea, CA, USA).
Statistical Analysis
Statistical analysis was performed using SPSS version 17.0 (SPSS Inc, Chicago, IL, USA). Normally distributed variables were described as means (SD), whereas skewed variables were presented as medians (interquartile range, 25–75%). The Kolmogorov–Smirnov test was performed to determine whether the quantitative data conformed to a normal distribution. In the analysis of the participants’ basic characteristics, the participants were divided into two groups: a NAFLD group and a non-NAFLD group (participants whose physical examinations during the recruitment period did not reveal hepatic steatosis).The quantitative variables were compared between the NAFLD and non-NAFLD groups through an independent-samples t-test or the Mann–Whitney U-test as appropriate, whereas categorical variables (such as the percentages of patients with T2DM, drinking status, and smoking status) were presented as frequencies (percentages) and examined using a chi-square test. A binary logistic regression analysis was performed to estimate the associations of hepatic steatosis with phenotypes combining TG levels and anthropometric indices or TG or WC alone, with adjustment for age, lifestyle variables, blood pressure, the presence of diabetes, and fasting blood glucose (FBG), hs-CRP, serum uric acid (SUA), alanine aminotransferase (ALT), and aspartate aminotransferase (AST) levels. The area under the curve (AUC) of the receiver operating characteristic (ROC) curve was used to compare the indices’ ability to predict hepatic steatosis. All P values were two-tailed, and P< 0.05 was considered statistically significant.
Definition of NAFLD
Abdominal ultrasonography (Nemio 30, Toshiba, Japan) was performed by an experienced examiner who was blinded to the results. NAFLD was defined as the presence of hepatic steatosis in ultrasonography, indicated by a bright hepatic echo pattern, increased attenuation of the echo beam, and loss of intrahepatic architectural detail without a secondary cause. The degree of NAFLD was categorized as absent, mild, moderate, or severe based on the NAFLD sonographic criteria.
Results
Basic Characteristics of the Participants
Among the premenopausal women, 19.5% were classed as having hepatic steatosis; 39.9% of the postmenopausal women were a diagnosed as having hepatic steatosis through abdominal ultrasonography.
Table 1 presents the characteristics of the participants. Compared with premenopausal women without hepatic steatosis, those with hepatic steatosis were older (P< 0.01); had significantly higher values for BMI, WC, WHR, WHtR, PBF, systolic blood pressure (SBP), and diabolic blood pressure (DBP);had significantly higher levels of TC, TG, LDL-c, FBG, ALT, AST, SUA, and hs-CRP; had a significantly higher likelihood of having diabetes (all P< 0.01); and had lower HDL-c levels (P< 0.01). Compared with postmenopausal women without hepatic steatosis, those with hepatic steatosis had significantly higher BMI, WC, WHR, WHtR, PBF, SBP, and DBP values and TG, LDL-c, FBG, ALT, SUA, and hs-CRP levels and a significantly higher rate of diabetes (all P< 0.01) but lower HDL-c levels (P< 0.01).No significant differences in age, TC level, or AST level were observed between the two groups.
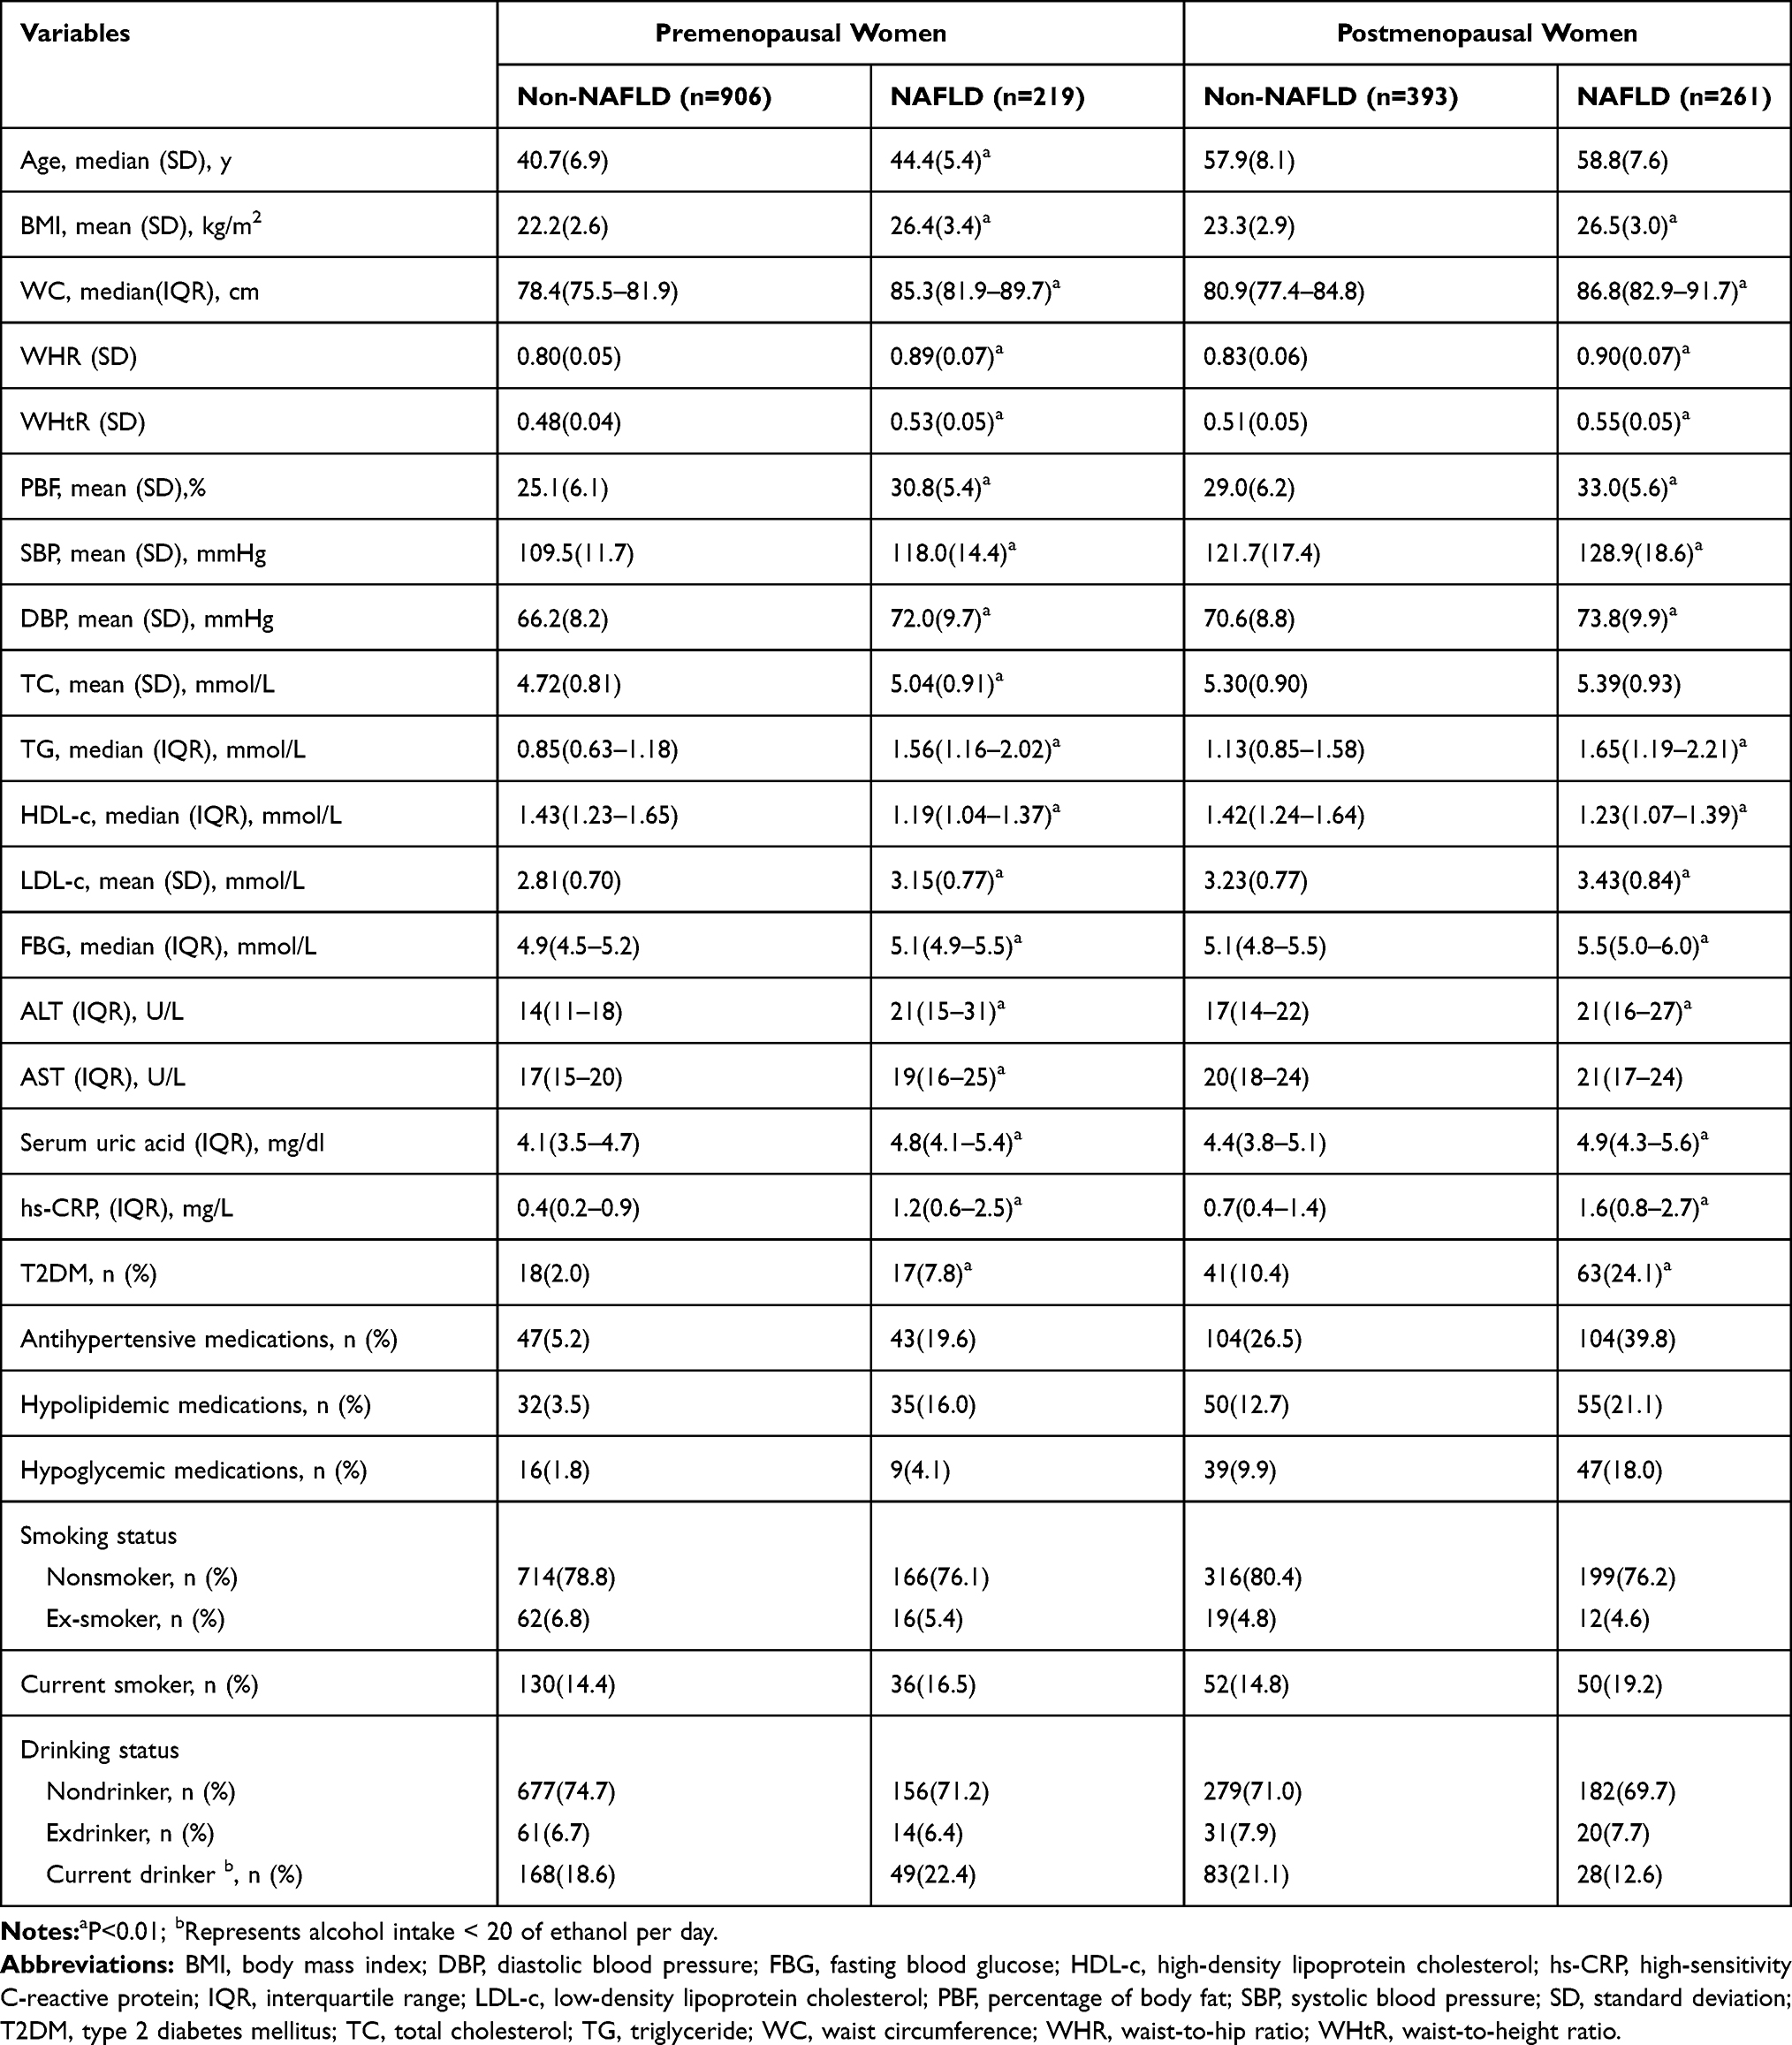 |
Table 1 Baseline Characteristics with and without Hepatic Steatosis Among Pre- and Postmenopausal Women |
Associations of Hepatic Steatosis with All Indices According to Menopausal Status
Tables 2 and 3 list the associations of hepatic steatosis with the phenotypes combining TG levels with anthropometric indices and with the phenotypes of TG level or WC alone for premenopausal and postmenopausal women. All indices exhibited significant associations with hepatic steatosis in both premenopausal and postmenopausal women.
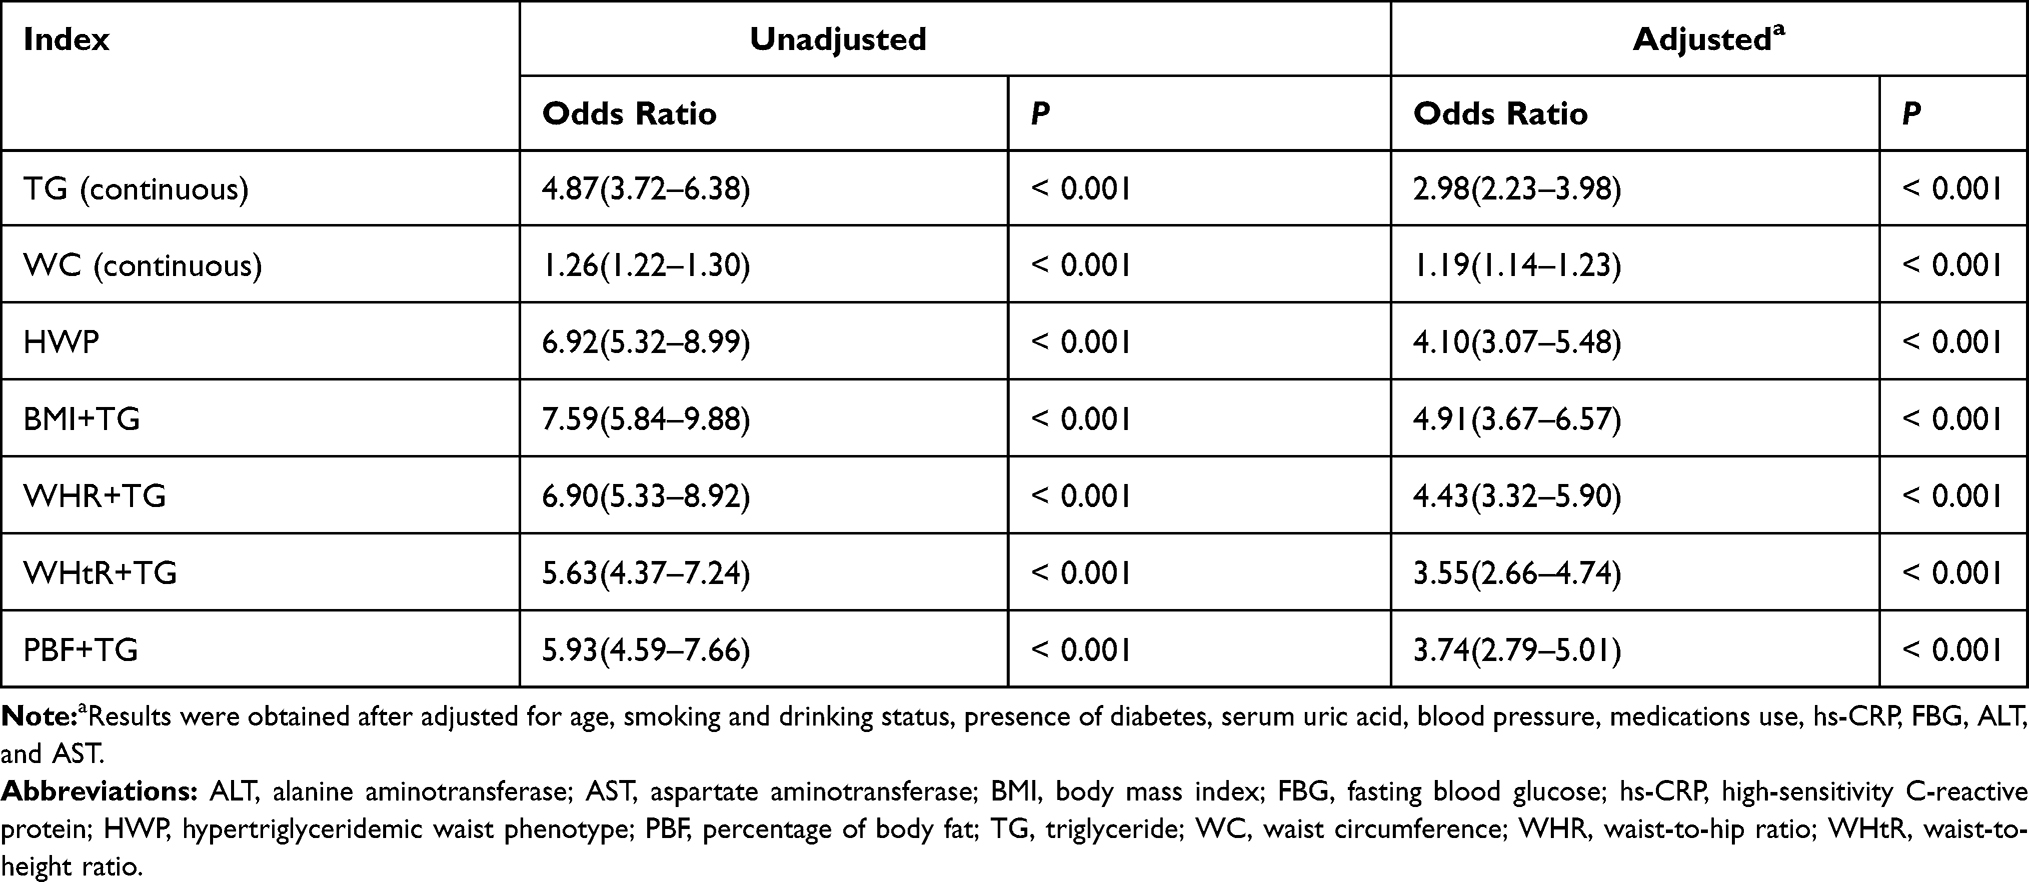 |
Table 2 Analysis of the Association Between Hepatic Steatosis and Indicators in Premenopausal Women |
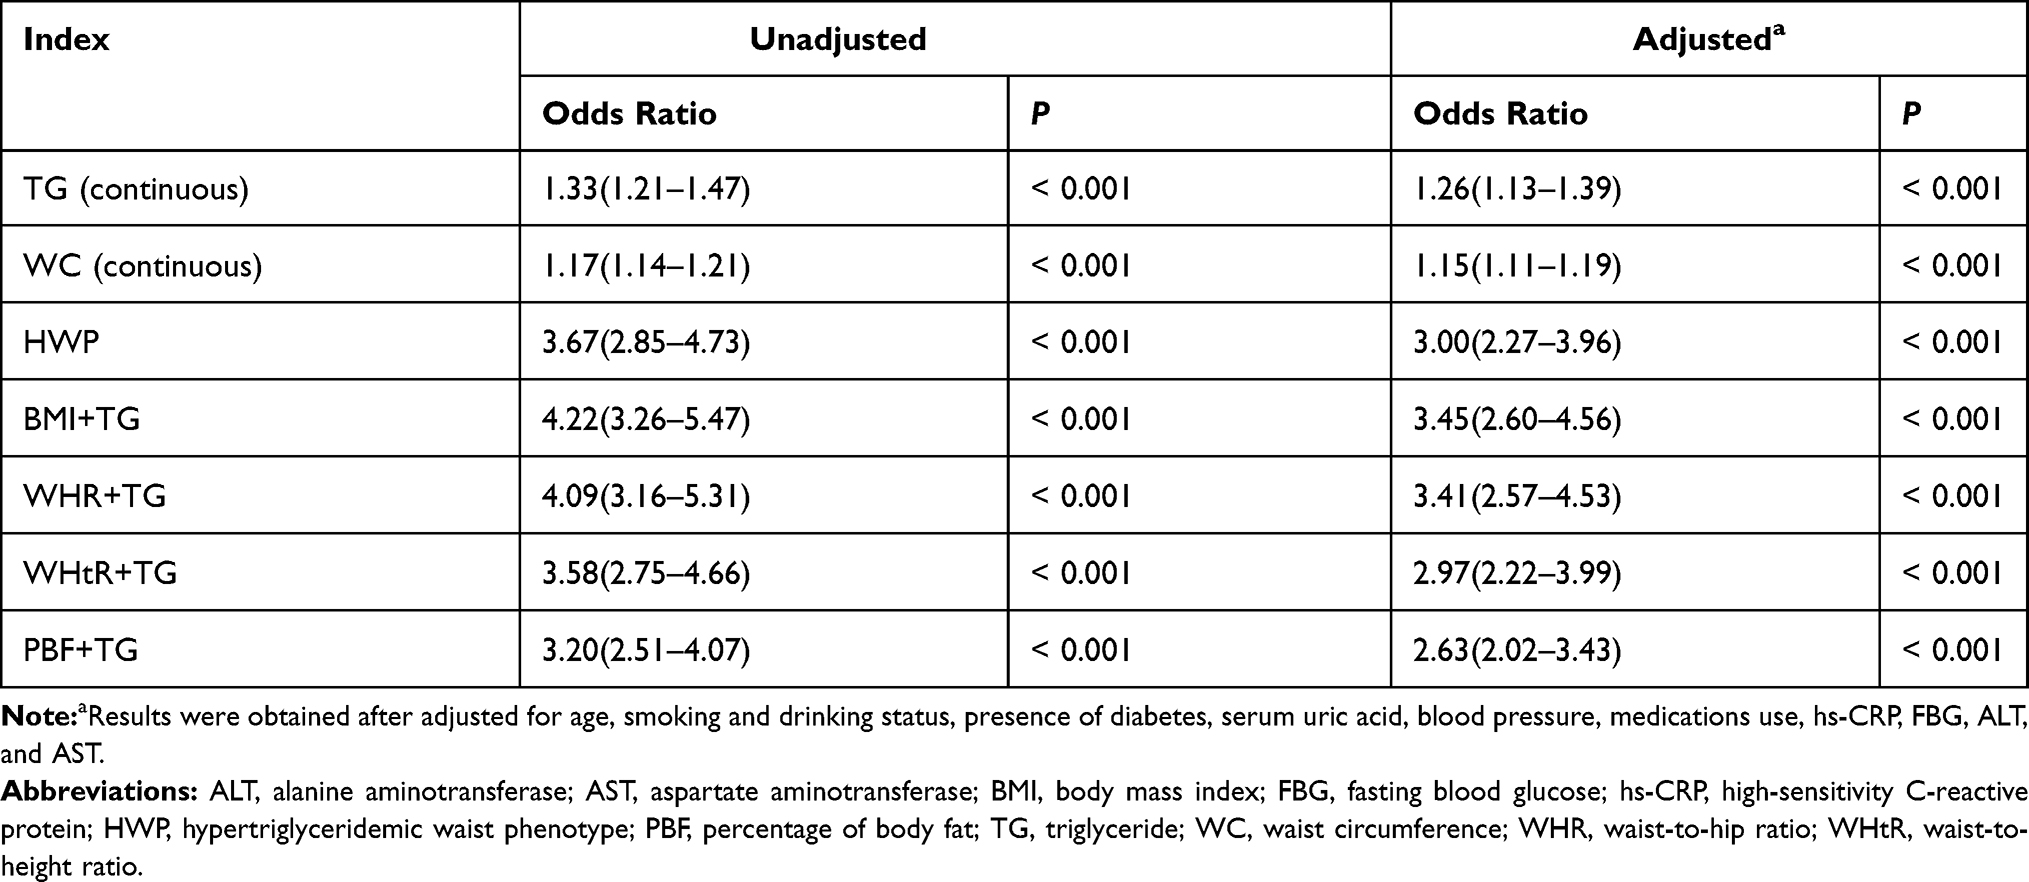 |
Table 3 Analysis of the Association Between Hepatic Steatosis and Indicators in Postmenopausal Women |
For premenopausal women, out of all the variables combining TG levels and anthropometric indices, the TG level + BMI phenotype exhibited the strongest association with hepatic steatosis (adjusted OR = 5.04 [3.78–6.72], P< 0.001), followed by the TG level + WHR, HWP, TG level + PBF, and TG level + WHtR phenotypes, with adjustment for age, smoking and drinking status, blood pressure, the presence of diabetes, and FBG, hs-CRP, SUA, ALT, and AST levels.
For postmenopausal women, out of all the phenotypes combining TG levels and anthropometric indices, the TG level + WHR phenotype exhibited the strongest association with hepatic steatosis (adjusted OR = 3.53 [2.66–4.68], P< 0.001), followed by the TG level + BMI, TG level + WHtR, HWP alone, and TG level + PBF phenotypes, with the same adjustments for variables as those made for the premenopausal women.
Indicators’ Performance in Detecting NAFLD
Table 4 presents the predictive power of the phenotypes combining TG levels with anthropometric indices in premenopausal and postmenopausal women. Both the phenotypes combining TG level with anthropometric indices and the phenotypes of TG level and WC alone had significant areas under the ROC curve. However, the AUCs of these indicators suggest that they performed differently in detecting hepatic steatosis between and within the premenopausal and postmenopausal groups.
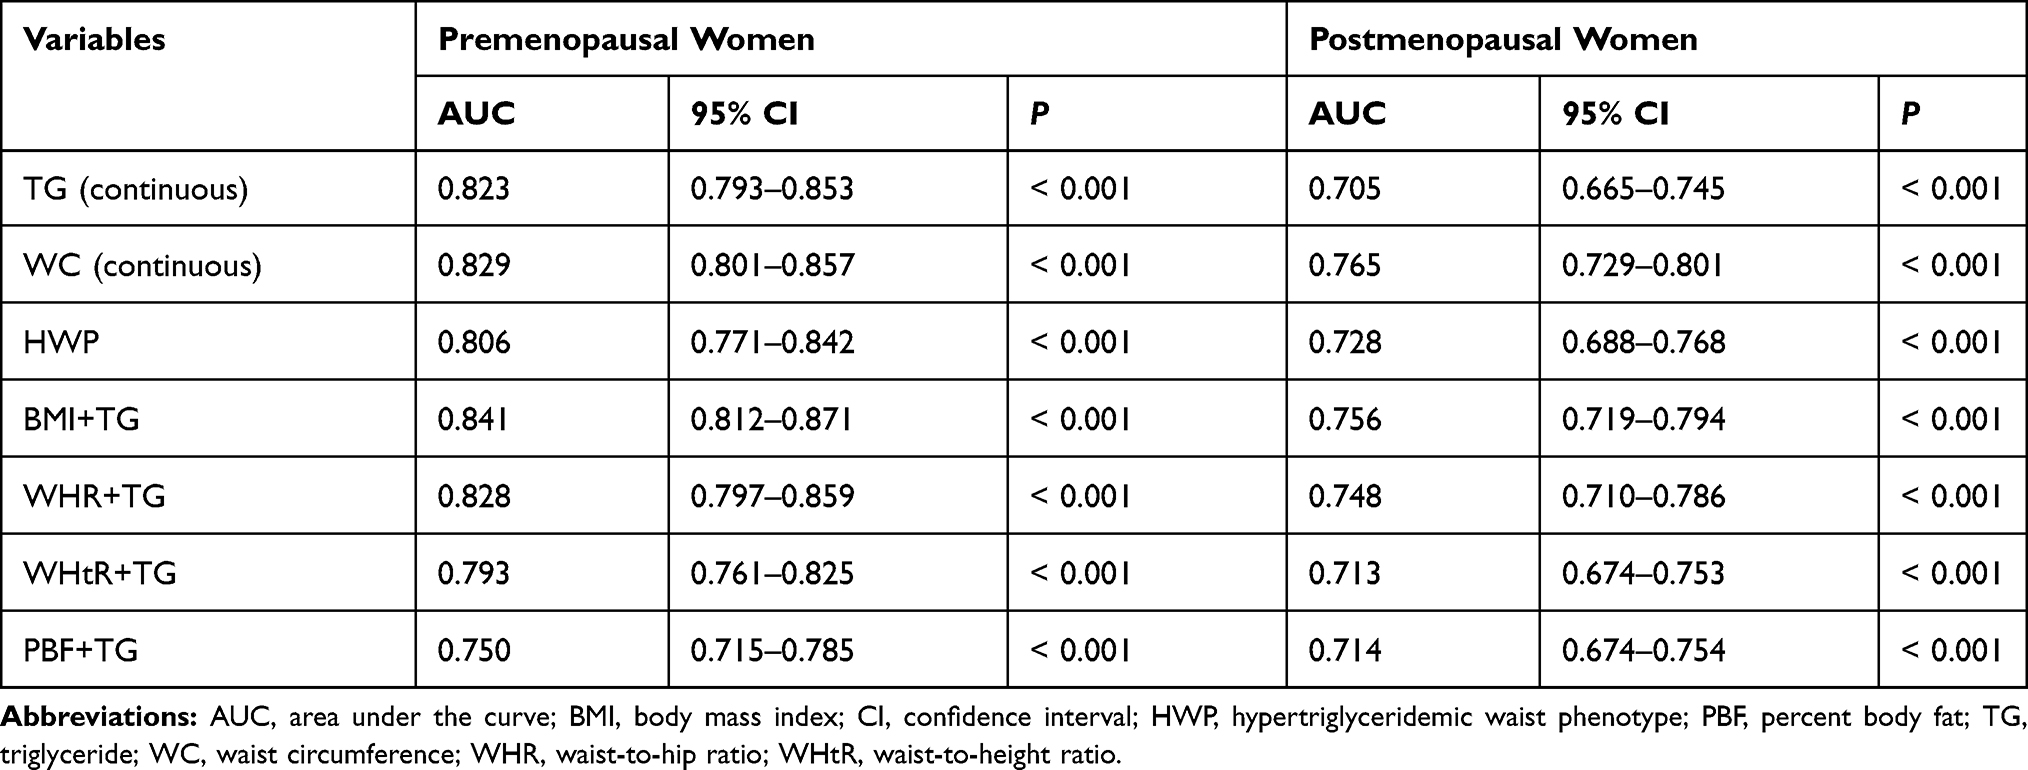 |
Table 4 AUC of the Indicators to Detect Nonalcoholic Fatty Liver Disease According to Menopausal Status |
For premenopausal women, the TG level + BMI phenotype exhibited the largest AUC, followed by the WC alone, TG level + WHR, TG level alone, HWP alone, TG level + WHtR, and TG level + PBF phenotypes. For postmenopausal women, the WC alone phenotype exhibited the largest AUC for detecting the presence of hepatic steatosis, followed by the TG level + BMI, TG level + WHR, HWP alone, TG level+ PBF, TG level + WHtR, and TG level alone.
Discussion
We found that out of the various phenotypes combining a single anthropometric index with TG level and those of WC or TG level alone, the optimal indicator of hepatic steatosis may differ according to patients’ menopausal status. The TG level + BMI combination was the best indicator of hepatic steatosis for premenopausal women, whereas in postmenopausal women, WC alone was superior to all phenotypes combining TG level with an anthropometric index. These results suggest that menopausal status should be considered when selecting the appropriate marker for detecting NAFLD. According to the ROC analysis, the combination of TG level and BMI (0.841 [95% confidence interval (CI), 0.812–0.871]) can detect the presence of hepatic steatosis in premenopausal women with high accuracy. For postmenopausal women, WC alone (0.765 [95% CI, 0.729–0.801]) detected the presence of hepatic steatosis with high accuracy.
Obesity, especially central obesity, is a well-known risk factor for NAFLD. In the case of central obesity, insulin resistance is a common condition that contributes to the excessive release of fatty acids from adipose tissue and that also upregulates the transcription of genes promoting de novo lipogenesis in the liver. These reactions lead to hepatic steatosis.18 In this study, the prevalence of NAFLD in postmenopausal women was higher than that in premenopausal women (39.9% vs 19.5%). The prevalence of NAFLD in postmenopausal women was higher than the overall prevalence of NAFLD in Chinese adults,4 whereas the prevalence in premenopausal women was similar to the reported results, suggesting that menopause is associated with the progression of NAFLD.19 These results are similar to those of Wong et al, who reported that the prevalence of NAFLD was approximately two times higher in men than in women but that the prevalence of NAFLD in women older than 50 years was equal to or higher than that in men.20 Given that the average age of menopause is approximately 50 years, menopause itself might affect metabolic changes and increase the development of NAFLD. One possible explanations is that a decline in estrogen level leads to hepatic steatosis through a reduction of fatty acid oxidation and an increase in lipogenesis within the liver.21 In addition, postmenopausal women accumulate more fat tissue in the intra-abdominal region than do premenopausal women and are therefore more likely to develop metabolic disorders,22 making postmenopausal women more prone to hepatic steatosis. Furthermore, the percentage of postmenopausal women with diabetes was higher than the percentage of premenopausal women with diabetes in our study (15.9% vs 3.1%), which may contribute to the difference in the prevalence of NAFLD between premenopausal and postmenopausal women.
A large amount of research has investigated the simplest and most inexpensive methods of screening for NAFLD. Among the available methods, anthropometric indices, including BMI, WC, WHR, and WHtR, are frequently used because of the simplicity of their measurement in population studies. Although several studies have examined the association between NAFLD and commonly used anthropometric indices to determine the best indicator of NAFLD in different populations,10–12 only one study has examined the best obesity parameter for predicting the risk of NAFLD in premenopausal and postmenopausal women.12 Although the anthropometric index WHR was not the main observational indicator of NAFLD in our study, one of our previous studies showed that WHR was the best predictor for MetS development in postmenopausal Chinese women.17
In addition to being correlated with central obesity, NAFLD is correlated with insulin resistance, which may contribute to impairment in the oxidation and utilization of fatty acids.23 Such impairment increases the flux of free fatty acids from adipose to nonadipose tissue, resulting in abnormalities in fat metabolism and increasing the severity of many of the fundamental metabolic derangements, such as hyperlipidemia, that are characteristic of insulin resistance.24 Moreover, evidence indicates that hepatic TG level is a strong determinant of hepatic insulin resistance and the intramyocellular TG level of muscle insulin resistance,25–27 suggesting that TG level plays a vital role in insulin resistance. Thus, numerous studies have investigated the role of the HWP in screening for MetS and MetS-related diseases. However, to the best of our knowledge, whether the HWP or phenotypes combining TG level and other anthropometric indices can accurately predict NAFLD among premenopausal and postmenopausal women remains unclear. In our study, the associations between hepatic steatosis and phenotypes combining TG level with anthropometric indexes were stronger in premenopausal women than in postmenopausal women. For premenopausal women, the TG level + BMI phenotype exhibited the strongest association with hepatic steatosis according to the regression analysis. For postmenopausal women, the TG level + WHR phenotype exhibited the strongest association with hepatic steatosis. Our results are consistent with those of a recent study that reported that the anthropometric indices BMI, WC, and WHR exhibited similar potential for predicting the risk of NAFLD in premenopausal women but that WHR was the most discriminative indicator for detecting NAFLD in postmenopausal women.12 A possible explanation is that WHR reflects the assumed ratio of abdominal visceral adipose tissue (VAT) to femoral-gluteal subcutaneous adipose tissue (SAT). Because hormonal changes after menopause cause the deposition of abdominal VAT from femoral SAT, the clinical significance of WHR may become clearer after menopause,28 whereas the imbalance between visceral and lower extremity subcutaneous fat is less relevant to the risk of NAFLD in premenopausal women.12
Furthermore, we analyzed the ROC curve and the AUC for each indicator to evaluate these indicators’ ability to detect NAFLD and found that the optimal indicator of hepatic steatosis differed between premenopausal and postmenopausal women. The TG level + BMI phenotype had the largest AUC value for premenopausal women. By contrast, the WC alone phenotype exhibited the largest AUC for detecting hepatic steatosis in postmenopausal women. These findings suggest that anthropometric indices and blood lipid levels should be combined to maximize the potential for identifying hepatic steatosis in premenopausal women. For postmenopausal women, as other studies have shown,12,17 the anthropometric indices WC and WHR can be used to screen for NAFLD at least as effectively as phenotypes combining TG level and anthropometric indices.
This study investigated the ability of phenotypes combining TG levels and anthropometric indices to detect hepatic steatosis among premenopausal and postmenopausal women. However, the study had several limitations. The cross-sectional design made it difficult to assess whether a causal relationship existed. In addition, ultrasonography is not the gold standard for diagnosing NAFLD, although it is generally regarded as a fairly noninvasive and reliable method for hepatic steatosis diagnosis with high sensitivity and specificity.9 We also only collected general information regarding patients’ medication use, such as the use of antihypertensive, hypolipidemic, or hypoglycemic medications. However, different medications for the treatment of the same disease may affect metabolic markers differently and therefore could have affected the results of this study to some extent. Finally, we were unable to collect detailed data regarding patients’ dietary habits and physical activity levels.
Conclusions
The combination of TG level + BMI is the best indicator of hepatic steatosis for premenopausal women. For postmenopausal women, WC alone is superior to all other phenotypes in the screening of NAFLD. Menopausal status should be considered during the selection of the appropriate marker for detecting NAFLD.
Abbreviations
ALT, alanine aminotransferase; AST, aspartate aminotransferase; AUC, area under the curve; BMI, body mass index; DBP, diastolic blood pressure; CI, confidence interval; FBG, fasting blood glucose; HDL-c, high-density lipoprotein cholesterol; hs-CRP, high-sensitivity C-reactive protein; HWP, hypertriglyceridemic waist phenotype; LDL-c, low-density lipoprotein cholesterol; MetS, metabolic syndrome; NAFLD, nonalcoholic fatty liver disease; PBF, percentage body fat; SBP, systolic blood pressure; SAT, subcutaneous adipose tissue; SD, standard deviation; T2DM, type 2 diabetes mellitus; TC, total cholesterol; TG, triglyceride; VAT, visceral adipose tissue; WC, waist circumference; WHR, waist-to-hip ratio; WHtR, waist-to-height ratio.
Acknowledgments
We thank all the participants of this study. We acknowledge the Medical Examination Center at Peking Union Medical College Hospital, China Academy of Medical Sciences, and Peking Union Medical College for their assistance in this study.
Author Contributions
All authors made a significant contribution to the work reported, whether that is in the conception, study design, execution, acquisition of data, analysis and interpretation, or in all these areas; took part in drafting, revising or critically reviewing the article; gave final approval of the version to be published; have agreed on the journal to which the article has been submitted; and agree to be accountable for all aspects of the work.
Disclosure
The authors report that they have no conflicts of interest.
References
1. Younossi ZM, Koenig AB, Abdelatif D, Fazel Y, Henry L, Wymer M. Global epidemiology of nonalcoholic fatty liver disease-meta-analytic assessment of prevalence, incidence, and outcomes. Hepatology. 2016;64(1):73–84. doi:10.1002/hep.28431
2. Ludwig J, Viggiano TR, McGill DB, Oh BJ. Nonalcoholic steatohepatitis: Mayo Clinic experiences with a hitherto unnamed disease. Mayo Clin Proc. 1980;55(7):434–438.
3. Trust for America’s Health; RobertWood Johnson Foundation. Adult obesity in the United States. Available from: http://stateofobesity.org/adult-obesity.
4. Li Z, Xue J, Chen P, Chen L, Yan S, Liu L. Prevalence of nonalcoholic fatty liver disease in mainland of China: a meta-analysis of published studies. J Gastroenterol Hepatol. 2014;29(1):42–51. doi:10.1111/jgh.12428
5. Byrne CD, Targher G. NAFLD: a multisystem disease. J Hepatol. 2015;62(1):S47–S64. doi:10.1016/j.jhep.2014.12.012
6. Targher G, Byrne CD, Lonardo A, Zoppini G, Barbui C. Non-alcoholic fatty liver disease and risk of incident cardiovascular disease: a meta-analysis. J Hepatol. 2016;65(3):589–600. doi:10.1016/j.jhep.2016.05.013
7. Cotter TG, Rinella M. Nonalcoholic fatty liver disease 2020: the state of the disease. Gastroenterology. 2020;158(7):1851–1864. doi:10.1053/j.gastro.2020.01.052
8. Castera L, Friedrich-Rust M, Loomba R. Noninvasive assessment of liver disease in patients with nonalcoholic fatty liver disease. Gastroenterology. 2019;156(2019):1264–81.e4. doi:10.1053/j.gastro.2018.12.036
9. Hernaez R, Lazo M, Bonekamp S, et al. Diagnostic accuracy and reliability of ultrasonography for the detection of fatty liver: a metaanalysis. Hepatology. 2011;54(3):1082–1090. doi:10.1002/hep.24452
10. Yoo HJ, Park MS, Lee CH, et al. Cutoff points of abdominal obesity indices in screening for nonalcoholic fatty liver disease in Asians. Liver Int. 2010;30(8):189–196. doi:10.1111/j.1478-3231.2010.02300.x
11. Zheng RD, Chen ZR, Chen JN, Lu YH, Chen J. Role of body mass index, waist-to-height and waist-to-hip ratio in prediction of nonalcoholic fatty liver disease. Gastroenterol Res Pract. 2012;2012:362147. doi:10.1155/2012/362147
12. Hong SH, Hwang SY, Kim JA, et al. Comparison of anthropometric indices for the screening of nonalcoholic fatty liver disease in pre- and postmenopausal women. Menopause. 2020;27(1):88–94. doi:10.1097/GME.0000000000001419
13. Sam S, Haffner S, Davidson MH, et al. Hypertriglyceridemic waist phenotype predicts increased visceral fat in subjects with type 2 diabetes. Diabetes Care. 2009;32(10):1916–1920. doi:10.2337/dc09-0412
14. Tankó LB, Bagger YZ, Qin G, Alexandersen P, Larsen PJ, Christiansen C. Enlarged waist combined with elevated triglycerides is a strong predictor of accelerated atherogenesis and related cardiovascular mortality in postmenopausal women. Circulation. 2005;111(15):1883–1890. doi:10.1161/01.CIR.0000161801.65408.8D
15. Blackburn P, Lemieux I, Alméras N, et al. The hypertriglyceridemic waist phenotype versus the national cholesterol education program-adult treatment panel III and international diabetes federation clinical criteria to identify high-risk men with an altered cardiometabolic risk profile. Metabolism. 2009;58(8):1123–1130. doi:10.1016/j.metabol.2009.03.012
16. Lee BJ, Kim JY. Identification of metabolic syndrome using phenotypes consisting of triglyceride levels with anthropometric indices in Korean. BMC Endocr Disord. 2020;20(1):29. doi:10.1186/s12902-020-0510-0
17. Liu PJ, Ma F, Lou HP, Zhu YN. Utility of obesity indices in screening Chinese postmenopausal women for metabolic syndrome. Menopause. 2014;21(5):509–514. doi:10.1097/GME.0b013e3182a170be
18. Ahmed A, Wong RJ, Harrison SA. Nonalcoholic fatty liver disease review: diagnosis, treatment, and outcomes. Clin Gastroenterol Hepatol. 2015;13(12):2062–2070. doi:10.1016/j.cgh.2015.07.029
19. Venetsanaki V, Polyzos SA. Menopause and non-alcoholic fatty liver disease: a review focusing on therapeutic perspectives. CurrVascPharmacol. 2019;17:546–555.
20. Wong VW, Chu WC, Wong GL, et al. Prevalence of non-alcoholic fatty liver disease and advanced fibrosis in Hong Kong Chinese: a population study using proton-magnetic resonance spectroscopy and transient elastography. Gut. 2012;61:409–415. doi:10.1136/gutjnl-2011-300342
21. Suzuki A, Abdelmalek MF. Nonalcoholic fatty liver disease in women. J Womens Health (Larchmt). 2009;5(2):191–203. doi:10.2217/17455057.5.2.191
22. Shi H, Cleqq DJ. Sex differences in the regulation of body weight. Physiol Behav. 2009;97:199–204.
23. Kelley DE, Goodpaster BH. Skeletal muscle triglyceride. An aspect of regional adiposity and insulin resistance. Diabetes Care. 2011;24(5):933–941. doi:10.2337/diacare.24.5.933
24. Lewis GF, Carpentier A, Adeli K, Giacca A. Disordered fat storage and mobilization in the pathogenesis of insulin resistance and type 2 diabetes. Endocr Rev. 2002;23:201–229.
25. Ryysy L, Häkkinen AM, Goto T, et al. Hepatic fat content and insulin action on free fatty acids and glucose metabolism rather than insulin absorption are associated with insulin requirements during insulin therapy in type 2 diabetic patients. Diabetes. 2000;49(5):749–758. doi:10.2337/diabetes.49.5.749
26. Goodpaster BH, Thaete FL, Simoneau JA, Kelley DE. Subcutaneous abdominal fat and thigh muscle composition predict insulin sensitivity independently of visceral fat. Diabetes. 1997;46(10):1579–1585. doi:10.2337/diacare.46.10.1579
27. Pan DA, Lillioja S, Kriketos AD, et al. Skeletal muscle triglyceride levels are inversely related to insulin action. Diabetes. 1997;46(6):983–988. doi:10.2337/diab.46.6.983
28. Lovejoy JC, Champagne CM, De Jonge L, Xie H, Smith SR. Increased visceral fat and decreased energy expenditure during the menopausal transition. Int J Obes (Lond). 2008;32(6):949–958. doi:10.1038/ijo.2008.25
 © 2021 The Author(s). This work is published and licensed by Dove Medical Press Limited. The full terms of this license are available at https://www.dovepress.com/terms.php and incorporate the Creative Commons Attribution - Non Commercial (unported, v3.0) License.
By accessing the work you hereby accept the Terms. Non-commercial uses of the work are permitted without any further permission from Dove Medical Press Limited, provided the work is properly attributed. For permission for commercial use of this work, please see paragraphs 4.2 and 5 of our Terms.
© 2021 The Author(s). This work is published and licensed by Dove Medical Press Limited. The full terms of this license are available at https://www.dovepress.com/terms.php and incorporate the Creative Commons Attribution - Non Commercial (unported, v3.0) License.
By accessing the work you hereby accept the Terms. Non-commercial uses of the work are permitted without any further permission from Dove Medical Press Limited, provided the work is properly attributed. For permission for commercial use of this work, please see paragraphs 4.2 and 5 of our Terms.