")
Back to Journals » OncoTargets and Therapy » Volume 13
Identification of Genomic Alterations of Perineural Invasion in Patients with Stage II Colorectal Cancer
Authors Su H, Chang C, Hao J, Xu X, Bao M, Luo S, Zhao C , Liu Q, Wang X, Zhou Z, Zhou H
Received 28 May 2020
Accepted for publication 22 October 2020
Published 11 November 2020 Volume 2020:13 Pages 11571—11582
DOI https://doi.org/10.2147/OTT.S264616
Checked for plagiarism Yes
Review by Single anonymous peer review
Peer reviewer comments 3
Editor who approved publication: Prof. Dr. Nicola Silvestris
Hao Su,1 Chen Chang,2 Jiajie Hao,2 Xin Xu,2 Mandula Bao,1 Shou Luo,1 Chuanduo Zhao,1 Qian Liu,1 Xishan Wang,1 Zhixiang Zhou,1 Haitao Zhou1
1Department of Colorectal Surgery, National Cancer Center/National Clinical Research Center for Cancer/Cancer Hospital, Chinese Academy of Medical Science and Peking Union Medical College, Beijing, People’s Republic of China; 2State Key Laboratory of Molecular Oncology, National Cancer Center/National Clinical Research Center for Cancer/Cancer Hospital, Chinese Academy of Medical Science and Peking Union Medical College, Beijing, People’s Republic of China
Correspondence: Zhixiang Zhou; Haitao Zhou
National Cancer Center/National Clinical Research Center for Cancer/Cancer Hospital, Chinese Academy of Medical Sciences and Peking Union Medical College, 17 Panjiayuan Nanli, Chaoyang District, Beijing 100021, People’s Republic of China
Tel/Fax +861087787110
Email [email protected]; [email protected]
Purpose: The molecular mechanism of perineural invasion (PNI) in stage II colorectal cancer (CRC) remains not to be defined clearly. This study aims to identify the genomic aberrations related to PNI in stage II CRC.
Patients and Methods: Using array-based comparative genomic hybridization (array-CGH), primary tumor tissues and paracancerous normal tissues of stage II CRC with PNI and without PNI were analyzed. We identified genomic aberrations by using Genomic Workbench and MD-SeeGH and validated the aberrations of selected genes by real-time polymerase chain reaction (PCR). Gene ontology (GO) and pathway analysis were performed to determine the most likely biological effects of these genes.
Results: The most frequent gains in stage II CRC were at 7q11.21-q11.22, 8p11.21, 8p12-p11.23, 8q11.1-q11.22, 13q12.13-q12.2, and 20q11.21-q11.23 and the most frequent losses were at 17p13.1-p12, 8p23.2, and 118q11.2-q23. Four high-level amplifications at 8p11.23-p11.22, 18q21.1, 19q11-q12, and 20q11.21-q13.32 and homozygous deletions at 20p12.1 were discovered in Stage II CRC. Gains at 7q11.21-q22.1, 16p11.2, 17q23.3-q25.3, 19p13.3-p12, and 20p13-p11.1, and losses at 11q11-q12.1, 11p15.5-p15.1, 18p11.21, and 18q21.1-q23 were more commonly found in patients with PNI by frequency plot comparison together with detailed genomic analysis. It is also observed that gains at 8q11.1-q24.3, 9q13-q34.3, and 13q12.3-q13.1, and losses at 8p23.3-p12, 17p13.3-p11.2, and 21q22.12 occurred more frequently in patients without PNI. Further validation showed that the expression of FLT1, FBXW7, FGFR1, SLC20A2 and SERPINI1 was significantly up-regulated in the NPNI group compared to the PNI group. GO and pathway analysis revealed some genes enriched in specific pathways.
Conclusion: These involved genomic changes in the PNI of stage II CRC may be useful to reveal the mechanisms underlying PNI and provide candidate biomarkers.
Keywords: array CGH, colorectal cancer, perineural invasion, biomarker
Introduction
Colorectal cancer (CRC) has been ranked third in terms of cancer incidence and second in terms of cancer mortality, according to the International Agency for Research on Cancer (IARC).1 Management of CRC patients is commonly defined by the TNM stage at diagnosis, which is based on the depth of tumor wall invasion, lymph node involvement and distant metastasis.2 However, the TNM stage alone does not accurately predict the prognosis and distinguish whether the patient should receive adjuvant chemotherapy, particularly in patients with stage II CRC. Among CRC, TNM stage II constitutes a very wide spectrum and the 5-year overall survival of surgically resected patients ranges between 75% and 80%.3,4 Plenty of clinicopathological features have been associated with a high risk of recurrence and metastasis in stage II CRC, among which perineural invasion (PNI) has been associated with a poor outcome and the postoperative survival rate of stage II CRC patients with PNI was supposed to be more similar to that of stage III.5–8
Complex signaling between tumor cells, the nerves, and stromal cells is probably related to the pathogenesis of PNI.9–12 Several previous studies have identified that the overexpression of the ITGAV gene, the higher degree of PIWIL2 expression, the downregulated E-cadherin expression, CDX2 loss, and the loss of certain tight junction proteins are associated with a higher progression and spread of CRC.13–15 However, the molecular mechanism of PNI and the internal relation between PNI and tumor metastasis is still largely in its infancy, and related research has not been conducted in patients with stage II CRC. Our interest is to detect frequent DNA copy number changes and identify genomic alternations in stage II CRC patients with PNI. Different from conventional comparative genomic hybridization (CGH), which cannot detect changes in small chromosomal regions, array-based CGH (array-CGH) allows analysis of DNA copy number aberrations (DCNAs) at the gene level and has been used to the rapid genomic-wide screen for genetic aberrations such as gains and losses in solid tumors and proven to be a valuable and a convenient method. In the present study, the genomic alterations of both stage II CRC with PNI and without PNI were investigated by array-CGH.
Materials and Methods
Patients and Tumor Tissues
Fresh tumor tissues and corresponding paracancerous normal tissues from 100 stage II CRC patients in the department of Colorectal Surgery, Cancer Hospital, Chinese Academy of Medical Sciences and Peking Union Medical College, between 2010 and 2015, were included in this study. They were divided into two groups: a PNI group of 50 cases with PNI and a no perineural invasion (NPNI) group of 50 cases without PNI. PNI was defined as that tumor cells surrounded >33% of the nerve circumference without invading through the nerve sheath, as well as tumor cells within any of the three layers of the nerve sheath.
The clinicopathological characteristics of the patients in this study are summarized in Table 1 and the two groups were comparable in terms of age, sex, location, T stage and differentiation. None of the patients had received neoadjuvant therapy and all of them underwent radical operation (R0 resection). The study protocol was approved by the Institutional Review Board for Human Use at Cancer Hospital, Chinese Academy of Medical Sciences, and informed consent for sampling and molecular analysis was obtained from all the patients.
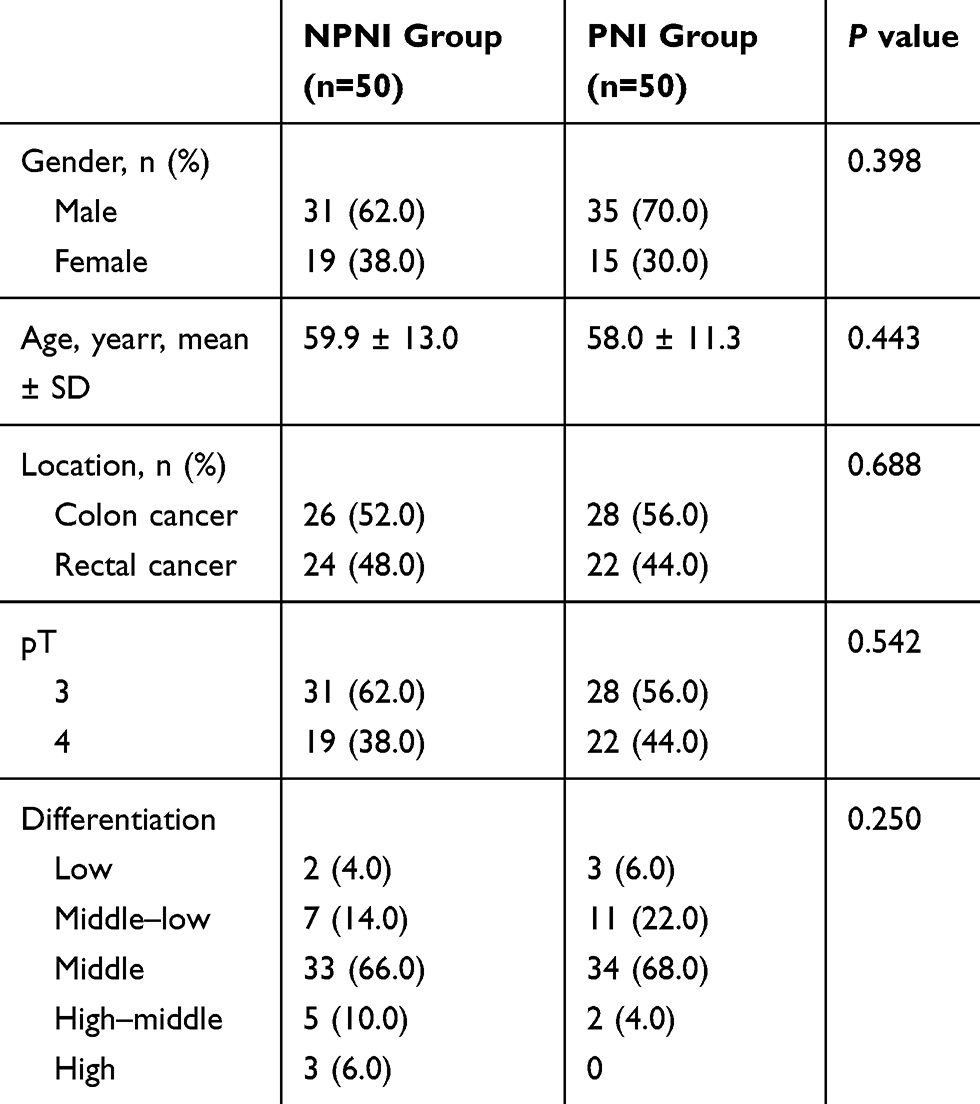 |
Table 1 The Clinicopathological Characteristics of 100 Stage II CRC Patients |
Genomic DNA Extraction
According to the manufacturer’s instructions (Qiagen, Hilden, Germany), the genomic DNA was isolated using the Qiagen DNeasy Blood & Tissue Kit from tumor tissues and the corresponding paracancerous normal tissues.
Array-CGH Analysis
Array-CGH analysis was carried out in five cases with PNI and five cases without PNI using standard Agilent protocols (Agilent Technologies, Santa Clara, CA). DNA from normal tissues was used as a reference for tumor DNA and all the DNA was digested with Alu I and RSA I restriction enzymes (PROMEGA, Warrington, UK). Tumor DNA (500–1000 nd) was labelled by cyanine-5 dUTP and the same amount of normal tissue-matched reference DNA was labelled by cyanine-3 dUTP (Agilent Technologies, Santa Clara, CA). The mixture and hybridization were performed in an Agilent 44K human genome CGH microarray (Agilent) for 40 h after clean-up. Then, the washing, scanning, and data extraction were performed as described earlier.16
Microarray Data Analysis
A specially designed microarray reader system with software Agilent Genomic Workbench (Agilent Technologies, Santa Clara, CA) and MD-SeeGH (www.flintbox.com), was used for analyzing the microarray data. Agilent Genomic Workbench was used to calculate the log2ratio for every probe and to identify genomic aberrations. A mean log2ratio >0.75 of all probes in a chromosome region was considered as a high-level DNA amplification, a mean log2ratio >0.25 and ≤0.75 as a genomic gain, a mean log2ratio <−0.25 and ≥−0.75 as a hemizygous loss, and a mean log2ratio <−0.75 as a homozygous deletion.
Real-Time PCR
To further verify the expression of selected genomic aberrations identified by Array-based CGH, we performed the real-time PCR in all 100 cases. The PCR reactions were carried out with Power SYBR Green PCR Master Mix on the ABI 7300 (Applied Biosystems, Warrington, UK). The amplification reaction procedure was as follows: an initial denaturation at 95°C for 2 min, followed by 95°C for 15 s and 60°C for 1 min for 40 cycles. GAPDH was applied as internal control, and the relative expression level of the gene was calculated by the relative quantification (2−ΔΔCT) method. ΔCT was calculated by subtracting the average GAPDH CT from the average CT of the gene of interest.
Gene Ontology and Pathway Analysis
The “clusterProfiler” package was recruited to perform the functional annotation of all significantly differentially expressed genes (DEGs), and gene ontology (GO) enrichment analysis including cellular component, molecular function, and biological processes was performed. In organisms, different genes coordinate with each other to exercise their biological functions. Pathway-based analysis was performed to further understand the biological functions of genes. The most important biochemical metabolic pathway and signal transduction pathway involved in genes was determined by significant enrichment of Pathways. The Kyoto Encyclopedia of Genes and Genomes (KEGG) Pathway was the main database for Pathway significance enrichment analysis.
Statistical Analysis
Statistical analysis was performed with SPSS software, version19.0 for Windows (SPSS Inc., Chicago, IL, USA). Distribution of the data was checked for normality using the Kolmogorov–Smirnov test. Non-parametric continuous variables were compared using the Mann–Whitney U-test. Normally distributed continuous variables were presented as the mean and standard deviations and were compared using the Student’s t-test. Qualitative variables were given as the number and percentage and were compared with the χ2-test. The corresponding two-sided P value lower than 0.05 was considered statistically significant.
Results
DNA Copy Number Alterations in Stage II CRC
Thirteen gains and 18 losses were frequently detected (frequency >20%) by Array-CGH in 10 samples of Stage II CRC. The most common gains were detected at 7q11.21-q11.22 (30%), 8p11.21 (30%), 8p12-p11.23 (30%), 8q11.1-q11.22 (30%), 13q12.13-q12.2 (30%), and 20q11.21-q11.23 (30%), and the most frequent losses were found at 17p13.1-p12 (60%), 8p23.2 (40%), and 118q11.2-q23 (40%, Table 2 and Figure 1). Four high-level amplifications were discovered at 8p11.23-p11.22, 18q21.1, 19q11-q12, and 20q11.21-q13.32 and homozygous deletions were seen at 20p12.1 in Stage II CRC (Table 3). Among these 10 cases, less than 40 genetic alterations were confirmed in five Stage II CRC cases (50%) and 40–84 DNA copy number changes were revealed in four cases (40%). The number of DNA copy changes was not different between the patients with PNI and without PNI (P = 0.294).
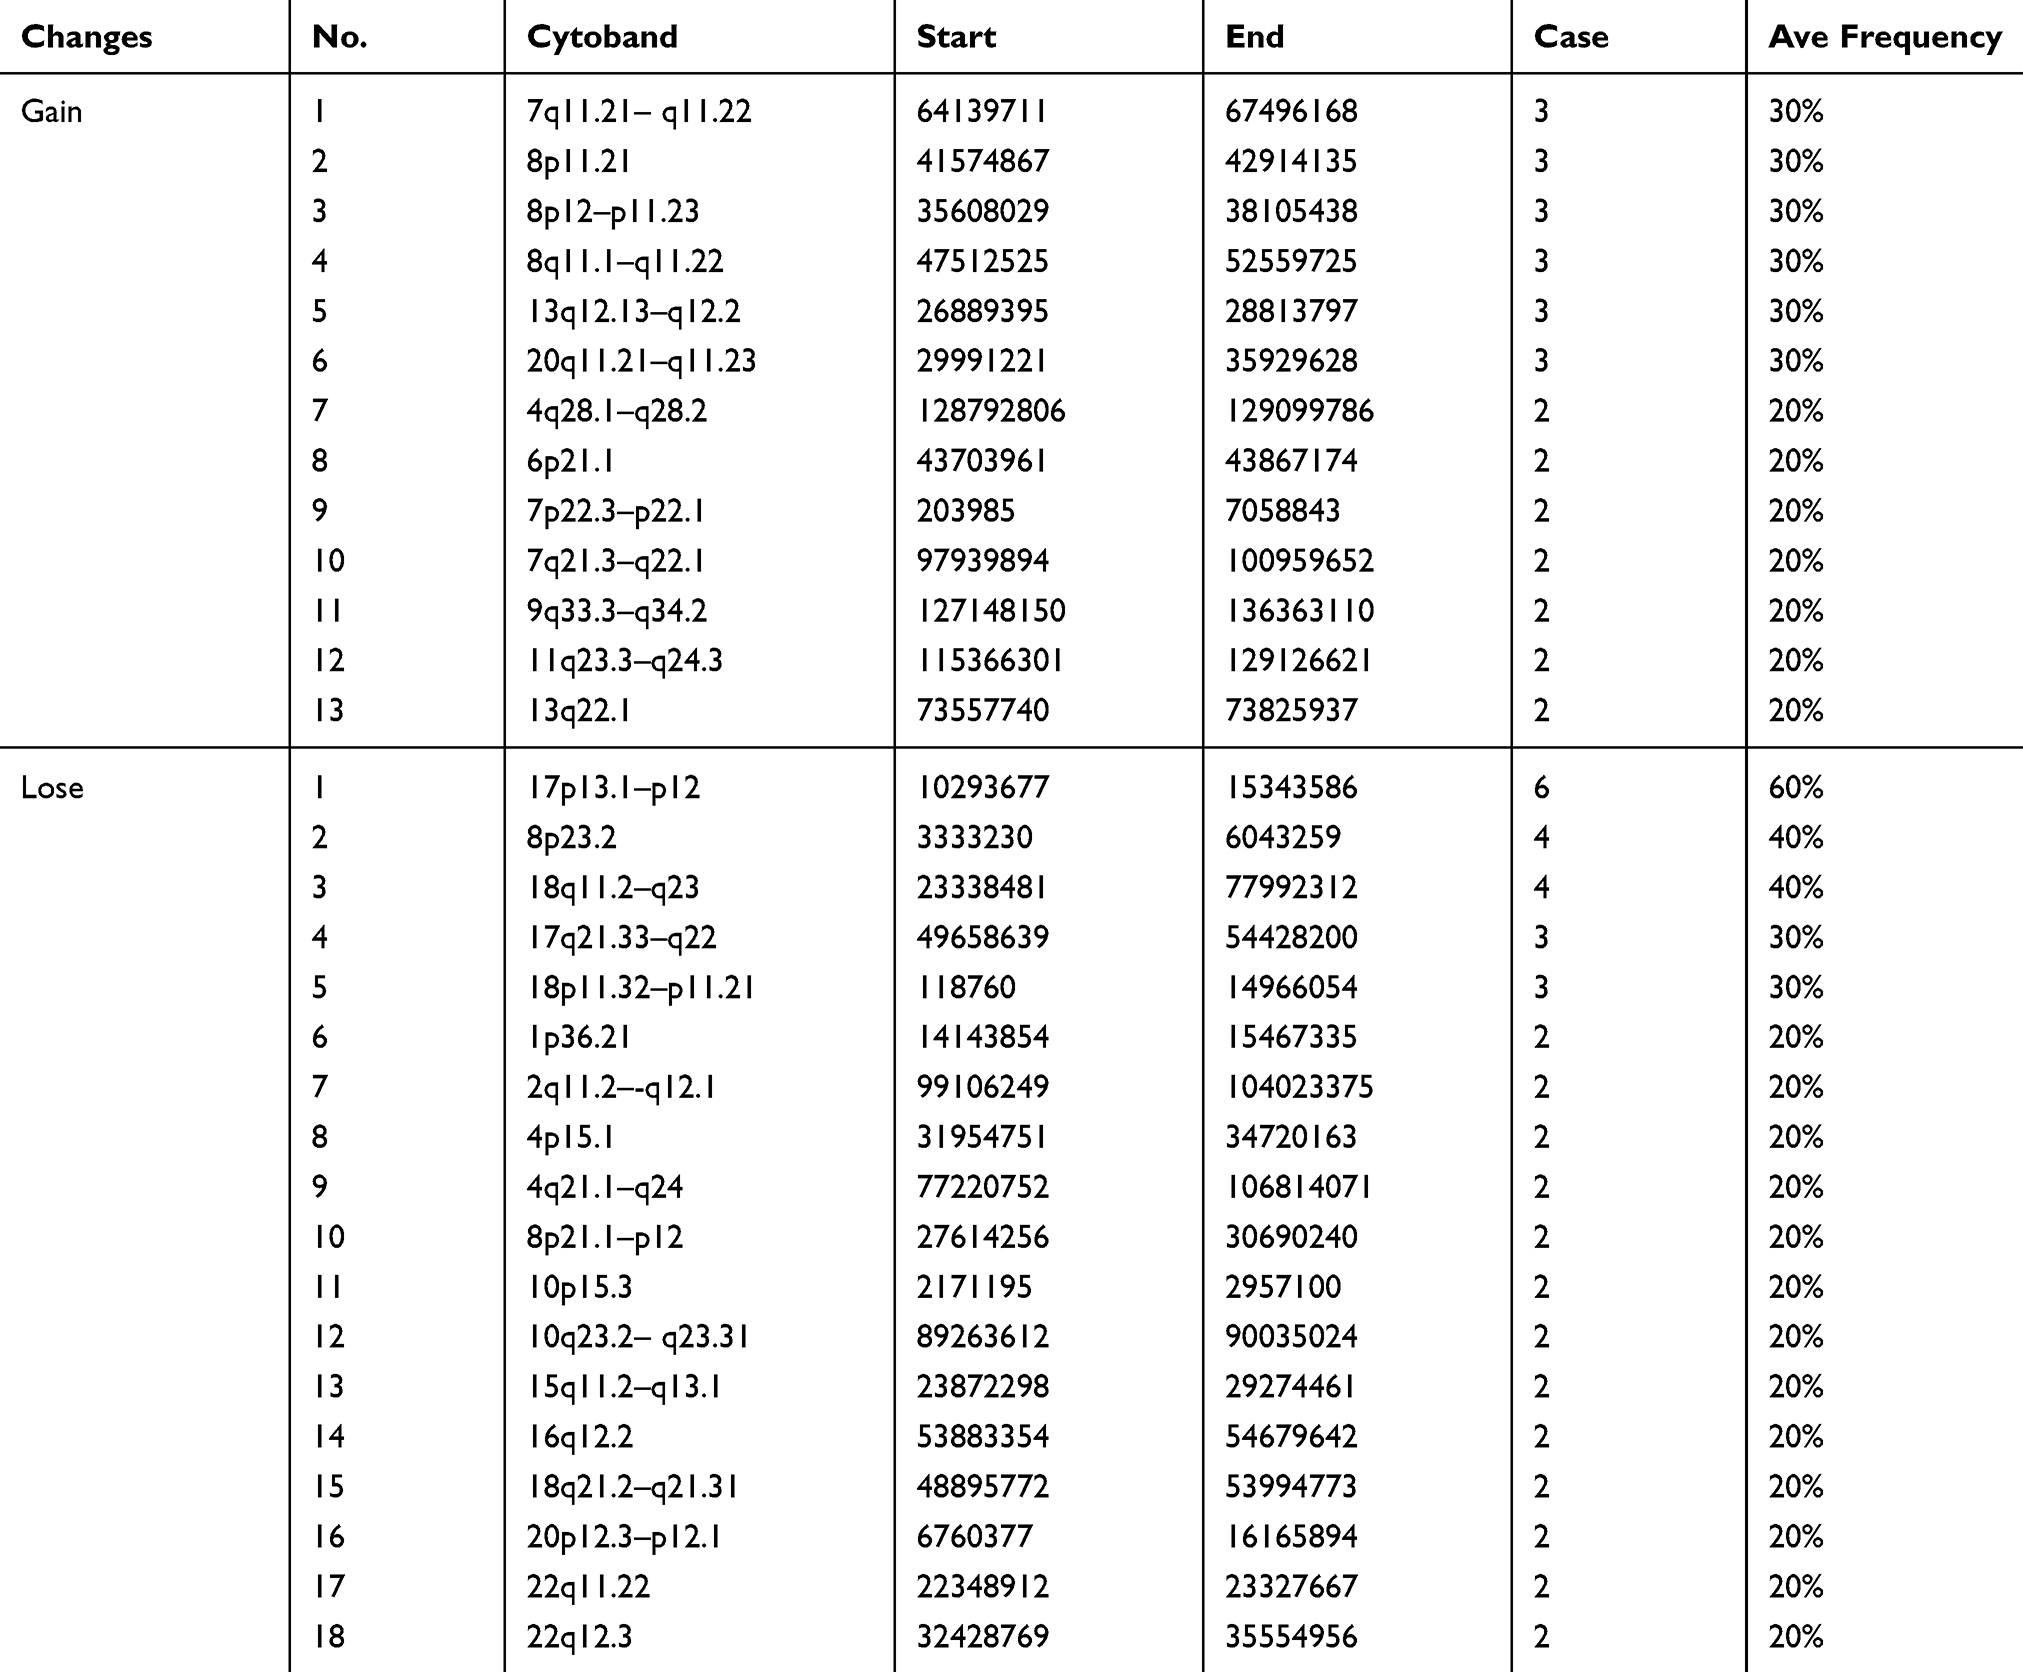 |
Table 2 Genomic Gains and Losses in Stage II CRC |
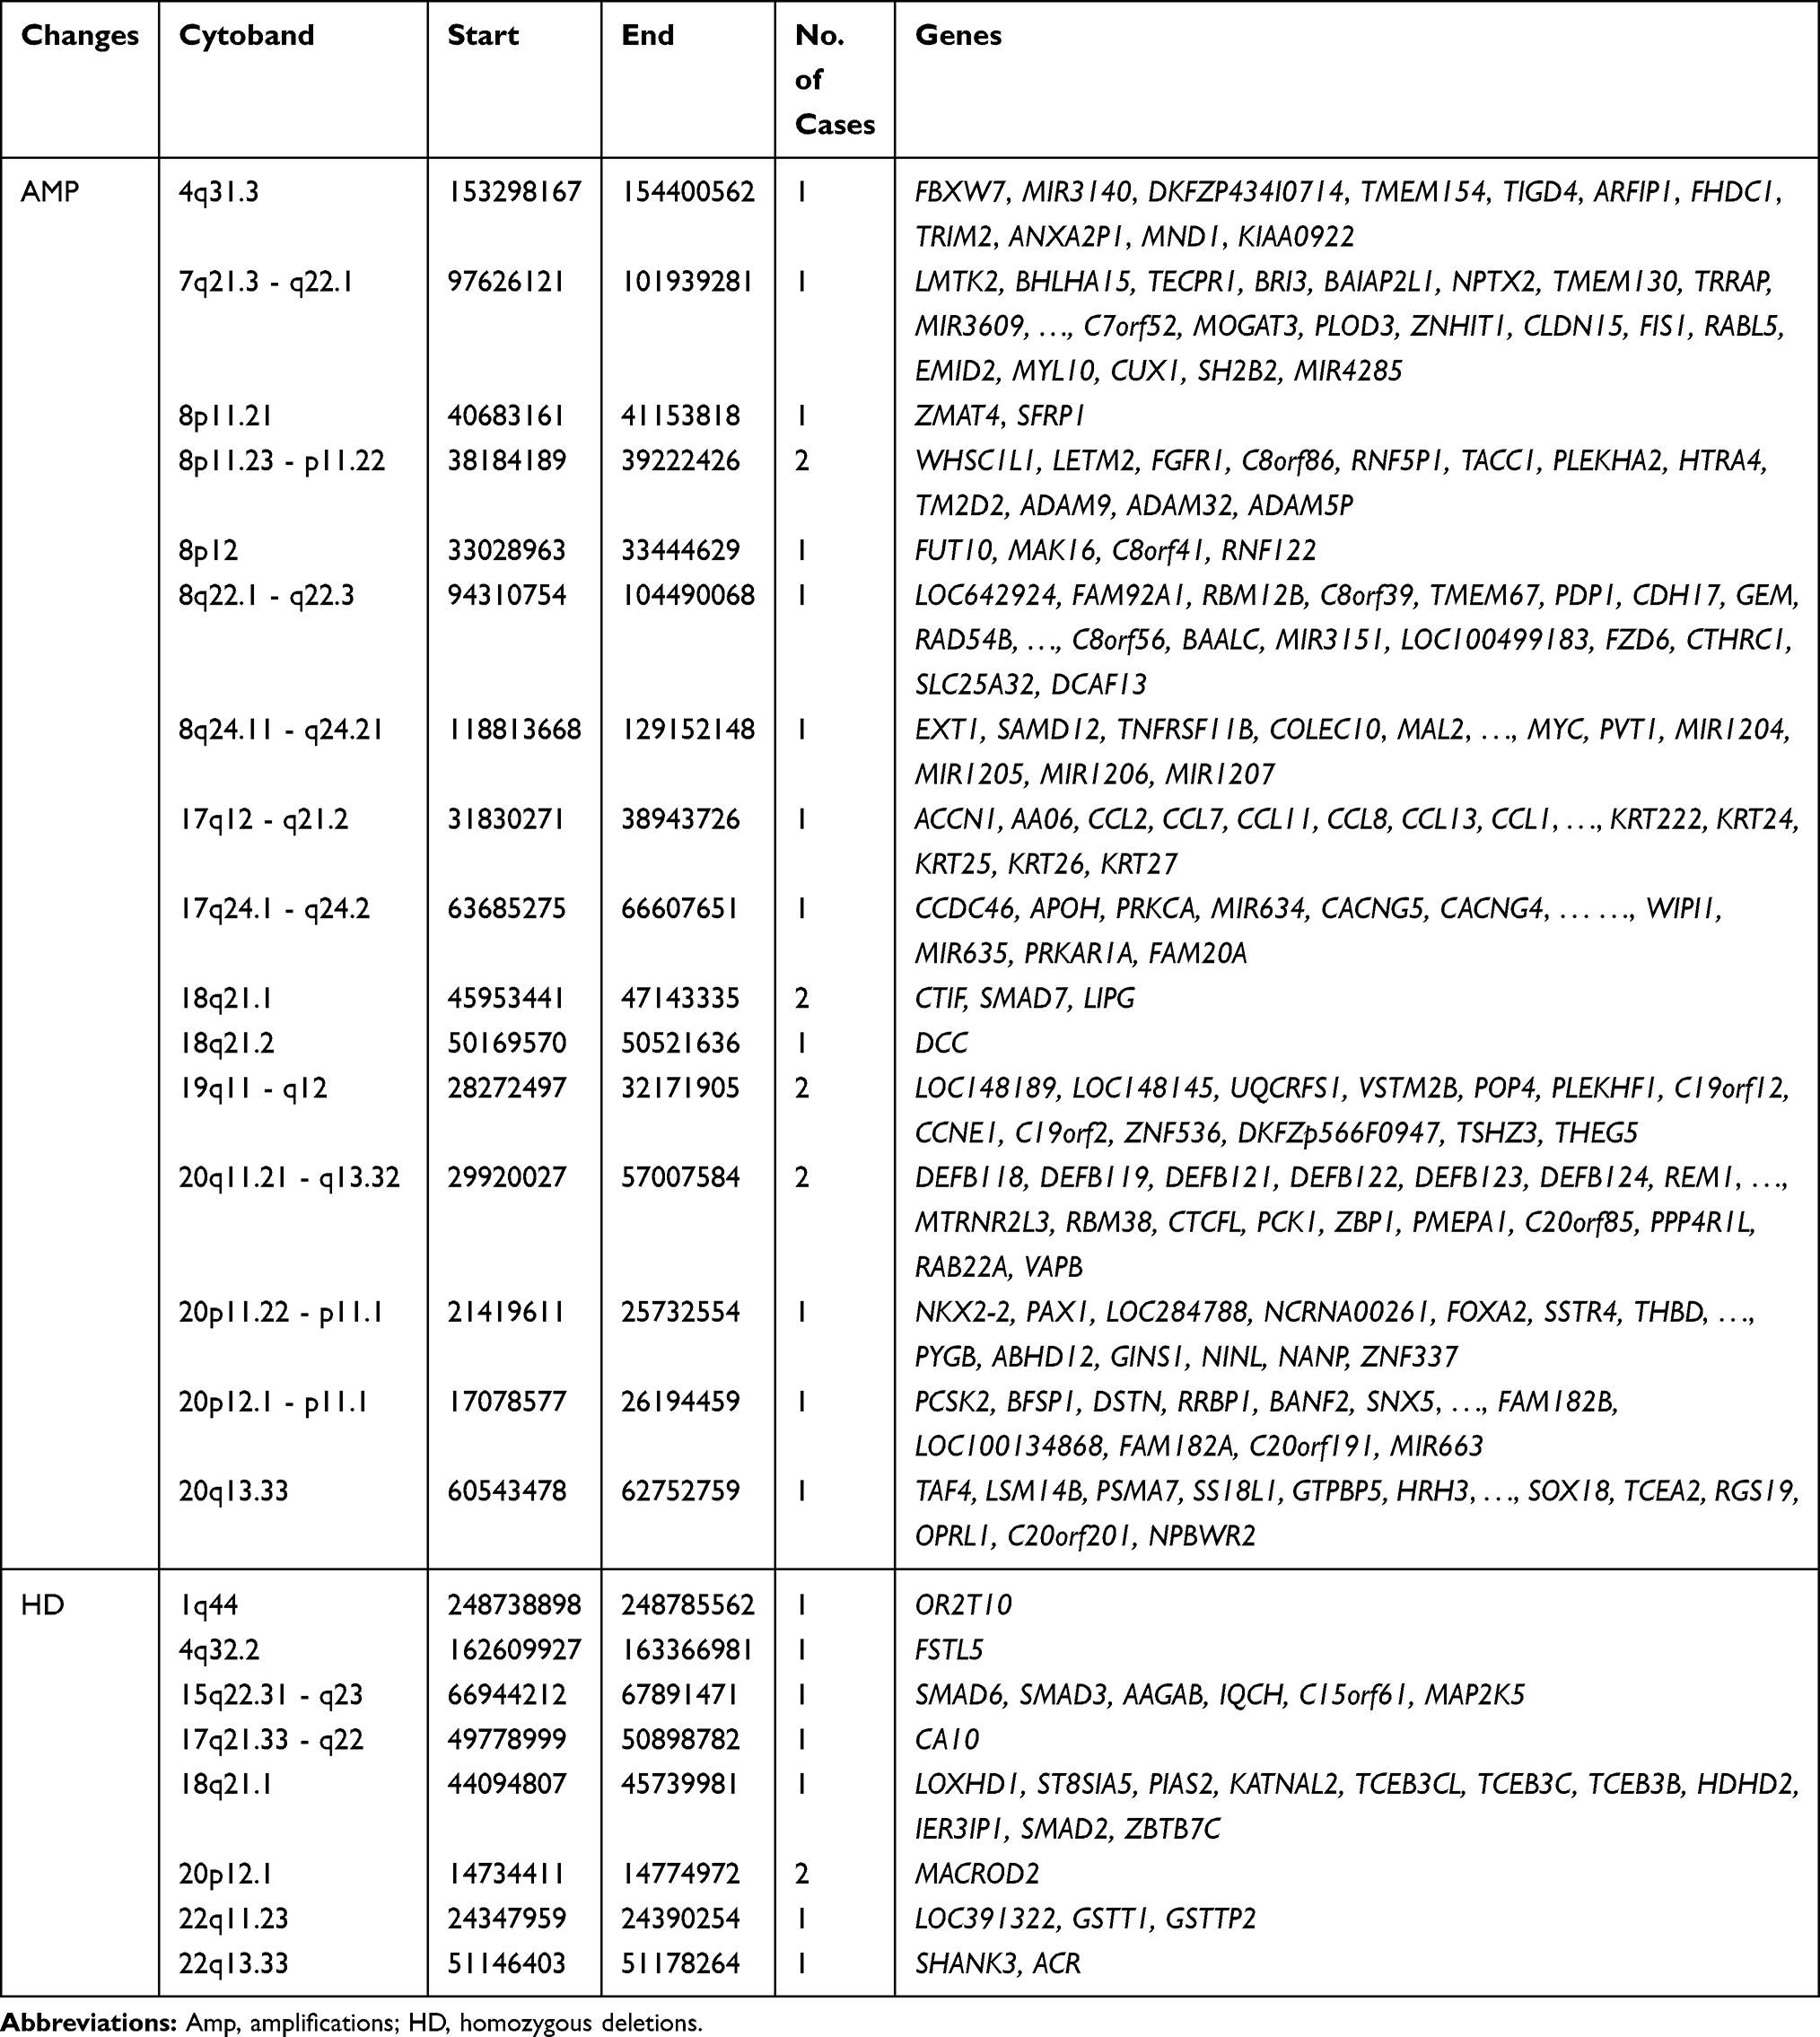 |
Table 3 High-Level Amplifications and Homozygous Deletions in Stage II CRC |
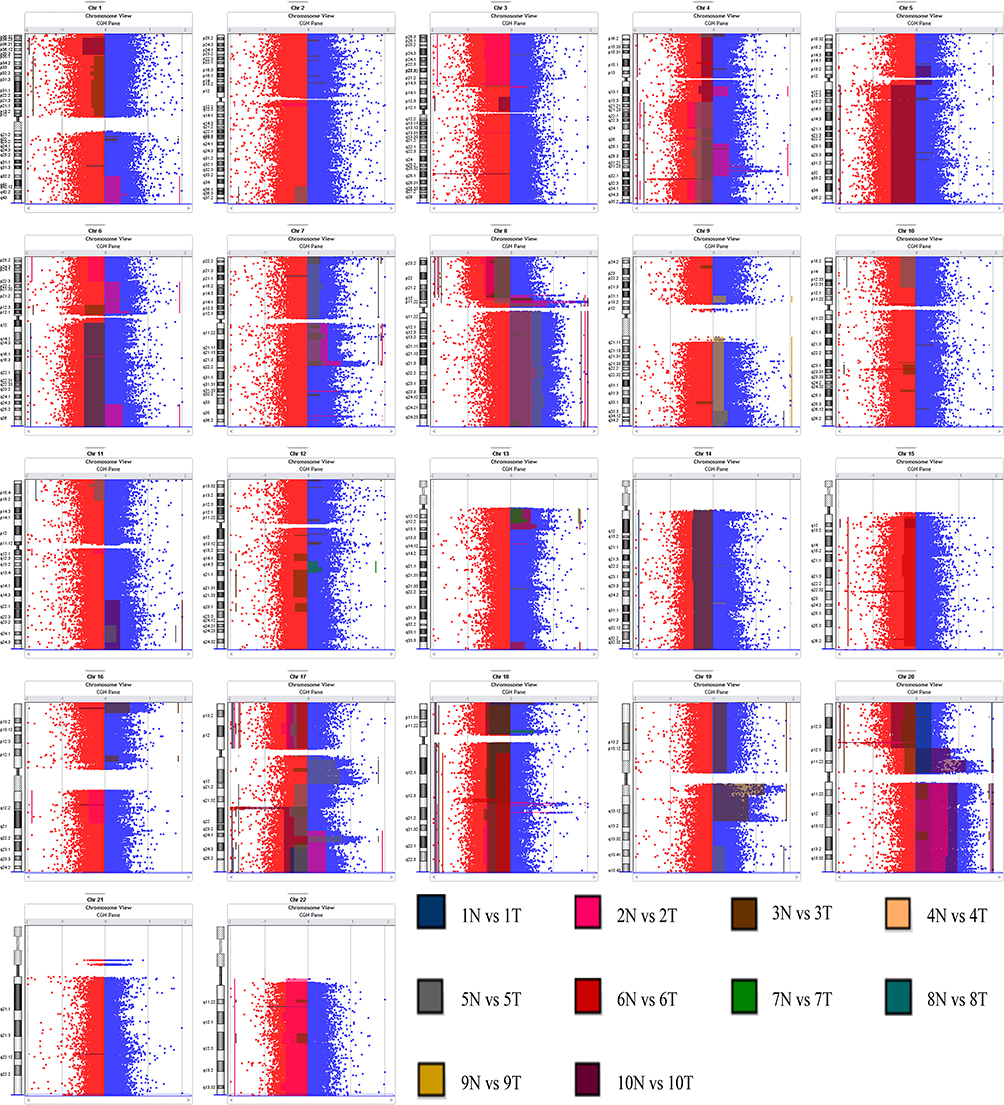 |
Figure 1 Signal values and differential fragment distribution maps. |
Genomic Changes Associated with PNI in Stage II CRC
The genetic alterations linked with PNI status detected by Array-CGH were analyzed by using the frequency plot comparison and significance analysis of microarrays (SAM) methods. Gains at 7q11.21-q22.1, 16p11.2, 17q23.3-q25.3, 19p13.3-p12, and 20p13-p11.1, and losses at 11q11-q12.1, 11p15.5-p15.1, 18p11.21, and 18q21.1-q23 were found more commonly in the PNI group by using frequency plot comparison together with detailed genomic analysis. It is also observed that gains at 8q11.1-q24.3, 9q13-q34.3, and 13q12.3-q13.1, and losses at 8p23.3-p12, 17p13.3-p11.2, and 21q22.12 occurred more frequently in the NPNI group (Figure 2).
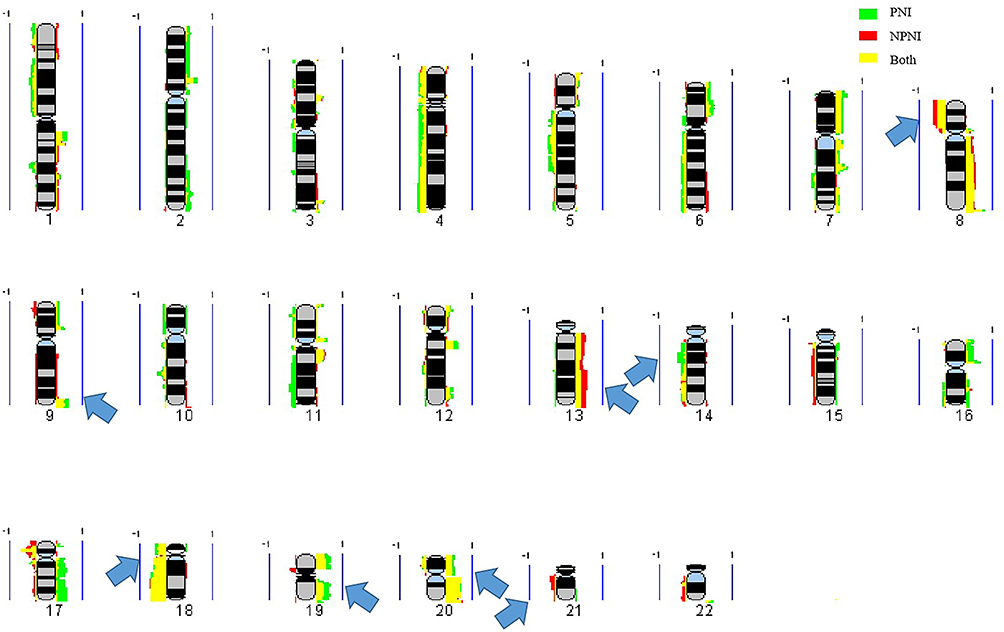 |
Figure 2 Frequency plot comparison. |
We further selected the candidate genes FLT1 (13q12.3), FBXW7 (4q31.3), MAPK3 (16p11.2), FGFR1 (8p11.23), TP53 (17p13.1), SLC20A2 (8p11.21), MACROD2 (20p12.1) and SERPINI1 (3q26.1) for validation by real-time PCR. Primers sequences are listed in Table 4.The results showed that the expression of FLT1 (P < 0.01), FBXW7 (P < 0.001), FGFR1 (P < 0.05), SLC20A2 (P < 0.001) and SERPINI1 (P < 0.001) was significantly up-regulated in the NPNI group compared to the PNI group (Figure 3), which was consistent with Array-CGH analysis.
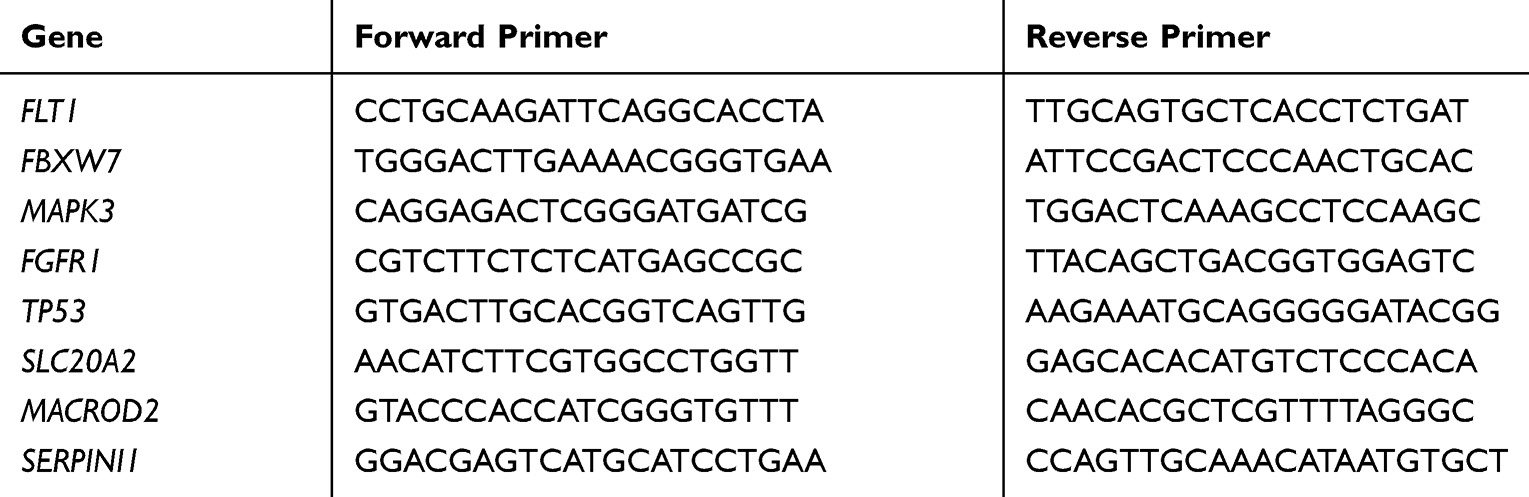 |
Table 4 The Primers Used for Real-Time PCR with Their Sequence |
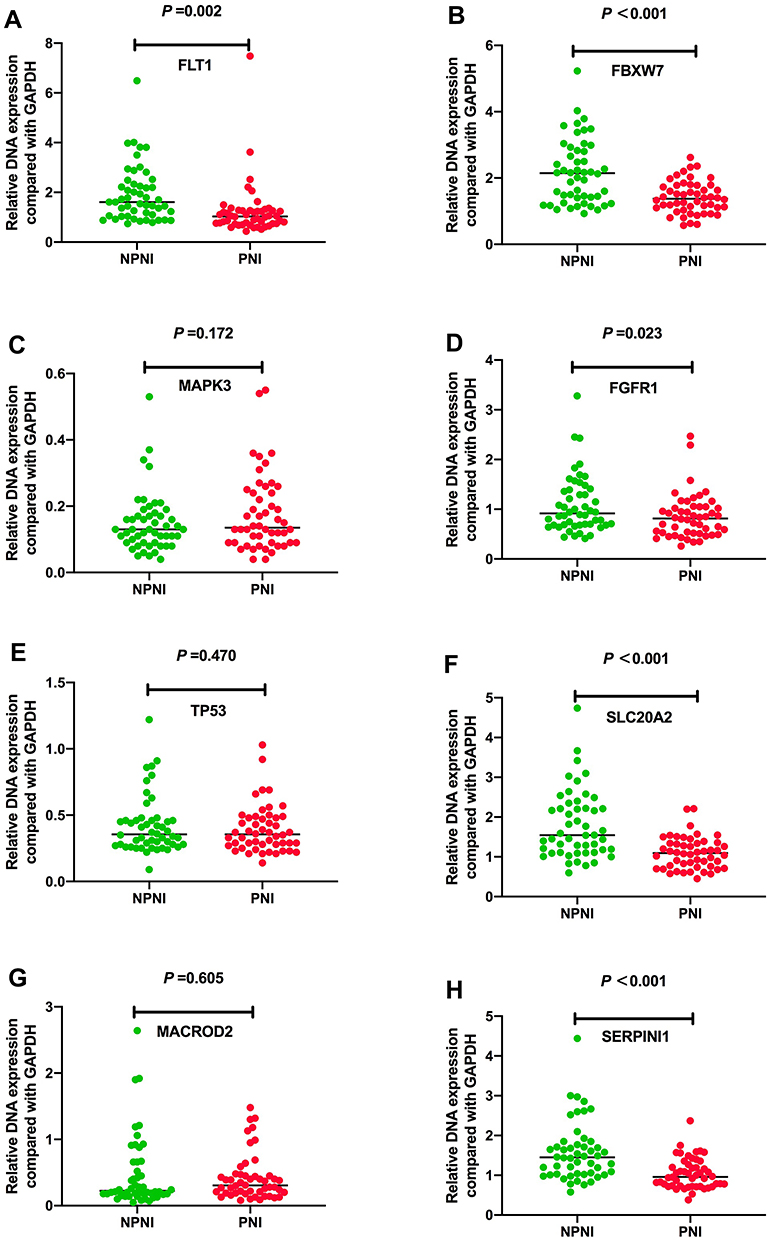 |
Figure 3 Real-time PCR validation of candidate genes in the two groups. (A) Expression level of FLT1 gene (P = 0.002), (B) expression level of FBXW7 gene (P < 0.001), (C) expression level of MAPK3 gene (P = 0.172), (D) expression level of FGFR1 gene (P = 0.023), (E) expression level of TP53 gene (P = 0.470), (F) expression level of SLC20A2 gene (P < 0.001), (G) expression level of MACROD2 gene (P = 0.605), and (H) expression level of SERPINI1 gene (P < 0.001). |
GO and Pathways Enrichment
In order to determine the most likely biological effects of these genes, we performed GO analysis for these CGH data. GO analysis revealed that genes changed in stage II CRC belonged to the classes of genes that participated in the following biological processes: organic substance biosynthesis, regulation of metabolic processes, molecular functions, regulation of macromolecule biosynthesis, binding biosynthetic process, regulation of macromolecule metabolic processes and metabolic processes (Figure 4). We analyzed the genes of each of the two groups and found that the genes related to PNI mainly participated in DNA binding, olfactory receptor activity, sensory perception of smell, and biological processes. Meanwhile, the genes related to NPNI mainly belonged to homophilic cell adhesion via plasma membrane adhesion molecules, flavonoid glucuronidation, flavonoid biosynthetic processes and cellular glucuronidation (Figure 5).
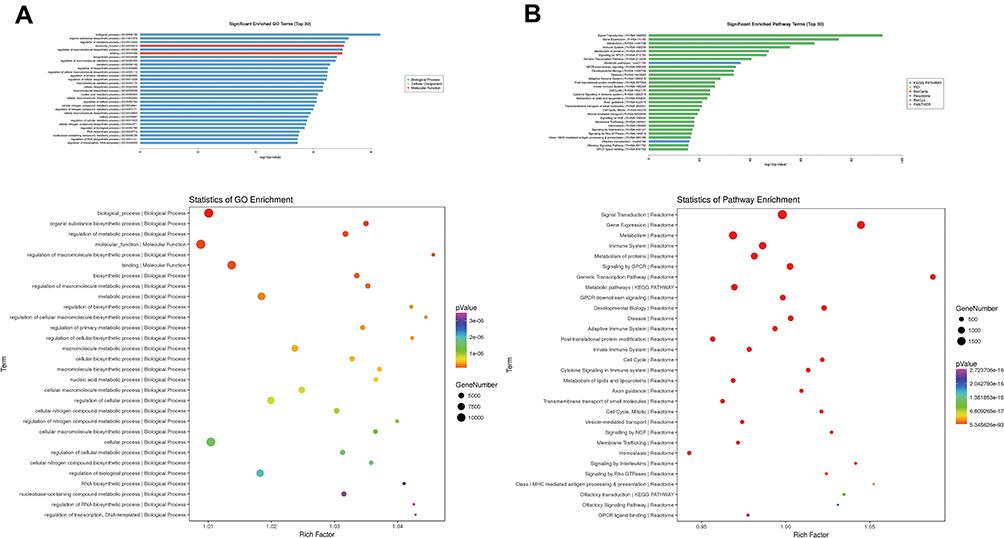 |
Figure 4 Data of the GO and pathways enriched in Stage II CRC. |
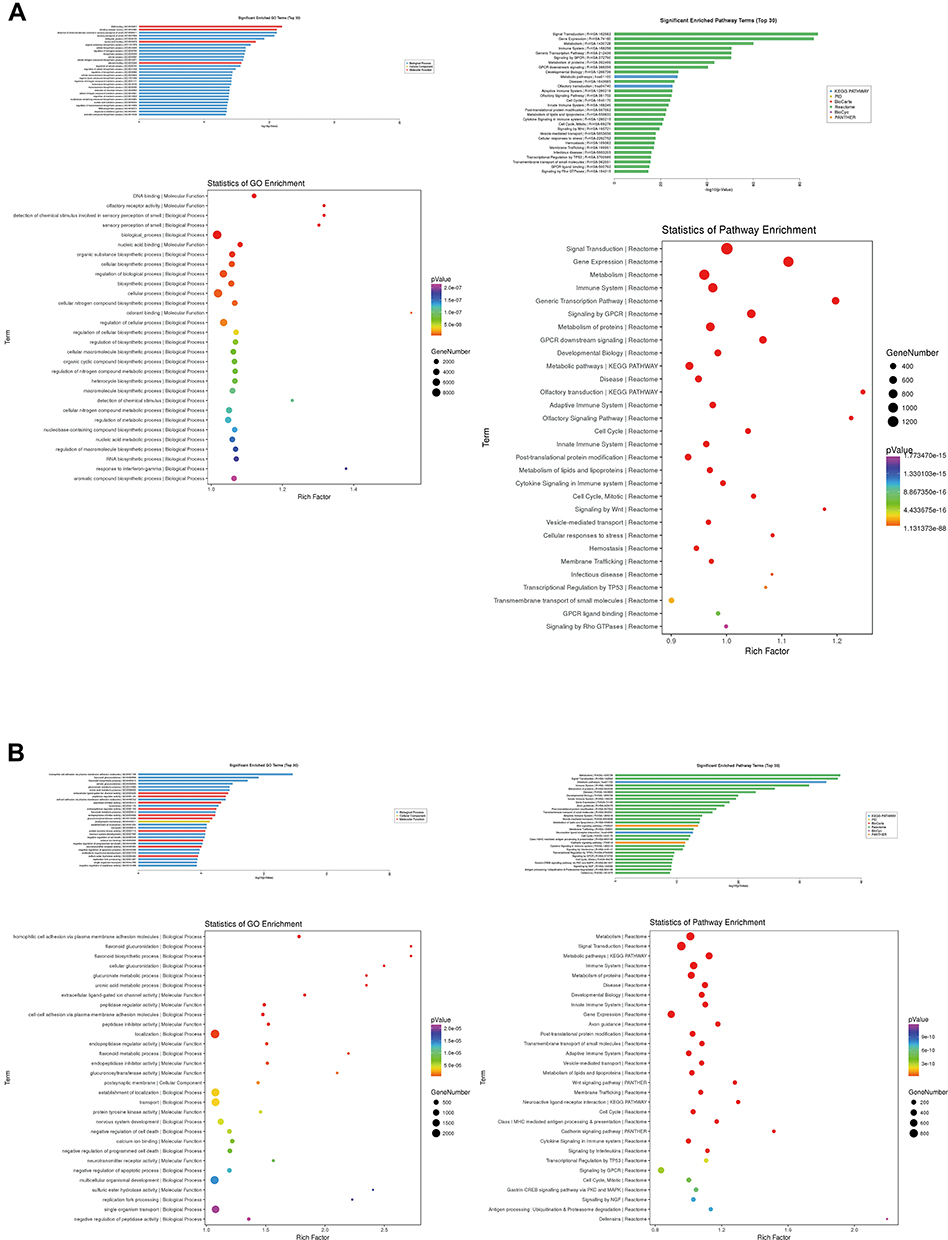 |
Figure 5 GO and pathways enriched in the two groups. |
The related genes were annotated and enriched by pathway analysis, and it was found that the genes changed in stage II CRC were mainly involved in the following pathways: signal transduction, gene expression, metabolism, immune system, metabolism of proteins, signaling by GPCR, generic transcription pathway, metabolic pathways, GPCR downstream signaling, and other basic metabolic processes. The KEGG pathway analysis revealed that these genes were mainly represented in metabolic pathways (Figure 4). We also analyzed the pathways in each of the two groups (Figure 5).
Discussion
PNI was first described in a primary head and neck tumor in 1862 by Neumann and referred to as tumor invasion of nervous structures and spread along nerve sheaths.17 With the development in the microanatomy of the peripheral cutaneous nerve, the definition of PNI has continued to change.12,18 There are many different definitions of PNI used and there is still no agreement on a clear definition of PNI-positive. However, the broadest definition of PNI widely used in the literature and also used in our study is that tumor cells should surround >33% of the nerve circumference without invading through the nerve sheath, as well as tumor cells within any of the three layers of the nerve sheath.19 The incidence of PNI is reported to be 14–32% in CRC, which is much lower than pancreatic cancer (98%), cholangiocarcinomas (75–85%), prostate (75%), and gastric cancer (60%).20 However, numerous reports have confirmed and quantified the strong negative prognostic impact for recurrence and survival in CRC when PNI is noted.8
Due to the controversy regarding the issue of adjuvant therapy in stage II CRC patients, the prognostic significance of PNI in stage II CRC appears to be particularly important in clinical practice.18 Pathological features such as PNI, perforation, serosal extension, low tumor differentiation, low number of examined lymph nodes, venous or lymphatic invasion have been associated with a poor prognosis; thus, these patients may derive a potentially greater benefit from adjuvant chemotherapy.21 Although it has been reported that stage II CRC patients with PNI who received chemotherapy had a significantly improved survival rate compared to those who did not, the target genes and molecular mechanisms underlying the association between PNI and stage II CRC still remain unclear.22
Using CGH, many studies investigated the genetic alterations in CRC and identified some chromosome regions and genes correlated with the carcinogenesis and tumor progression. It is known that the genomic changes of the adenoma–carcinoma sequence include the activation of K-Ras and the inactivation of at least three tumor suppression genes, namely, loss of APC (chromosome region 5q21), loss of p53 (chromosome region 17p13), and loss of heterozygosity for the long arm of chromosome 18 (18q LOH).23 Interestingly, losses at 8p, 17p, 18p, and 18q and gains at 8q and 20q were reported to be observed in patients with CRC. Multiple high-level amplifications at 20q were also seen centering at 32.3, 37.8, 45.4, 54.7, 59.4, and 65 Mb.16 Our study has revealed genetic gains at 7q11.21-q11.22, 8p11.21, 8p12-p11.23, 8q11.1-q11.22, 13q12.13-q12.2, and 20q11.21-q11.23, and losses at 17p13.1-p12, 8p23.2, and 118q11.2-q23 in Stage II CRC, some of which were consistent with the results of previous studies and some were special for Stage II.
In order to identify the genomic aberrations associated with PNI in Stage II CRC tissues, we used frequency plot comparison and SAM methods and found that gains at 7q11.21-q22.1, 16p11.2, 17q23.3-q25.3, 19p13.3-p12, and 20p13-p11.1, and losses at 11q11-q12.1, 11p15.5-p15.1, 18p11.21, and 18q21.1-q23 were more common in Stage II CRC patients with PNI. Meanwhile, gains at 8q11.1-q24.3, 9q13-q34.3, and 13q12.3-q13.1, and losses at 8p23.3-p12, 17p13.3-p11.2, and 21q22.12 were more frequent in Stage II CRC patients without PNI. In fact, some studies have found a correlation between genomic alterations and PNI in CRC. Kim et al confirmed that the gelsolin (GSN) gene at 9q33.2 was associated with PNI in CRC through the finding that the invasion potential was >2-fold greater in GSN-overexpressing LoVo cells than in control cells.24 It was also reported that patients with a low GSN expression had a significantly higher 5-year recurrence-free survival (RFS) rate than those with GSN overexpression (73.6% vs 64.7%, p=0.038), which suggested its potential value as a predictor of recurrence or as a therapeutic target in CRC patients. It is found that CRC with PNI patients showed an overexpression of the ITGAV gene at 2q31-q32 compared to CRC without PNI patients (p=0.028) and the expression of the corresponding ITGAV protein was also validated in that study (p=0.001).25 Oh et al revealed that there was a significant correlation between the high degree of PIWIL2 gene expression at chromosome 8 and PNI in CRC (p=0.027) and PIWIL2 may contribute to a poor prognosis in CRC.26 The loss of the expression of paracellular tight junctions, claudin-1, -4, and −-7 were demonstrated to be related with PNI, tumor invasion depth, stage of the disease, tumor grade, lymphovascular invasion, and lymph node status in an investigative study.15
We further selected the candidate genes for validation by real-time PCR and relative genes have been reported in other diseases. FLT1 has been shown to play direct roles in biological and pathological events associated with cellular proliferation, transformation, migration, apoptosis, and vascularization.27 In our study, FLT1 was expressed at significantly greater levels in the NPNI group than the PNI group (P < 0.01). Reduced FBXW7 expression level and loss-of-function mutations have been found in a wide range of human cancers, and the overall point mutation frequency is 6% to 35% in human cancers with tissue specificity.28 Preceding studies disclosed that the low expression of FBXW7 was associated with lymph node metastasis and advanced TNM stage and acted as an independent prognostic indicator for poor outcome in patients with colorectal cancer.29 Our data further revealed that FBXW7 expression was negatively associated with the PNI (P < 0.001). Amplification of the FGFR1 gene is reported to be associated with worse clinical outcome compared with no FGFR1 amplification.30 But we found high FGFR1 expression was frequently observed in Stage II CRC patients without PNI (P < 0.05). Mutations in SLC20A2 are a major cause of primary familial brain calcification (PFBC),31 and our study also identified it was linked to Stage II CRC patients without PNI. SERPINI1 is suggested as an epithelial–mesenchymal transition-associated gene and reported to be related to hepatocellular carcinoma and CRC.32 Furtherly, the results of this study showed the amplification of SERPINI1 was more common in Stage II CRC patients without PNI (P < 0.001). Moreover, GO analysis confirmed that the genes related to PNI mainly participated in DNA binding and olfactory receptor activity while the genes related to NPNI mainly belonged to homophilic cell adhesion via plasma membrane adhesion molecules and flavonoid glucuronidation. The Reactome pathway analysis revealed that the genes related to PNI were mainly represented in the pathway of signal transduction, gene expression, and metabolism, suggesting that PNI may affect the prognosis of CRC through these processes and related target genes may belong to that pathway.
Conclusion
In conclusion, our data provide detailed genomic aberrations regarding PNI in Stage II CRC. Further studies are necessary to clarify the candidate target genes and to explore their implications in Stage II CRC.
Ethics Statements
The study was carried out in accordance with the Helsinki declaration and its later amendments and regarding the involvement of human subjects and the use of human tissues for research.
Acknowledgments
This research was supported by the Chinese Academy of Medical Sciences Initiative for Innovative Medicine under Grant CAMS-2017-I2M-4-002 and CAMS-2017-I2M-1-006; General Program of National Natural Science Foundation of China under Grant 81472562; and Postgraduate Innovation Fund Project of Peking Union Medical College in 2018 under Grant 2018-1002-02-26. The funders had no role in study design, data collection and analysis, decision to publish, or in the preparation of the manuscript.
Author Contributions
All authors made substantial contributions to conception and design, acquisition of data, or analysis and interpretation of data; took part in drafting the article or revising it critically for important intellectual content; agreed to submit to the current journal; gave final approval of the version to be published; and agree to be accountable for all aspects of the work.
Disclosure
The authors report no conflicts of interest in this work.
References
1. Bray F, Ferlay J, Soerjomataram I, et al. Global cancer statistics 2018: GLOBOCAN estimates of incidence and mortality worldwide for 36 cancers in 185 countries. CA Cancer J Clin. 2018;68(6):394–424.
2. Dienstmann R, Mason MJ, Sinicrope FA, et al. Prediction of overall survival in stage II and III colon cancer beyond TNM system: a retrospective, pooled biomarker study. Ann Oncol. 2017;28(5):1023–1031. doi:10.1093/annonc/mdx052
3. Bozkurt O, Firat ST, Dogan E, et al. The impact of lymphovascular invasion on recurrence-free survival in patients with high-risk stage II colorectal cancer treated with adjuvant therapy. Erciyes Med J. 2019;41(2):191–196.
4. Tsai HL, Huang CW, Chen CW, et al. Survival in resected stage II colorectal cancer is dependent on tumor depth, vascular invasion, postoperative CEA level, and the number of examined lymph nodes. World J Surg. 2016;40(4):1002–1009. doi:10.1007/s00268-015-3331-y
5. Eiro N, Carrión JF, Cid S, et al. Toll-like receptor 4 and matrix metalloproteases 11 and 13 as predictors of tumor recurrence and survival in stage II colorectal cancer. Pathol Oncol Res. 2019;25(4):1589–1597. doi:10.1007/s12253-019-00611-6
6. Nozawa H, Ishihara S, Kawai K, et al. A high preoperative carbohydrate antigen 19-9 level is a risk factor for recurrence in stage II colorectal cancer. Acta Oncol (Madr). 2017;56(5):634–638. doi:10.1080/0284186X.2016.1257866
7. Liu Y, He J, Xu J, et al. Neuroendocrine differentiation is predictive of poor survival in patients with stage II colorectal cancer. Oncol Lett. 2017;13(4):2230–2236. doi:10.3892/ol.2017.5681
8. Yang Y, Huang X, Sun J, et al. Prognostic value of perineural invasion in colorectal cancer: a meta-analysis. J Gastrointest Surg. 2015;19(6):1113–1122. doi:10.1007/s11605-015-2761-z
9. Jurcak N, Zheng L. Signaling in the microenvironment of pancreatic cancer: transmitting along the nerve. Pharmacol Ther. 2019;200:126–134.
10. Wang J, Wang H, Cai J, et al. Artemin regulates CXCR4 expression to induce migration and invasion in pancreatic cancer cells through activation of NF-κB signaling. Exp Cell Res. 2018;365(1):12–23. doi:10.1016/j.yexcr.2018.02.008
11. Jurcak NR, Rucki AA, Muth S, et al. Axon guidance molecules promote perineural invasion and metastasis of orthotopic pancreatic tumors in mice. Gastroenterology. 2019;157(3):838–850.e6. doi:10.1053/j.gastro.2019.05.065
12. Liebig C, Ayala G, Wilks JA, Berger DH, Albo D. Perineural invasion in cancer: a review of the literature. Cancer. 2009;115:3379–3391. doi:10.1002/cncr.24396
13. He X, Chen Z, Jia M, et al. Downregulated E-cadherin expression indicates worse prognosis in Asian patients with colorectal cancer: evidence from meta-analysis. PLoS One. 2013;8(7):e70858. doi:10.1371/journal.pone.0070858
14. Baba Y, Nosho K, Shima K, et al. Relationship of CDX2 loss with molecular features and prognosis in colorectal cancer. Clin Cancer Res. 2009;15(14):4665–4673. doi:10.1158/1078-0432.CCR-09-0401
15. Süren D, Yıldırım M, Kaya V, et al. Loss of tight junction proteins (Claudin 1, 4, and 7) correlates with aggressive behavior in colorectal carcinoma. Med Sci Monit. 2014;20:1255–1262. doi:10.12659/MSM.890598
16. Kentaro N, Mehta KR, Jane F, et al. High-resolution analysis of DNA copy number alterations in colorectal cancer by array-based comparative genomic hybridization. Carcinogenesis. 2004;25(8):1345–1357. doi:10.1093/carcin/bgh134
17. Neumann E. Secondare cancroid infiltration des nervus mentalis bei einem. Arch Pathol Anat. 1862;24:201. doi:10.1007/BF01929317
18. Huh JW, Kim HR, Kim YJ. Prognostic value of perineural invasion in patients with stage II colorectal cancer. Ann Surg Oncol. 2010;17(8):2066–2072. doi:10.1245/s10434-010-0982-7
19. Knijn N, Mogk SC, Teerenstra S, et al. Perineural invasion is a strong prognostic factor in colorectal cancer: a systematic review. Am J Surg Pathol. 2015;40(1):103. doi:10.1097/PAS.0000000000000518
20. Xu B, Yu L, Zhao L-Z, et al. Prognostic factors in the patients with T2N0M0 colorectal cancer. World J Surg Oncol. 2016;14(1):76. doi:10.1186/s12957-016-0826-4
21. Glimelius B, Tiret E, Cervantes A, et al. Rectal cancer: ESMO clinical practice guidelines for diagnosis, treatment and follow-up. Ann Oncol. 2013;24:81–88. doi:10.1093/annonc/mdt240
22. Mirkin KA, Hollenbeak CS, Mohamed A, et al. Impact of perineural invasion on survival in node negative colon cancer. Cancer Biol Ther. 2017;18(9):740–745. doi:10.1080/15384047.2017.1323602
23. Armaghany T, Wilson JD, Chu Q, et al. Genetic alterations in colorectal cancer. Gastrointest Cancer Res. 2012;5(1):19–27.
24. Kim JC, Ha YJ, Tak KH, et al. Opposite functions of GSN and OAS2 on colorectal cancer metastasis, mediating perineural and lymphovascular invasion, respectively. PLoS One. 2018;13(8):e0202856. doi:10.1371/journal.pone.0202856
25. Waisberg J, De Viana LS, Affonso RJ, et al. Overexpression of the ITGAV gene is associated with progression and spread of colorectal cancer. Anticancer Res. 2014;34(10):5599–5607.
26. Oh SJ, Kim SM, Kim YO, et al. Clinicopathologic Implications of PIWIL2 Expression in Colorectal Cancer. Korean J Pathol. 2012;46(4):318–323. doi:10.4132/KoreanJPathol.2012.46.4.318
27. Mohammad Rezaei F, Hashemzadeh S, Ravanbakhsh Gavgani R, et al. Dysregulated KDR and FLT1 gene expression in colorectal cancer patients. Rep Biochem Mol Biol. 2019;8(3):244–252.
28. Song Y, Zhou X, Bai W, et al. FBW7 increases drug sensitivity to cisplatin in human nasopharyngeal carcinoma by downregulating the expression of multidrug resistance-associated protein. Tumour Biol. 2015;36(6):4197–4202. doi:10.1007/s13277-015-3056-4
29. Liu H, Wang K, Fu H, et al. Low expression of the ubiquitin ligase FBXW7 correlates with poor prognosis of patients with colorectal cancer. Int J Clin Exp Pathol. 2018;11(1):413–419.
30. Bae JM, Wen X, Kim TS, et al. Fibroblast growth factor receptor 1 (FGFR1) amplification detected by droplet digital polymerase chain reaction (ddPCR) is a prognostic factor in colorectal cancers. Cancer Res Treat. 2020;52(1):74–84. doi:10.4143/crt.2019.062
31. Guo XX, Su HZ, Zou XH, et al. Identification of SLC20A2 deletions in patients with primary familial brain calcification. Clin Genet. 2019;96(1):53–60. doi:10.1111/cge.13540
32. Matsuda Y, Miura K, Yamane J, et al. SERPINI1 regulates epithelial-mesenchymal transition in an orthotopic implantation model of colorectal cancer. Cancer Sci. 2016;107(5):619–628. doi:10.1111/cas.12909
 © 2020 The Author(s). This work is published and licensed by Dove Medical Press Limited. The full terms of this license are available at https://www.dovepress.com/terms.php and incorporate the Creative Commons Attribution - Non Commercial (unported, v3.0) License.
By accessing the work you hereby accept the Terms. Non-commercial uses of the work are permitted without any further permission from Dove Medical Press Limited, provided the work is properly attributed. For permission for commercial use of this work, please see paragraphs 4.2 and 5 of our Terms.
© 2020 The Author(s). This work is published and licensed by Dove Medical Press Limited. The full terms of this license are available at https://www.dovepress.com/terms.php and incorporate the Creative Commons Attribution - Non Commercial (unported, v3.0) License.
By accessing the work you hereby accept the Terms. Non-commercial uses of the work are permitted without any further permission from Dove Medical Press Limited, provided the work is properly attributed. For permission for commercial use of this work, please see paragraphs 4.2 and 5 of our Terms.